


Power exchanges operate as digital marketplaces where electricity becomes a tradable commodity, matching thousands of buyers and sellers in milliseconds. Unlike traditional power procurement through bilateral contracts, exchanges enable real-time price discovery, optimize transmission networks, and facilitate the integration of renewable energy into India’s grid. This infrastructure, which is dominated by the Indian Energy Exchange (IEX) with over 90% market share, has become critical to India’s energy transition, processing billions of units of electricity annually through software-driven platforms that extract high-margin transaction fees from every kilowatt-hour traded.
The industry stands at a pivotal regulatory inflection point. The Central Electricity Regulatory Commission’s (CERC) market coupling directive represents the single largest structural change since exchanges were established, fundamentally altering competitive dynamics by centralizing price discovery across multiple platforms.
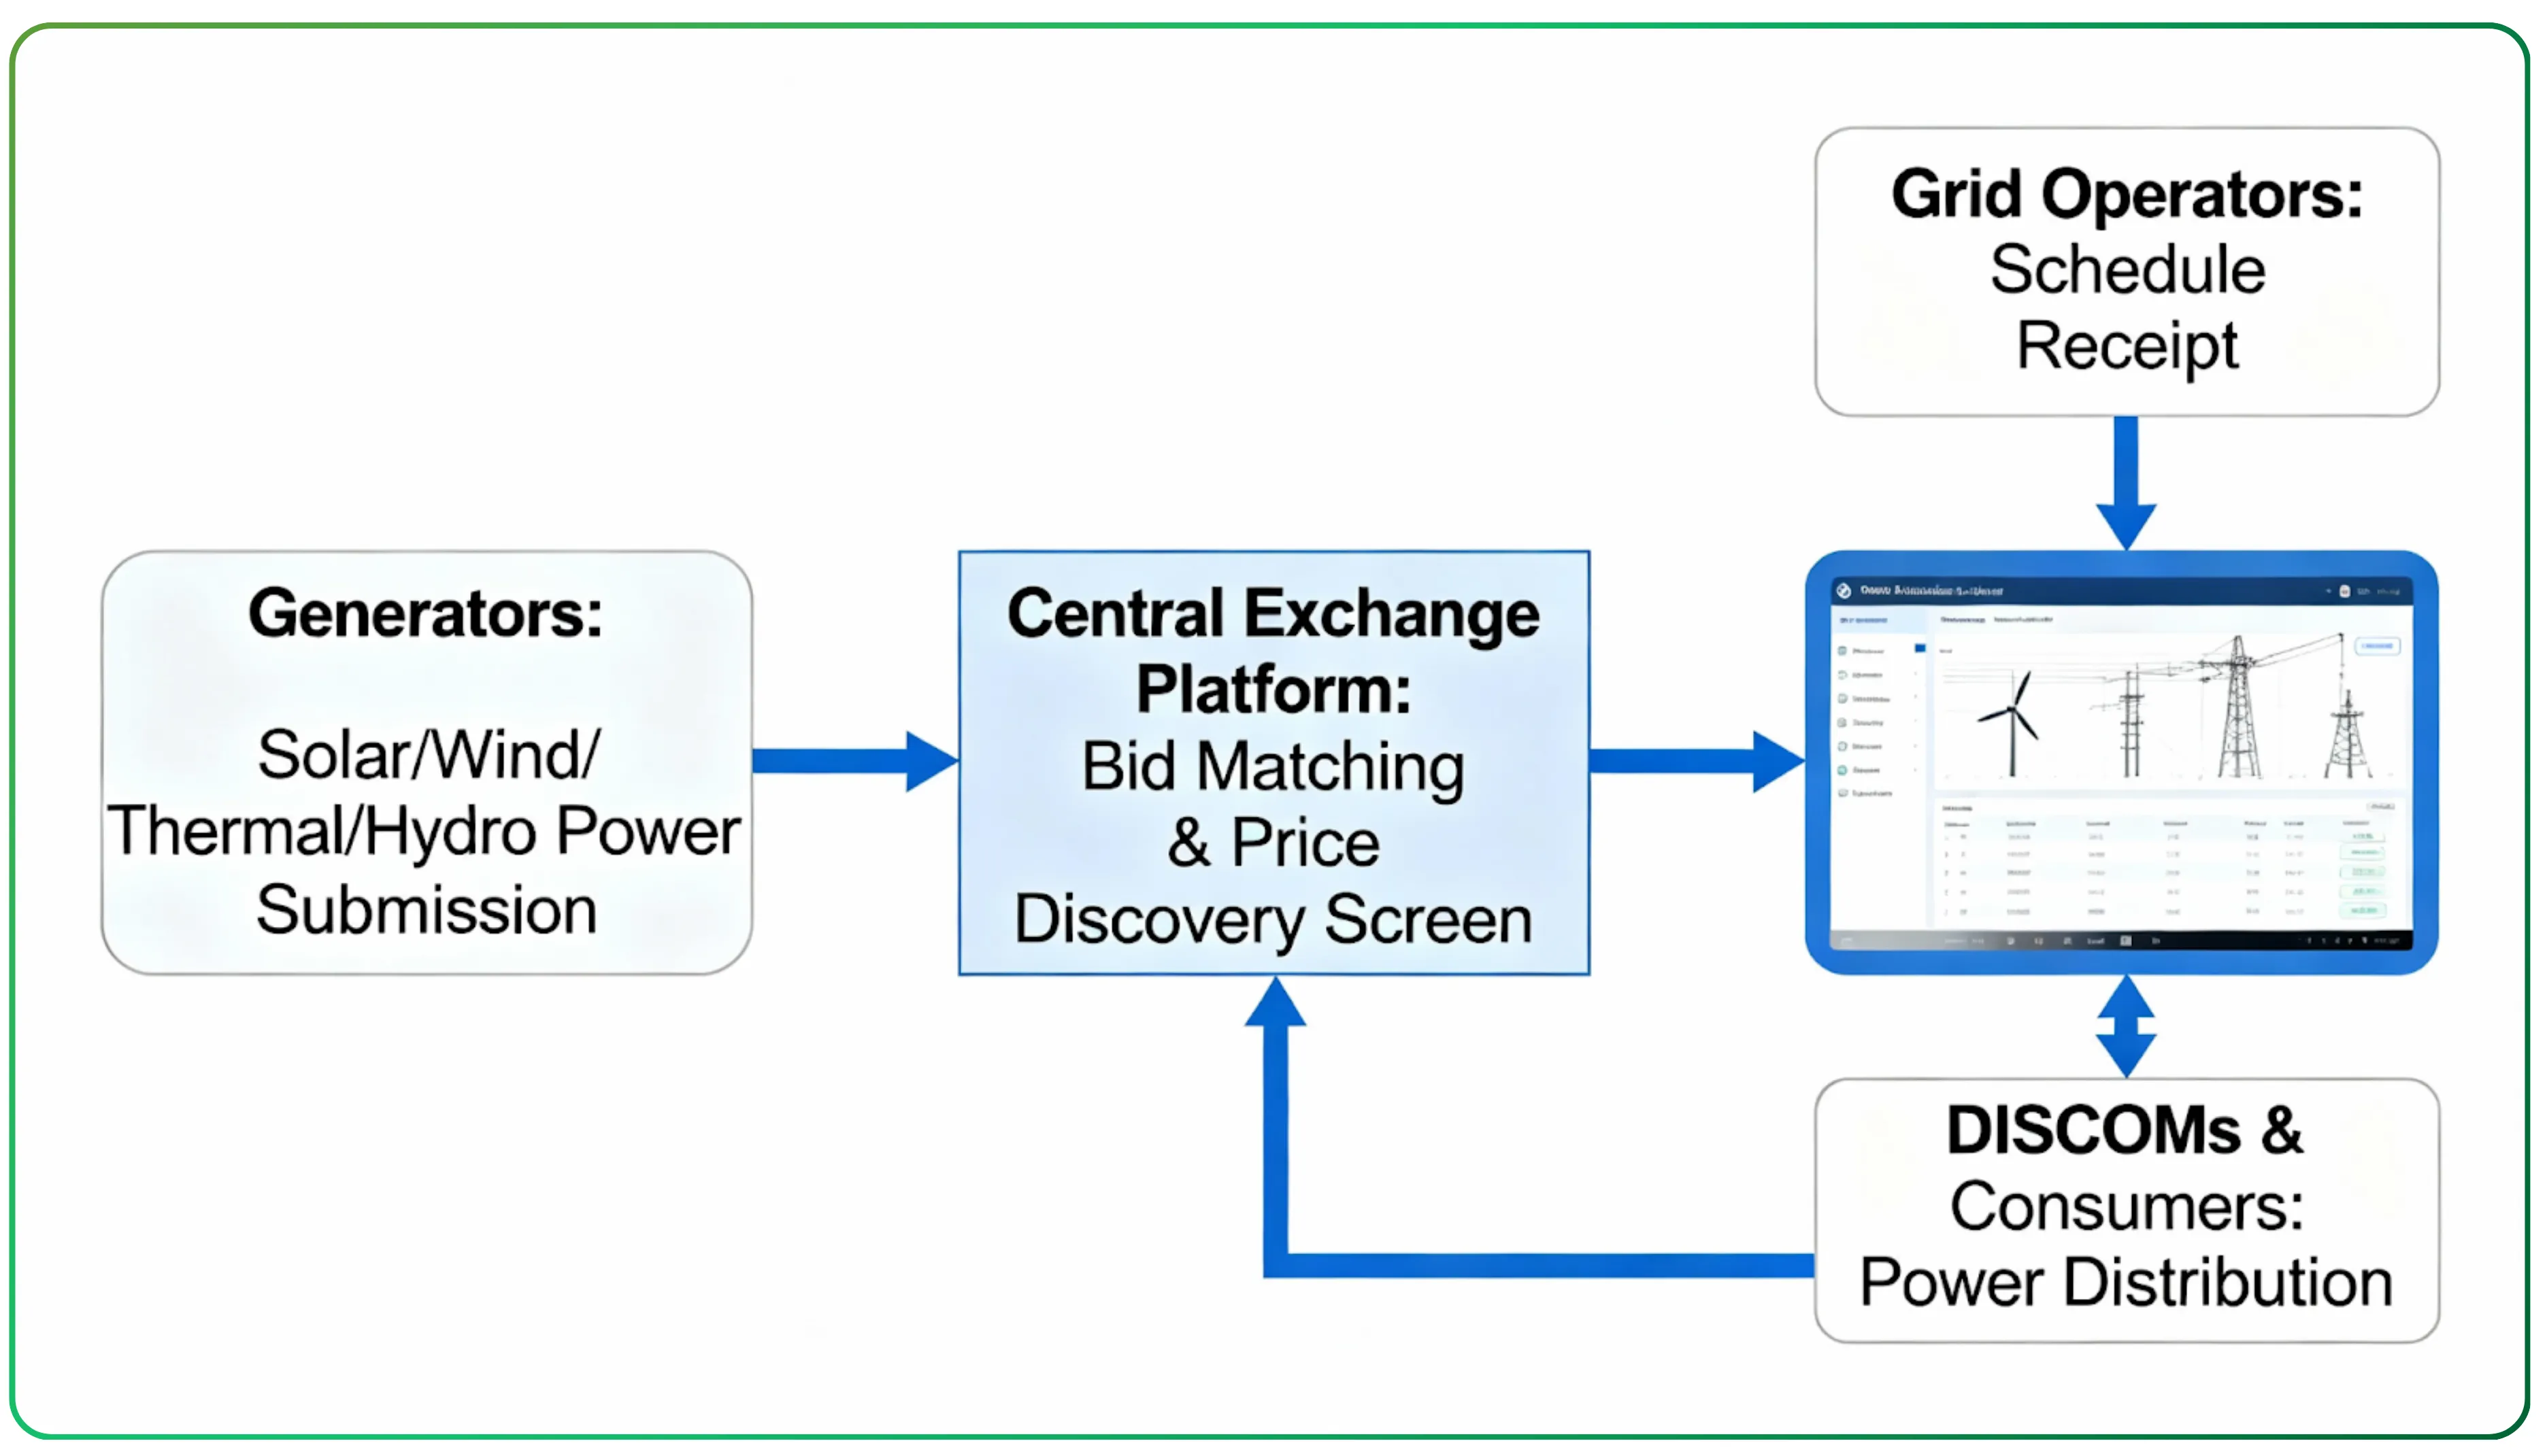
How power flows through exchanges: Generators and DISCOMs submit bids -> Exchanges match supply/demand -> Clearing price determined -> Schedules sent to grid operators -> Physical delivery and settlement.
Understanding the Business Model
Power exchanges generate revenue through four primary streams, each with distinct economics and regulatory constraints.
1. Transaction Fees on Electricity Trades
This represents the largest revenue contributor as exchanges charge per-unit fees (measured in paise per kilowatt-hour or megawatt-hour) on every trade executed. CERC has historically capped these fees at approximately 2 paise per unit, creating a regulatory ceiling that constrains pricing power but protects profitability for incumbents who can leverage scale.
The unit economics are exceptionally attractive: heavy fixed costs in platform development, surveillance systems, and regulatory compliance, but near-zero marginal cost per trade. This creates massive operating leverage, IEX’s public fillings consistently show operating margins materially above typical utility or commodity businesses, with strong profit-after-tax conversion.
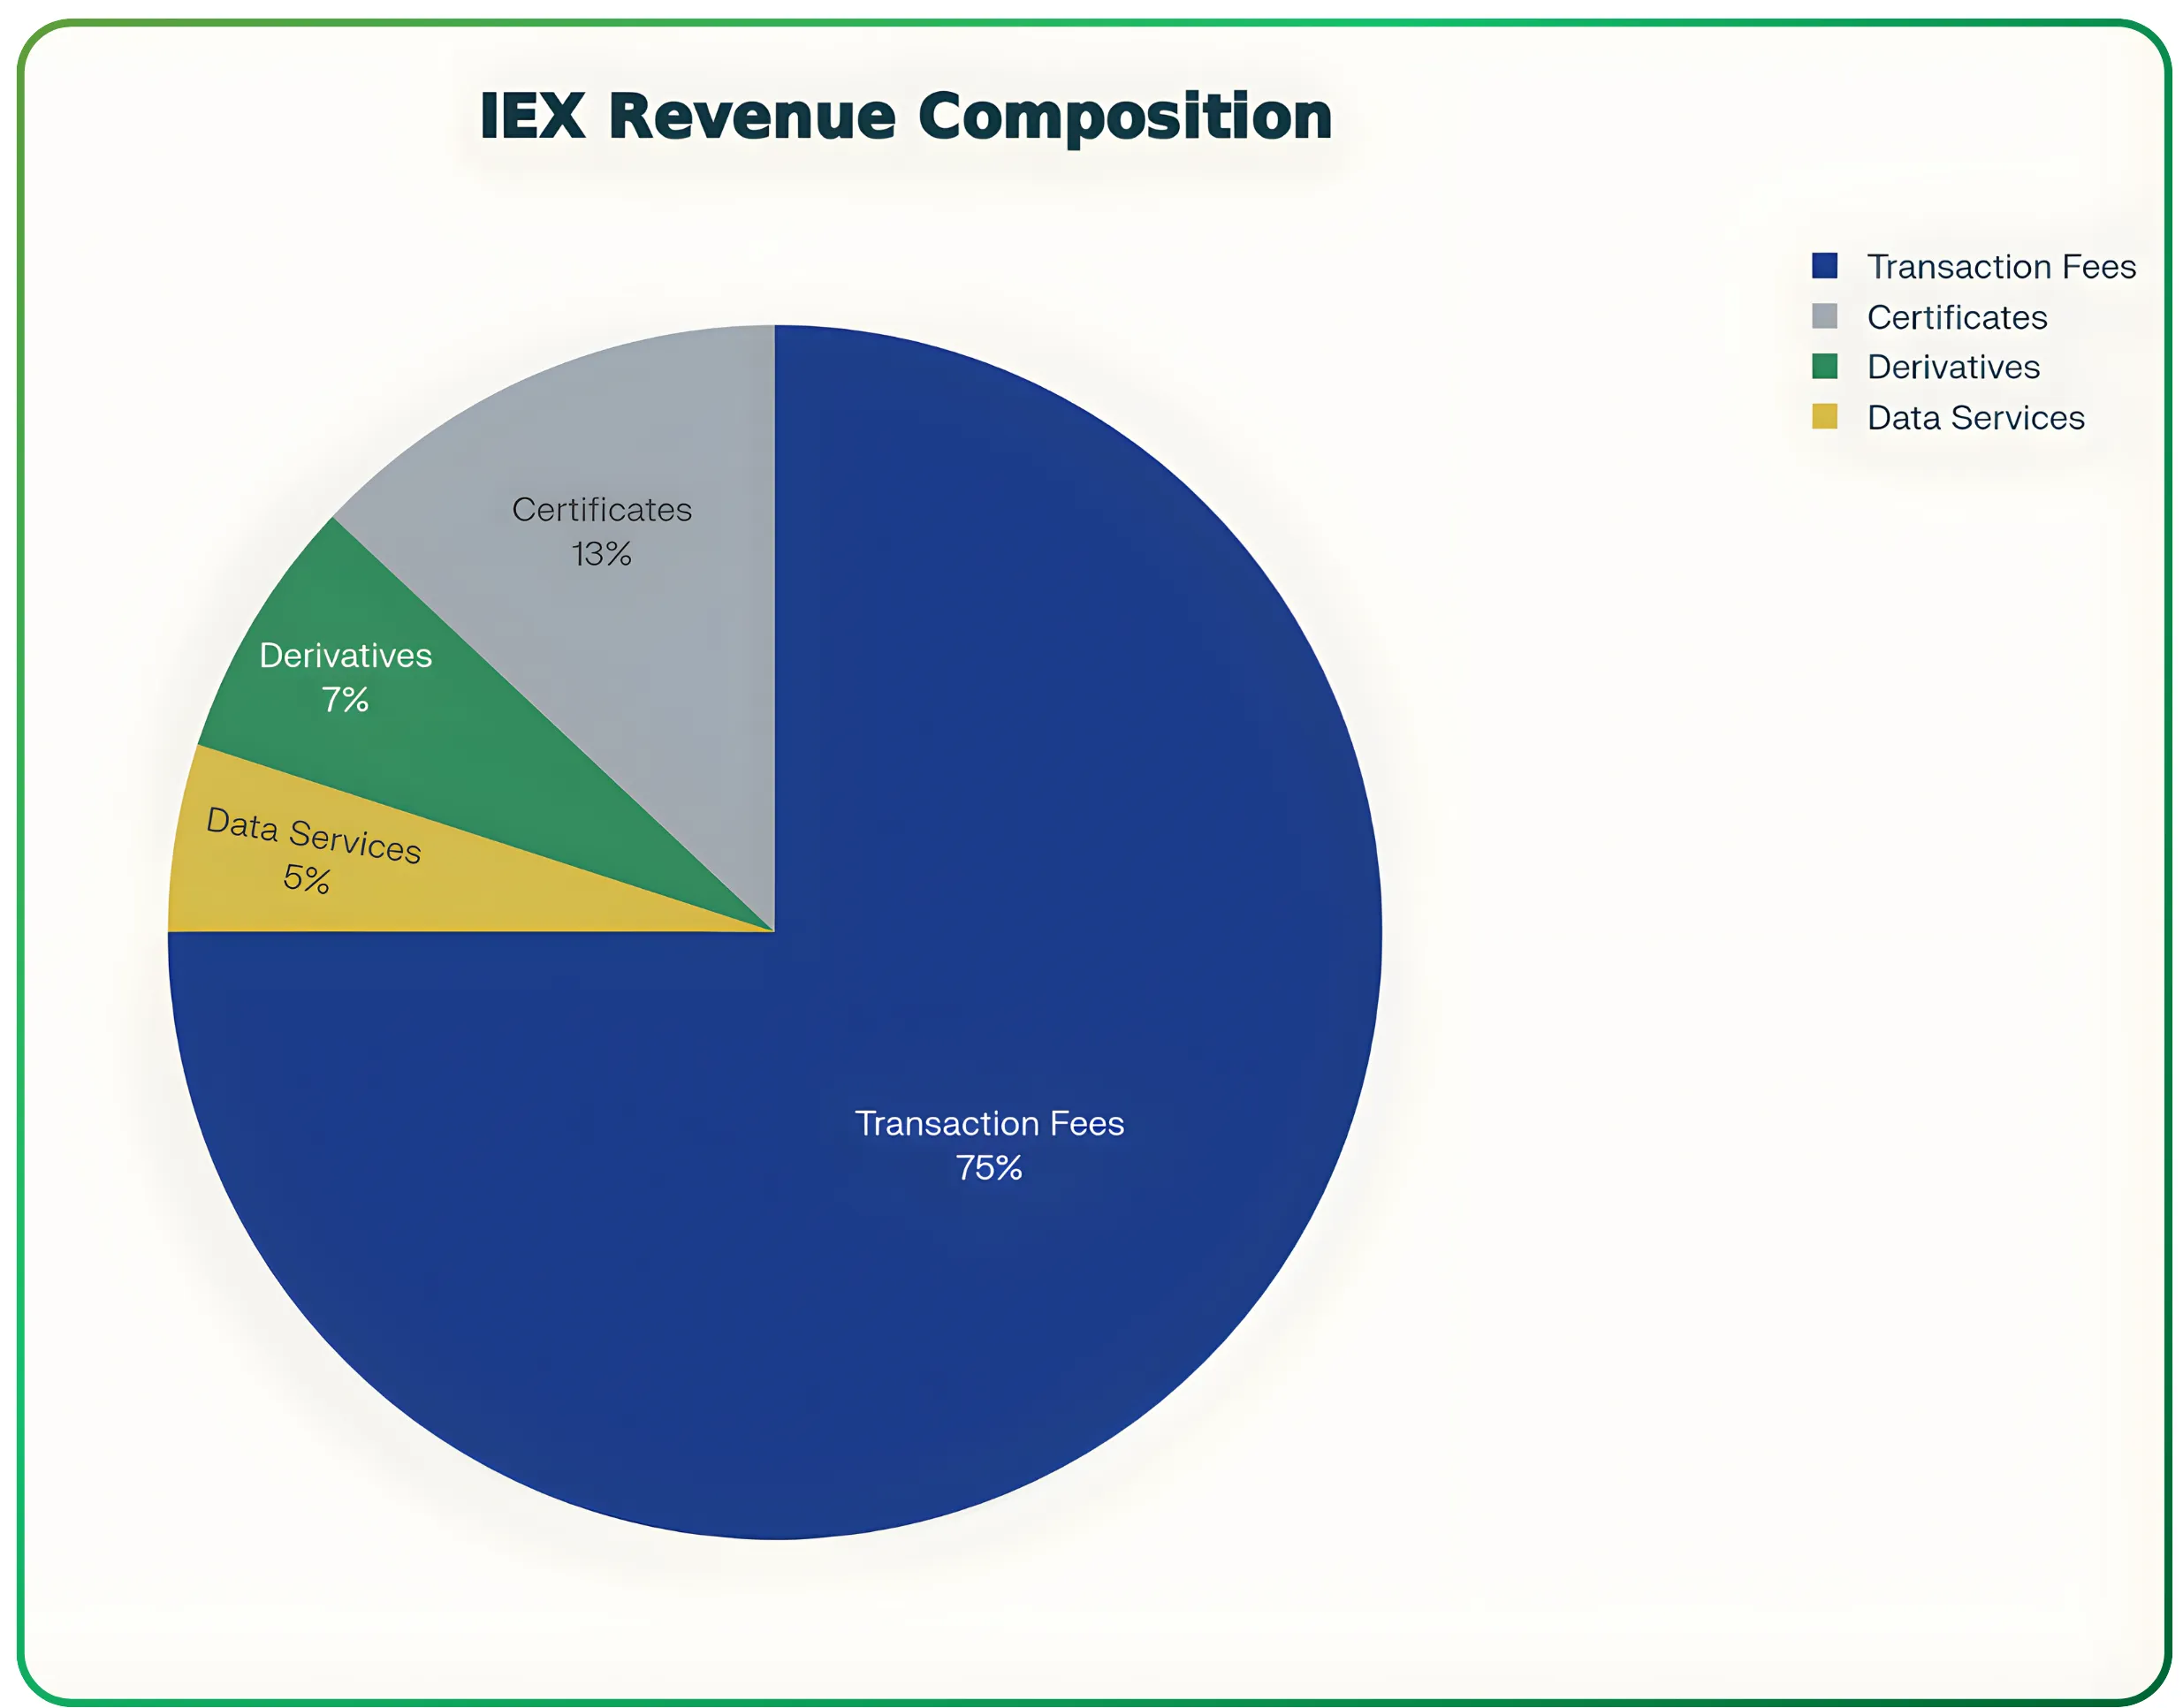
Transaction fees on electricity constitute 70-80% of total revenue, with green certificates and derivatives providing diversification.
2. Renewable Energy Certificates and Green Attributes
Exchanges serve as trading venues for Renewable Energy Certificates (RECs), Energy Saving Certificates (ESCerts), and other environmental attributes under CERC’s regulatory framework. Each REC represents 1 megawatt-hour of renewable generations.
Recent regulatory revisions eliminated floor and forbearance prices, fundamentally changing liquidity dynamics. While this created short-term volatility, it positions exchanges to benefit from India’s renewable energy expansion and corporate sustainability commitments requiring green attribute procurement.
3. Derivatives and Fee-Sharing Arrangements
Electricity futures and options listed on commodity exchanges (such as MCX) generate fee-sharing revenue for power exchanges that provide the underlying spot market and settlement infrastructure. This diversifies income without significant capital expenditure through volumes remaining nascent compared to physical trading.
4. Adjacent Commodity Platforms
The Indian Gas Exchange (IGX) operating under separate PNGRB (Petroleum and Natural Gas Regulatory Board) regulation, represents a strategic diversification into natural gas trading. As an IEX subsidiary, IGX operates under different regulatory rules and fee structures, creating a second growth engine.
Potential expansion into coal exchanges and carbon credit markets offers additional revenue verticals, though implementation depends on government procurement policies and market participant adoption.
Market Structure and Competitive Dynamics
The Indian power exchange landscape exhibits extreme concentration. IEX historically commands over 90% market share, with Power Exchange Indian Limited (PXIL) and Hindustan Power Exchange (HPX) as smaller competitors.
This dominance stems from power network effects: high liquidity attracts more participants, improving price discovery and reinforcing incumbent advantage. Market participants integrate their systems, credit facilities, and scheduling processes with specific exchanges, creating meaningful switching costs that further entrench the leader.
Trading Segments
Power exchanges operate three primary time-horizon markets:
Day-Ahead Market (DAM): Participants submit bids for next-day delivery, typically representing ~35% of exchange volumes. This is the most mature segment with standardized auction mechanics.
Real-Time Market (RTM): Intraday trading with delivery horizons as short as one hour ahead, capturing approximately 35-40% of volumes and experiencing the fastest growth RTM addresses renewable energy intermittency and unplanned outages, making it strategically critical.
Term-Ahead Market (TAM): Weekly, monthly, and longer-term contracts, typically representing 15-20% of volumes.
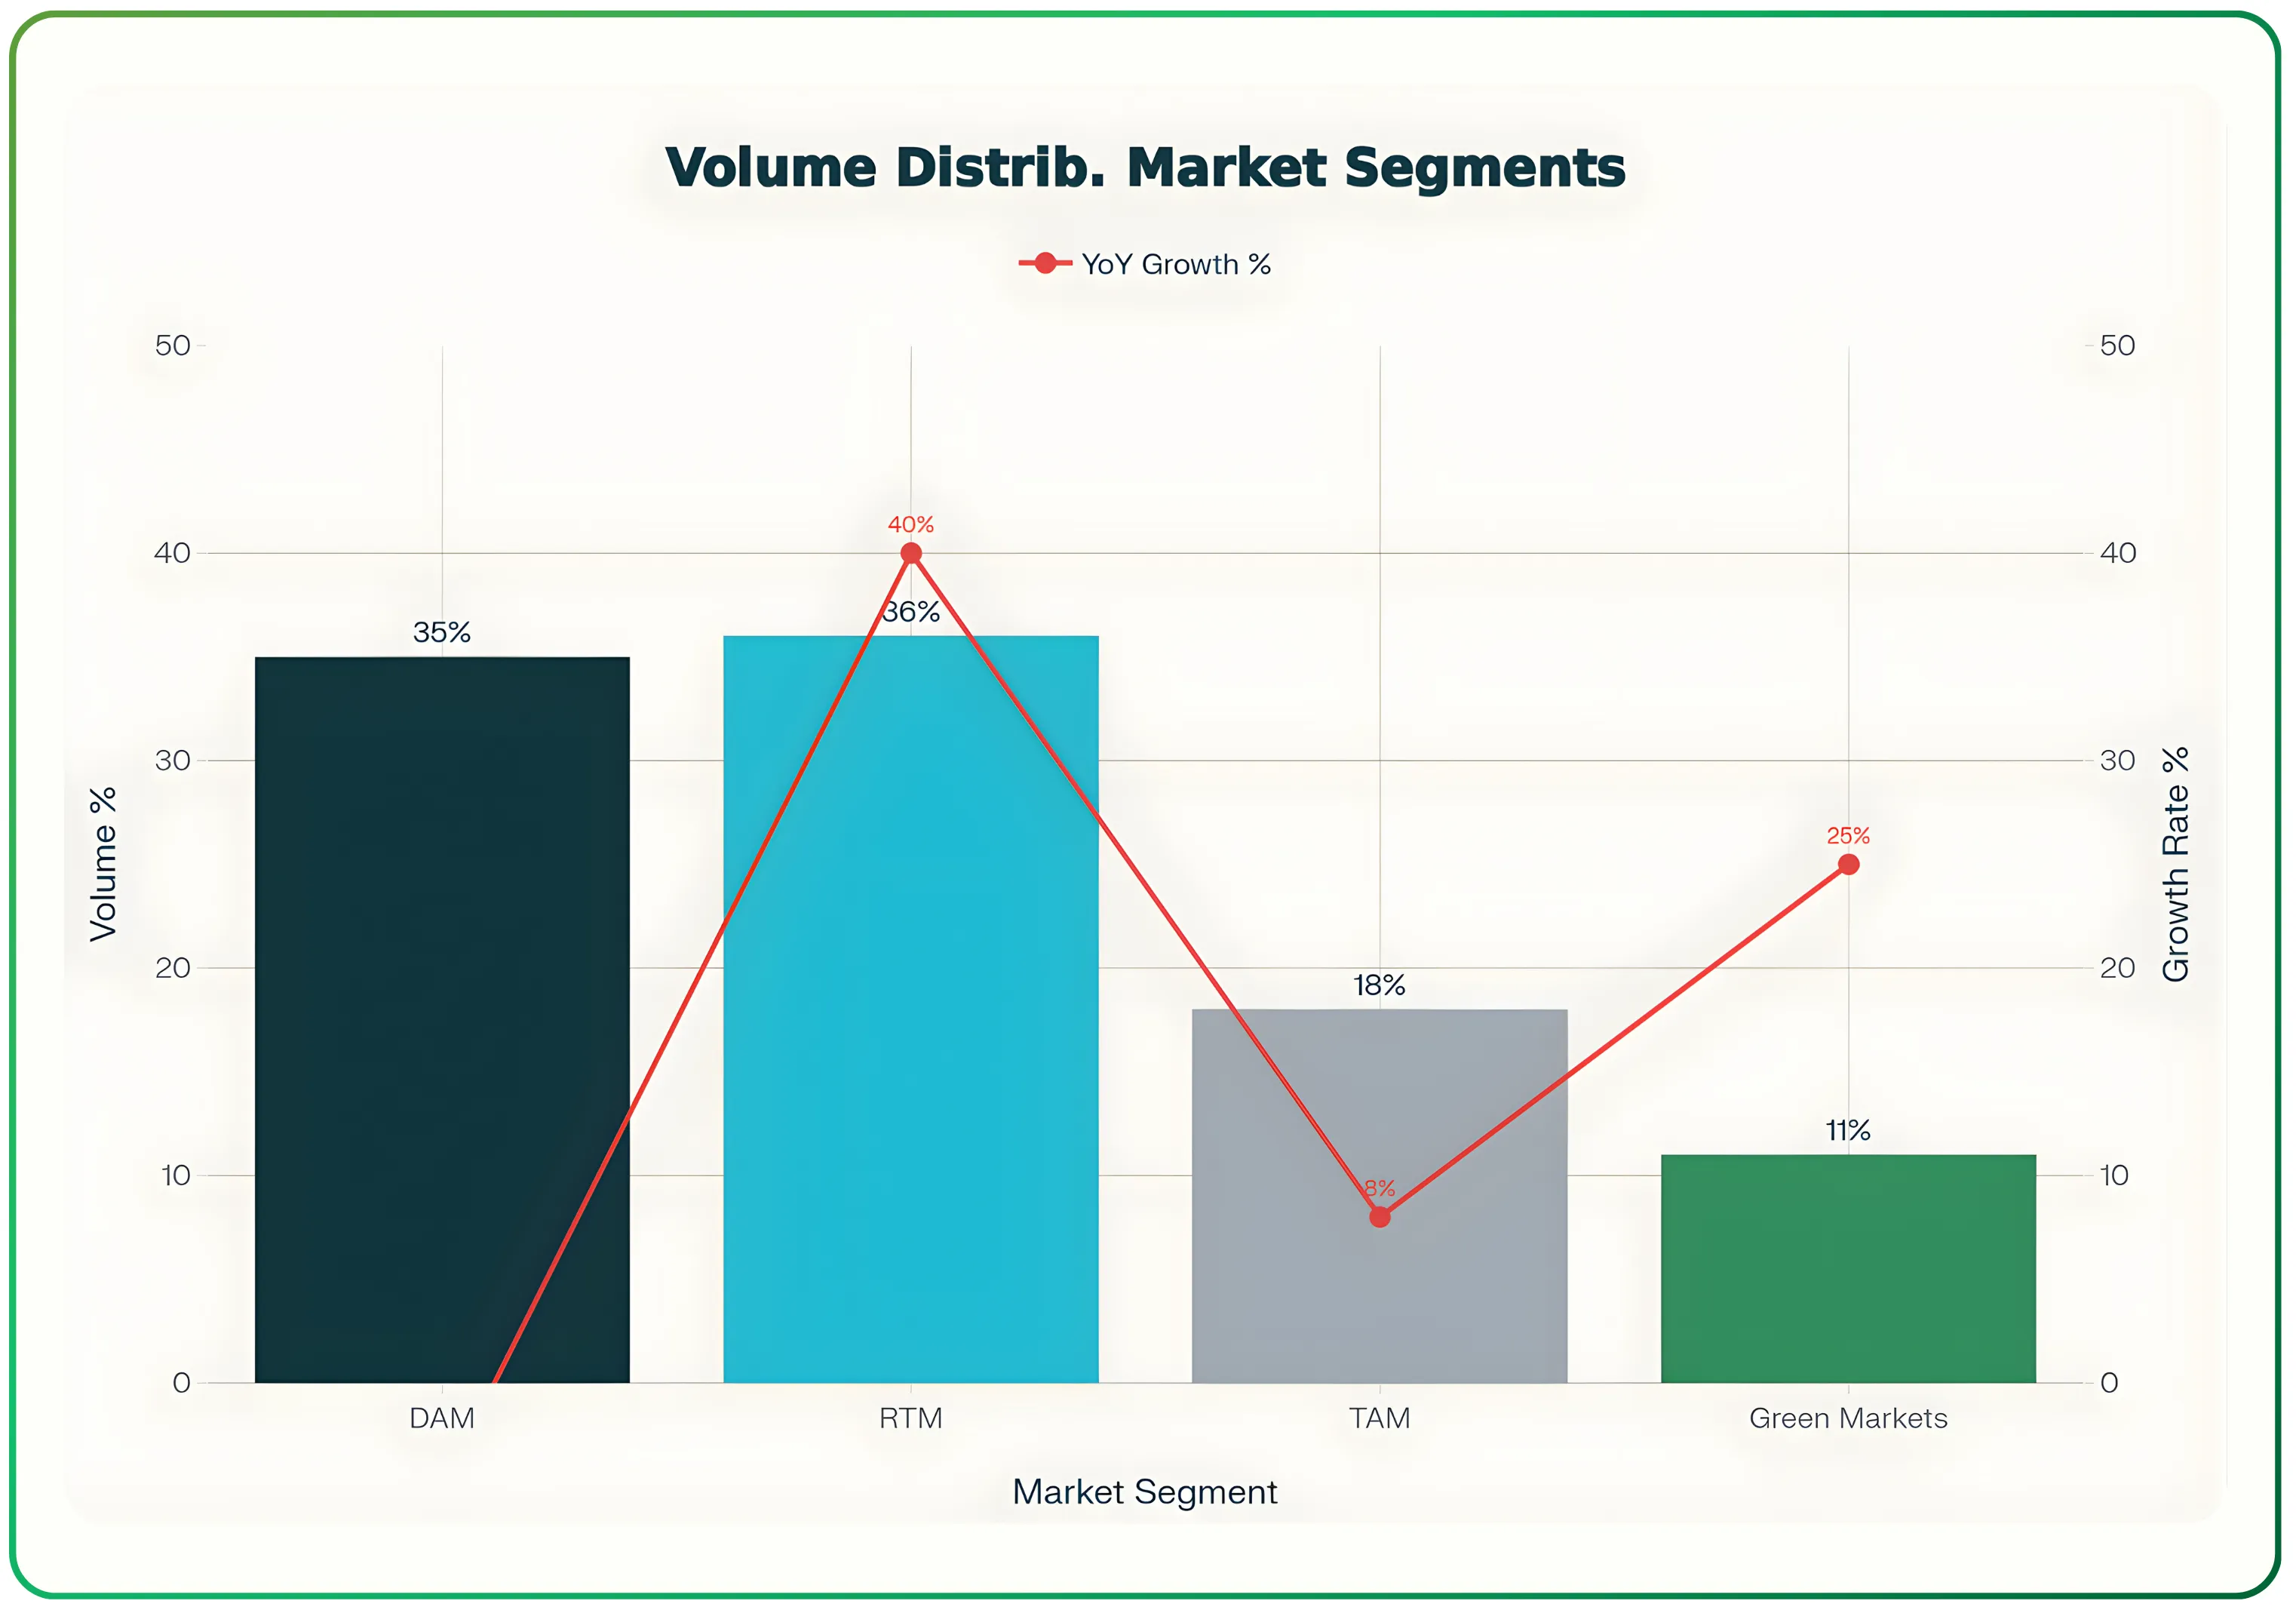
RTM has emerged as the highest-growth segment, driven by renewable integration and grid balancing needs
The Market Coupling Revolution
CERC’s market coupling directive represents the industry’s most significant regulatory intervention, fundamentally restructuring how price discovery occurs across exchanges.
What is Market Coupling?
Market coupling centralizes the price-discovery algorithm across all exchanges for specialized segments. Instead of each exchange running an independent auction with potentially different clearing prices, a single Market Coupling Operator (MCO), likely GRID-INDIA in coordination with exchanges, aggregates all bids and determines a uniform market clearing price.
The algorithm must account for transmission constraints (congestion management) and can split the market into bidding zones with different locational prices. The MCO role will rotate among exchanges, with detailed procedural rules governing operations, transparency, and dispute resolution.
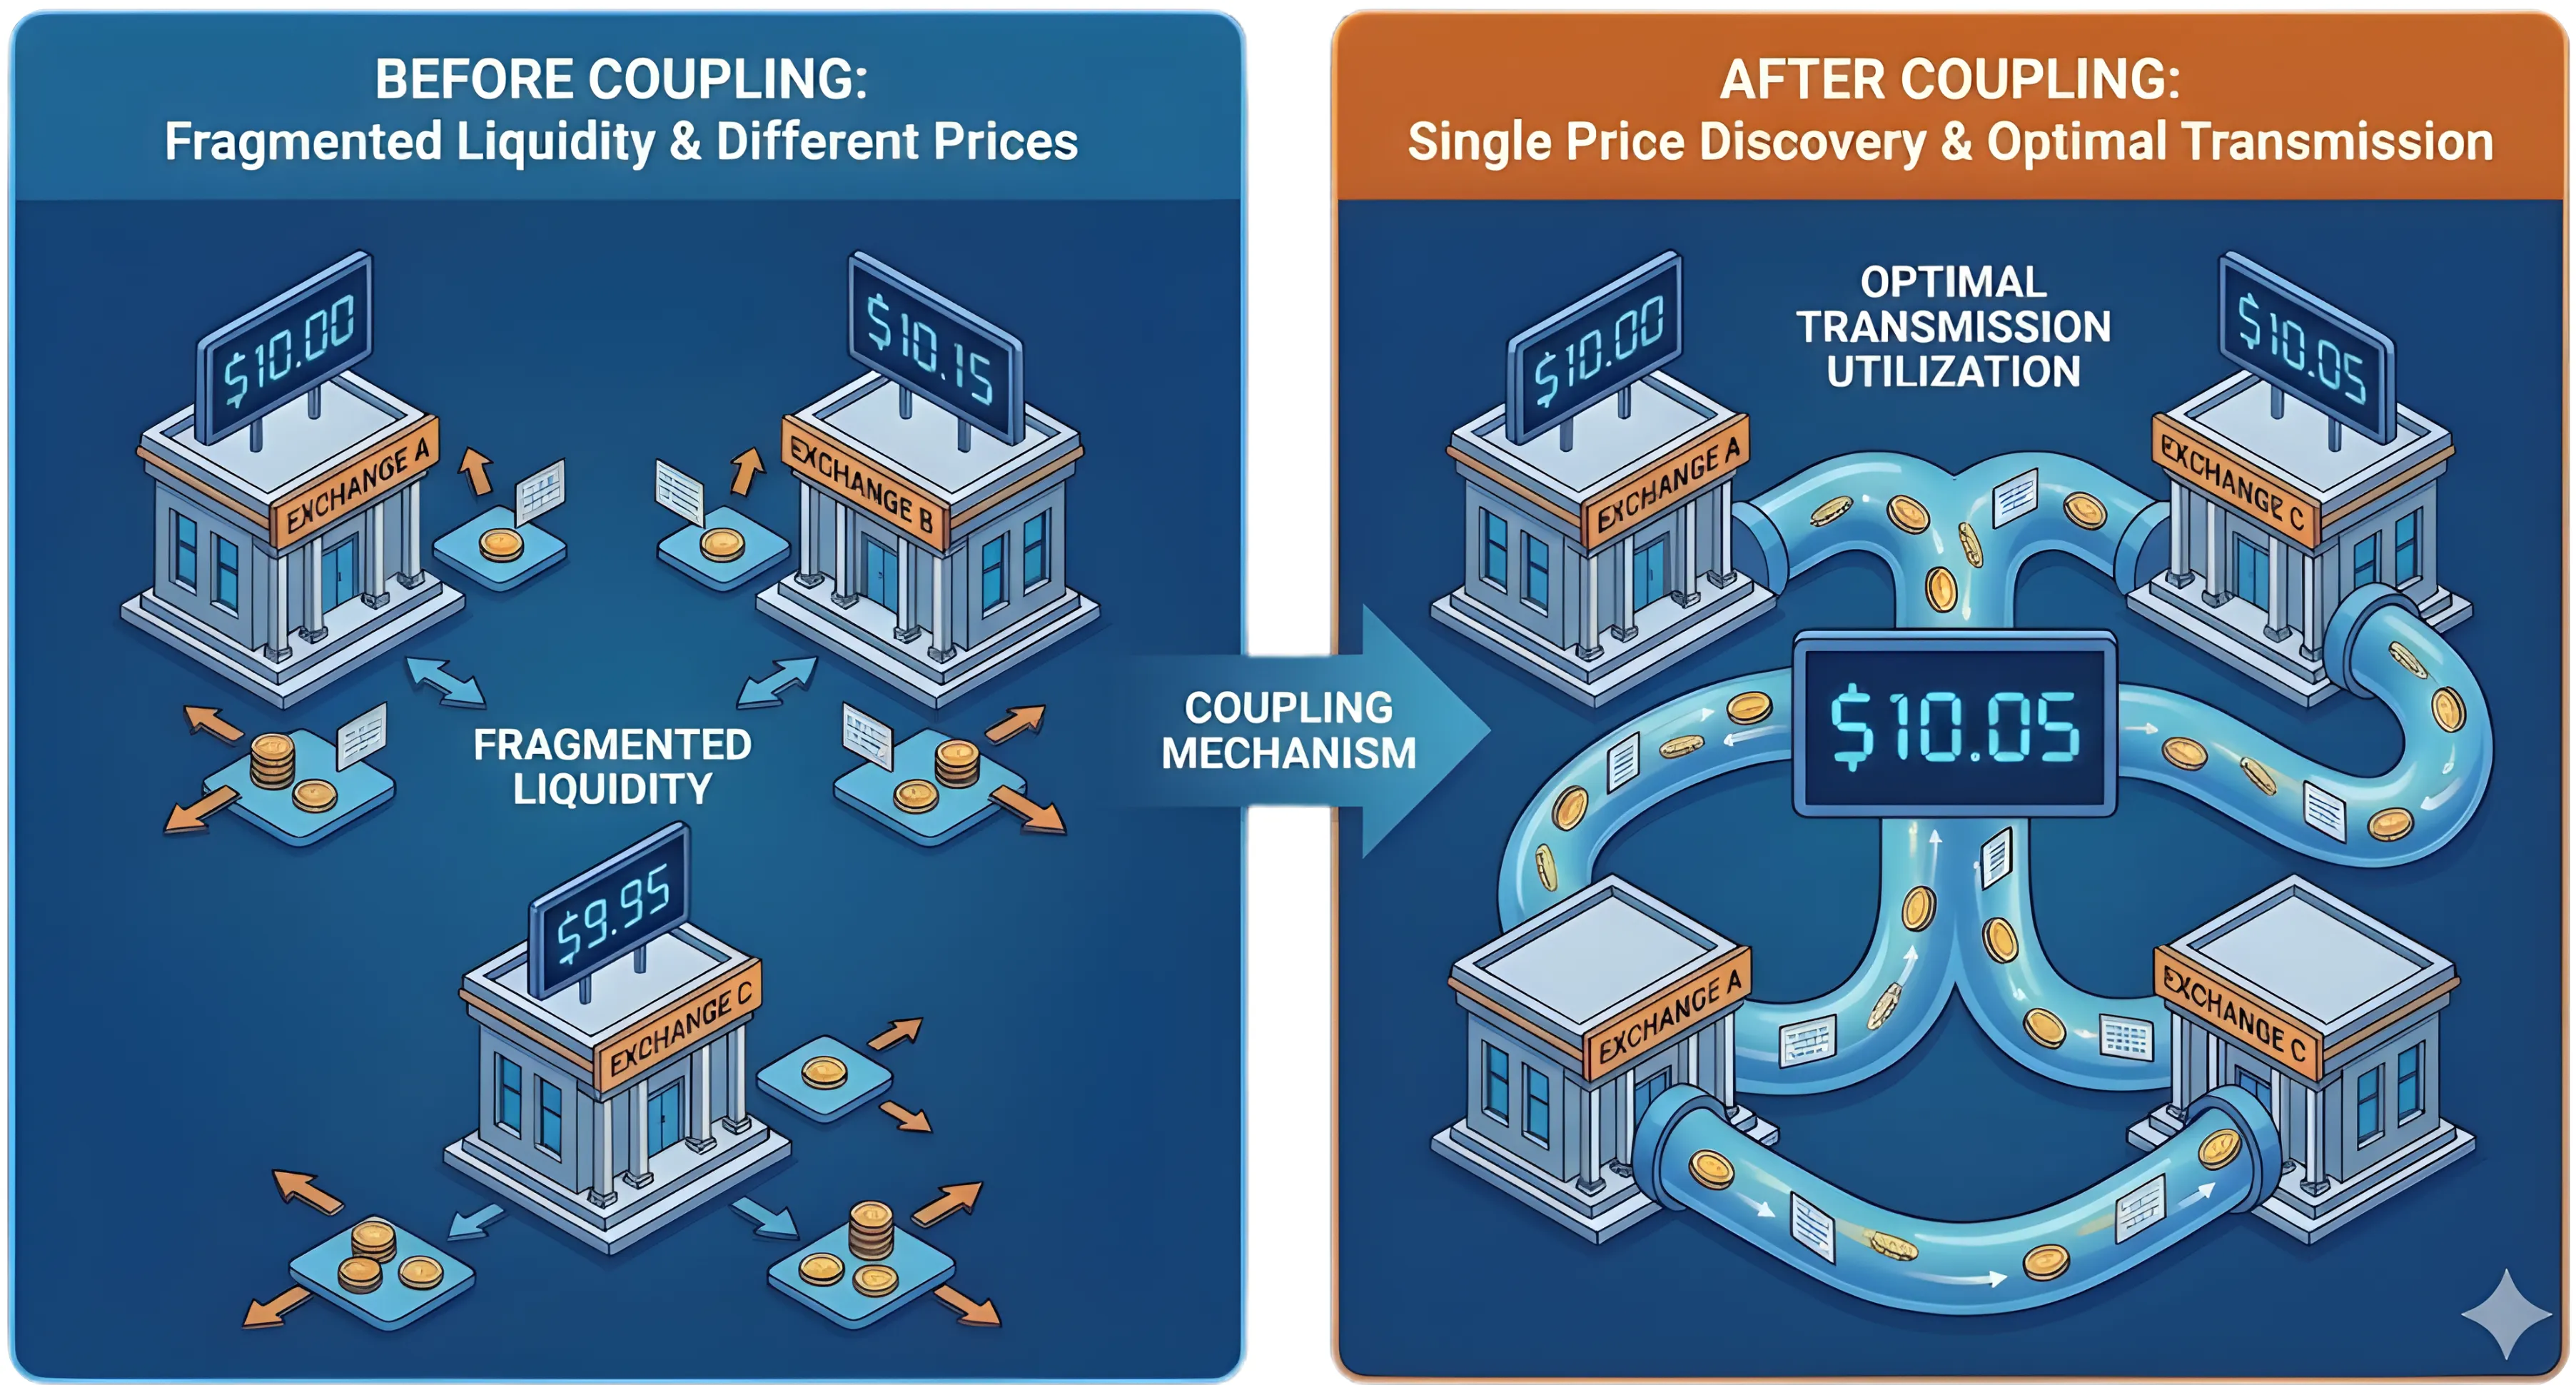
Before coupling: Three exchanges with different prices and fragmented liquidity. After coupling: Single price discovery across platforms, optimal transmission utilization.
Implementation Timeline and Scope
CERC has directed a phased rollout starting with the Day-Ahead Market (DAM). The directive requires exchanges and GRID-INDIA to coordinate on operational, algorithmic, and settlement changes following pilots and shadow runs.
Critical uncertainties remain:
Which segments will be coupled? DAM is confirmed: RTM and TAM status remains unclear
Implementation timeline: Operational complexity suggests 12-24 months minimum for DAM, potentially 2-4 years if extended to RTM.
Algorithm design: Technical specifications for congestion management and market splitting rules will determine practical outcomes
Strategic Growth Levers
Despite coupling headwinds, multiple growth vectors can preserve or expand exchange economics:
1. Real-Time Market Leadership
RTM represents the highest-growth segment (not yet coupled) and addresses India’s renewable integration challenge. As variable renewable energy (solar/wind) creates grid balancing needs and battery energy storage systems (BESS) enable time-shifting, RTM volumes should grow disproportionately.
Exchanges investing in lower latency, faster auction cadence, and superior participant user experience can defend market share even under eventual coupling scenarios.
2. Indian Gas Exchange (IGX) Expansion
Operating under separate PNGRB regulation, IGX provides genuine diversification away from electricity spots. India's growing gas market , driven by city gas distribution expansion, LNG imports, and industrial demand, creates a scalable platform opportunity with different competitive dynamics and fee structures.
3. Coal Exchange Development
Government policy has prioritized coal trading platform development to improve price discovery and procurement efficiency for thermal power plants and industrial consumers. Exchanges capturing initial market share can establish fee-based economics in this large commodity market, though adoption depends on Coal India Limited’s participation and government procurement rule changes.
4. Carbon Credits and Green Attribute Markets
As corporate carbon accounting matures and voluntary compliance mechanisms evolve, exchanges can provide clearing infrastructure for carbon credits and environmental attributes. India’s net-zero commitments and potential carbon pricing mechanisms create optionality, though market liquidity remains uncertain.
5. Data Monetization and Analytics
Exchanges accumulate valuable datasets on electricity pricing, demand patterns, renewable generation profiles, and participant behavior. Building subscription products for DISCOMs, large traders, and renewable developers can generate recurring revenue less sensitive to per-unit fee caps.
Financial Profile and Unit Economics
Power exchanges exhibit exceptional financial characteristics derived from platform economics:
High Operating Leverage: Software-driven platforms have substantial fixed costs (technology development, surveillance systems, regulatory compliance, personnel) but minimal marginal costs per trade. As volumes scale, incremental profits flow directly to the bottom line.
Free Cap Sensitivity: Regulatory ceiling on per-unit fees limit pricing power, making growth fundamentally volume-driven. Exchanges benefit from secular volume increases (renewable curtailment trading, BESS arbitrage, industrial open-access expansion) rather than price increases.
Cash Generation: High margins and low capital intensity (relative to physical infrastructure businesses) generate substantial free cash flow. IEX’s public fillings show profit margins and cash conversion materially exceeding typical utility sector benchmarks.
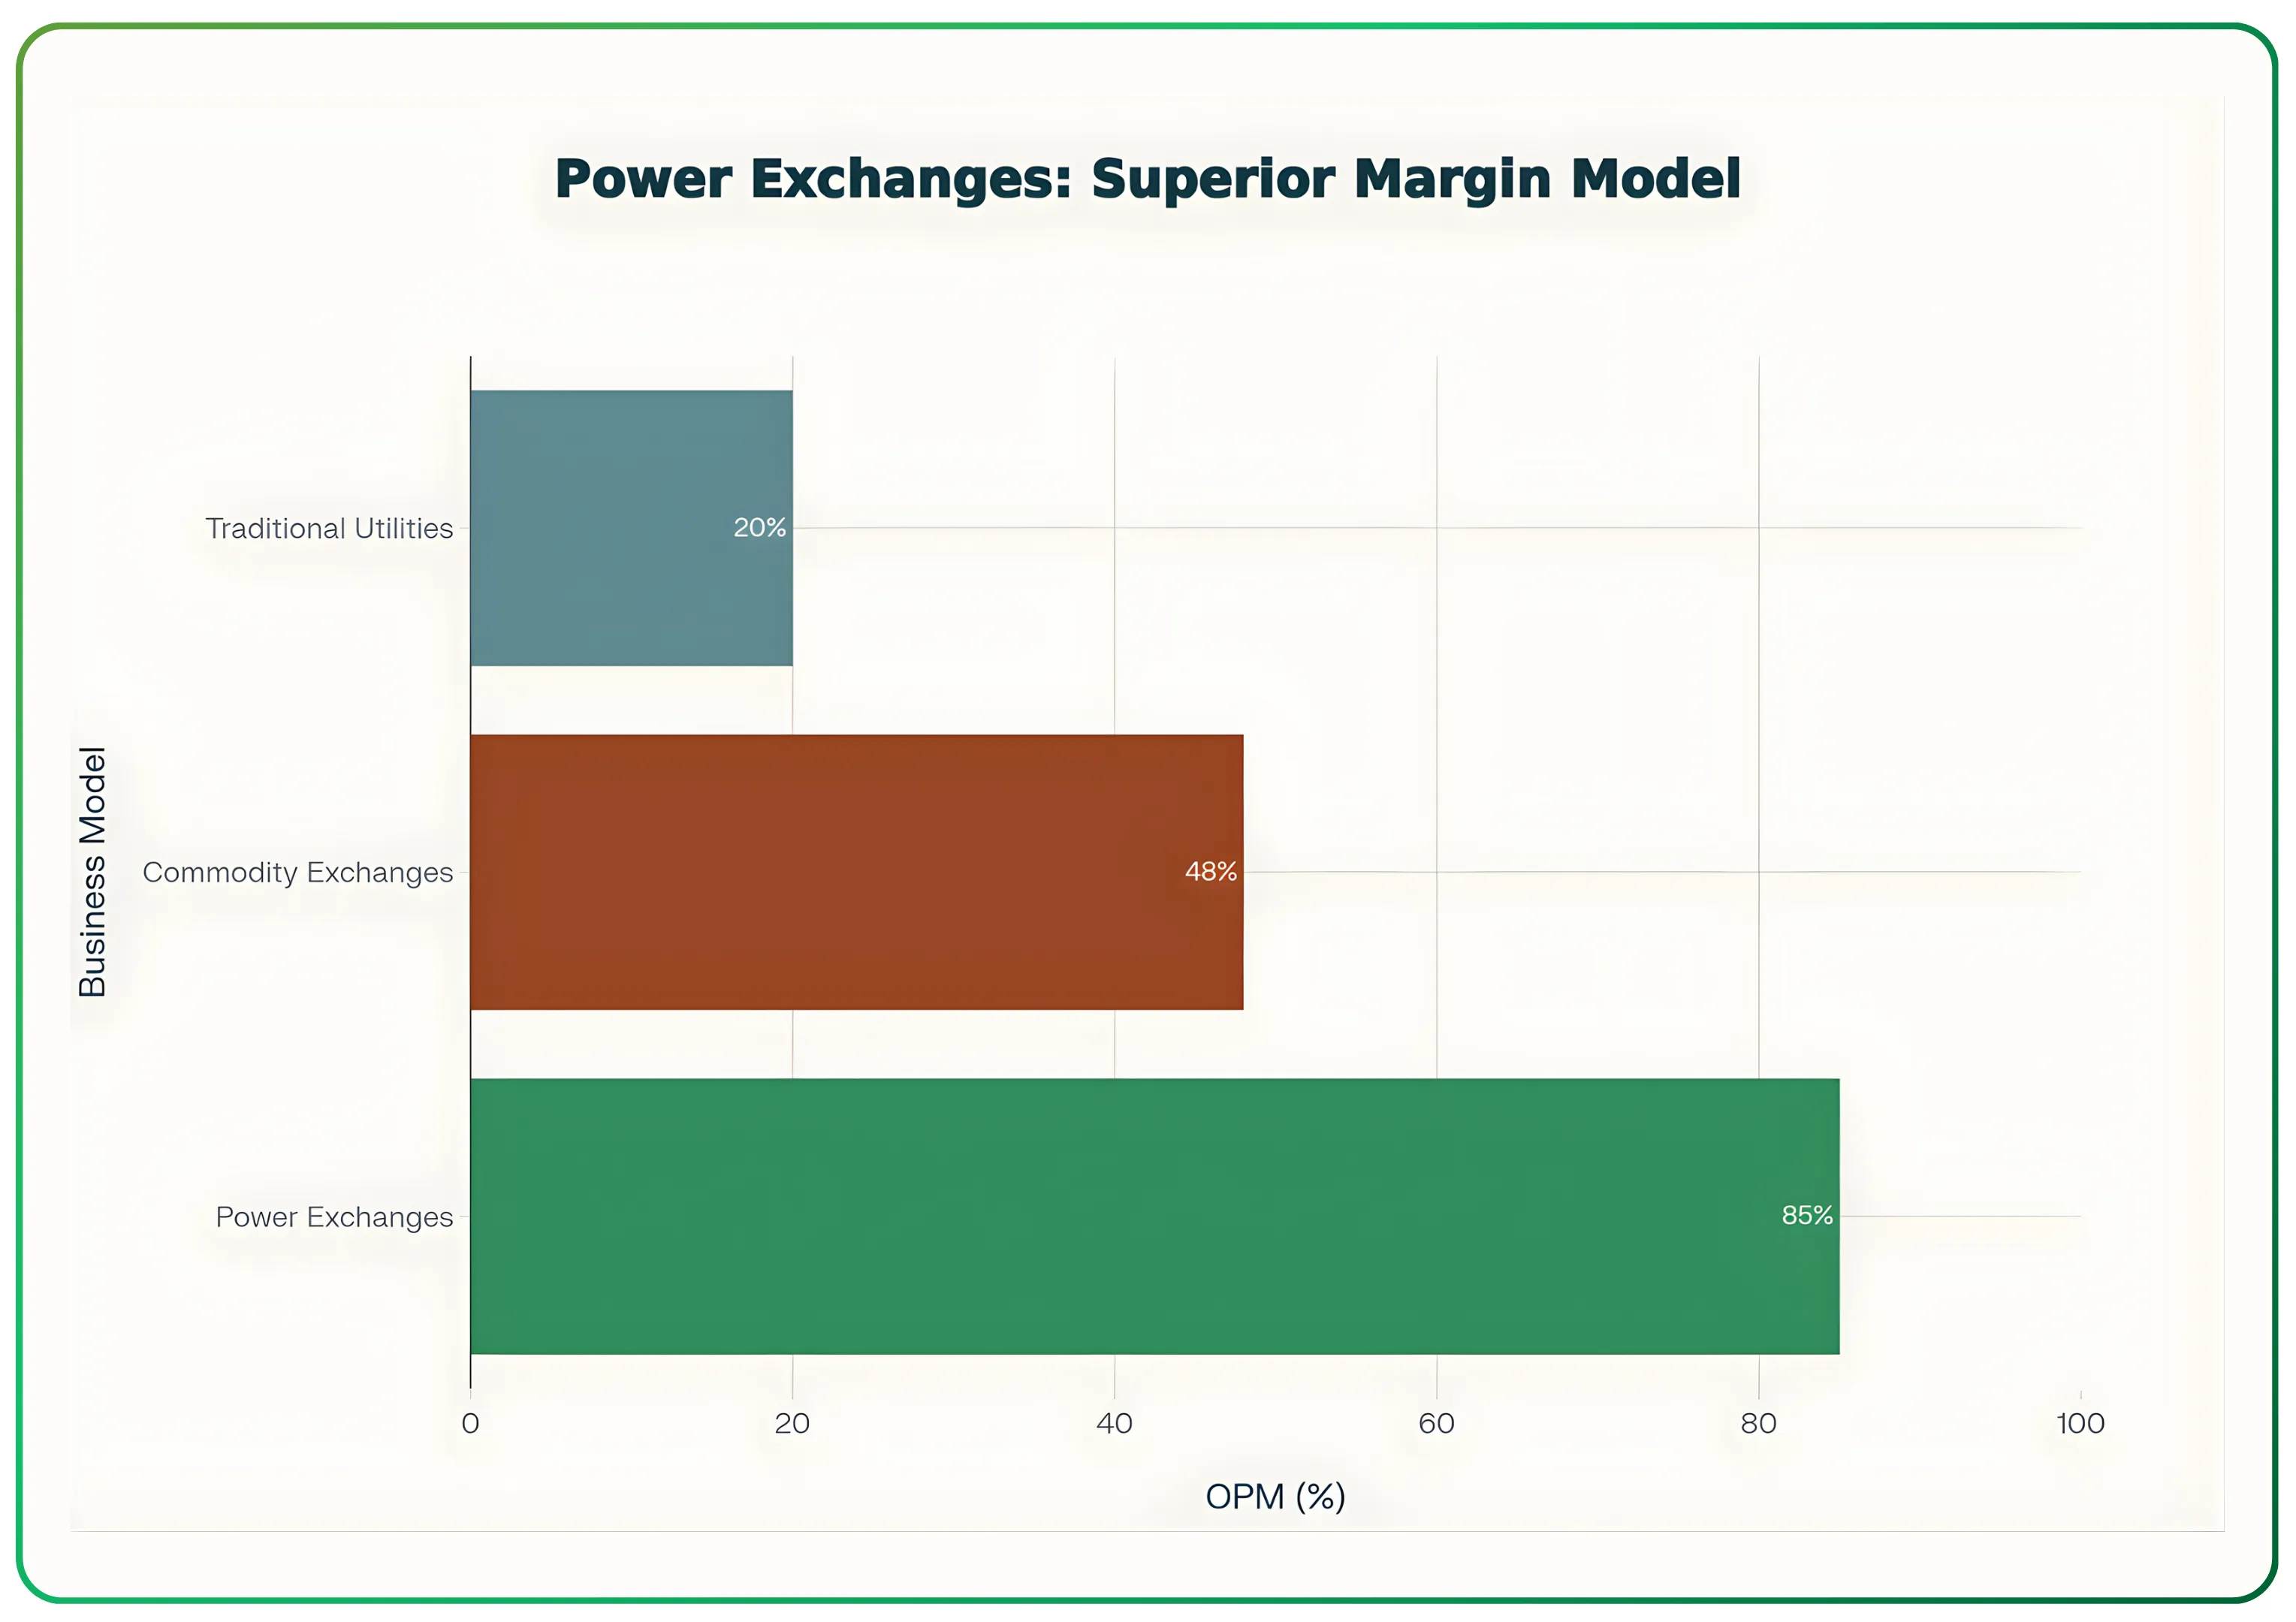
Power exchanges: 60-70% operating margins. Traditional utilities: 15-25%. Other commodity exchanges: 40-50%.
Bottom Line
Power exchanges represent high-value, high-leverage platform businesses with exceptional unit economics and substantial incumbent advantages. Market coupling reduces segment-level pricing power, but the actual economic impact depends critically on implementation scope and pace.
Near-term growth levers- RTM expansion, green attribute markets, and adjacent commodities (gas, coal, carbon) can preserve or enhance incumbent economics even under coupling scenarios. The strategic playbook requires product diversification, technological leadership, and active regulatory engagement.
For investors, the thesis rests on modeling both downside (aggressive coupling with fee compression) and upside (delayed RTM coupling with IGX/coal scaling) scenarios. Regulatory milestones constitute the primary re-rating catalysts, with CERC’s procedural decisions and GRD-INDIA’s operational choices determining competitive outcomes over the next 24-48 months.
Disclaimer: The information provided in our blogs is for informational purposes only and should not be construed as financial, investment, or trading advice. Trading and investing in the securities market carries risk. Always conduct your own research and consult with a qualified financial advisor before making any investment decisions. Past performance is not indicative of future results. Copyrighted and original content for your trading and investing needs.
© 2025 — Tradejini. All Rights Reserved.