


Most option traders focus primarily on price-based indicators such as candles, support–resistance levels, breakouts, VWAP, and volume. While these tools are useful, price often reacts only after positioning in the options market has already changed through shifts in open interest (OI).
By the time a move becomes visible on the chart, significant positioning across multiple strikes is already in place. This is why traders often see NIFTY staying range-bound while option premiums move sharply, driven by changes in OI and market sentiment rather than spot price movement.Relying on strike-wise open interest in live markets adds to the confusion. With dozens of strikes changing simultaneously, critical shifts are easy to miss or are noticed too late.
The Total CE–PE OI Difference view is designed to solve this problem. Instead of analysing individual strikes, it provides a single consolidated view of overall market positioning, clearly showing whether option writers are leaning towards calls or puts—and how that bias is evolving during the trading session.
This helps traders identify directional intent early, before it becomes obvious on price charts.
What is Total Call Option Put Option Open Interest Difference in NxtOption
Total CE–PE OI Difference is an open interest analysis view within NxtOption that tracks the net difference between total Call open interest and total Put open interest across all strike prices of an index or stock.In simple terms, it answers one critical question for option traders:
Are market participants adding more call positions or more put positions right now, based on OI change?
This is not a price-based indicator and not a strike-level scanner. Instead, it provides a market-wide positioning view available in the Analyze section of the platform.Traders use this view to gauge overall market sentiment and positioning strength before deciding how aggressive or cautious their trading strategy should be.
Understanding the Total CE PE OI Difference workspace
When you open the Total CE PE Difference view, the screen is designed to provide you with better OI analysis.
At the top, you have context. The underlying price, VWAP, and market data help you understand where the market is trading.
Below that, you have positioning. Total Call OI, Total Put OI, and their difference show how market participants are positioned across options contracts.
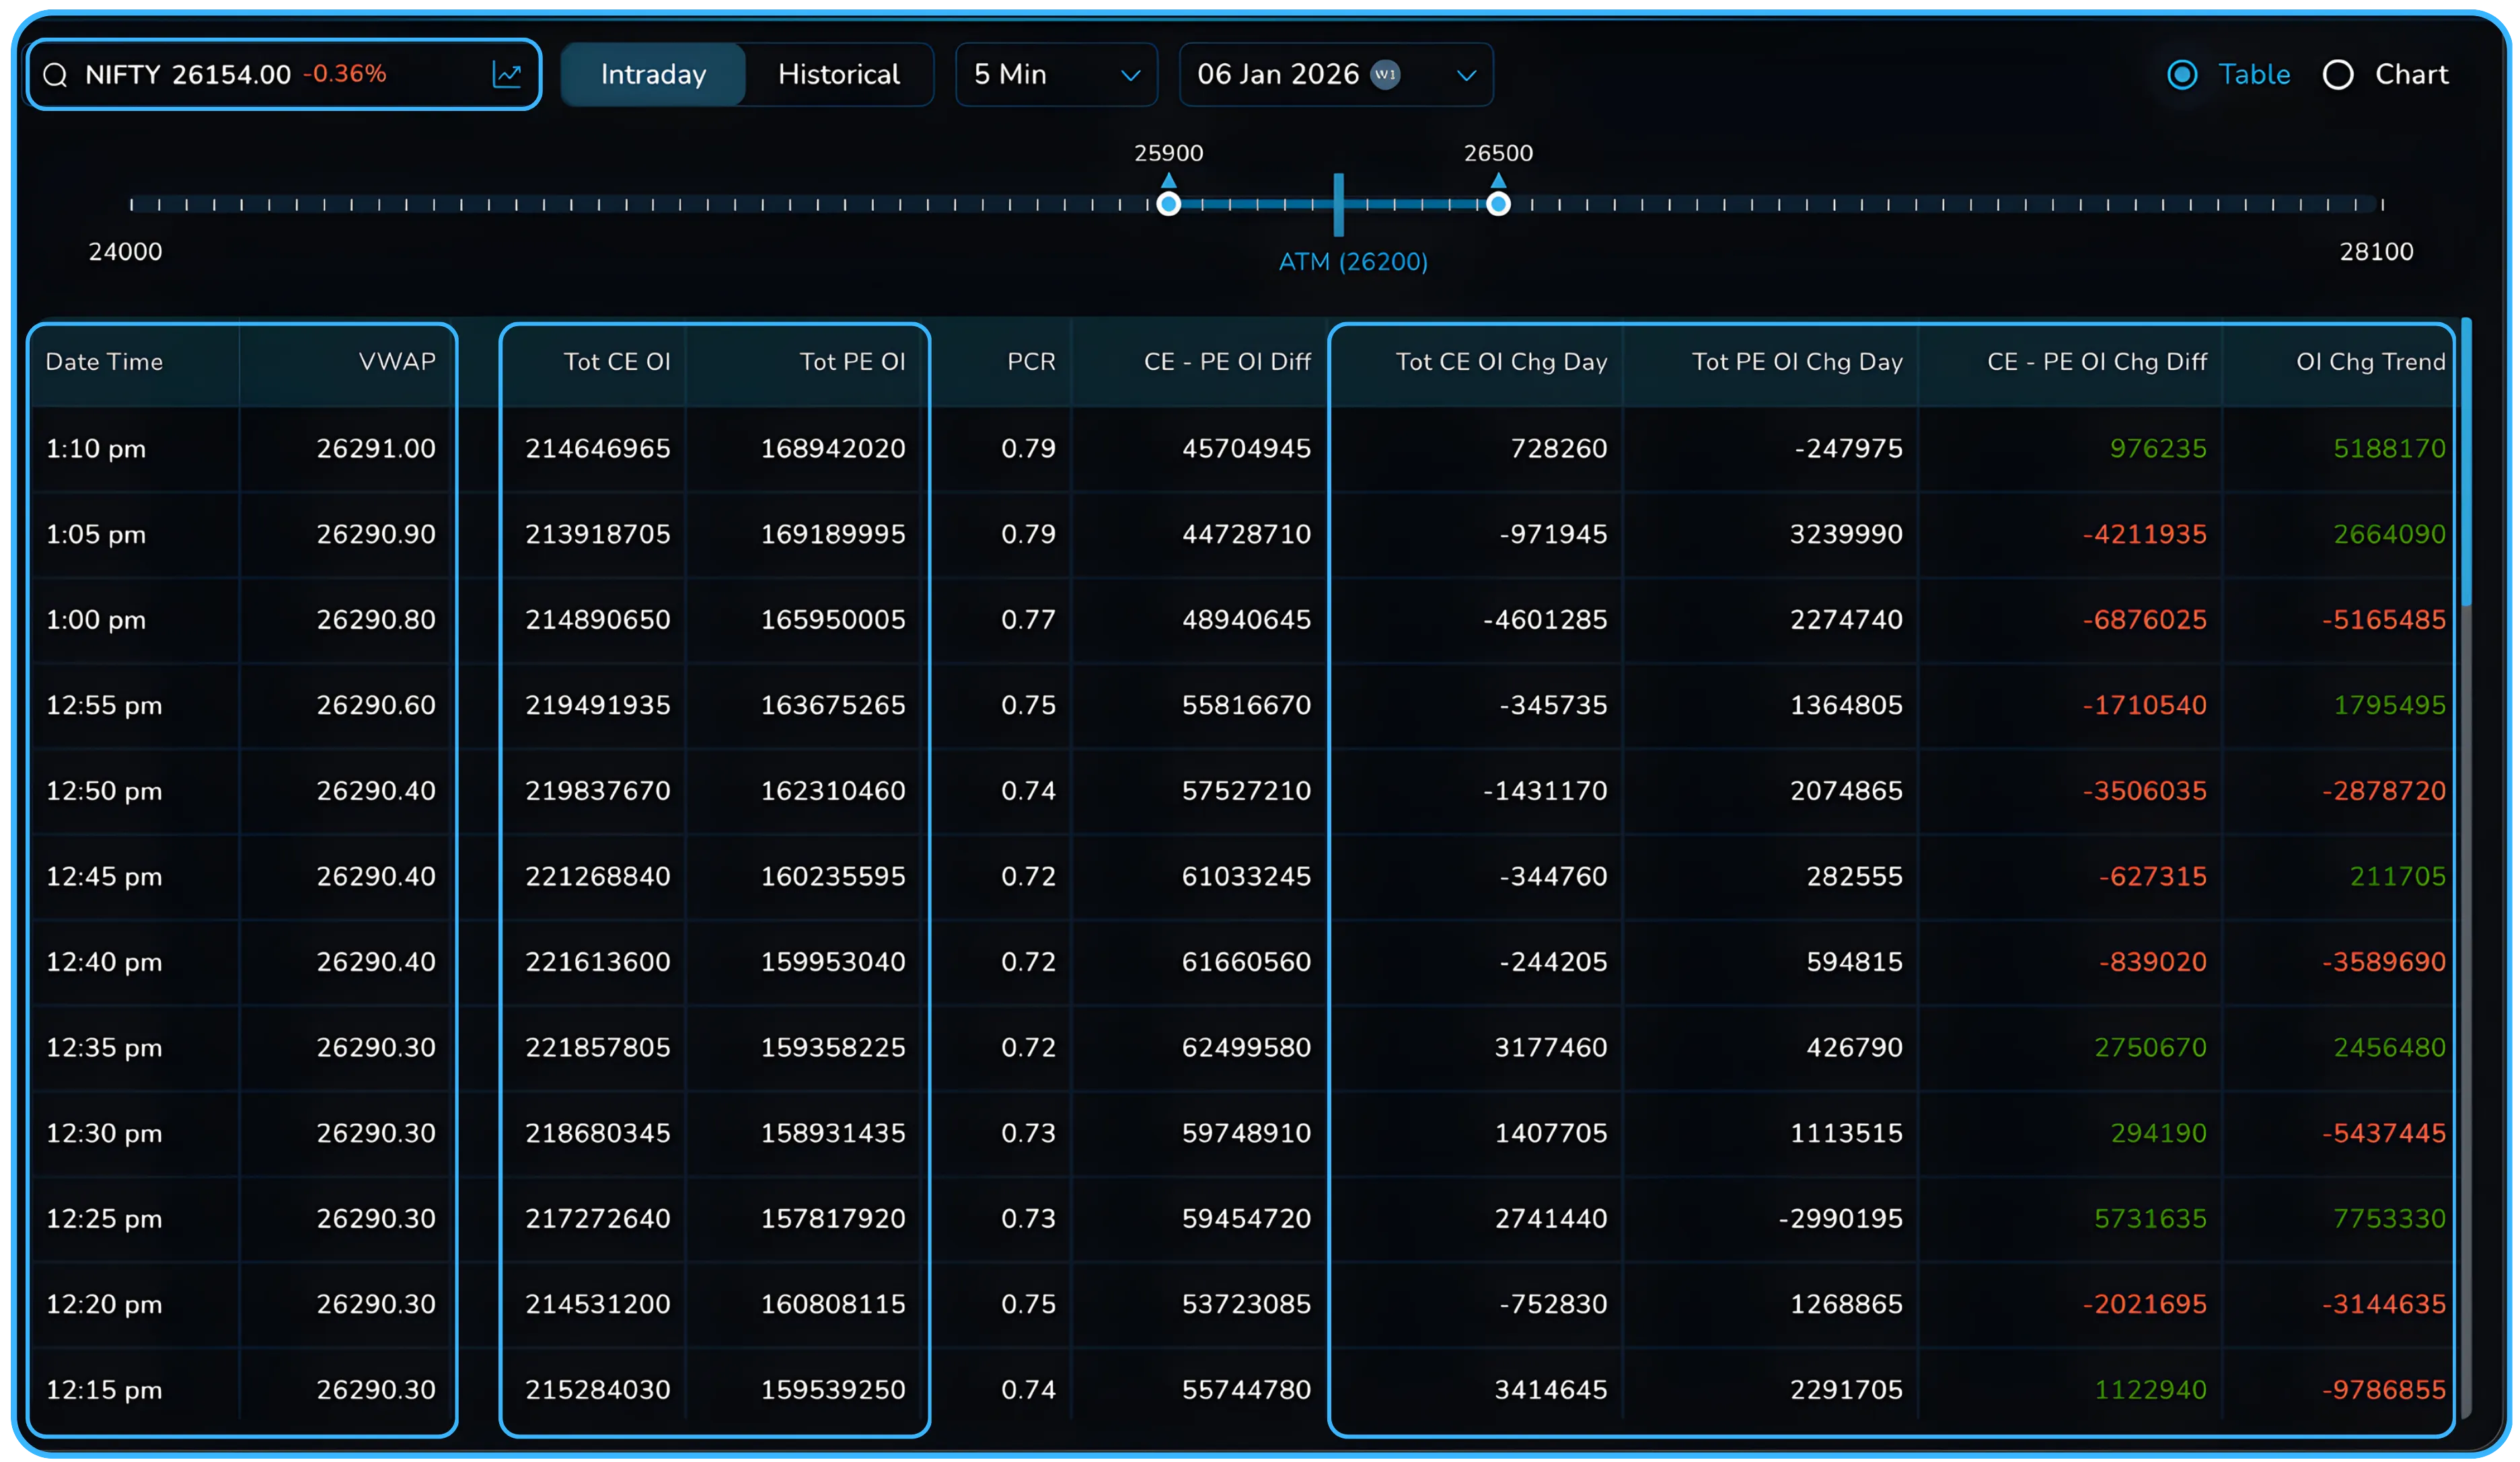
Finally, you have change and momentum. The day change columns show whether call options or put option positions are being added or reduced as the session progresses, helping identify potential trend reversals.
##How the screen is structured
The Total CE PE OI Difference screen allows the user to have two views for the data points.
- Table view
- Line chart view
At any point, you can switch between table and chart without losing context.
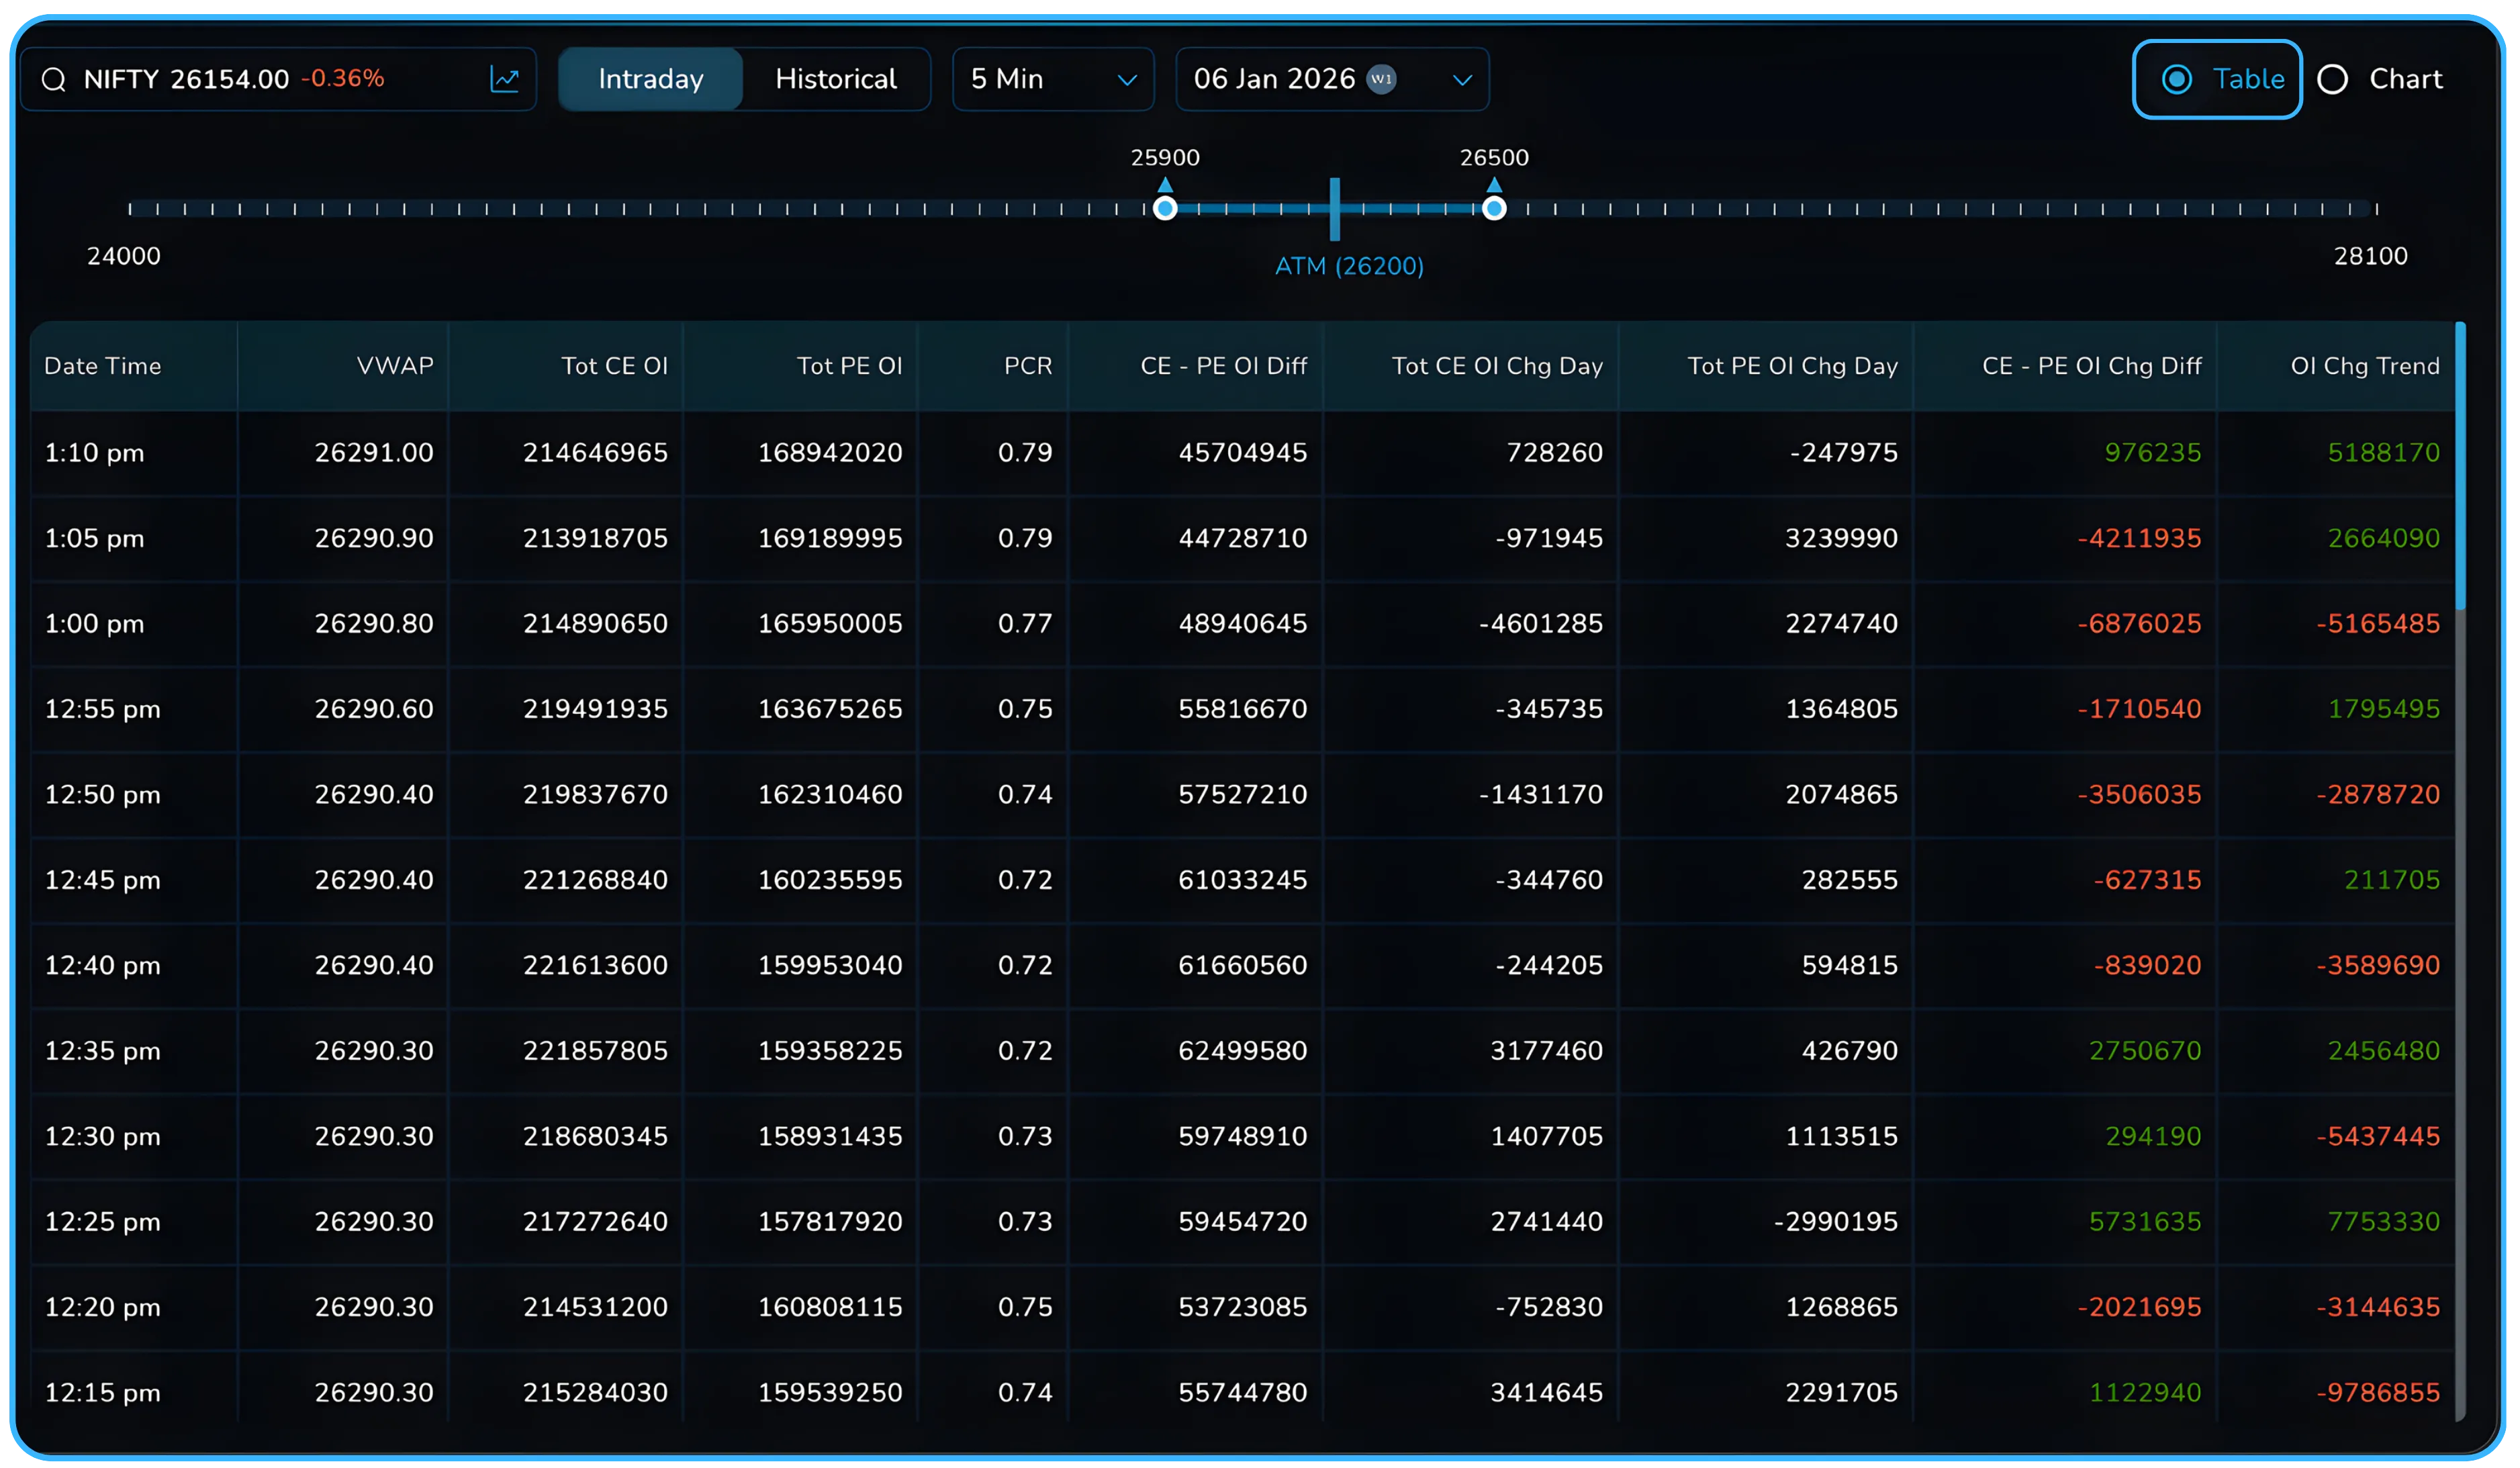
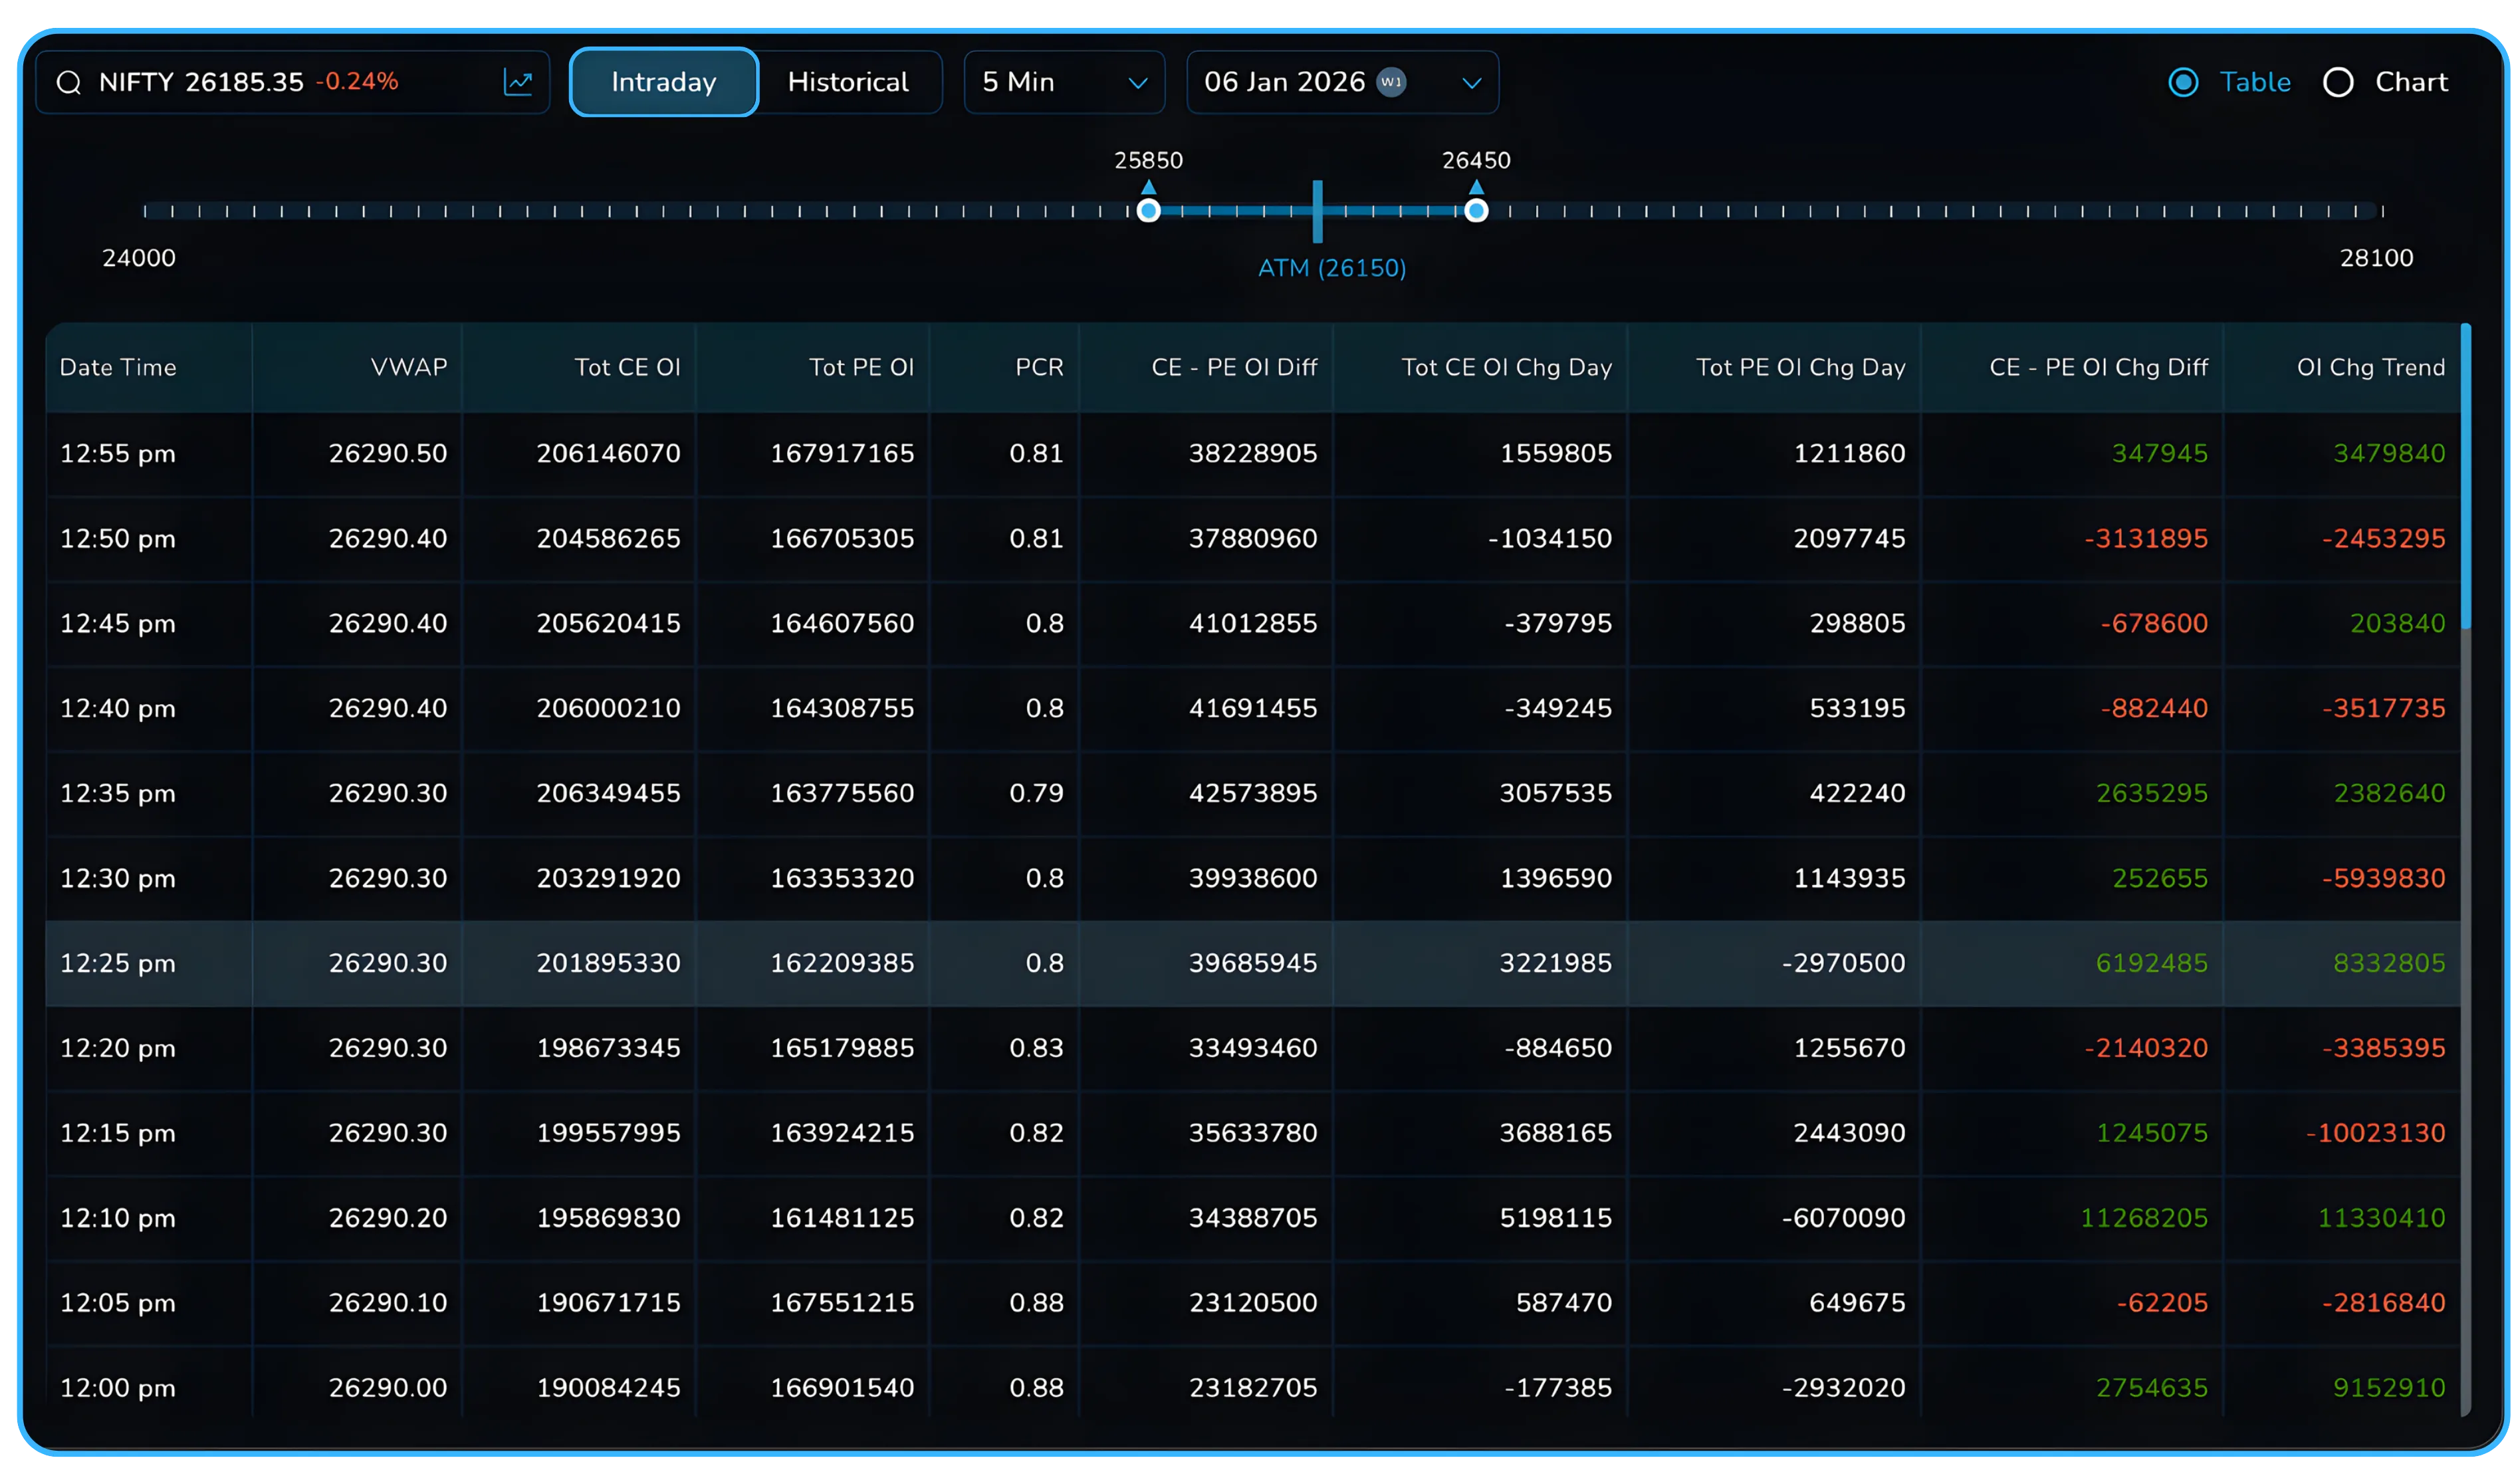
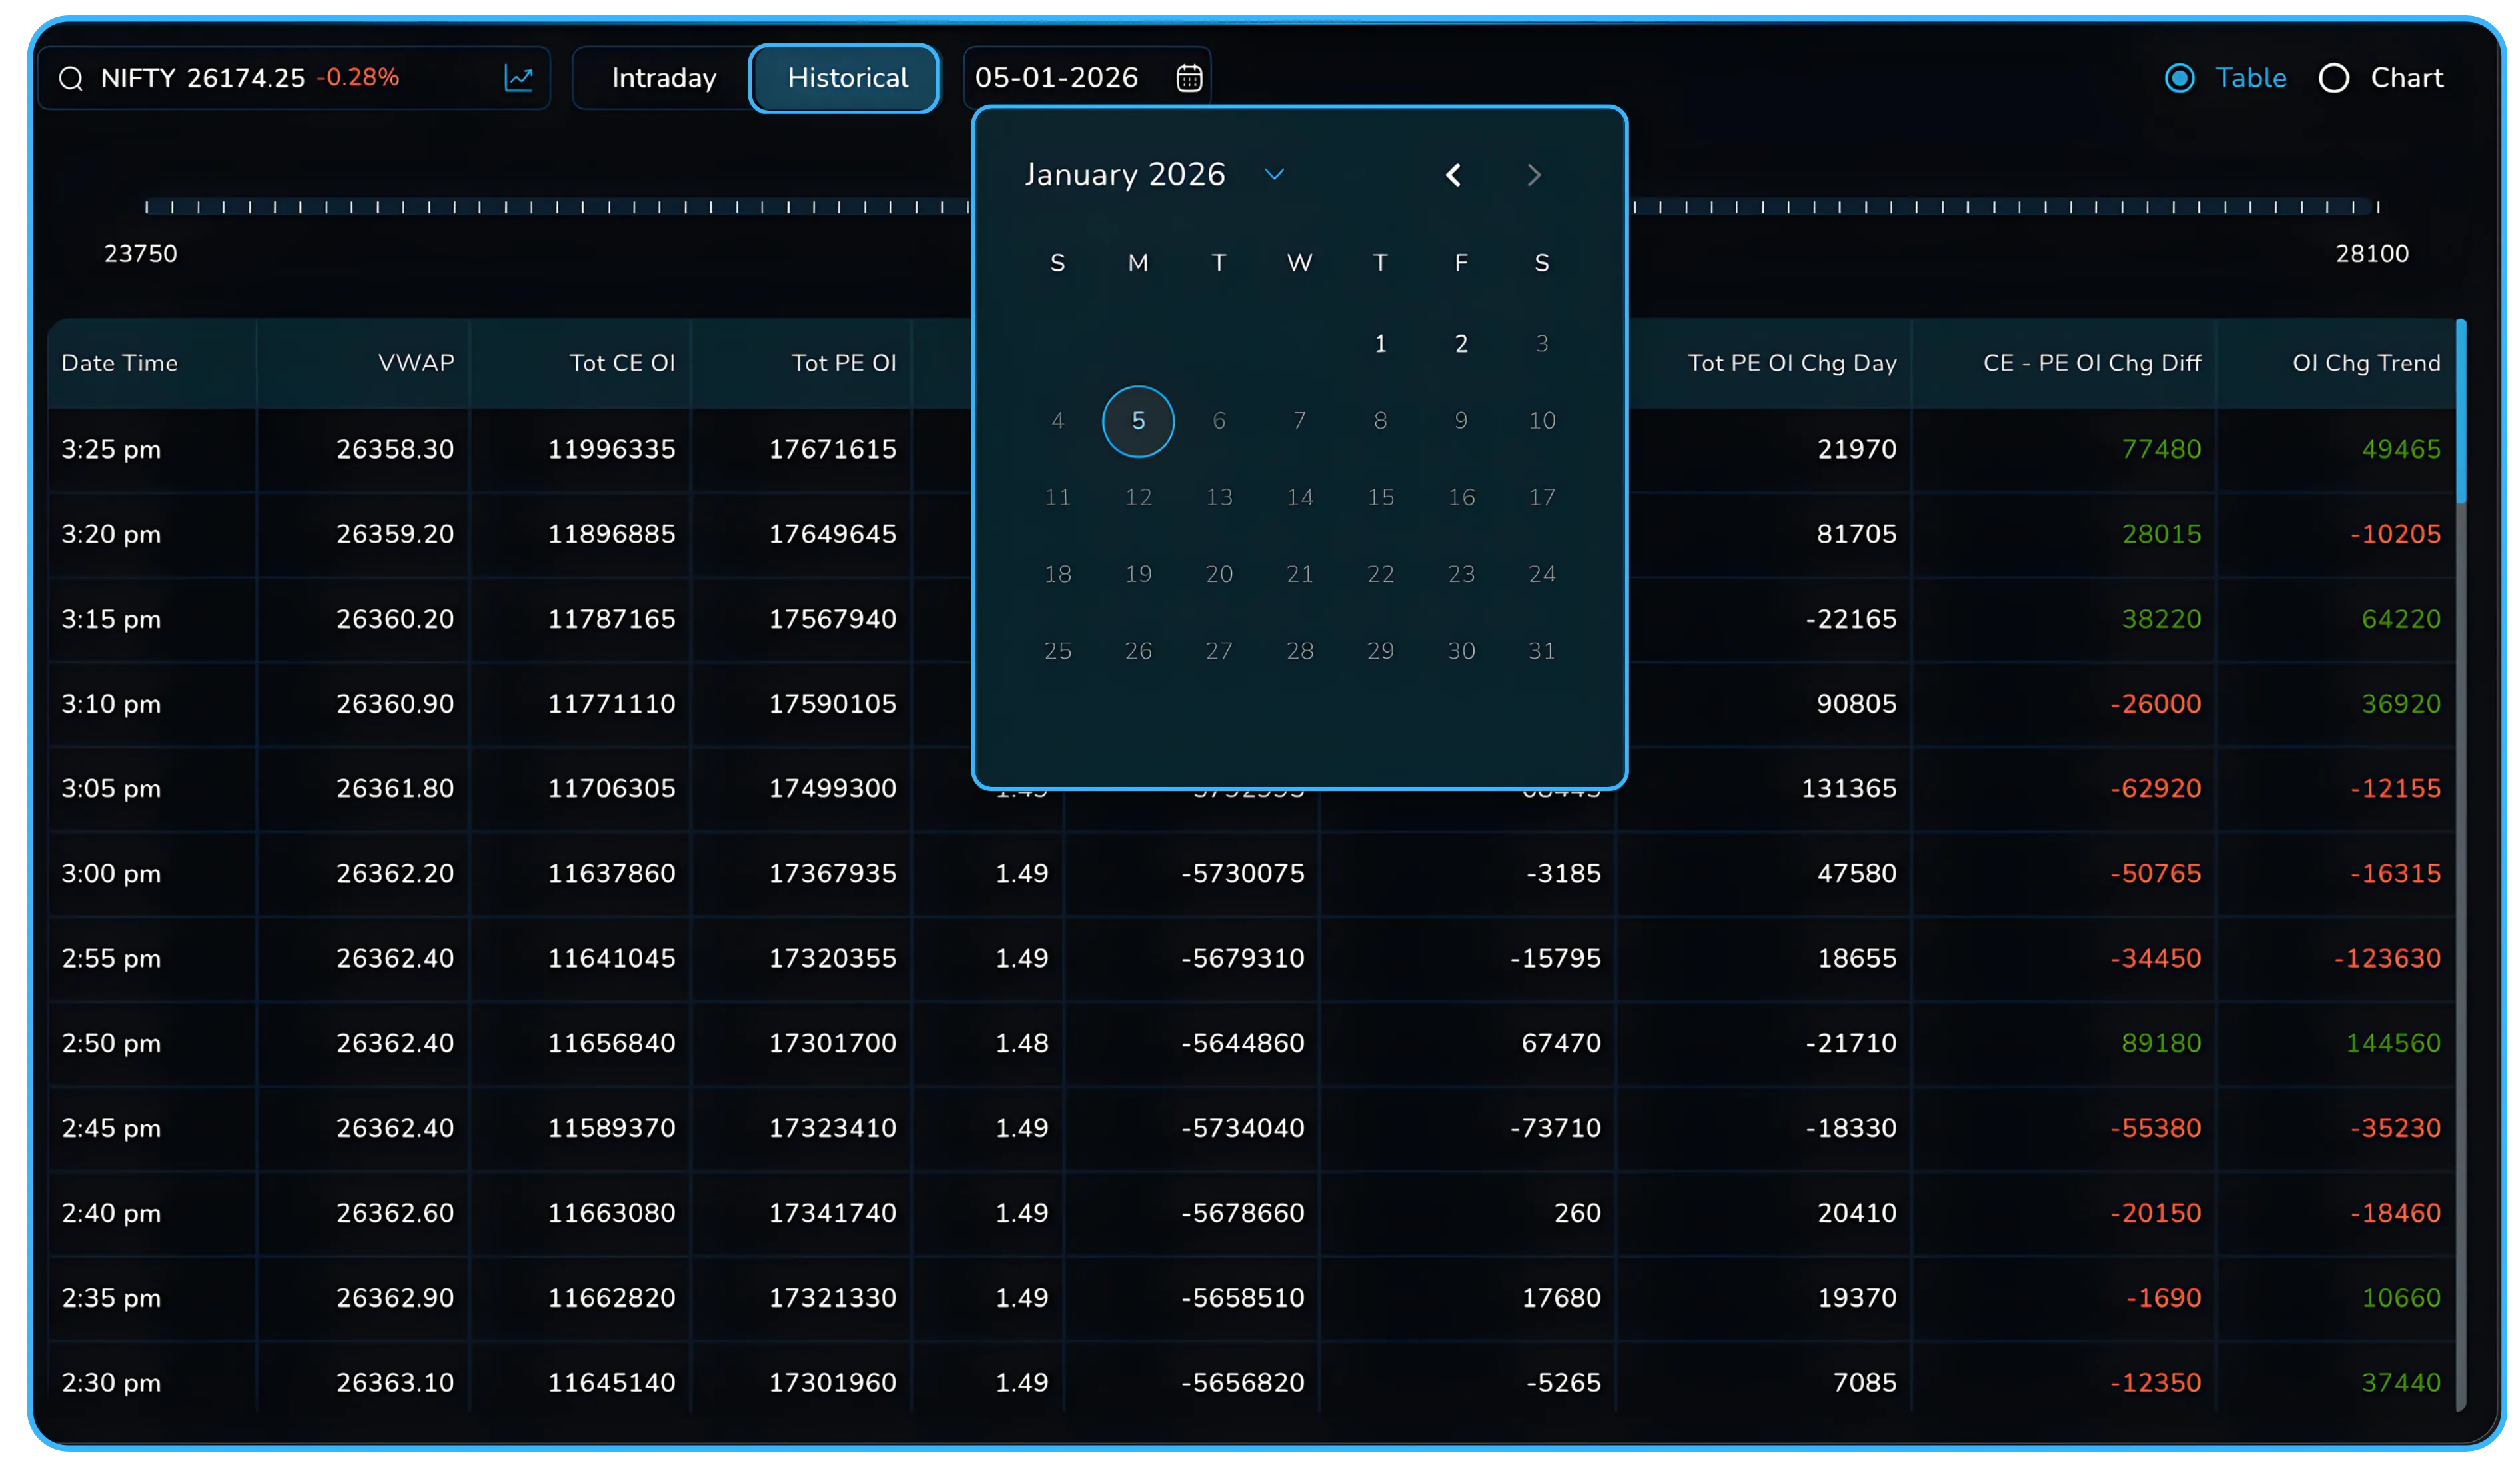
In Table view, each row represents a fixed time snapshot of the market. These snapshots update at regular intervals and show how positioning changes through the day or across a selected historical session. This view focuses on accuracy and detail. You can see the exact values for VWAP, total CE OI, total PE OI, the CE PE OI difference, and the OI change columns. This makes it easier to compare specific time points, track how fast positioning is changing, and understand whether the gap between calls and puts is widening or narrowing.
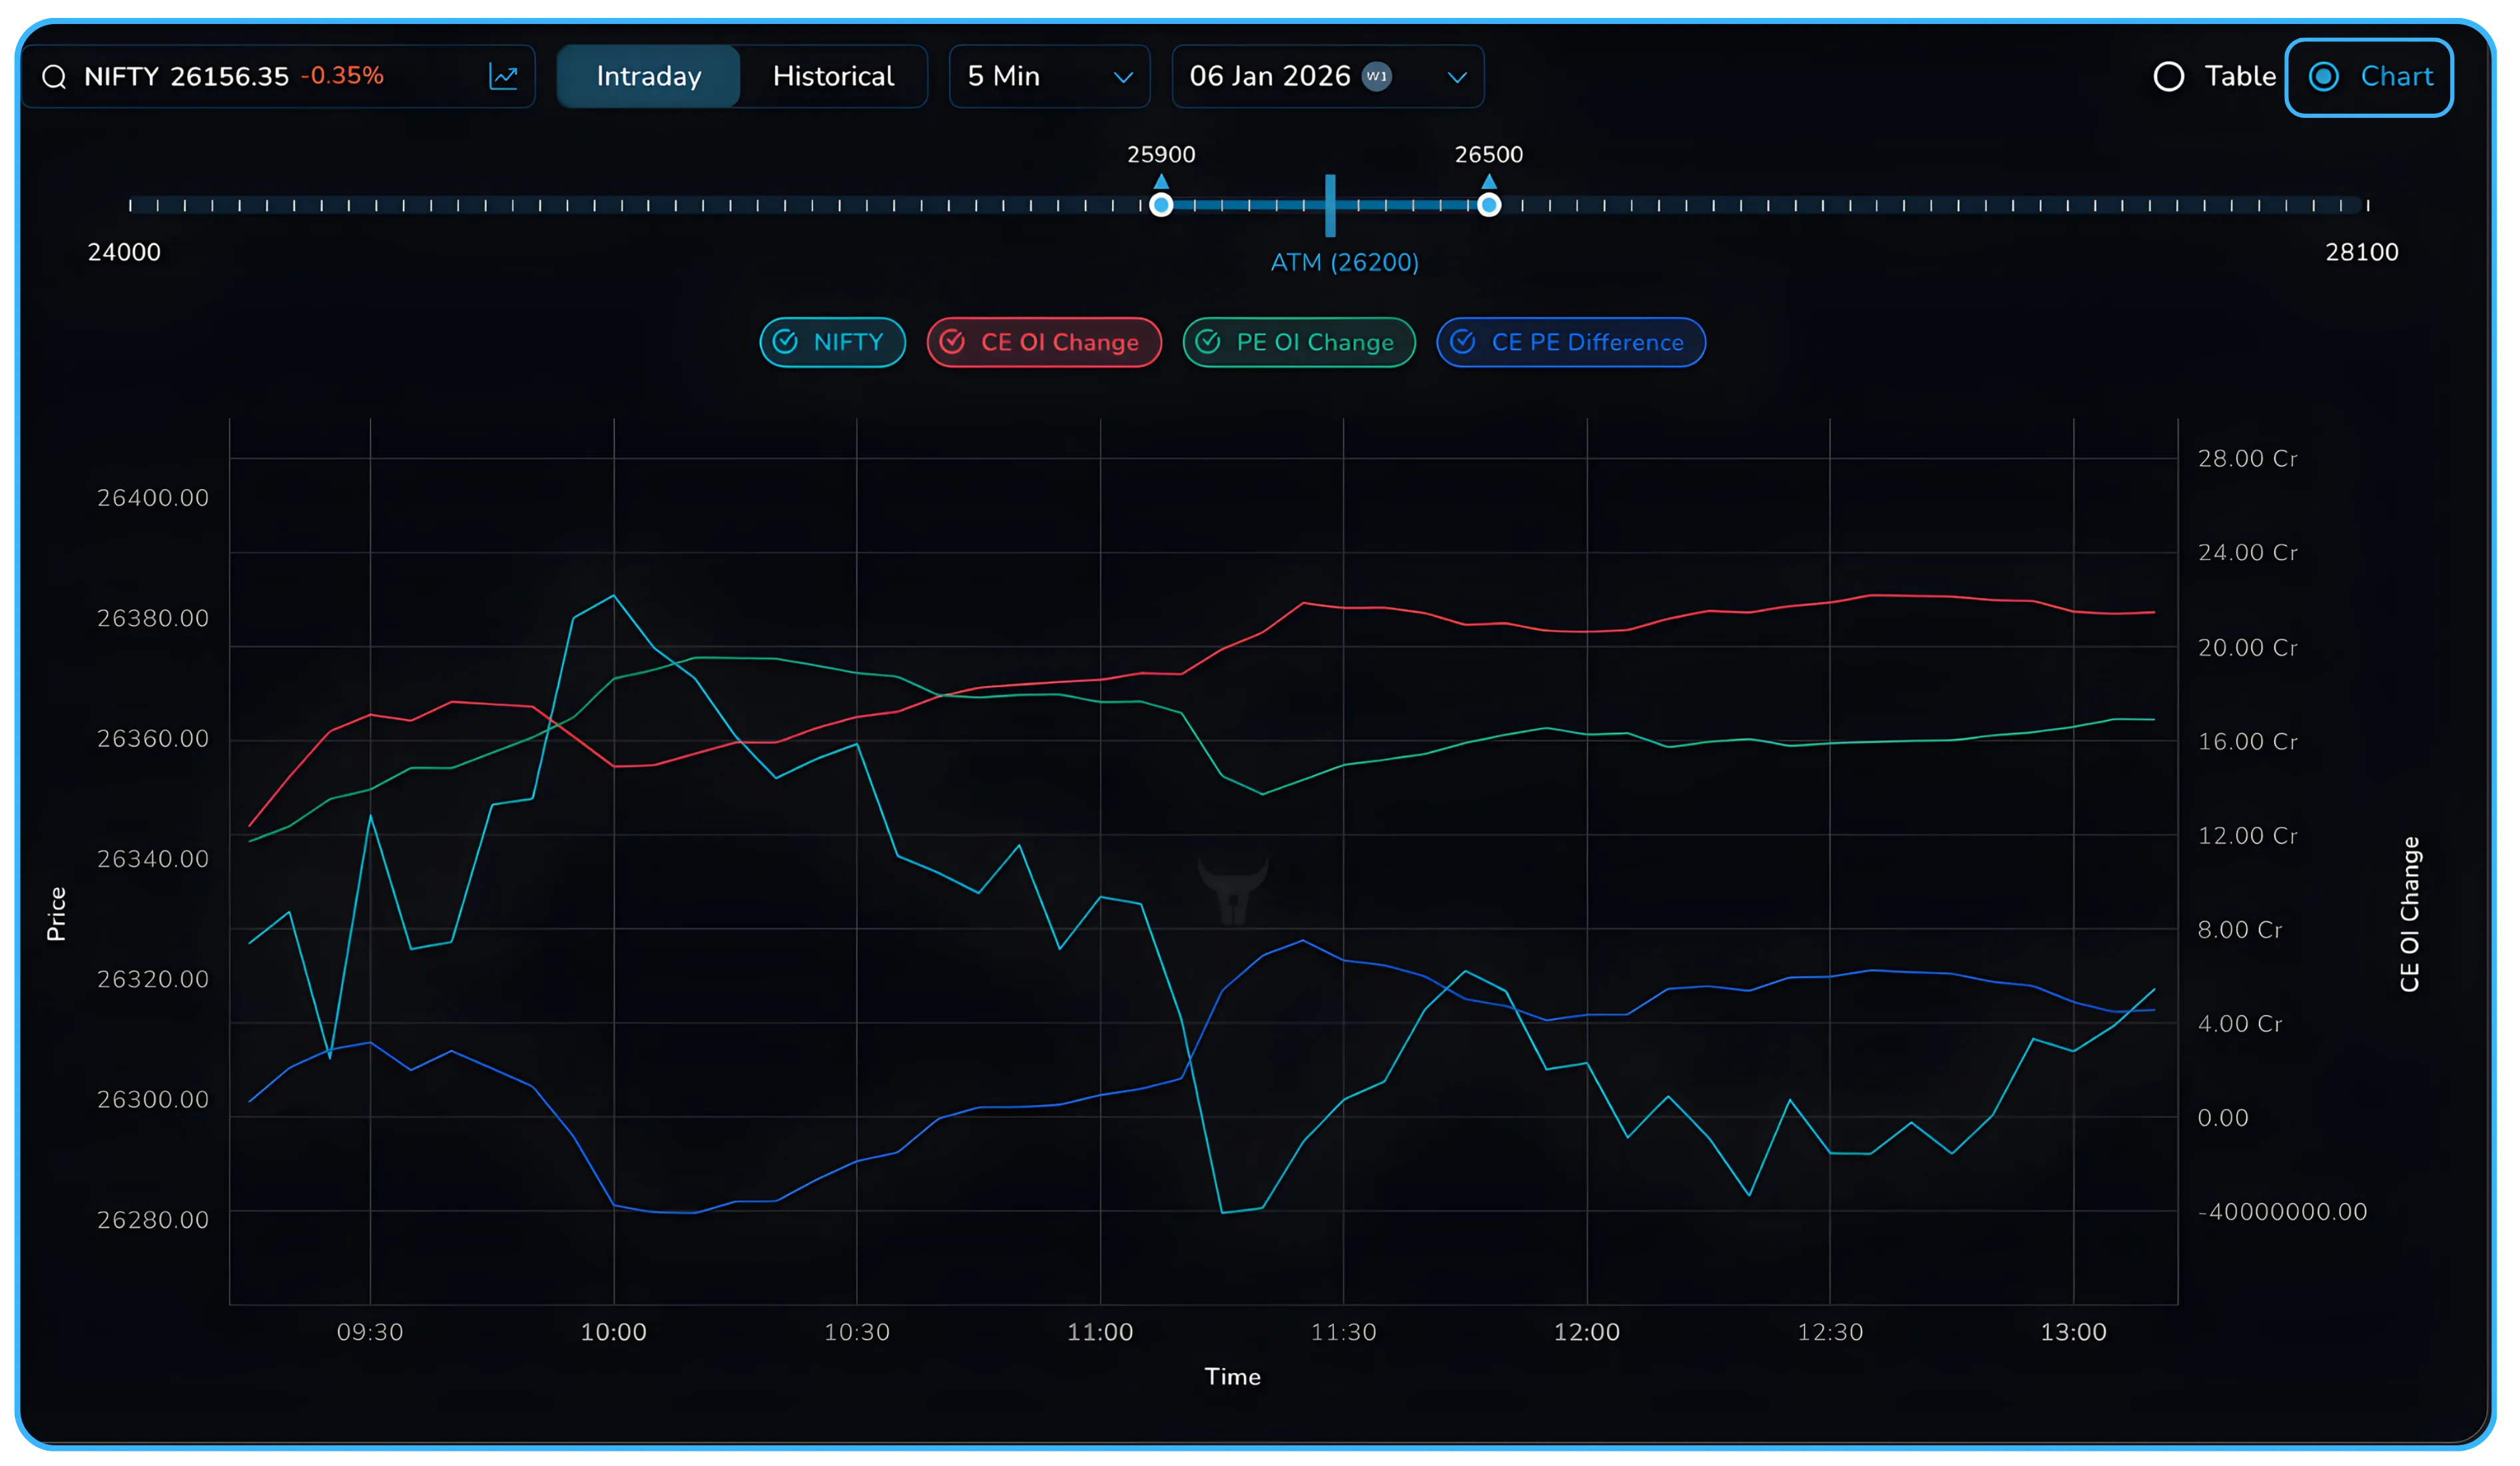
In Chart view, the same data is plotted visually over time using a line chart. Price, CE OI change, PE OI change, and the CE PE difference are shown together on a single chart. This view is useful when you want to understand behaviour rather than exact numbers. Trends, divergences, and sudden shifts in open interest become easier to spot, especially when price and OI do not move in the same direction.
Both views work with intraday and historical data. You can use intraday mode to track live changes during the trading session, or switch to historical mode to study how positioning evolved on previous days. Since the table and chart use the same underlying data, you can move between them freely based on whether you need precision or a faster read of market sentiment.
What you can control on this screen.
This view is not fixed or static. You can change what you see based on what you want to analyze in the securities market.
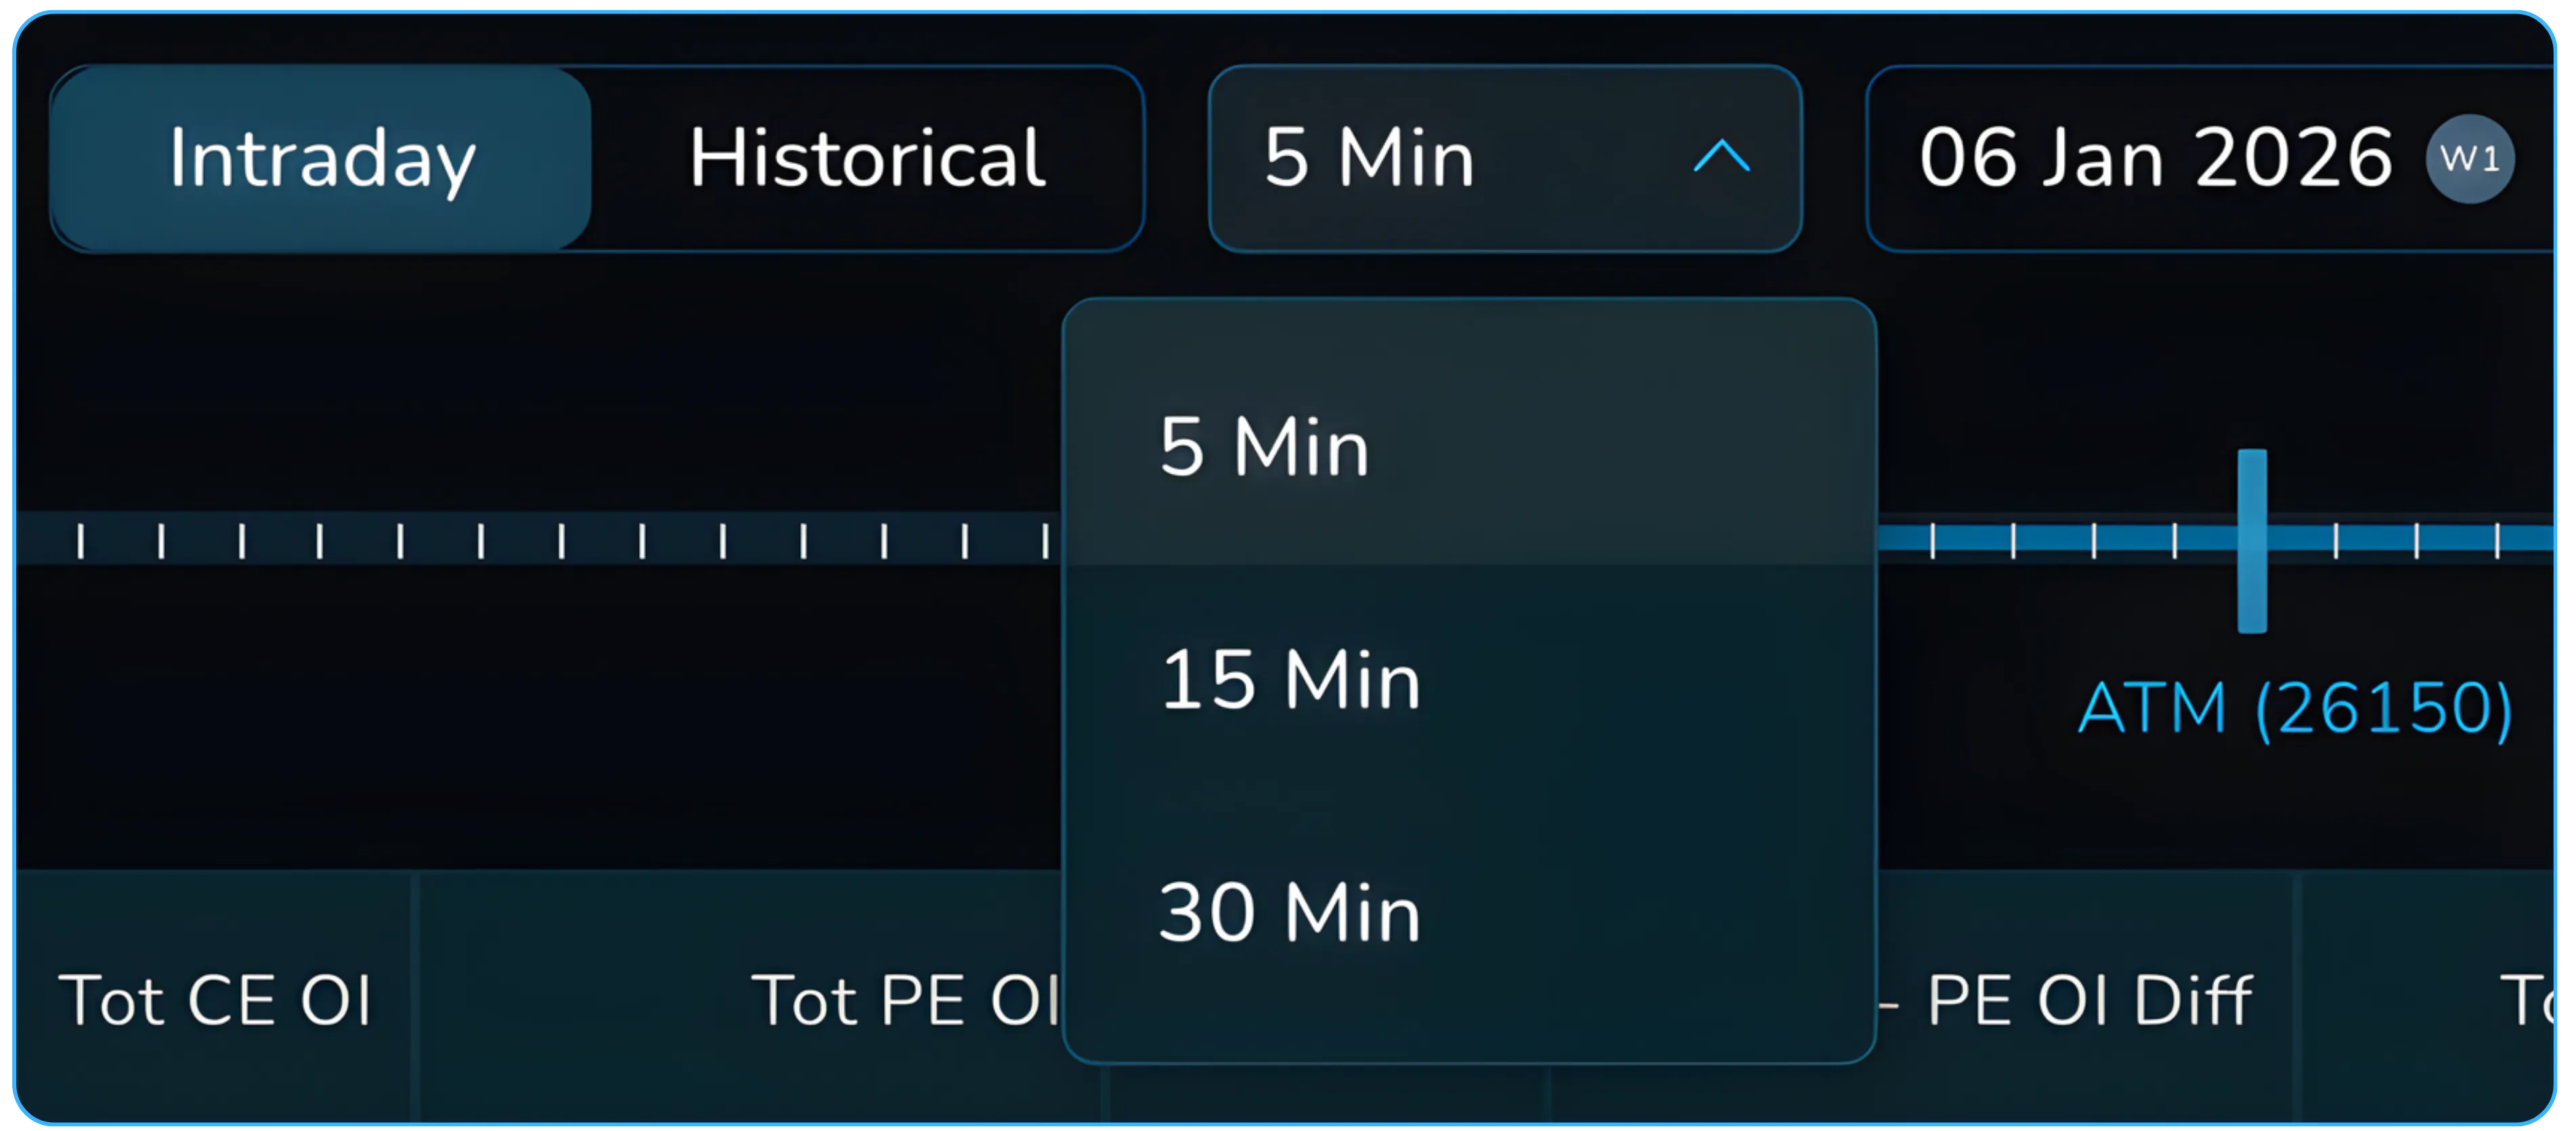
You can switch between Intraday and Historical modes at the top of the screen.
In Intraday mode, the table shows how the CE PE difference is changing live during the current trading session. This helps traders track how positioning builds, reduces, or flips as the day progresses.
In Historical mode, you can go back to any previous trading day and see the complete CE PE difference movement from market open to close. This is useful for understanding how market sentiment behaved before large moves or during volatile sessions.
In the same view, you can also change the time interval at which the data points update.
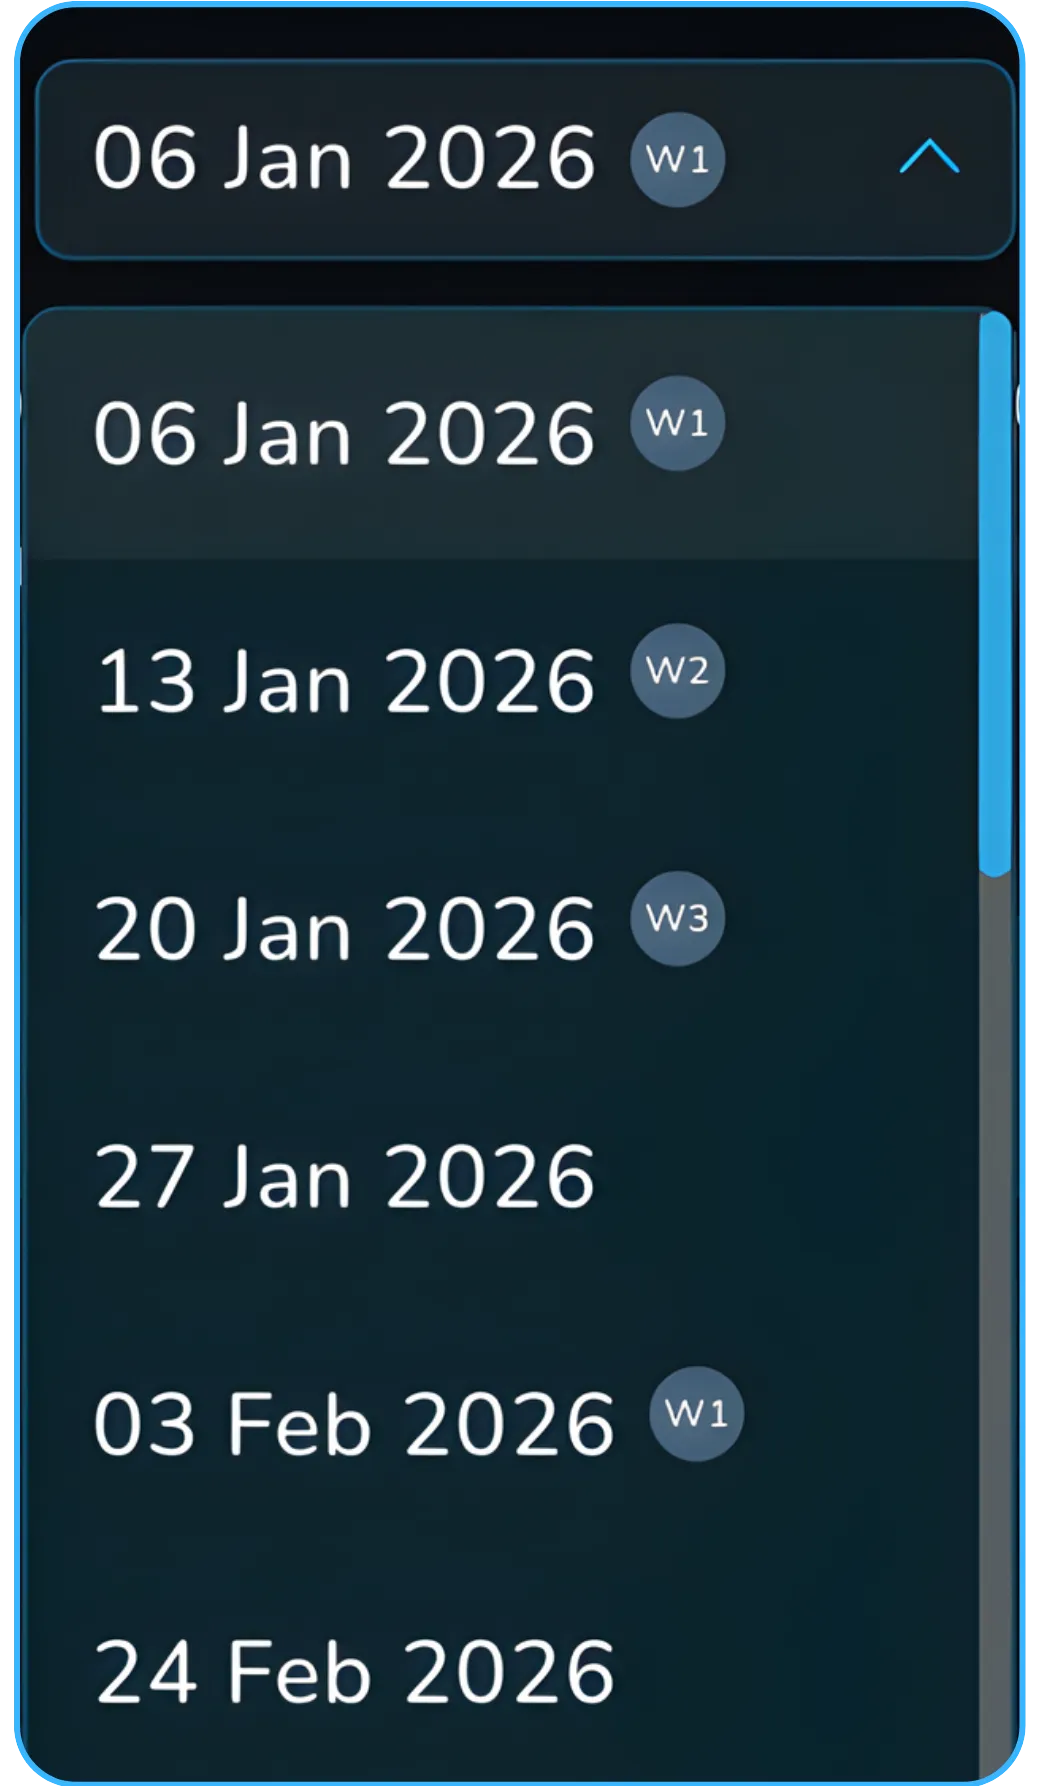
You can also change the expiry date you want to analyze. This allows you to compare how open interest positioning looks for different expiries instead of assuming all activity is focused only on the nearest one.
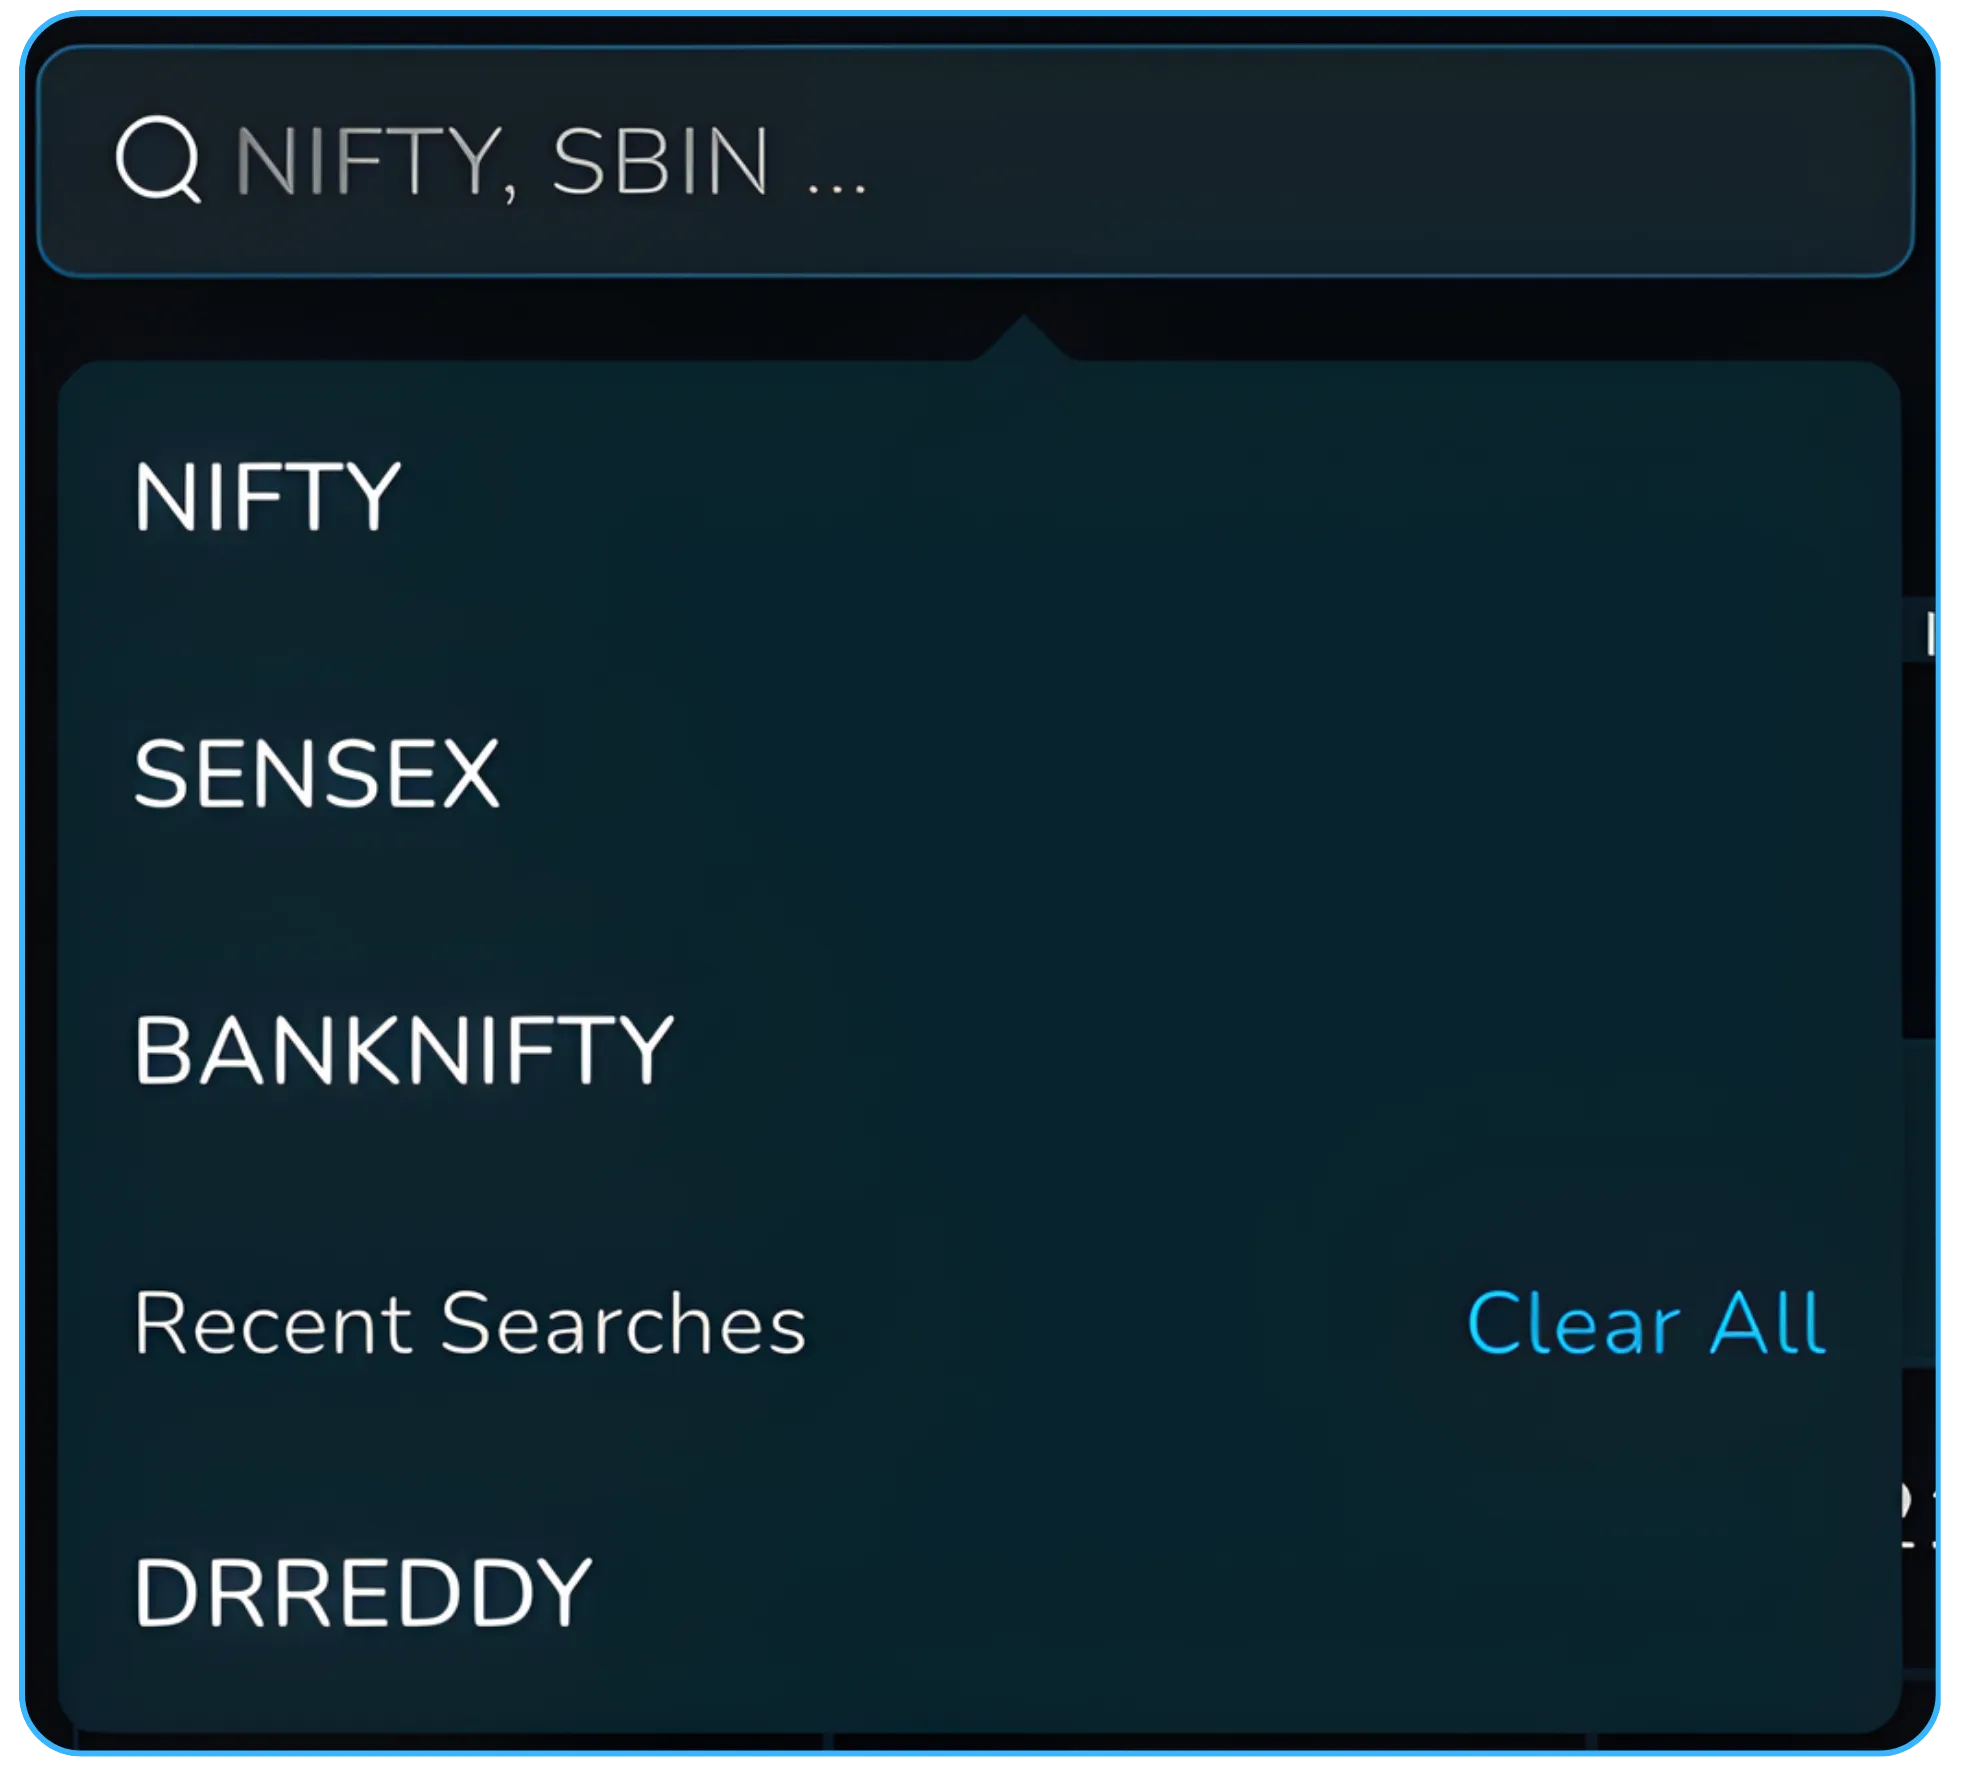
You can change the underlying asset or stock using the search bar. The same CE PE OI difference logic works for indices and stocks, allowing investors and traders to study market dynamics across instruments.
You can also configure which strike prices are included using the slider provided above the table.
All of these controls work together, so you can view intraday or historical CE PE OI difference for any selected script, expiry date, and strike range.
How traders typically use this view
| Market behaviour | CE–PE Difference | What it suggests | How traders use it |
|---|---|---|---|
| Steady up move | Positive and rising | Calls being added | Trend confirmation |
| Steady down move | Negative and falling | Puts being added | Downside continuation |
| Sideways market | Near zero | Balanced positioning | Range or premium strategies |
| Sudden shift | Rapid sign change | Positioning flip | Early warning |
This table is not a rulebook. It is a way to organise what you are seeing so decisions are based on context, not guesses.
Navigating to Total CE PE OI Difference
You can access this feature directly from the Analyze section.
- Log into your Tradejini CubePlus account using your registered email id and mobile number.
- Open NxtOption from the main menu.
- Click on the Analyze tab.
- Select Total CE PE Difference from the left panel.
- Choose the index or stock you want to track.
- Switch between Intraday or Historical as needed.
- Select the time interval that suits your trading style.
The data loads instantly and updates automatically during market hours.
From guessing sentiment to seeing it
The Total CE PE OI Difference view removes guesswork from open interest analysis.
You stop reacting only to price and start seeing how traders are positioning behind the scenes in the options market.
You get a clear view of whether calls or puts are gaining strength, whether that strength is increasing, and whether price agrees with it.
This does not replace charts or resistance levels. It adds context to them.
If you already trade using OI, VWAP, and option chain data, this view helps you do the same analysis faster and with fewer mistakes.
Open NxtOption, go to Analyze, and make the Total CE PE OI Difference view part of your regular market check.
Disclaimer: The information provided in our blogs is for informational purposes only and should not be construed as financial, investment, or trading advice. Trading and investing in the securities market carries risk. Always conduct your own research and consult with a qualified financial advisor before making any investment decisions. Past performance is not indicative of future results. Copyrighted and original content for your trading and investing needs.
© 2026 — Tradejini. All Rights Reserved.