


Every trader loves catching momentum but most get trapped in false breakouts. One reliable way to spot early direction is to study how a stock opens. This Intraday trading gap strategy 2–5% focuses on stocks that open 2–5% above or below their previous day’s close, confirming direction through volatility, volume, and intraday EMA crossover confirmation. It’s simple, systematic, and ideal for traders who want clarity at market open.
Finding the Right Stock
When the market opens, not every stock that moves is worth your attention. The first step is identifying stocks that open 2–5% above or below the previous day’s closing price using a gap up gap down trading strategy.
A gap smaller than 2% often means nothing significant has changed; it's just normal price fluctuation or “noise.” A gap larger than 5% can indicate overreaction where early traders may take profits quickly, causing false breakouts or reversals.
By focusing on this 2–5% window, you’re selecting stocks with a healthy mix of volatility and reliability where intraday continuation trends have a much higher chance of unfolding smoothly. Think of it as your “sweet zone”: not too quiet, not too wild, just the right level of momentum to trade confidently.
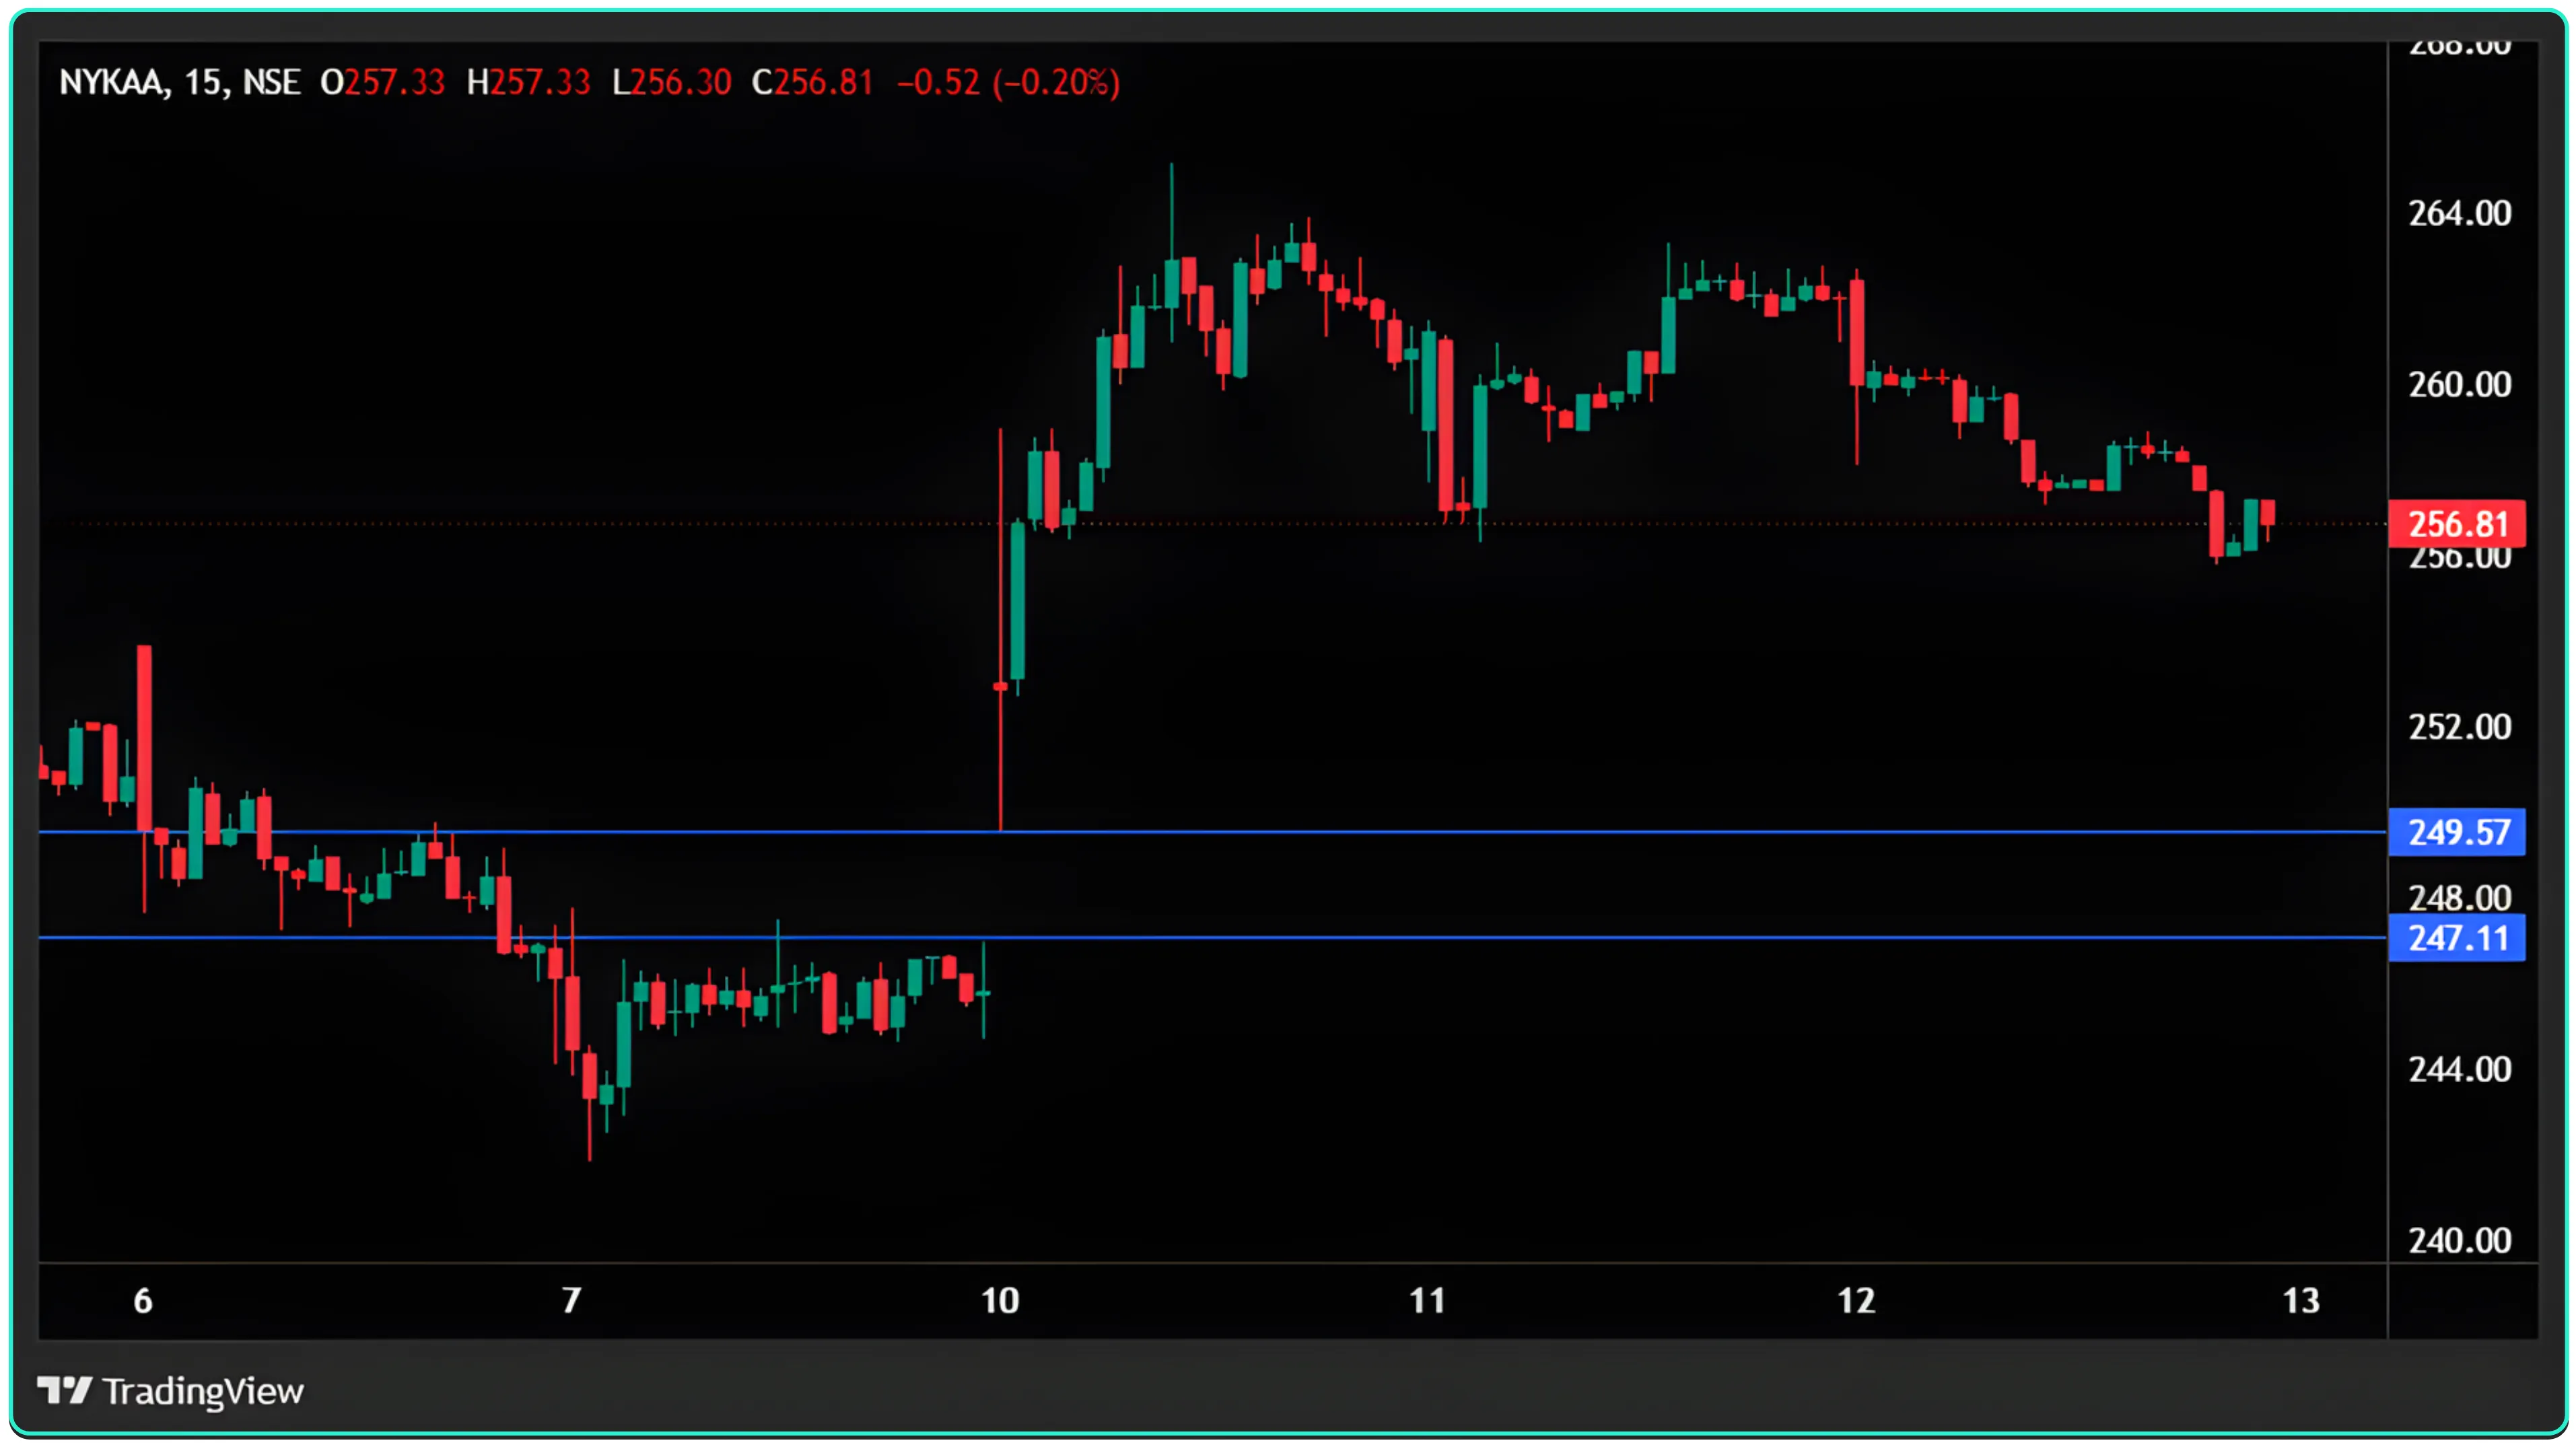
THE GAP UP
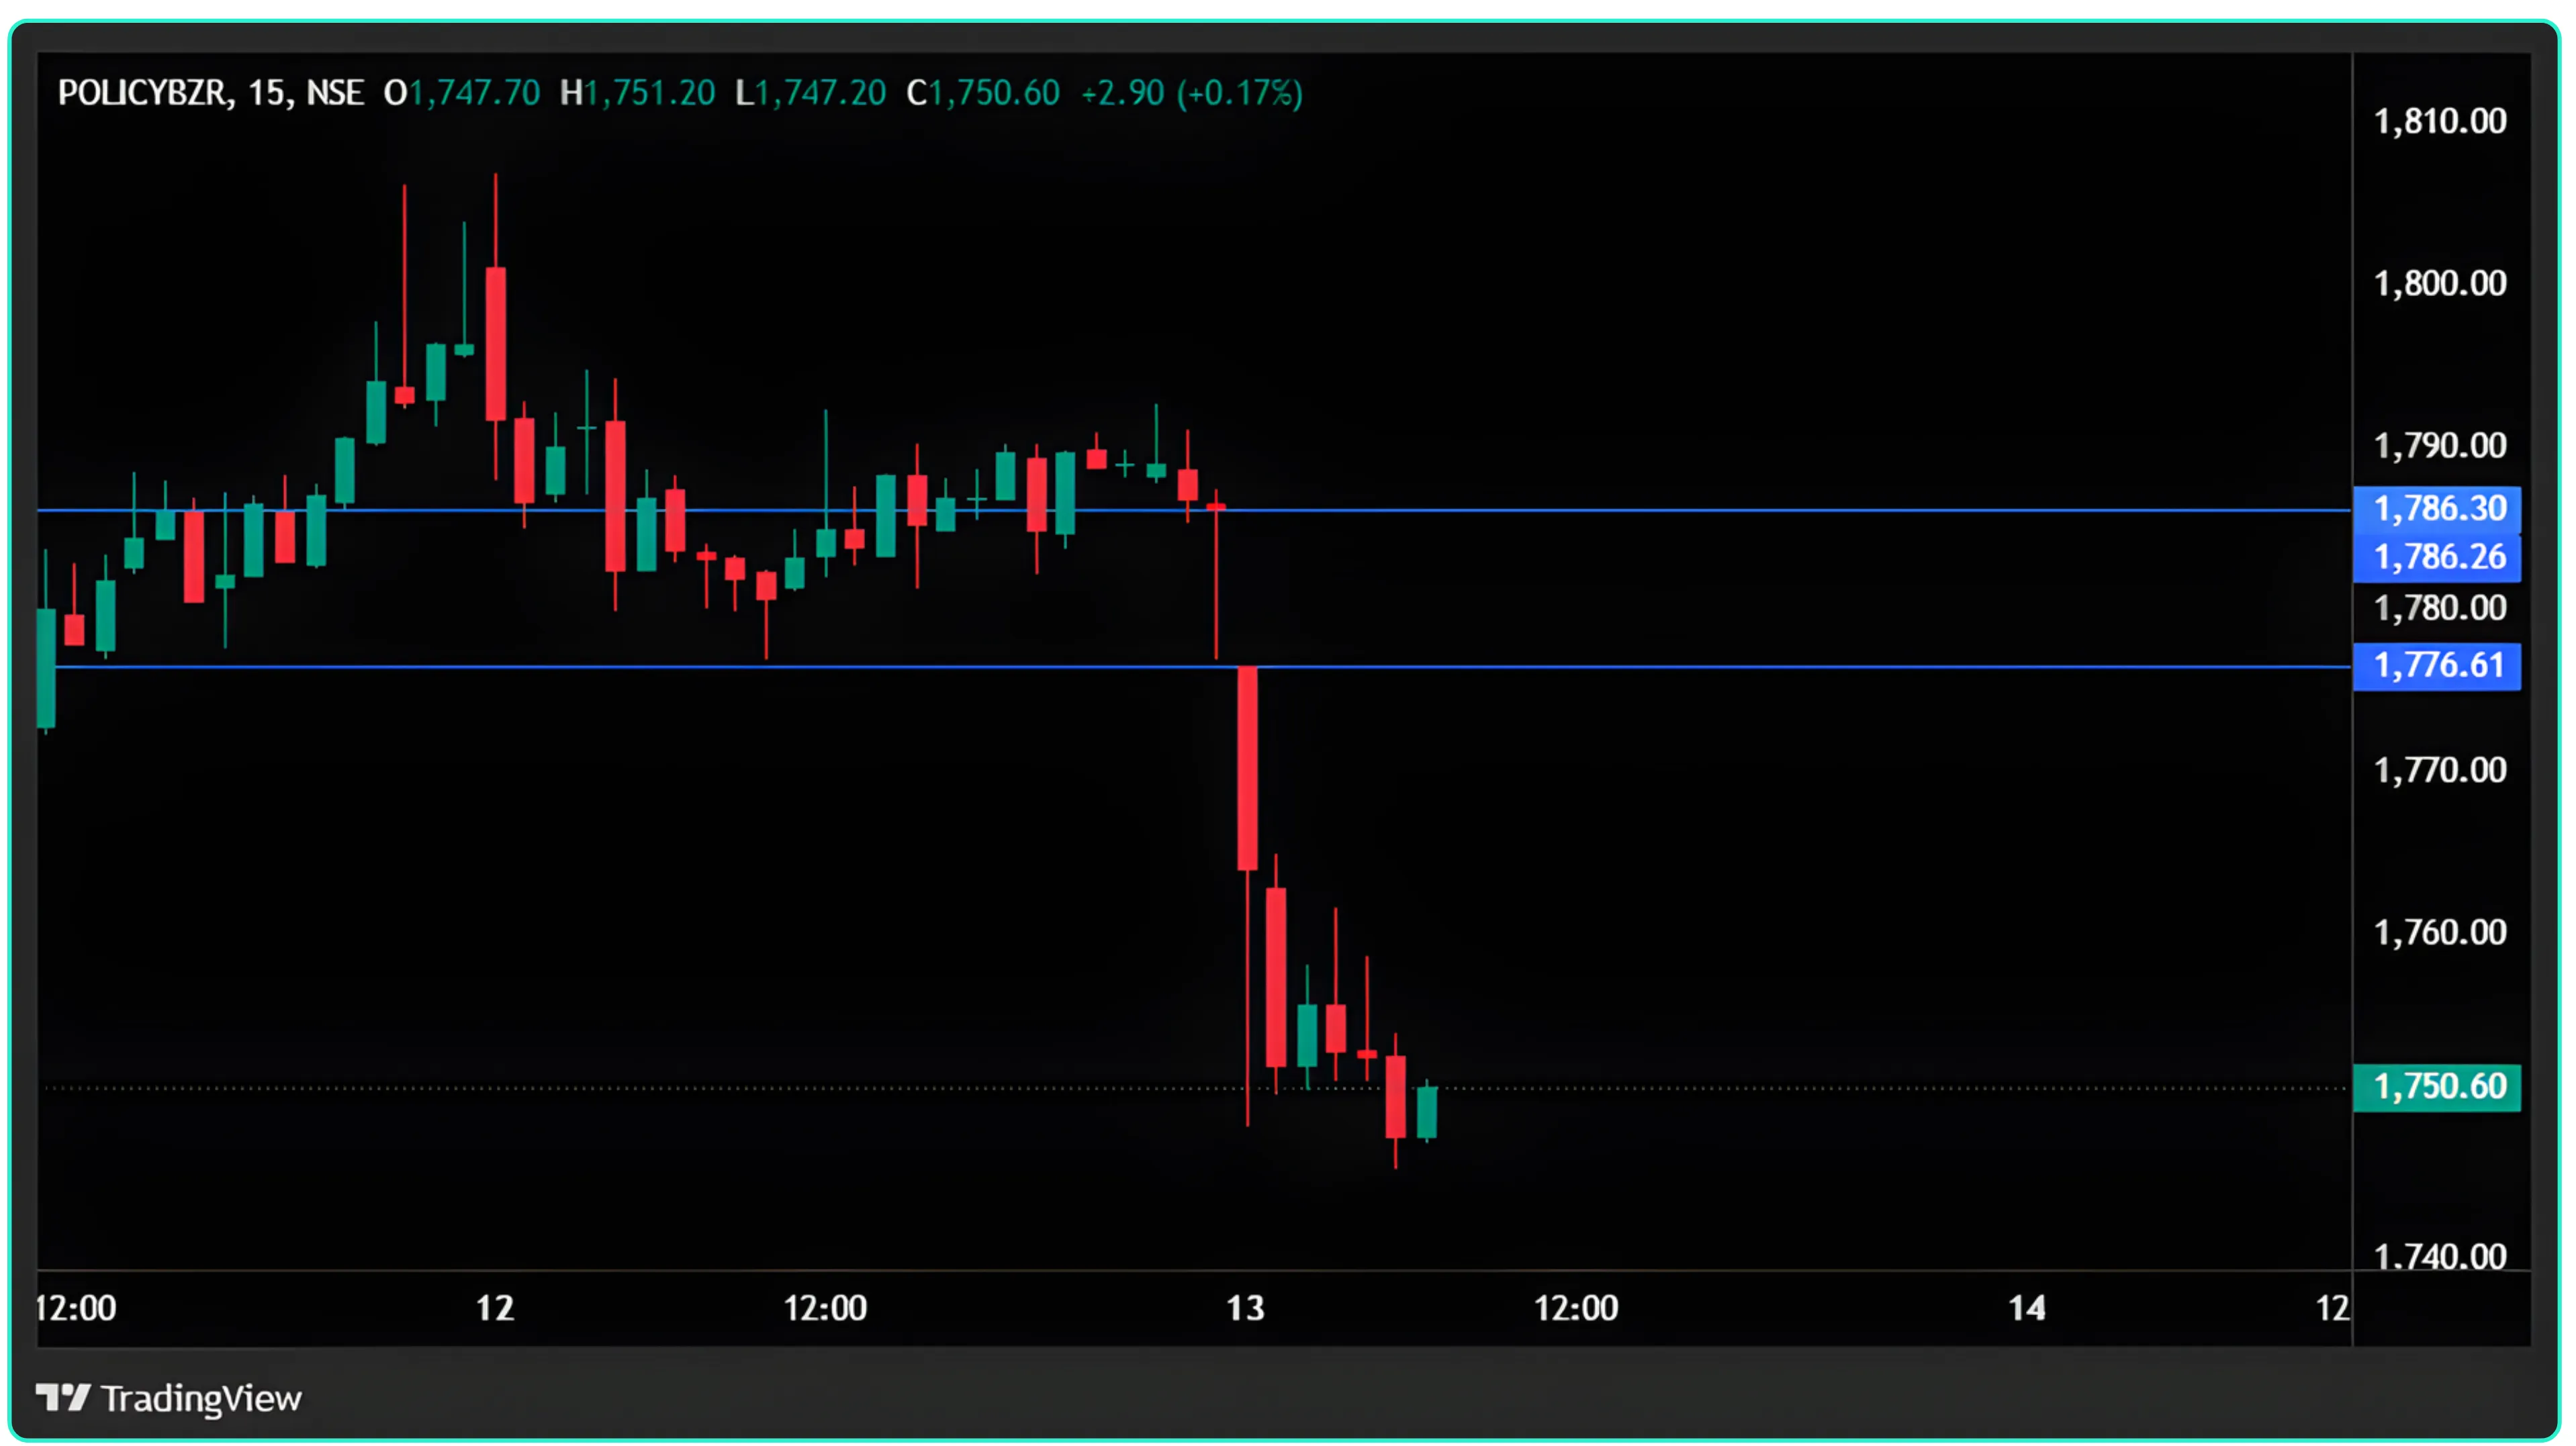
THE GAP DOWN
Volatility That Makes Sense
Just because a stock is moving doesn’t mean it’s worth trading. The key is to find controlled volatility intraday stocks that move enough to offer opportunity, but not so much that every candle feels like a gamble.
For this strategy, the ideal intraday volatility range is between 2% and 5%. If volatility is below 2%, the stock may not move enough to justify your risk or give clear entries. These setups often go sideways and waste time. If volatility spikes beyond 5%, the stock becomes too unpredictable: sharp whipsaws, sudden reversals, and big wicks can easily hit stop-losses even when your direction is right.
The 20 EMA Filter
The 20 EMA (Exponential Moving Average) is one of the most reliable tools to confirm whether a stock’s gap has real momentum or is just temporary excitement. Think of it as your reality check. It tells you whether the market truly supports the direction of the gap.
Once the stock opens with a gap-up or gap-down, give it a few candles to settle and then observe how the price behaves around the 20 EMA on the 5-minute or 15-minute chart. If the price crosses and holds above the 20 EMA, it shows that buying strength is sustained, the bulls are in control and the gap-up is likely to continue. This is your green light for long setups, especially when backed by volume. If the price crosses and stays below the 20 EMA, it signals that selling pressure dominates bears are taking over, and the gap-down move has the
potential to extend further.
Executing the Trade
Once you’ve confirmed direction using price action, volume, and the 20 EMA, it’s time to execute but with precision, not impulse.
The idea here is simple: wait for confirmation, enter with structure, and manage the trade with discipline.
Entry:
Enter only when the price breaks and sustains above or below the 20 EMA after the initial gap. Don’t rush on the very first breakout candle, let it close beyond the EMA and confirm strength. This ensures you’re entering a move that has real backing, not just a momentary spike.
Volume should remain strong during the breakout; that’s your second green light.
Stop-loss:
Set your stop-loss just beyond the 20 EMA or below the last swing low/high depending on your direction. This placement works because if price cuts back through the EMA decisively, it means momentum is fading, the very condition you’re avoiding.
Keeping your stop near structure helps protect capital while allowing the trade room to breathe.
Target:
Aim for 1.5 -- 2x your initial risk, or better yet, trail your stop as long as the price continues to respect the 20 EMA.Trailing stops help you lock in profits during extended trends without needing to guess the top or bottom. If the price starts closing opposite to your direction (below EMA for longs, above for shorts), it’s your cue to exit gracefully.
Also Read: Candlestick Patterns That Signal Market Indecision
Why This Strategy Works
This setup works because it filters noise at every level price gap, volatility, volume, and momentum. You’re not predicting; you’re reacting to proof. By waiting for EMA confirmation after a controlled gap, you align with both overnight sentiment and intraday direction, giving your trades a logical edge.
Key Takeaways
Stocks opening 2–5% above or below the previous close offer the best balance of momentum and stability for intraday trades.
Gaps smaller than 2% lack significance, while gaps beyond 5% often lead to volatility traps and false breakouts.
Ideal intraday volatility should stay in the 2–5% range to ensure smooth continuation moves.
The 20 EMA acts as a powerful confirmation tool to validate whether the gap has real strength or is likely to fade.
Entries are taken only when price breaks and sustains above/below the 20 EMA with strong volume.
Stop-losses are placed just past the 20 EMA or recent swing structure to protect capital while letting trades breathe.
Targets follow a 1.5–2x risk-to-reward or a trailing stop as long as price respects the EMA.
The strategy works because it filters out noise and focuses on controlled gaps + momentum confirmation rather than prediction.
Want to know about a company? Check its financials step by step on CubePlus
Disclaimer: The information provided in our blogs is for informational purposes only and should not be construed as financial, investment, or trading advice. Trading and investing in the securities market carries risk. Always conduct your own research and consult with a qualified financial advisor before making any investment decisions. Past performance is not indicative of future results. Copyrighted and original content for your trading and investing needs.
© 2025 — Tradejini. All Rights Reserved.


