


When it comes to spotting potential reversals in price trends, few visual patterns offer as much clarity as the head-and-shoulders formation. More than just a chart shape, it reflects a deeper shift in market psychology also, from rising optimism to growing hesitation and eventual reversal. Whether markets are based on emotion, fundamentals, or momentum, this pattern captures the point where strength starts to give way. Before leaping into definitions and strategies, let us first examine the underlying story the head-and-shoulders pattern conveys—and why it continues to be a go-to signal for traders of all styles and timeframes.
What is a head-and-shoulders top?
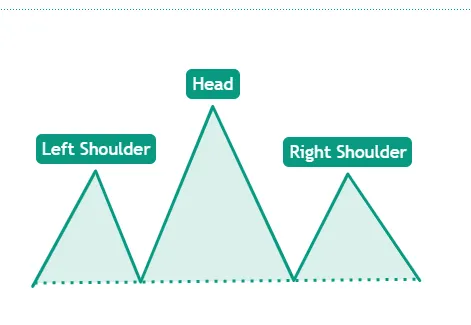
Imagine you are looking at a chart with prices moving higher. Suddenly, three peaks form—like a mountain with one tall peak in the middle and two shorter ones on either side. This is the classic shape of a head-and-shoulders top:
Left Shoulder (LS)—A peak formed after a strong rally.
Head—A higher peak that breaks above the left shoulder.
Right Shoulder (RS)—A peak that is usually similar in height to the left shoulder but lower than the head.
The pattern is completed by a line drawn under the two low points between the peaks—this is called the neckline.
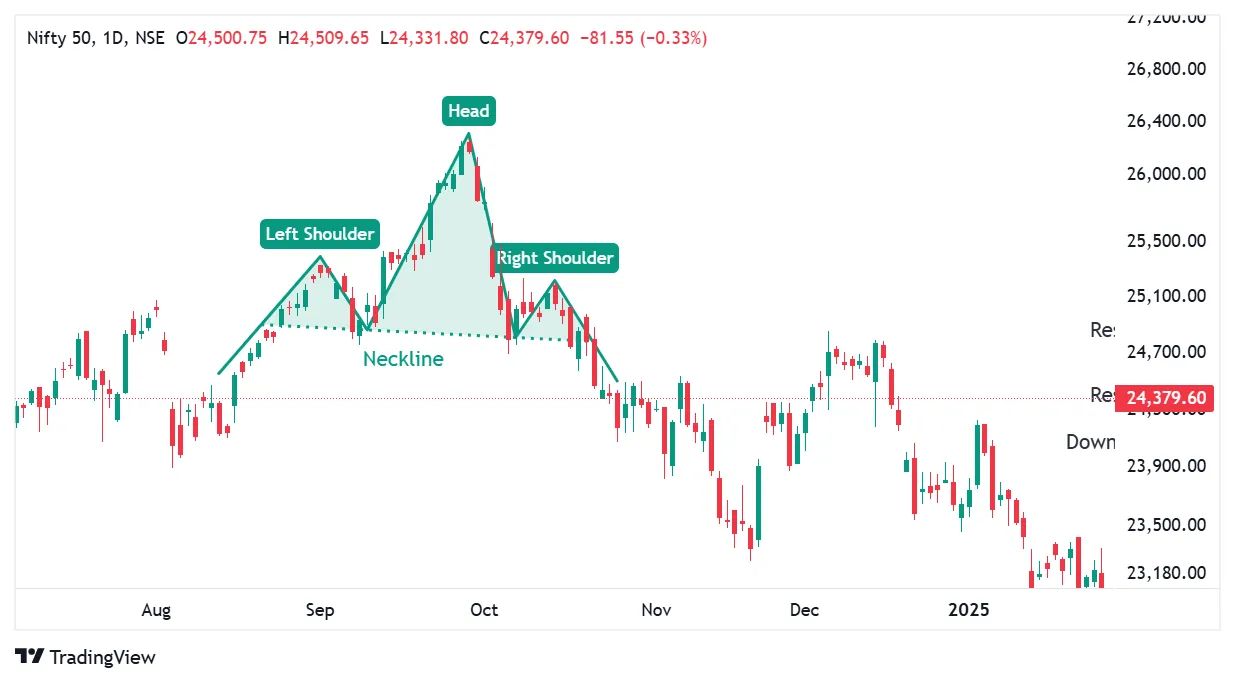
Head and shoulder top on the real chart
Once price breaks below the neckline, the pattern is considered confirmed. This signals a potential trend reversal from bullish to bearish.
What is a head-and-shoulders bottom?
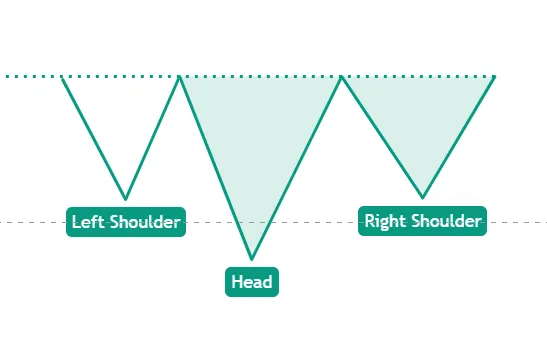
Now flip the chart upside down in your mind. Instead of three peaks, you are looking at three dips in the price, with the middle one being the lowest. This is the head-and-shoulders bottom, and it often appears after a downtrend—signaling that the trend might be about to turn upward.
Here is how it breaks down:
Left Shoulder (LS)—The price drops and then bounces back a bit.
Head—A deeper drop follows, reaching a new low before recovering.
Right Shoulder (RS)—A smaller dip forms, usually similar in depth to the left shoulder but higher than the head.
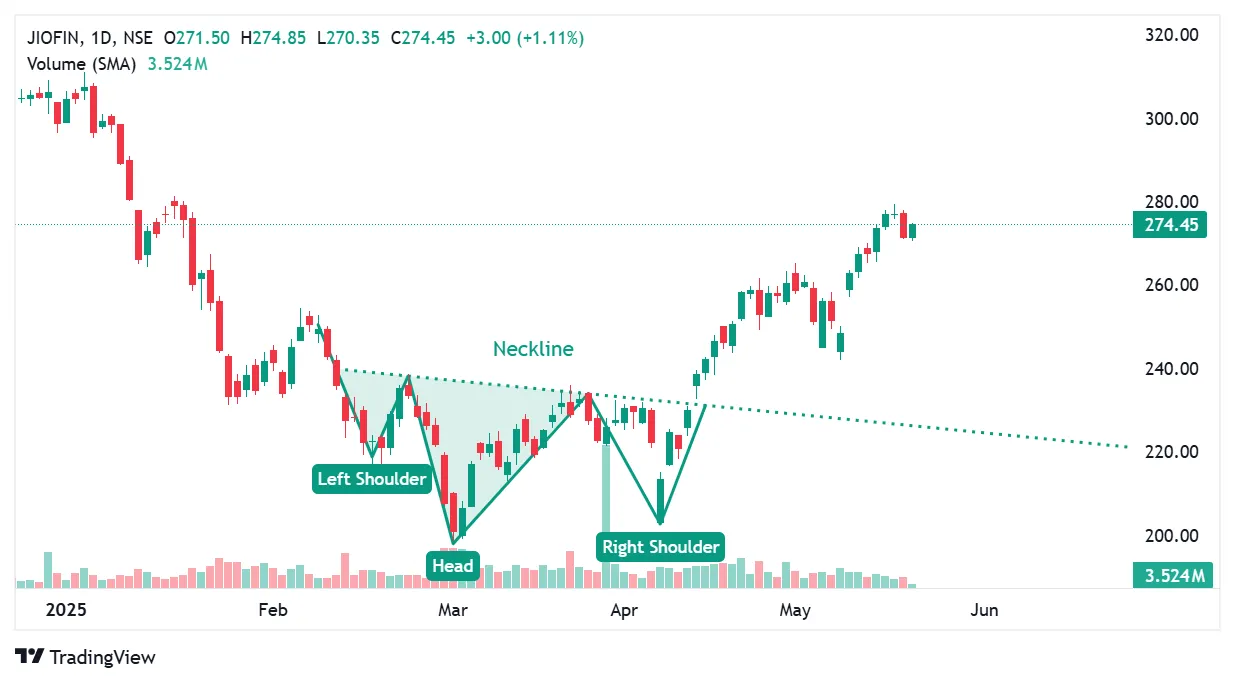
Head and shoulder bottom on the real chart
Once the price breaks above the neckline with good volume, the pattern is considered confirmed. This breakout suggests that the downtrend may be over, and a new upward trend could be starting.
Time Frames and the Head and Shoulders Pattern
The head and shoulders pattern is not limited to just one type of chart. You can spot it on intraday charts , as well as on daily, weekly, or even monthly charts.
But here is something important to remember: the longer the time frame, the more weight the pattern tends to carry. A head and shoulders formation on a weekly chart often signals a more significant trend change than the same pattern on a 10-minute chart.
That said, it is not about choosing the ‘best’ time frame—it is about choosing the right one for your trading goals.
If you are a day trader, you might focus on short-term charts. If you are a swing trader or investor, daily or weekly charts may suit you better.
In short, pick a time frame that matches your trading style, and look for patterns that are clearly visible and well-formed.
Head and shoulder strategy
Let us now understand how to implement the head and shoulders strategy effectively. In the steps below, we will explore how to identify, confirm, and trade this classic reversal pattern.
Head and shoulder Top (Bearish strategy)
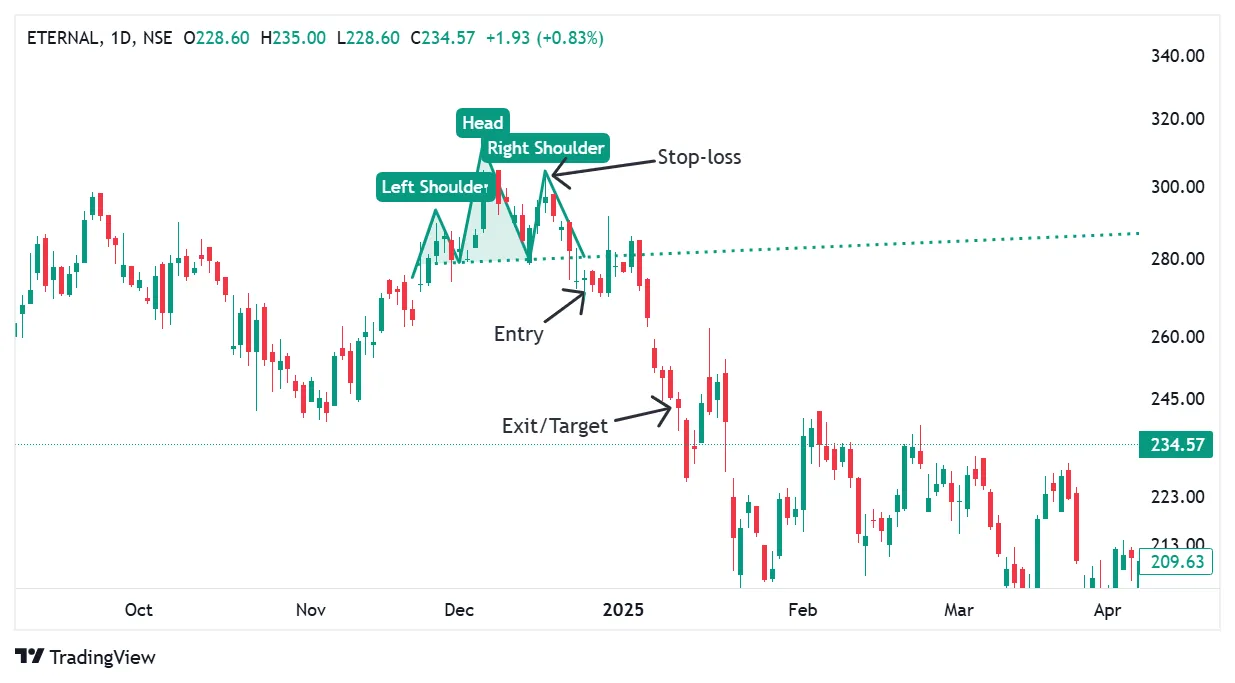
Head and Shoulders Trade Setup on ETERNAL chart (Nov2024–Dec2024)
Entry (Sell Position)
Enter a sell position when the price breaks below the neckline after forming the right shoulder.
Entry level: 275
Target (Exit Point)
Option 1: Exit around 246, where earlier support was observed
Option 2: Measure the height from the head to the neckline and and same set as target from neckline.
Stop-loss
Place the stop-loss above the right shoulder
Stop-loss level: 302
Head and shoulder bottom (Bullish Strategy)
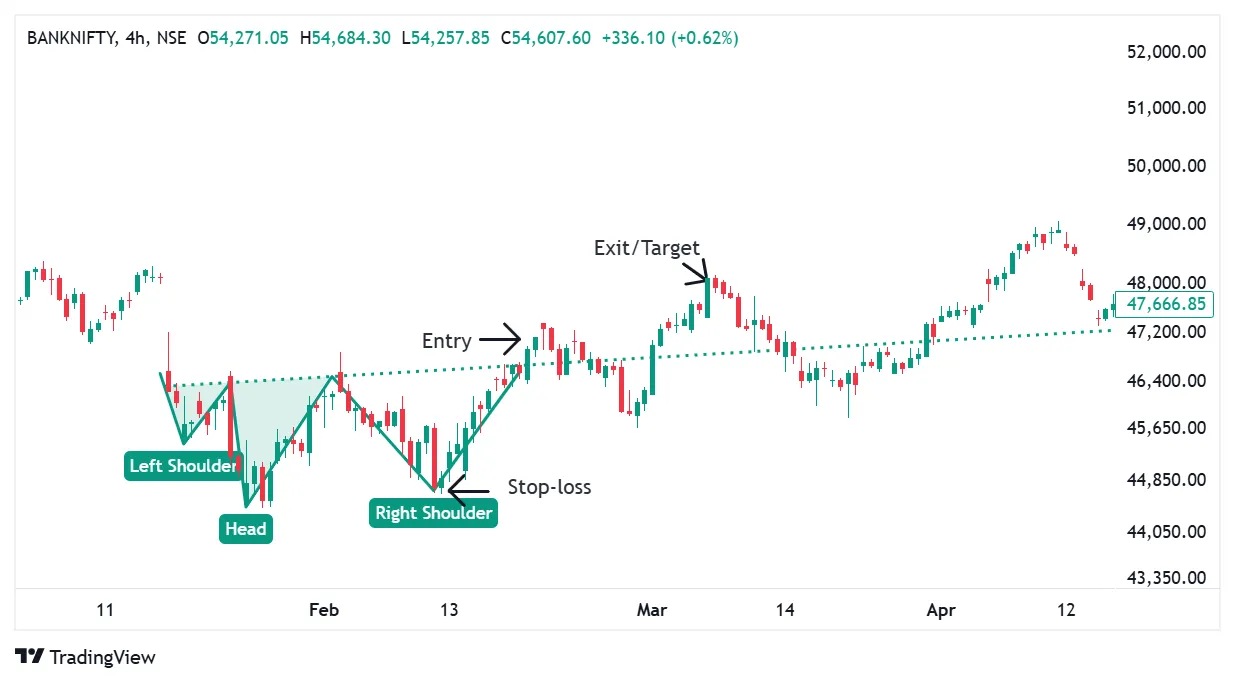
Head and Shoulders Trade Setup on Bank Nifty chart (Jan 2024 – Feb 2024)
Entry (Buy Position)
Enter a buy position when the price breaks above the neckline after forming the right shoulder.
Entry level: 46870
Target (Exit Point)
Exit around 48100, where the earlier swing high and resistance zone was placed
Stop-loss
Place the stop-loss below the right shoulder
Stop-loss level: 44700
The Psychology Behind the Pattern
To truly grasp why the double top and double bottom patterns work, we need to understand the mindset of smart money—mutual funds, hedge funds, and institutional investors—who often drive price movements.
Head and Shoulders Top (Bearish Reversal)
After a strong uptrend, prices form a peak (left shoulder) as institutional investors begin taking profits. A fresh rally follows, driven by renewed optimism, forming a higher peak (the head). However, this new high is met with stronger selling pressure. The final rally attempt (right shoulder) fails to reach the head’s level, reflecting weakening momentum. When price breaks below the neckline, it confirms that sellers are taking control and a bearish reversal is likely.
Inverse Head and Shoulders (Bullish Reversal)
In a downtrend, prices form a low (left shoulder) as buyers test the waters. A deeper fall follows (the head) but attracts stronger accumulation. The final dip (right shoulder) fails to reach the previous low, signaling that sellers are losing strength. Once price breaks above the neckline with volume, it confirms growing buyer conviction and a potential bullish reversal.
Performance and Insights
From a performance point of view, the head-and-shoulders top performs best when:
It appears after a strong uptrend (for a top) or downtrend (for a bottom).
The left shoulder is higher than the right.
The neckline is horizontal (leads to more predictable breakouts).
Top: Weak volume on the right shoulder shows fading buyer interest.
Bottom: Rising volume on the right shoulder signals returning buyers.
Head-and-shoulders tops have these characteristics, making them one of the most reliable for reversal signals.
Common Mistakes and Traps
Premature Entries: Entering before confirmation (neckline break) can lead to false signals.
Ignoring Volume: While not mandatory, volume gives context—ignore it at your own risk.
Misidentifying Patterns: Some formations resemble head-and-shoulders but lack symmetry or trend context. Always confirm shape and position in the trend.
Not Just a Pattern
The head-and-shoulders pattern is more than just a technical formation—it tells a deeper story of changing market sentiment. It marks the shift from confidence to hesitation, and finally, to reversal. Whether it is a top or a bottom, this pattern captures the moment when the prevailing trend begins to weaken and smart money starts to reposition. Backed by volume and clear structure, it provides traders with early warning signals and actionable setups. By understanding the psychology behind each shoulder and the neckline, traders can avoid emotional decisions and instead respond with clarity. It is not just a pattern—it is insight.
Disclaimer: The information provided in this blog is for informational purposes only and should not be construed as financial, investment, or trading advice. Always conduct your research and consult with a qualified financial advisor before making any investment decisions. Past performance is not indicative of future results.