


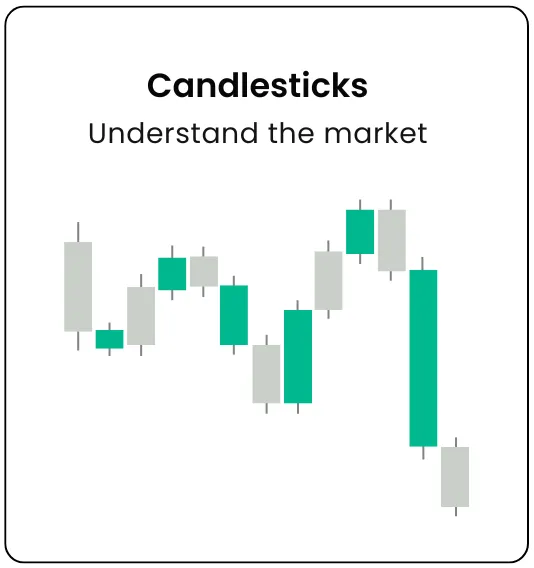
Many traders get lost in memorising dozens of complex candlesticks patterns. But what if we told you that you only need to understand three core types to improve your market reading skills dramatically?and spot key signals of momentum, reversals, and trend direction
Mastering candlesticks can help you:
- Understand the market's mood
- Take more accurate trades
- Avoid unnecessary losses
- Stay on the right side of the trend
Every candle tells a story, a battle between buyers (bulls) and sellers (bears).
A Battle Between Buyers & Sellers
Before we dive into the patterns, let's establish a core concept: The market is a constant battle between buying and selling pressure.
More Buying = Higher Prices: When there are more willing buyers than sellers, sellers can demand higher prices. This pushes the market up.
More Selling = Lower Prices: When there are more sellers than buyers, buyers can offer lower prices. This drives the market down.
Candlesticks are the visual diary of this battle. They reveal who’s winning, who’s losing, and who might be running out of momentum, all within a specific time frame.
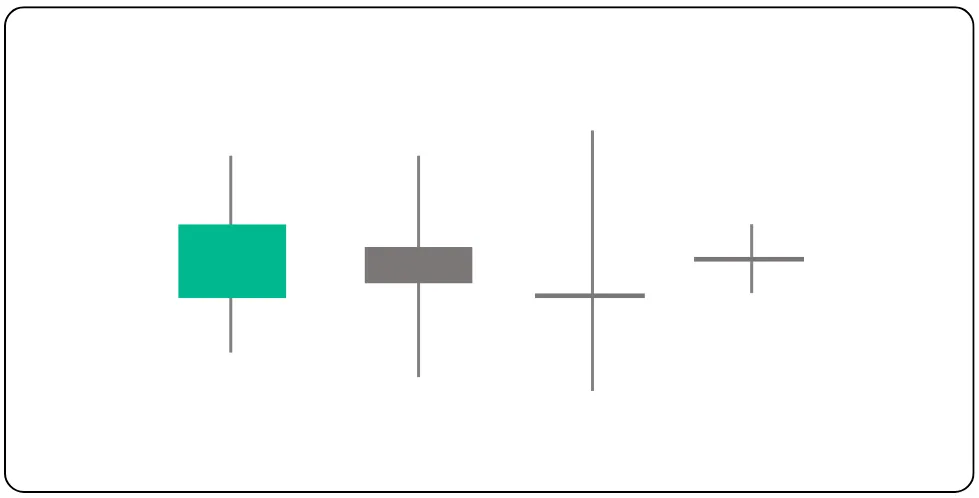
The three Candlestick types you need to know
While every candle looks slightly different, they all fall into one of three categories. Understanding these will simplify your analysis immensely.
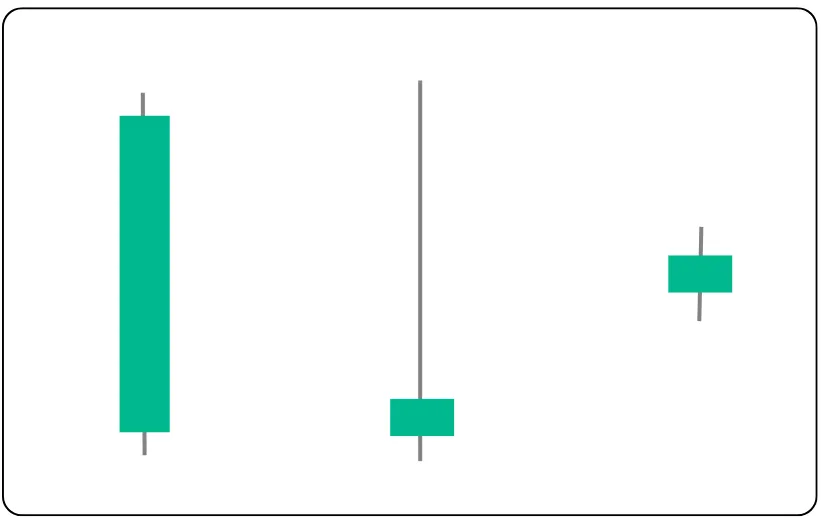
The three essential types of Candlesticks are
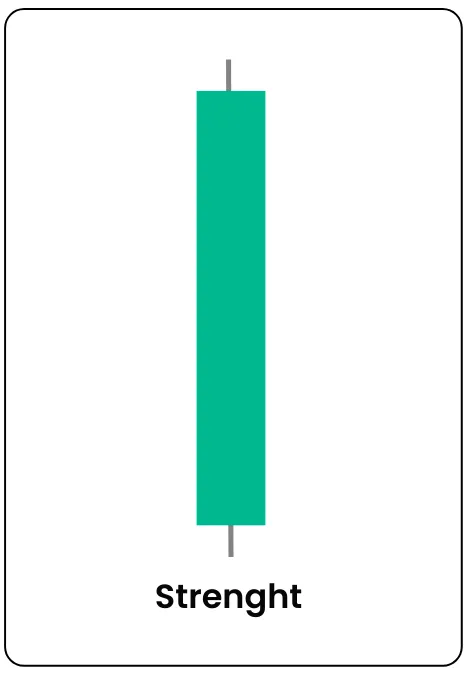
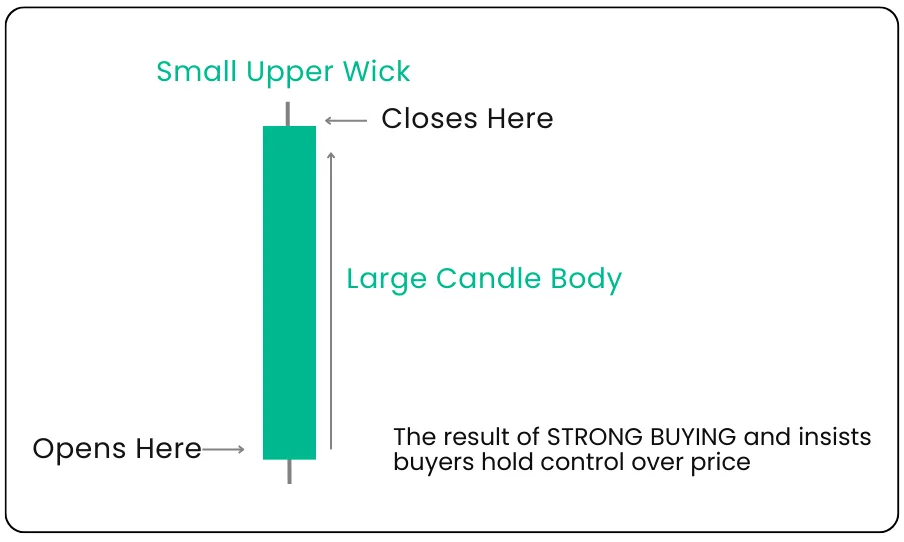
The Strength Candle
A strength candle indicates that one side, either buyers or sellers, is in complete control. It's a sign of strong, uninterrupted momentum.
Characteristics:
- A large body.
- Very small (or no) wicks.
A Bullish strength candle (green/blue) shows strong buying pressure. This means the price opened low and closed significantly higher with very little resistance from sellers. When you see this, the market is likely to continue moving upwards.
A Bearish strength candle (red/grey) shows the exact opposite: powerful selling pressure. The price opened high and closed much lower, indicating that sellers are firmly in control. The market is likely to continue downwards.
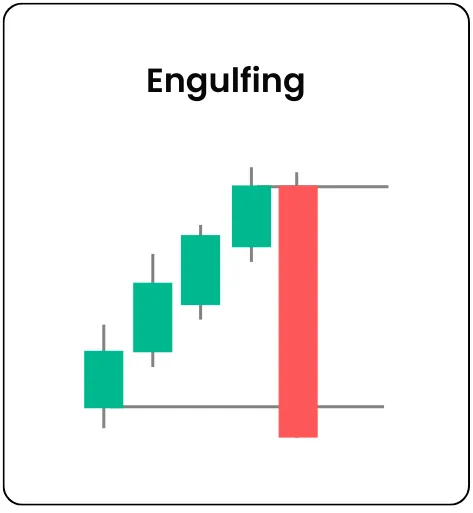
- Pro-Tip: The strongest strength candle is a "Marubozu," which has no wicks at all, showing total control by buyers or sellers. A famous example of a strength candle in action is the Engulfing Pattern, where one big strength candle completely "engulfs" the body of the previous one or more candles, signalling a powerful shift in momentum.
Key takeaway
Strength candles show clear momentum. Your goal as a trader is to trade with this strength, not against it.
The control shift candle
This candle is your first major clue that a reversal might be underway. It shows a takeover in control happening in real-time and is often known as a Pin Bar.
Characteristics:
- A small body.
- A very long wick on one side, and a very small (or no) wick on the other.
The real story here is in the long wick. The wick represents price rejection.
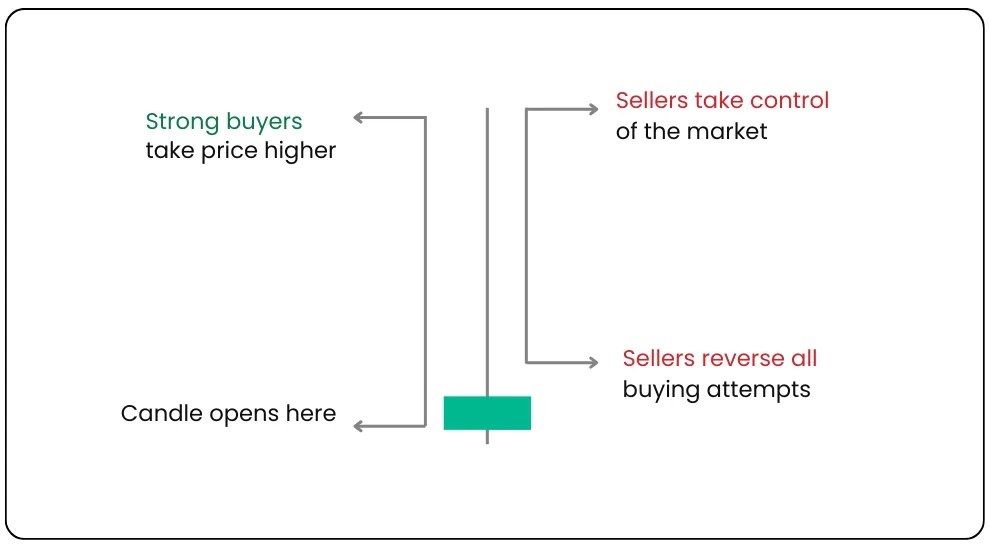
Imagine a candle that opens, buyers push the price way up, but before the candle closes, sellers step in with overwhelming force and push the price back down. The long upper wick tells the story of this failed attempt by the buyers. It's a clear signal that sellers have taken control. The opposite is true for a long lower wick, indicating buyers have rejected lower prices.
Key takeaway
A long wick tells a story of rejection. It signals a potential change in the market’s direction.
The Indecision Candle
As the name implies, this candle tells us that neither buyers nor sellers are in control, signaling a market pause and consolidation. Such a pattern is commonly known as a Doji.
Characteristics:
- A small body where the open and close prices are very close together.
- Wicks on both the upper and lower sides.
An indecision candle shows that buyers pushed the price up, but sellers pushed it back down. Then, sellers pushed the price down, but buyers pushed it up again. In the end, neither side won; it’s a stalemate.
Key takeaway
An indecision candle is not a direct trade signal. It's a signal to wait. It tells you the current trend is losing steam. Look for the next candle, often a Strength or Control Shift candle, to see which side won the battle and is now ready to move the market.
- Pro-Tip: When you see a series of indecision candles forming at a key support or demand zone after a long downtrend, it’s a powerful early warning that sellers are exhausted and a bullish reversal is likely.
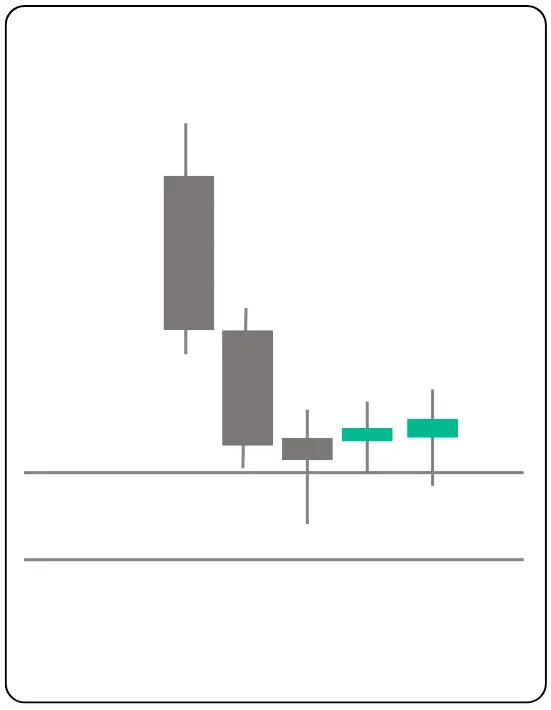
Reading the story on a real chart
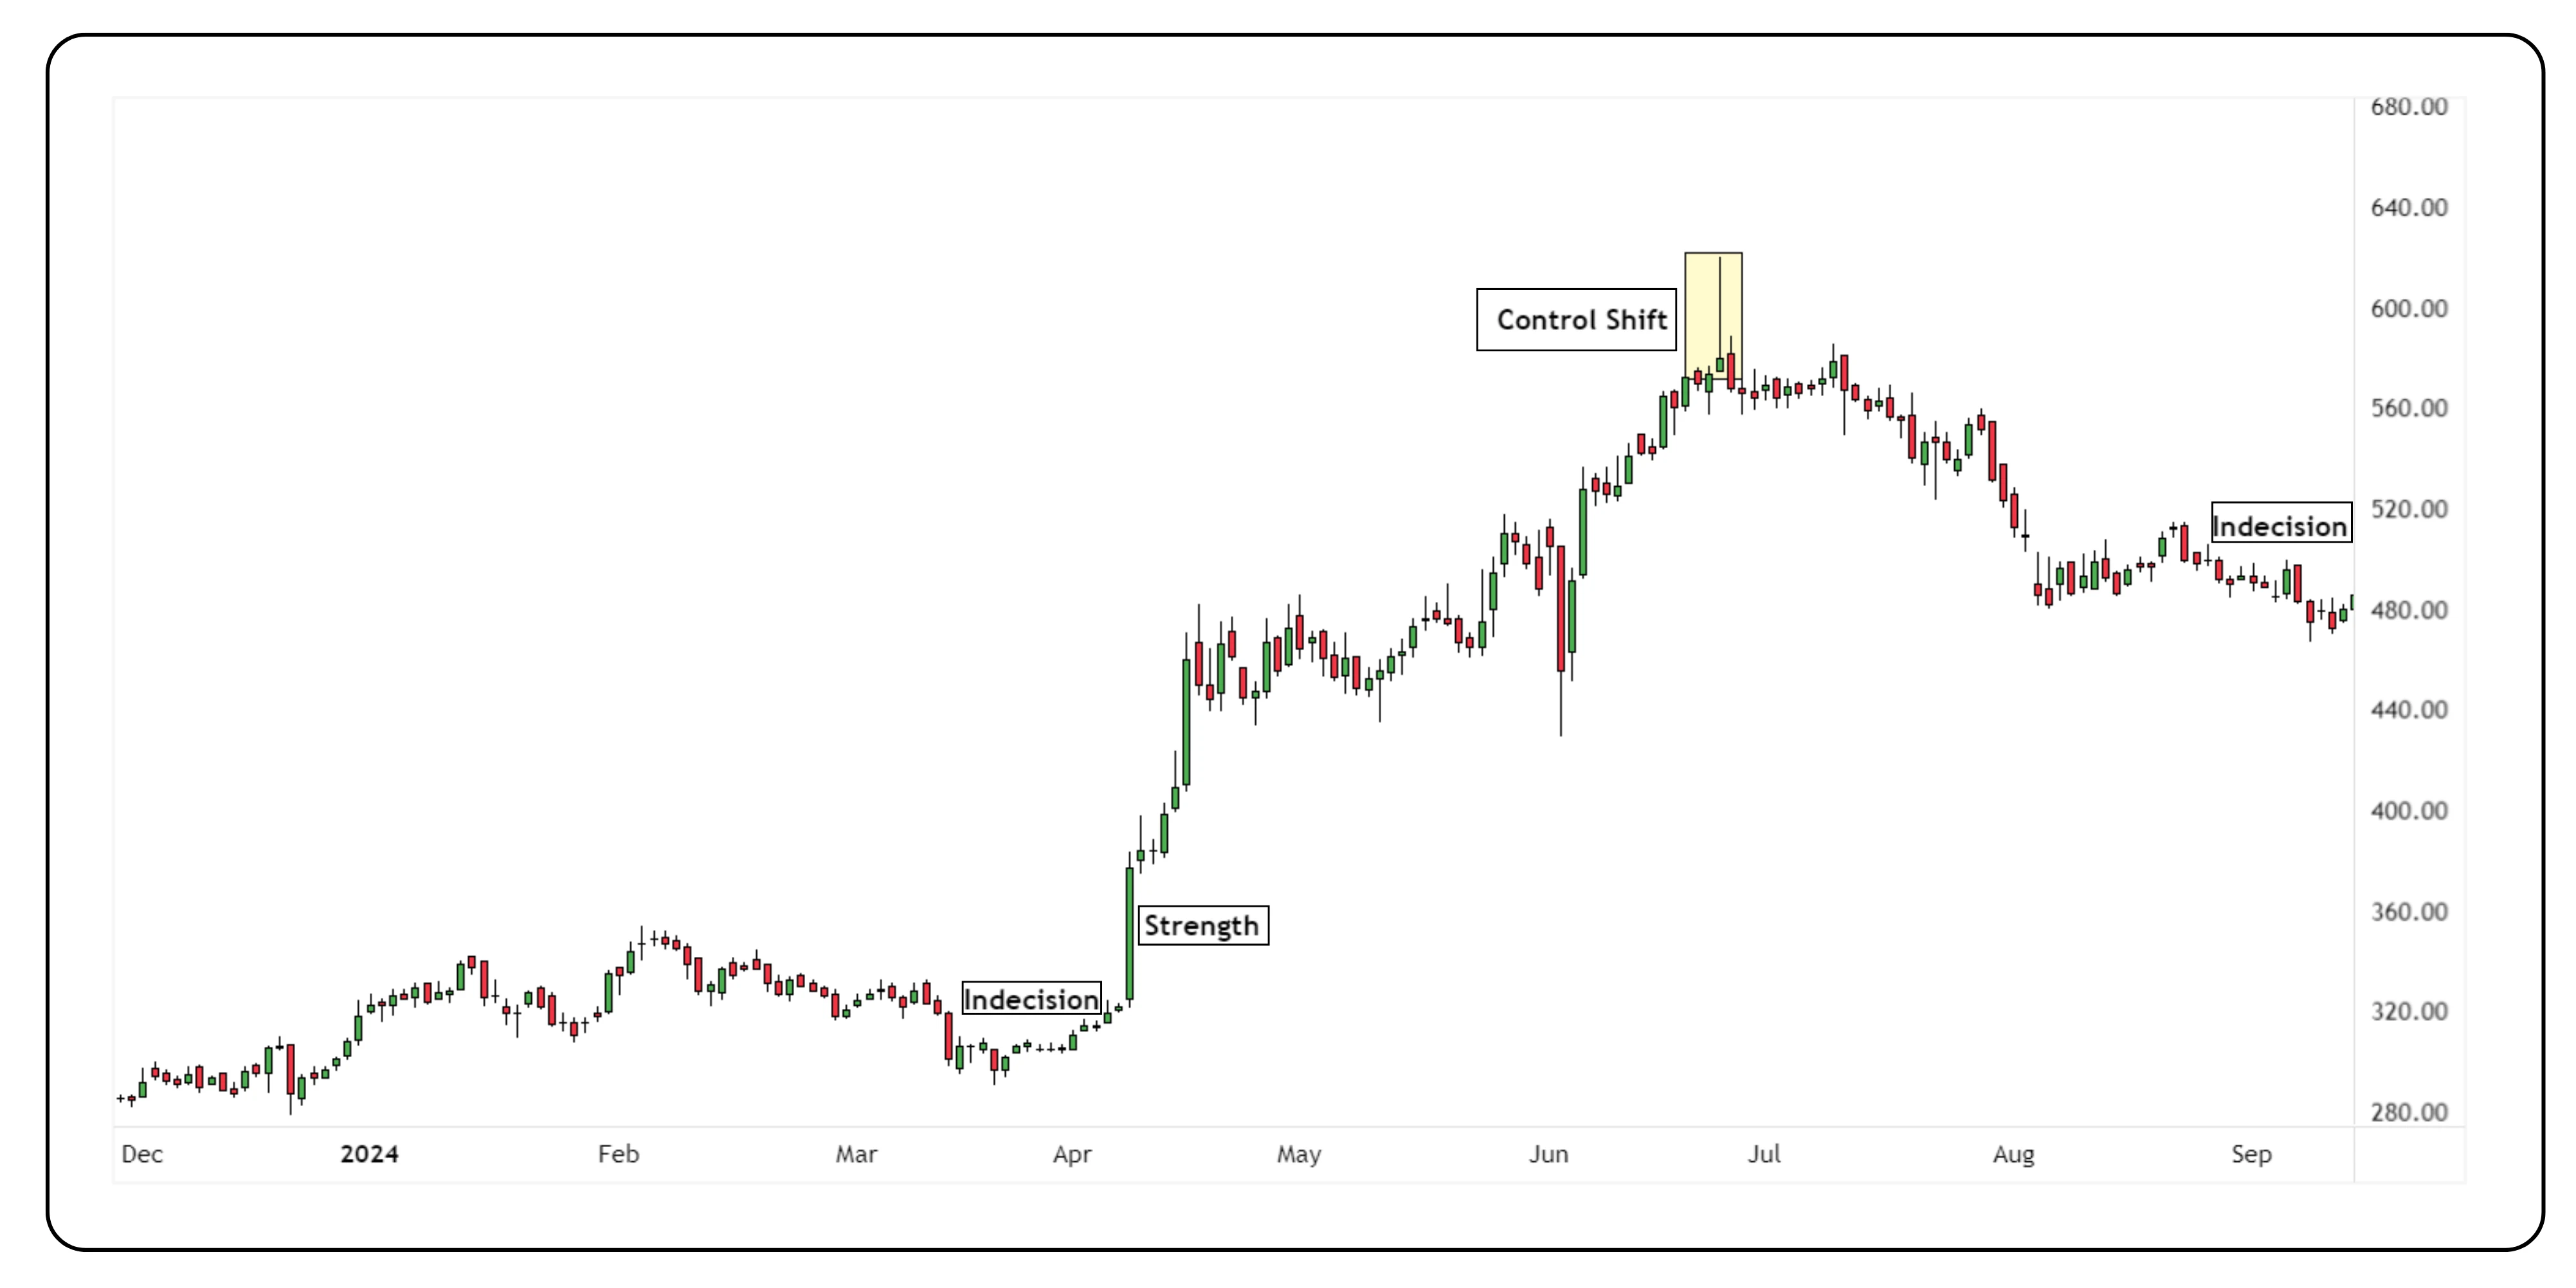
Indecision (Late March – Early April)
The market drifted sideways with small-bodied candles and wicks on both sides. Neither buyers nor sellers had control → a pause in the trend while the market gathered strength.
Strength (Mid April – Early May)
A powerful breakout followed, led by large green Strength Candles. Buyers seized control, pushing prices sharply higher with strong momentum.
Control Shift (Late June)
At the top, a Control Shift Candle formed (highlighted), with a long upper wick rejecting higher prices. Buyers tried to extend the rally, but sellers stepped in aggressively, signaling a potential reversal.
Indecision & Drift (August – September)
Post-reversal, the market showed smaller candles with mixed wicks, settling into another phase of Indecision. Momentum slowed, and the price consolidated as both sides waited for the next clear move.
Trading doesn't have to be about memorising endless patterns. By focusing on the underlying market psychology, you can simplify your analysis down to three core stories:
- Strength: Clear momentum. Ride the wave.
- Control Shift: A potential reversal. Pay close attention.
- Indecision: A pause. Wait for a clear winner to emerge.
Start looking for these three candle types on your charts today. Instead of asking "What pattern is this?", ask: "What story are the buyers and sellers telling me?". This shift in perspective will fundamentally change the way you see the market.
Disclaimer: The information provided in our blogs is for informational purposes only and should not be construed as financial, investment, or trading advice. Trading and investing in the securities market carries risk. Always conduct your own research and consult with a qualified financial advisor before making any investment decisions. Past performance is not indicative of future results. Copyrighted and original content for your trading and investing needs.
© 2025 — Tradejini. All Rights Reserved.