


The Fundamentals Detailed View in CubePlus isn’t just another feature—it’s a well-rounded toolkit crafted to empower investors with actionable insights. Whether you're a seasoned analyst or a curious retail investor, this tool helps you assess a company's financial health, evaluate growth opportunities, and uncover risks. Let’s explore its features with real-world narratives and case studies focused on Indian stocks.
Why the Fundamentals Detailed View is Essential for Investors
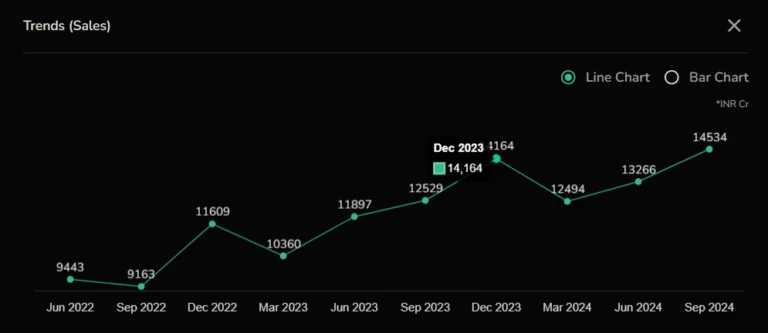
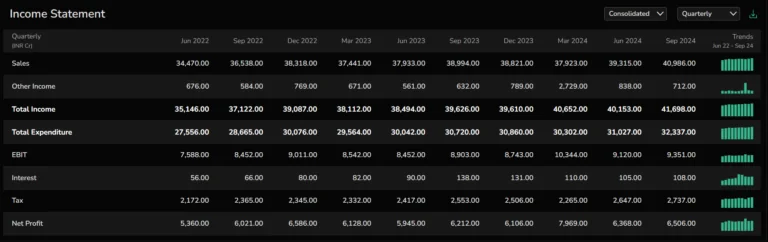
Income Statements: Unpacking Revenue and Profit Trends
Key Features:
- Visualise revenue growth with bar graphs spanning a decade.
- Assess EBIT margins for operational efficiency.
- Compare performance across quarterly, half-yearly, and annual periods.
Case Study: Titan Company Limited Titan
Titan, a leader in India’s jewellery and watch market, demonstrated consistent revenue growth over the past decade. By examining Titan's income statements using CubePlus, investors noted steady growth in revenue, especially in its jewellery segment. Seasonal patterns revealed a significant spike during festive seasons, an indicator of its alignment with consumer sentiment.
Insight: If you were considering Titan stock, CubePlus would reveal its good operational performance during Q3 (Diwali season), making it a reliable pick for long-term growth.
Balance Sheet: Evaluating Financial Health
Key Features:
- Analyse debt-to-equity ratios to assess leverage.
- Examine current assets to ensure liquidity.
- Spot underutilized or overutilized assets by tracking revenue against fixed assets.
Case Study: Yes Bank’s Downfall
Yes Bank once attracted investors with high returns. However, a deep dive into its balance sheet through CubePlus would have revealed red flags: an alarming increase in NPAs (non-performing assets) and a rising debt-to-equity ratio. These issues were masked by its aggressive lending practices.

Lesson: CubePlus would have allowed investors to spot the cracks in Yes Bank's foundation early, saving them from steep losses when the crisis unfolded.
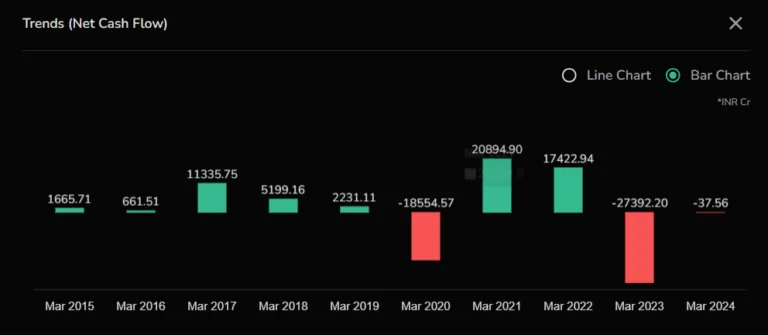
Cash Flow Statements: Tracing Financial Movements
Key Features:
- Positive operating cash flow signals a strong core business.
- Track investments in assets or divestitures.
- Review financing activities for dividend reliability or debt repayment trends.
Case Study: Reliance Industries’ Jio Revolution
When Reliance Industries launched Jio, many investors questioned the heavy capital expenditures required to build telecom infrastructure. Using CubePlus, one could analyze its cash flow statement, which showed consistent operating cash flows from its oil and gas business funding Jio’s growth. Over time, this strategy paid off as Jio turned profitable, making Reliance a more diversified giant.
Insight: Understanding how Reliance balanced its core operations with new ventures through cash flow analysis would have reassured sceptical investors.
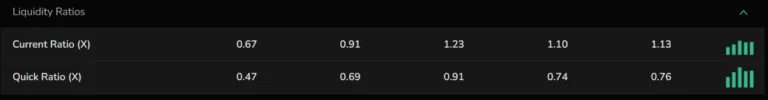
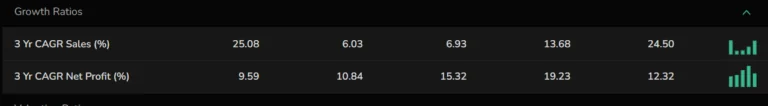
Financial Ratios: At-a-Glance Performance Metrics
Key Features:
- Compare P/E and P/B ratios with industry benchmarks.
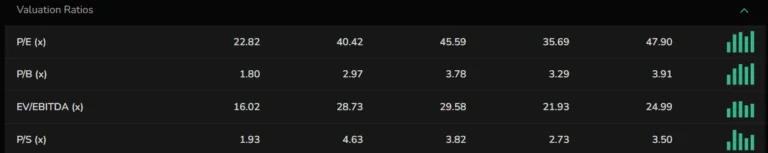
- Analyze liquidity using current and quick ratios.
- Use CAGR for revenue and profit to evaluate long-term growth.
Example: ITC vs. HUL
ITC and Hindustan Unilever Limited (HUL) are giants in India’s FMCG sector. Investors often debate which is the better buy. CubePlus enables a side-by-side comparison of key financial ratios. HUL’s higher P/E ratio indicates market optimism, while ITC’s lower valuation reflects a more cautious investor sentiment. ITC’s dividend yield, however, often appeals to income-focused investors.
Insight: Using CubePlus, you could pick the stock that aligns with your goals—growth (HUL) or stability and income (ITC).
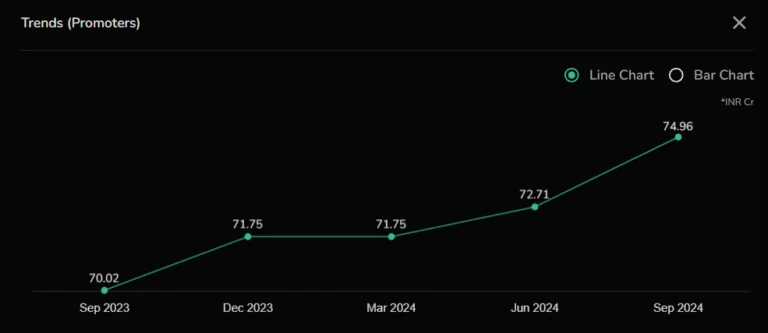
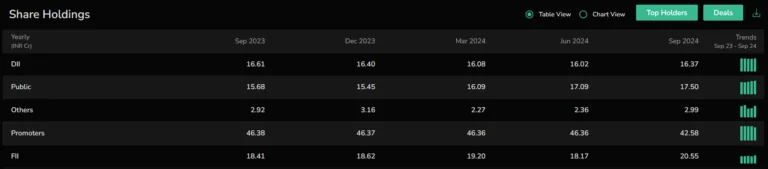
Shareholding Patterns: Tracking Stakeholder Confidence
Key Features:
- Monitor promoter holding trends for confidence indicators.
- Follow institutional investor activity to gauge market sentiment.
- Identify key shareholders influencing strategy.
Case Study: Tata Motors’ Turnaround
Tata Motors faced challenges in its domestic and international markets. Yet, consistent promoter holdings and increased Foreign Institutional Investor (FII) interest signalled confidence in its long-term strategy, especially post-launch of EV models like Tata Nexon EV.
Insight: CubePlus’ shareholding pattern feature could have guided investors to hold their positions during the turnaround phase, capitalizing on Tata Motors' eventual growth.
Corporate Action: Anticipating Strategic Developments
Key Features:
- Study dividend payout trends to gauge financial stability.
- Analyze stock splits for increased liquidity.
- Review rights issues for expansion or debt management strategies.
Case Study: Infosys’ Dividend Policy
Infosys is known for its shareholder-friendly policies, including consistent dividend payouts. With CubePlus, investors could trace its dividend history and confidently invest, knowing the company’s strong cash reserves support its policy.
Example: Suppose Infosys announces a rights issue. CubePlus helps investors evaluate whether it’s for growth or merely to manage debt, ensuring a well-informed decision.
Enhanced Tools to Amplify Investment Strategies
Exportable Data for Advanced Analysis
- Download key data like income statements and integrate it into valuation models.
- Example: Export data for TCS (Tata Consultancy Services) and create a DCF model to estimate its intrinsic value based on future cash flow projections.
Customizable Views
- Switch between standalone and consolidated data views for nuanced insights.
- Example: Use standalone data for Hindalco Industries to assess individual aluminum segment performance, or consolidated data to see Novelis’ impact on global operations.
Competitor Benchmarking
- Compare metrics across peers to identify leaders.
- Example: Benchmark Maruti Suzuki’s operating margins against Mahindra & Mahindra to decide which auto stock offers better value in the passenger vehicle segment.
Practical Applications for Investor Categories
Retail Investors:
Story: A retail investor in Mumbai looking to invest in a growth-oriented stock used CubePlus to identify Asian Paints as a consistent performer. They tracked its 10-year revenue CAGR and rising promoter holdings, which gave them the confidence to hold the stock long-term.
Institutional Investors:
Example: A mutual fund manager used CubePlus to spot undervaluation in Bharti Airtel during its expansion phase. By analyzing its cash flow and financing activities, they predicted sustainable growth, making it a core holding in their portfolio.
Disclaimer: The information provided in our blogs is for informational purposes only and should not be construed as financial, investment, or trading advice. Trading and investing in the securities market carries risk. Always conduct your own research and consult with a qualified financial advisor before making any investment decisions. Past performance is not indicative of future results. Copyrighted and original content for your trading and investing needs.
© 2025 — Tradejini. All Rights Reserved.