


Most traders using any options trading platform in India don't struggle with placing trades. They struggle with understanding what happens after. This NxtOption guide breaks down the live positions view piece by piece (covering NxtOption MTM P&L, breakeven levels, Greeks, and margin) using images from a live session. If you trade options on NIFTY or any index, understanding what each field is actually saying (not just whether the number is red or green) is what separates reactive trading from deliberate risk management. This walkthrough breaks down the positions view piece by piece, using real screenshots from a live session.
NxtOption Positions on the Option Chain: The Summary Row
When you have open positions across different expiries, the screen groups them into separate rows, one per expiry. In the screenshot below, there are three rows: current expiry (24 Mar), 30 Mar, and 07 Apr. Each row carries its own Greeks and P&L independently, so you can read the risk of each leg without aggregating manually.
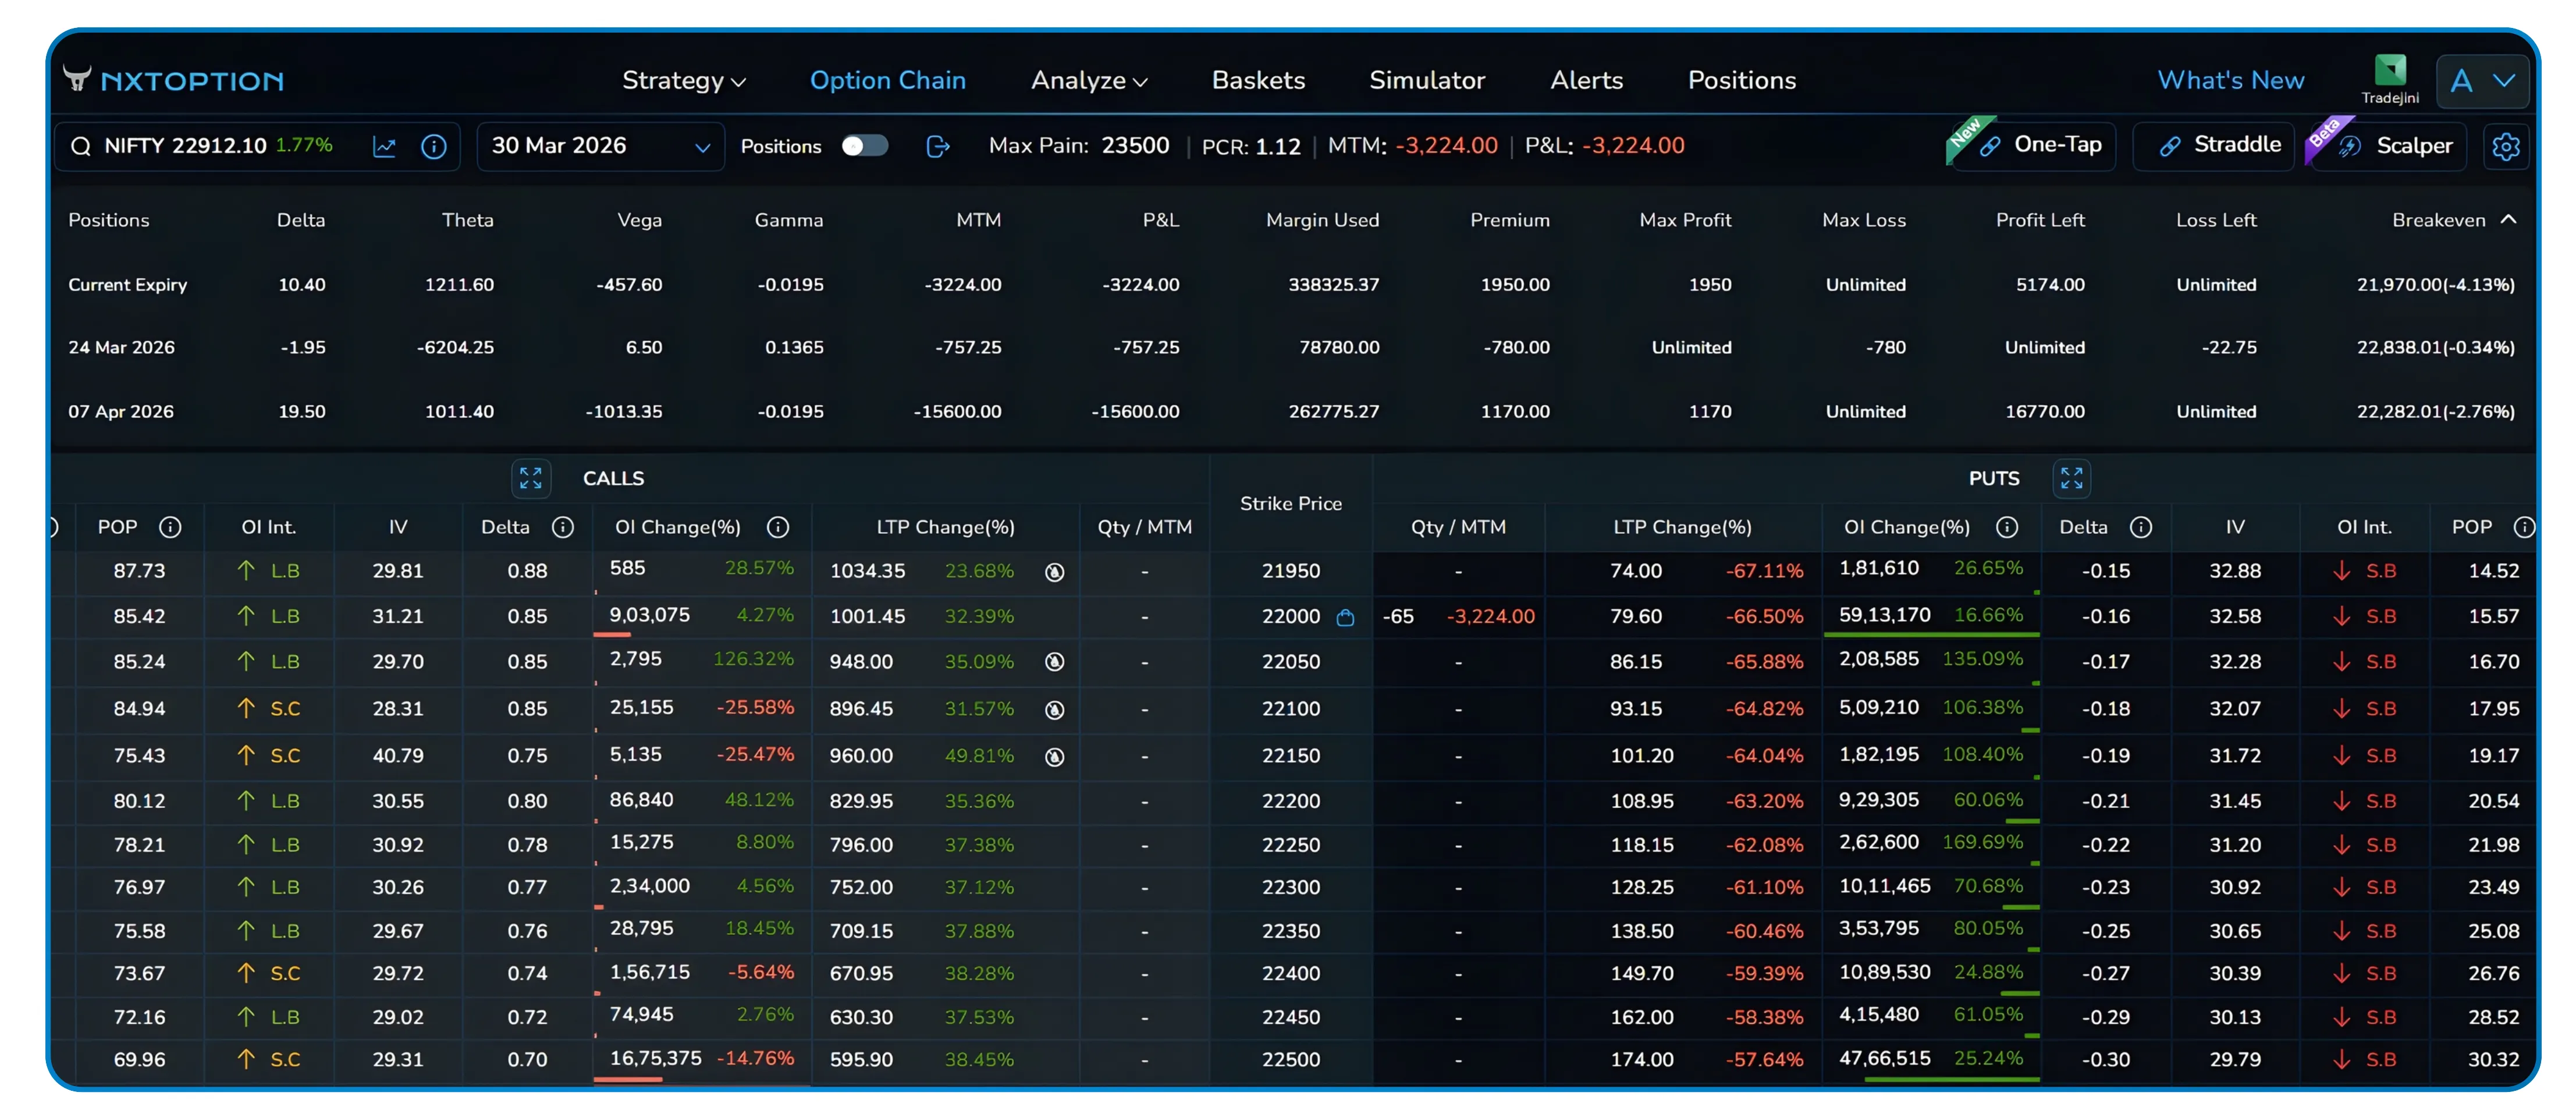
Fig 1 — Three expiry rows visible simultaneously. MTM and P&L at −763.75, current expiry delta at −1.95.
The header bar shows Max Pain (22900), PCR (1.05), and portfolio-level MTM all at once. These are context signals, not noise. PCR above 1 indicates more puts than calls, which can reflect hedging activity or aggressive put writing, depending on market context.NxtOption Max Pain is displayed as the strike at which option sellers collectively lose the least. It is often observed as a level where price tends to gravitate near expiry, though it is a reference point rather than a reliable predictor. For traders managing Nifty options positions across multiple expiries, these context signals sit at the top of the NxtOption risk dashboard so they are always in view, without opening a separate tab or tool.
The NxtOption Expiry Dropdown: Switch Without Losing Context
The expiry dropdown on the option chain lets you view the chain for any upcoming expiry (weekly or monthly) while the position rows above remain unchanged. This is particularly useful when managing an NxtOption calendar spread or any multi-leg strategy; you can check the 07 Apr chain for rolling opportunities without the position summary changing.
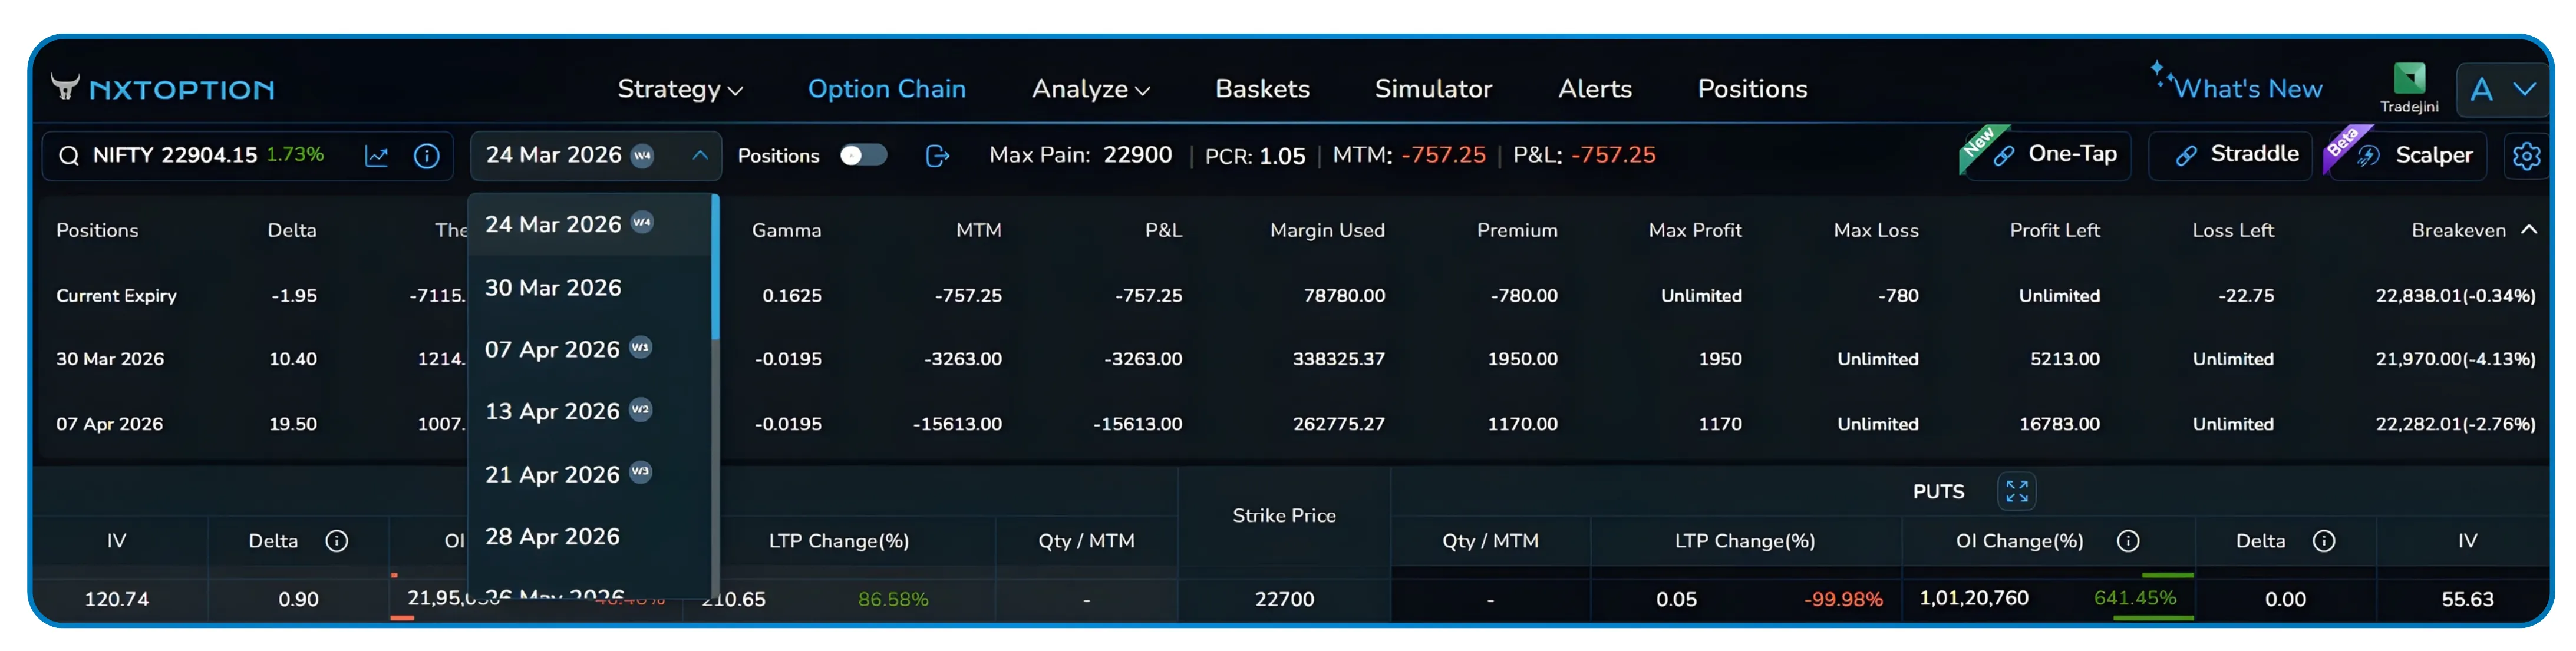
Fig 2 — Expiry dropdown open. Available dates span weekly and monthly contracts through end-April and beyond.
NxtOption Greeks and Position Metrics Explained
Understanding NxtOption delta theta vega gamma as a combined read (rather than four isolated numbers) is what makes the positions row genuinely useful for active risk management. The ten columns in the position row carry a lot of information in a small space. Here's what each one means without the textbook phrasing.
| Metric | Description |
|---|---|
| DELTA | P&L change per 1-point NIFTY move. Negative = net short bias on the index. |
| THETA | Daily time decay. Negative means you're paying for time. Positive means you're collecting it. |
| VEGA | Sensitivity to IV changes. Large negative vega = a VIX spike hurts you. |
| GAMMA | How fast delta changes as spot moves. High gamma near expiry explains why short positions can move violently on trending days. |
| MTM | Mark-to-market, unrealised P&L at current prices. Resets at settlement. |
| P&L | Net realised + unrealised since entry. This is the number you actually care about. |
| MARGIN USED | Capital blocked by the broker. Short options consume significantly more margin than longs. |
| PREMIUM | Net premium received or paid at entry. Positive for net sellers, negative for net buyers. |
| MAX PROFIT/LOSS | 'Unlimited' on max loss is the flag to watch. It means naked exposure on that leg. |
| BREAKEVEN | The Nifty level where the position transitions from profit to loss at expiry (for most strategies). |
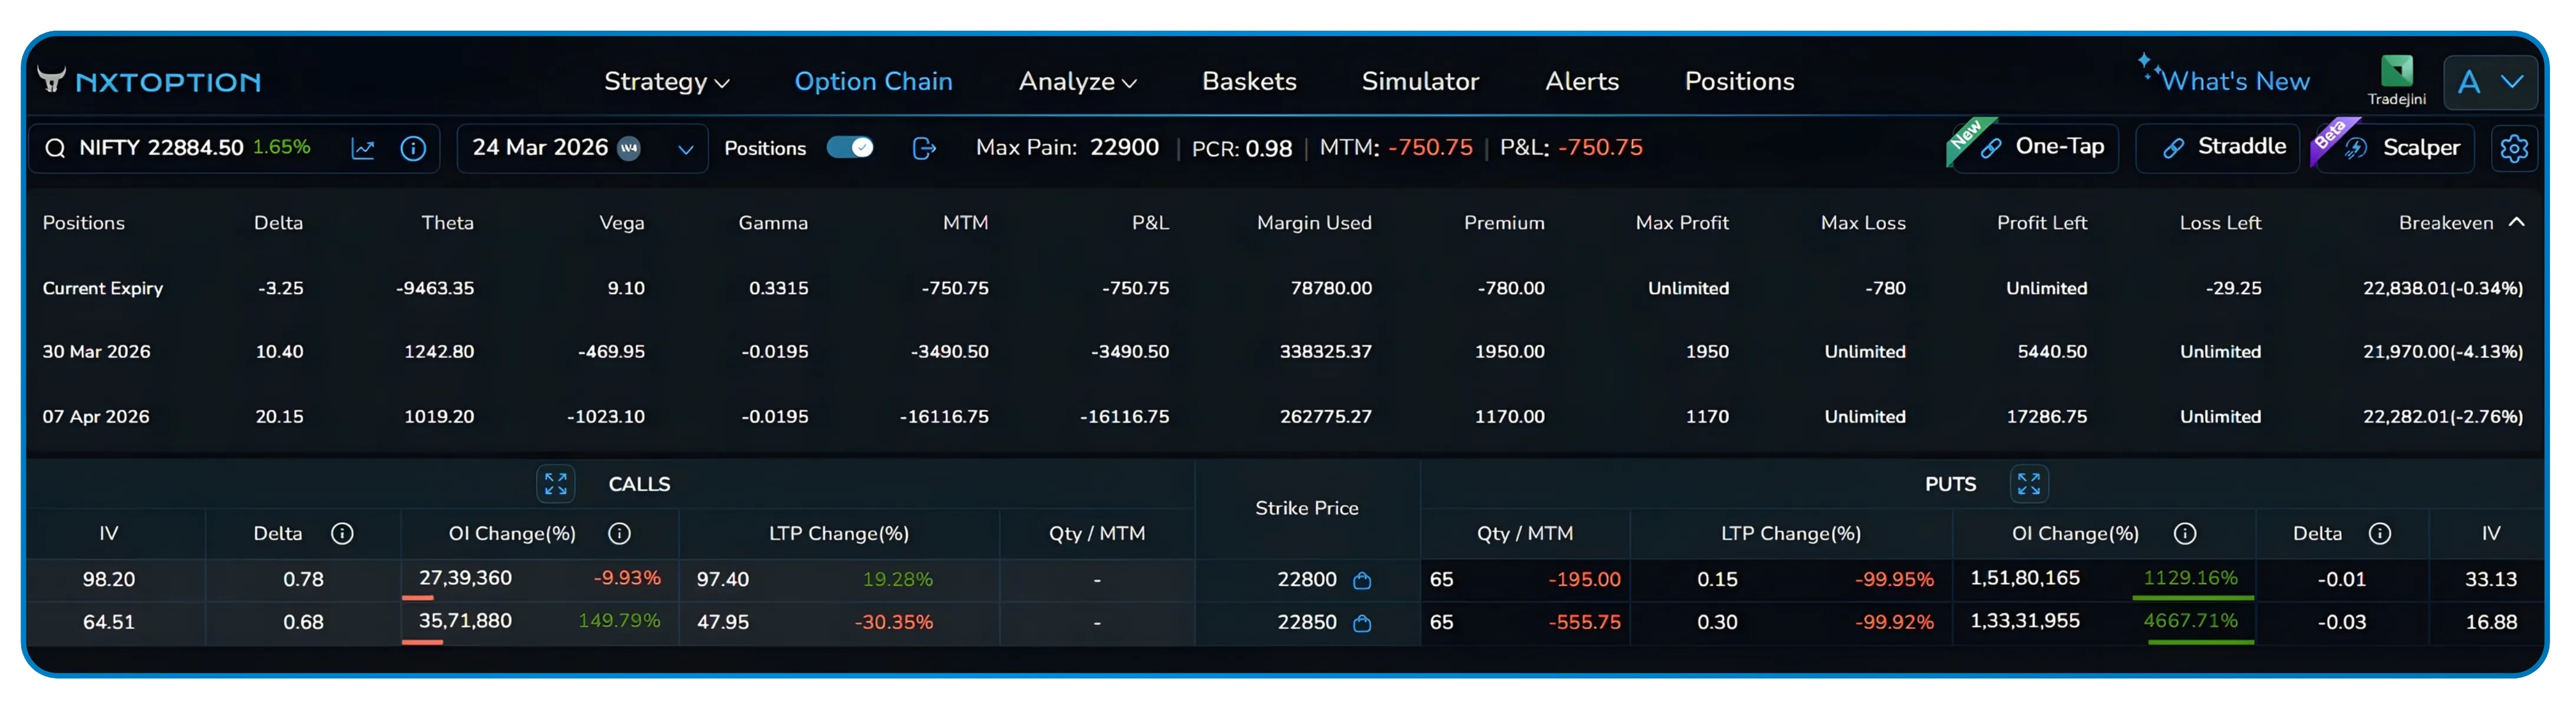
Fig 3 — 22800 PE and 22850 PE rows with Qty/MTM visible. The option chain is live below the summary rows.
For traders who have looked up options greeks explained in general terms, the NxtOption position greeks row translates that theory directly into live numbers tied to your actual open legs. In this setup, the current expiry row shows delta of −1.95 and theta deeply negative (around −5000 to −8000 across different snapshots). That's an unusual combination for a typical short options position; it suggests the short legs aren't collecting enough decay to offset the directional or vega risk at this point in the session.
Understanding risk is one part. Acting on it quickly is the other.
The exit modal shows all open legs together, name, order type, quantity, price range, trigger, and current LTP. The part that saves the most time under pressure is the percentage selector at the top right.
The NxtOption Exit Modal and Percentage Exit Selector
The exit modal shows all open legs together, name, order type, quantity, price range, trigger, and current LTP. The part that saves the most time under pressure is the percentage selector at the top right.
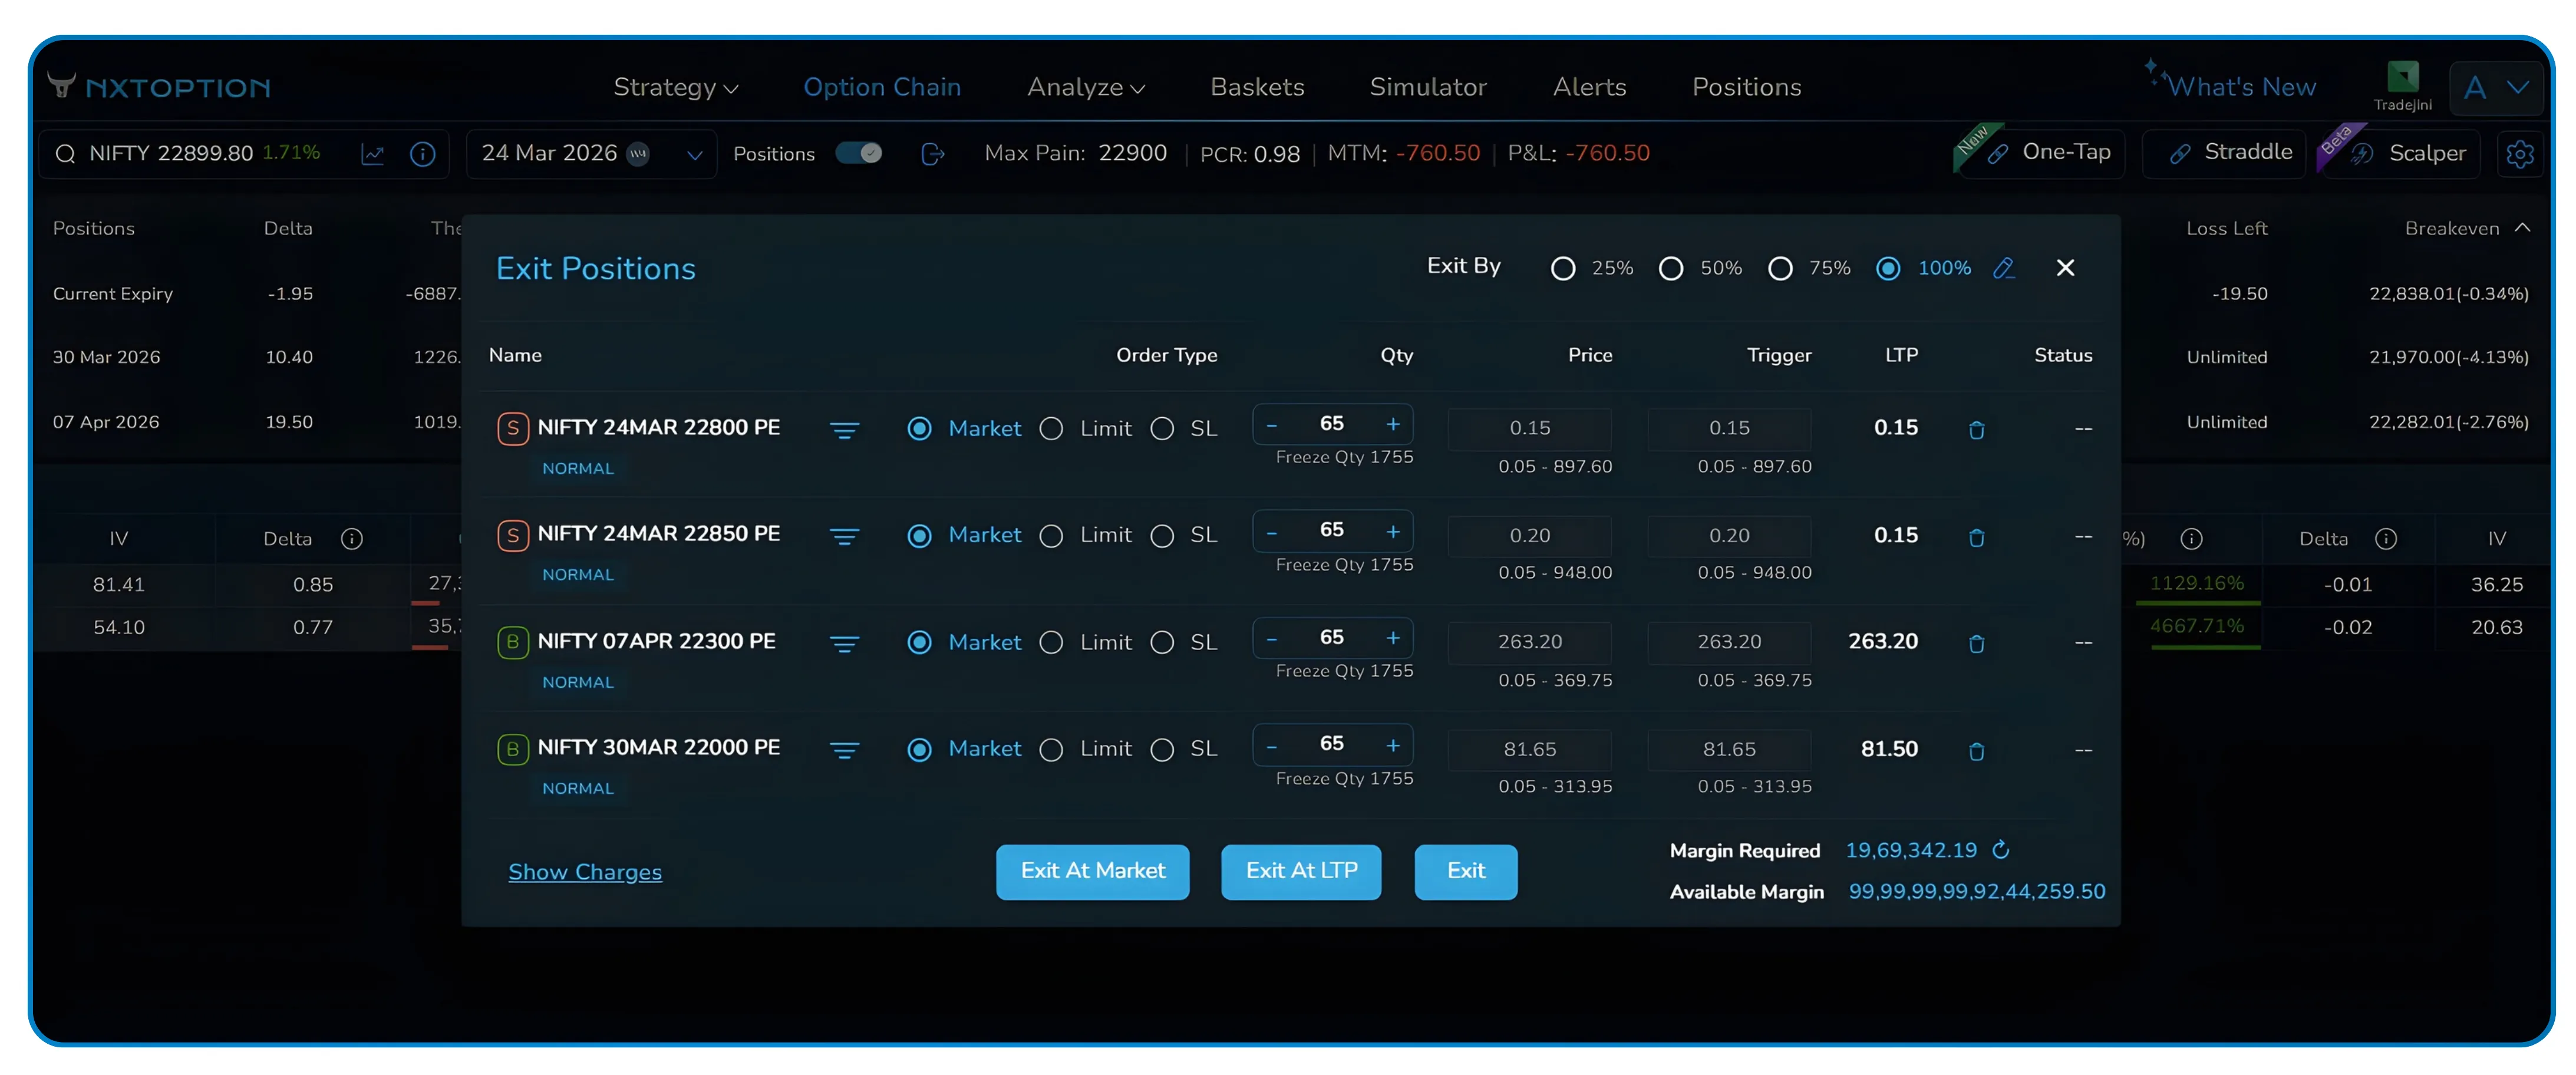
Fig 4 — Exit modal with four legs: two short PEs (22800, 22850) and two long PEs (22300, 22000). 100% selected.
Instead of manual options lot size calculation across legs, you pick a percentage and the quantities update simultaneously. This is what makes partial exit options in India practical during fast-moving sessions. This is the difference between a clean staged exit and an arithmetic error when markets are moving fast.
The modal also shows Margin Required and Available Margin at the bottom before you confirm, so you can check whether closing the position releases margin or, in rare cases, creates a shortfall on remaining legs. Exit At Market executes immediately at best available price; Exit At LTP places a limit at the last traded price.
- Open the exit modal, all legs load with current LTP pre-filled.
- Select 25%, 50%, 75%, or 100% quantities adjust across every leg automatically.
- Choose Exit At Market for immediate fills or Exit At LTP for a limit at last traded price.
- Verify margin numbers at the bottom, then confirm with the Exit button.
For anyone building a consistent options exit strategy in India, this workflow removes the two most common failure points: miscalculated quantities and unverified margin impact before confirmation
NxtOption OI Change and the Live Option Chain Below Your Positions
The chain doesn't sit in a separate tab, it's directly below the position summary, updating in real time. As NIFTY moves, you can watch OI changes, LTP shifts, and IV across strikes while your Greeks update in the rows above.The NxtOption OI change highlights flag strikes where options open interest in India is building at an unusually fast rate. This kind of live options OI analysis gives you positioning context at the same moment your Greeks are updating above.
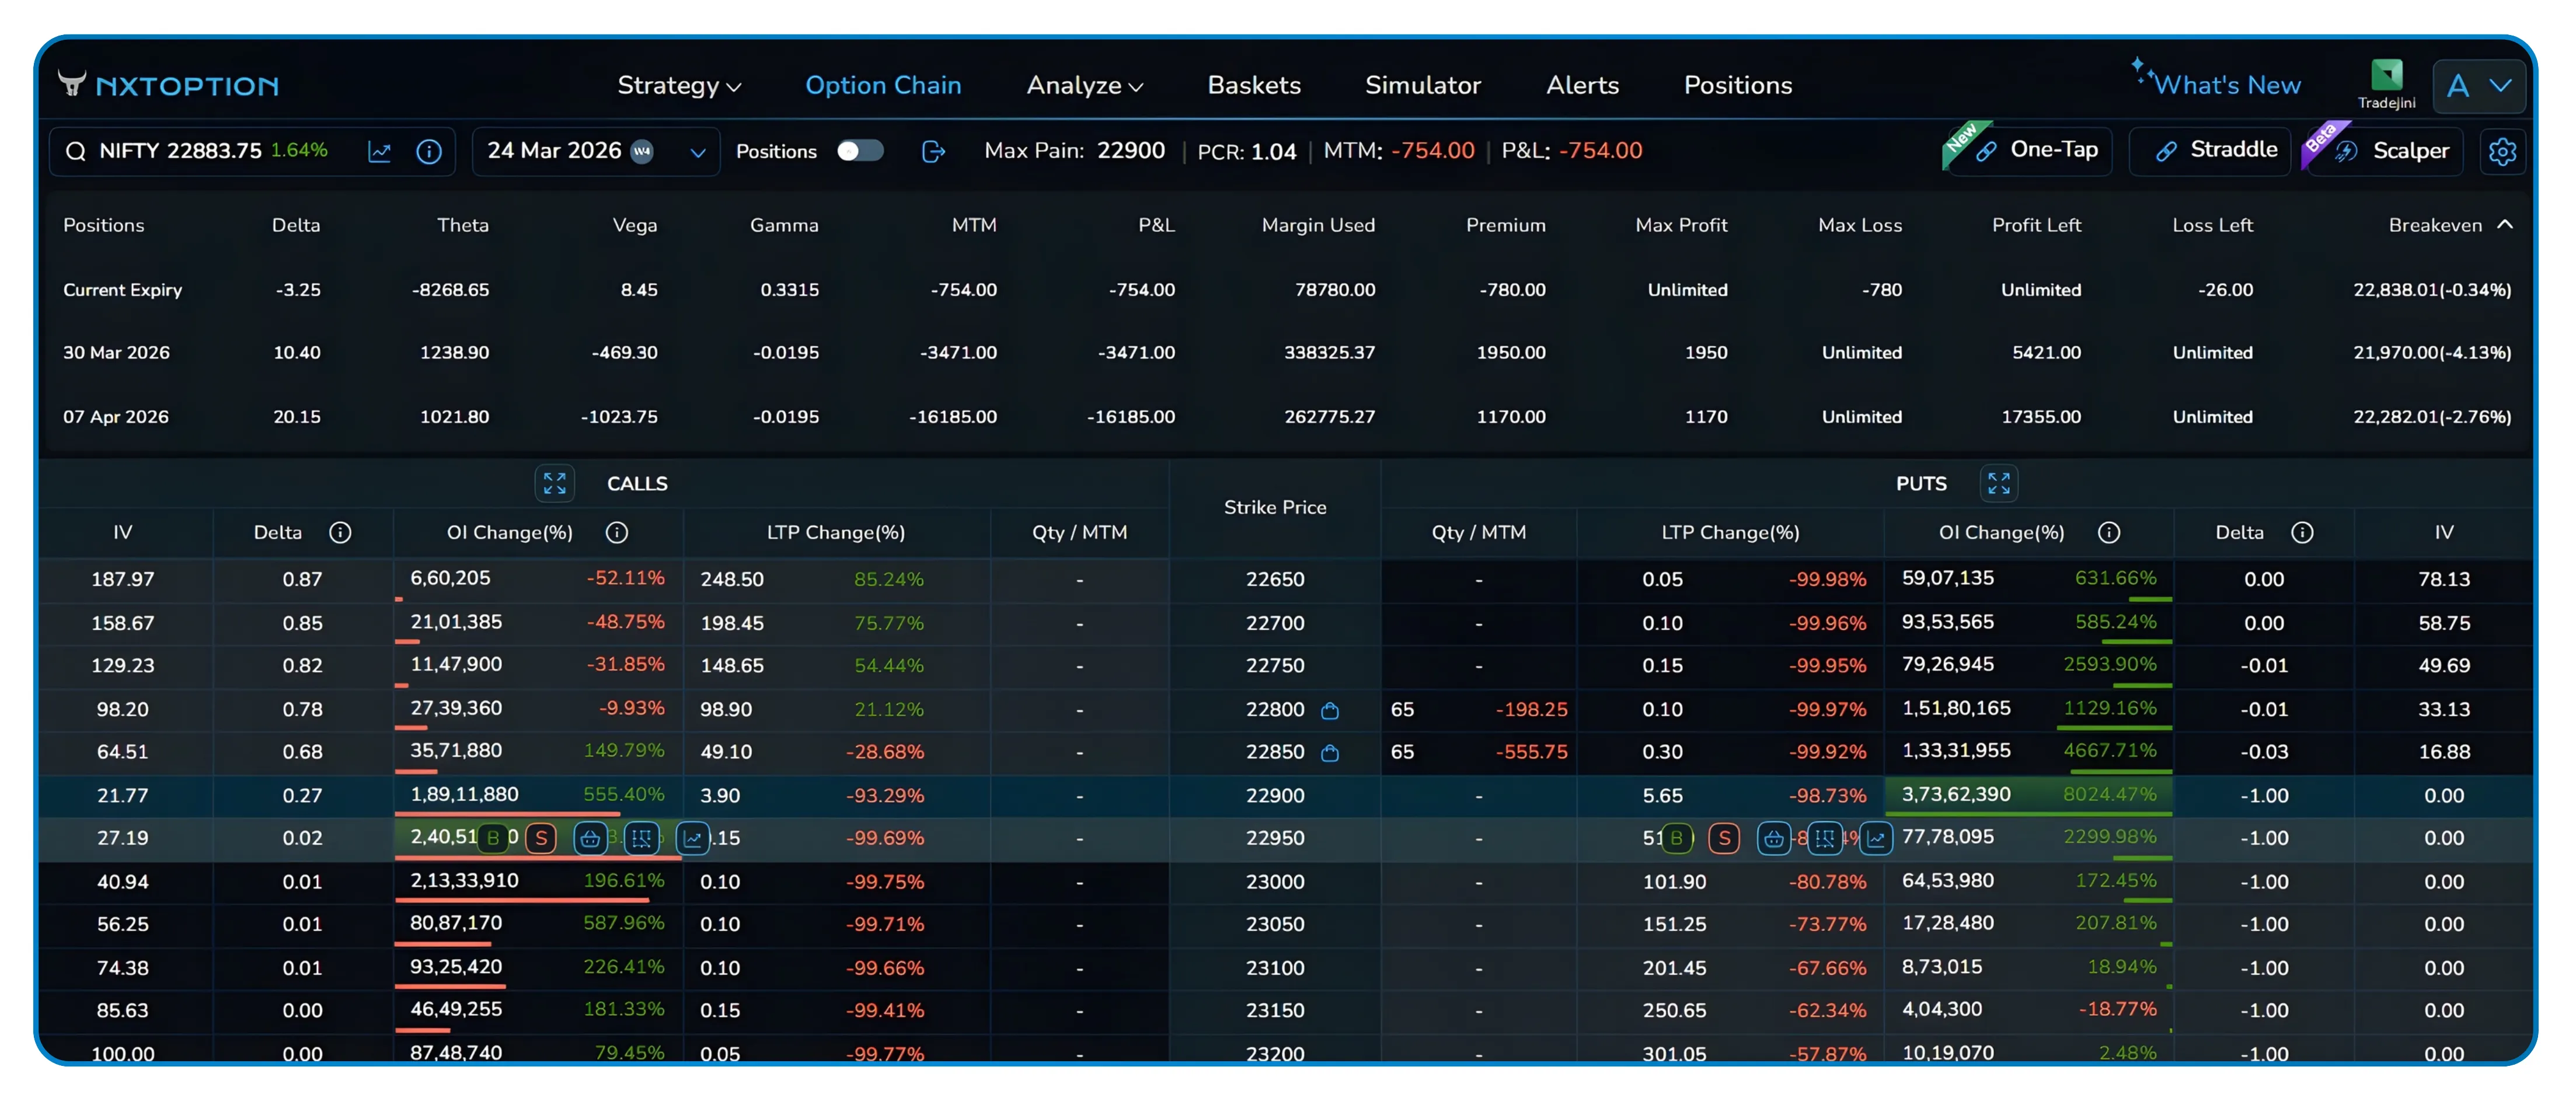
Fig 5 — Full view with chain live below positions. Notable OI build at 22900 PE (8024%) and 22850 PE (4667%) on the put side.
The positions screen works best when you treat it as a live risk dashboard rather than just a ledger. Reading the Greeks row by row, tracking breakevens relative to spot, and using percentage-based exits to manage size are habits that reduce decision errors, especially during volatile sessions when manual lot calculations are most likely to go wrong.
Position Management as a Single Workflow
For anyone doing serious options risk management in India, the gap between a good platform and a great one often comes down to workflow; how many screens you need, how many steps separate a signal from an action. Most traders using options trading tools in India split their attention between a positions screen and a separate option chain — two views, two mental contexts, constant switching. NxtOption position management collapses that gap entirely, making it one of the more practical examples of options trading workflow in India built around how risk decisions actually happen. The percentage-based exit selector removes the mental arithmetic; the live OI data removes the guesswork. Together, they make the positions toggle less of a feature and more of a workflow shift, from reacting to numbers to actually understanding what they mean while the market is moving.
Disclaimer: The information provided in our blogs is for informational purposes only and should not be construed as financial, investment, or trading advice. Trading and investing in the securities market carries risk. Always conduct your own research and consult with a qualified financial advisor before making any investment decisions. Past performance is not indicative of future results. Copyrighted and original content for your trading and investing needs.
© 2026 — Tradejini. All Rights Reserved.


