


At its core, the strip and strap strategy in options is a market-neutral options strategy that uses the same strike price and same expiration date for all legs built on the foundation of the long straddle, but with a directional twist. Both options strategies involve purchasing at the money call and put options on the same underlying asset with the same strike price and same expiry date, aiming to profit from large moves in either direction. However, the Strip leans bearish, while the Strap leans bullish.
A strip option strategy involves purchasing two at the money puts and one call option on the same underlying stock, all with the same expiry date. Because puts are doubled in strip construction, the downside profit potential is twice as large as the upside, while maintaining unlimited profit potential above the upper breakeven point. This makes it ideal for traders expecting volatility with a higher probability of a downward move.
A strap strategy, in contrast, involves purchasing two at the money calls and one put on the same underlying security. The trader can generate profit more from an upside move when the underlying stock price makes significant gains, expressing a bullish volatility bias with unlimited profit potential.
Both are net debit strategies with defined risk, since the net premium paid represents the combined cost and maximum loss if the underlying price remains at the strike price. The maximum loss is limited to the net premium paid, offering defined risk regardless of price movements in the underlying asset, while the profit potential includes unlimited profit on one side and significant gains on the other, depending on the underlying stock price at expiration date. These strategies perform best when the underlying makes a strong directional move either way but they suffer in range bound market conditions when the stock price stagnates around the underlying strike price between the breakeven points.
Mechanically, both options trading strategies rely on volatility expansion and significant price movement in the underlying stock. They are long gamma and long vega, benefiting from fast, large price movements and rising implied volatility. Option trading professionals deploy these strategies before major catalysts based on their market outlook and risk tolerance.
Types & Variations
1. Strip – Bearish Market-Neutral Strategy
A Strip is an options strategy for traders who anticipate a large price move but believe a downward move is more likely. Despite a name that might suggest neutrality, it carries a distinct bearish tilt. The structure involves buying two at-the-money (ATM) puts and one ATM call, resulting in a net debit. The primary objective is to profit from a sharp price swing, especially a significant fall. The key advantage of a Strip is that it delivers double the reward for a downward movement since both put options appreciate, while only a single call covers the upside, making it most effective when a spike in downside volatility is expected.
2. Strap – Bullish Market-Neutral Strategy
A Strap is an options strategy for traders who anticipate high volatility with a distinct bullish bias, making it the mirror image of a Strip. The structure involves buying two at-the-money (ATM) calls and one ATM put, resulting in a net debit position. The primary objective is to capture a significant upswing in price; with two call options, the strategy generates double the profit on a rally compared to the protection offered by the single put on a down move. Traders often use this strategy ahead of potential bullish catalysts like strong earnings reports, favorable policy reforms, or anticipated market rallies.
Deployment Conditions Table
| Condition | Strip (Bearish Bias) | Strap (Bullish Bias) |
|---|---|---|
| Market View | Expect significant price movement, likely downward in the underlying stock price | Expect significant price movement, likely upward in the price of underlying asset |
| Implied Volatility | Best when IV is low and expected to rise (pre-event) | Best when IV is low and expected to rise (pre-event) |
| Use Case | Before events where bad news or uncertainty may dominate (earnings miss, policy shock) | Before events where strong positive surprises are expected (good earnings, favorable macro news) |
| Objective | Profit from volatility with bearish tilt | Profit from volatility with bullish tilt |
| Risk Profile | Limited risk = net premium paid (maximum loss defined) | Limited risk = net premium paid (maximum loss defined) |
| Profit Drivers | Downward volatility expansion and price declines beyond lower breakeven point | Upward volatility and price surge |
Practical Examples
Strip Example
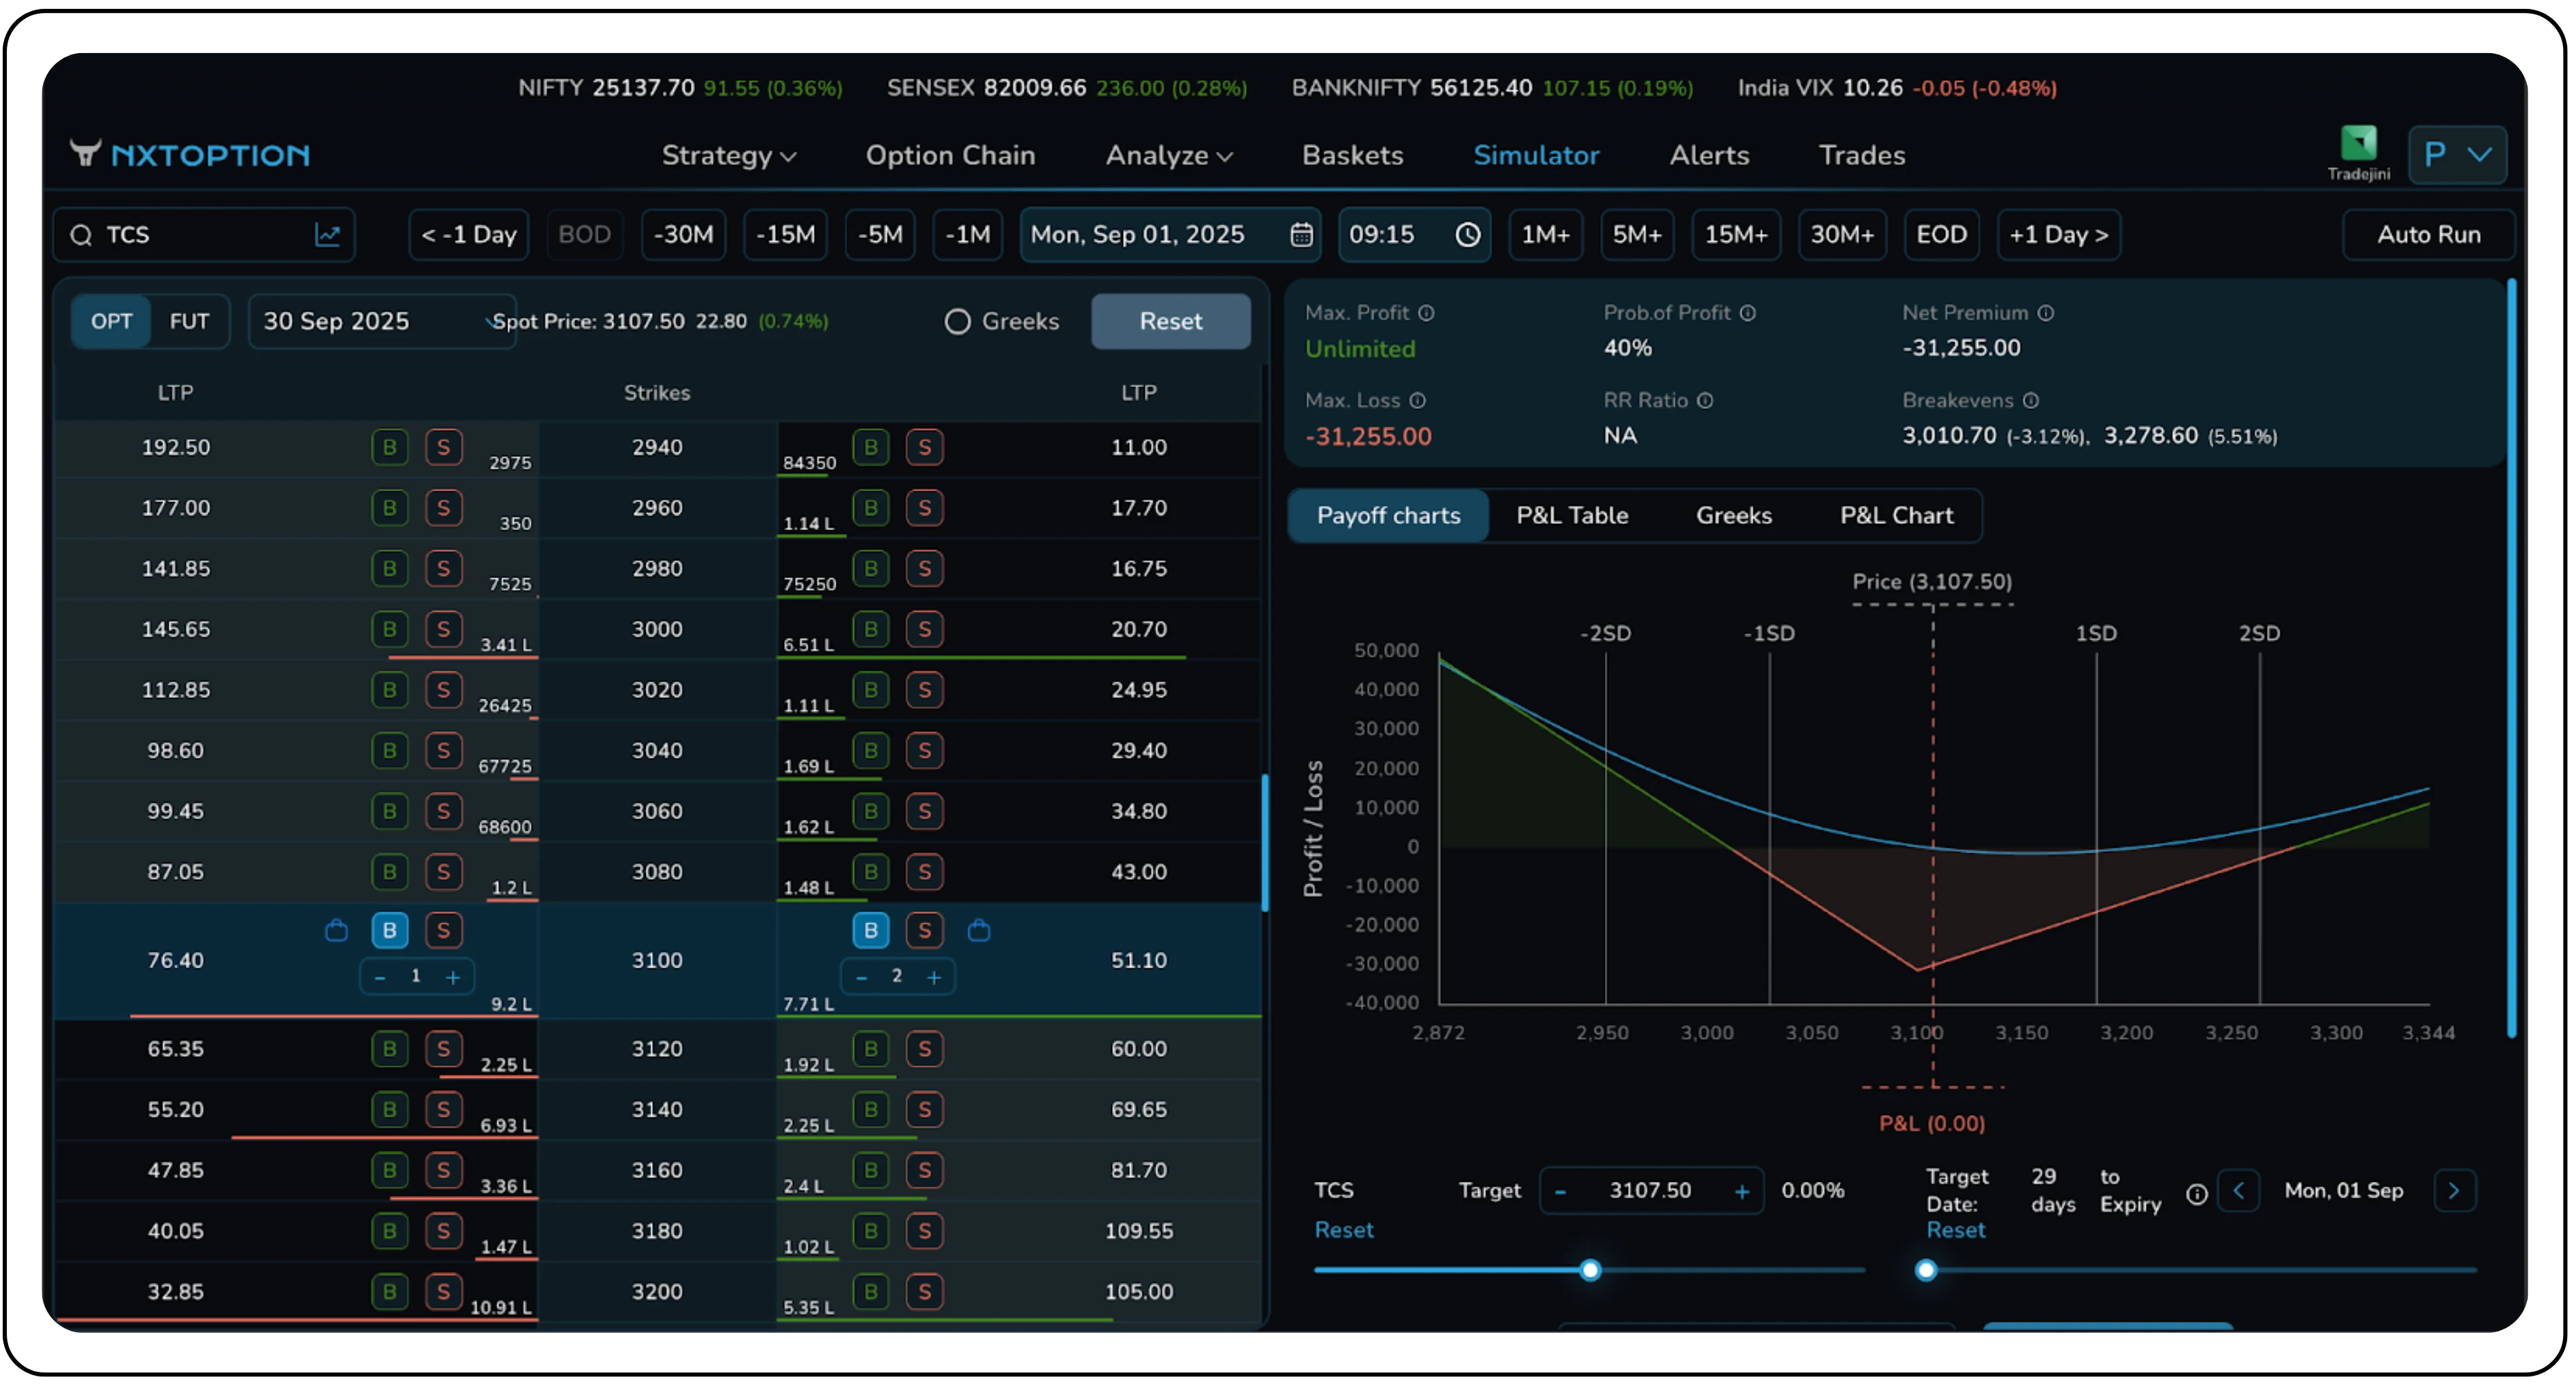
On September 1, 2025, a long volatility strategy with a bearish bias, known as a Long Strip, was initiated on TCS, which was trading at ₹3107.50. This strategy is designed to profit from a significant price move in either direction, with larger gains realized from a downward move.
Legs of the Strategy:
- Buy 1× ATM Call @ ₹76.4
- Buy 2× ATM Put @ ₹51.1
Trade Metrics:
- Net Debit: ₹31,255.00
- Maximum Profit: Unlimited on the upside; substantial profit on the downside.
- Maximum Loss: ₹31,255.00 (the net premium paid)
- Breakeven Points: Upper: ₹3,278.60 / Lower: ₹3,010.70
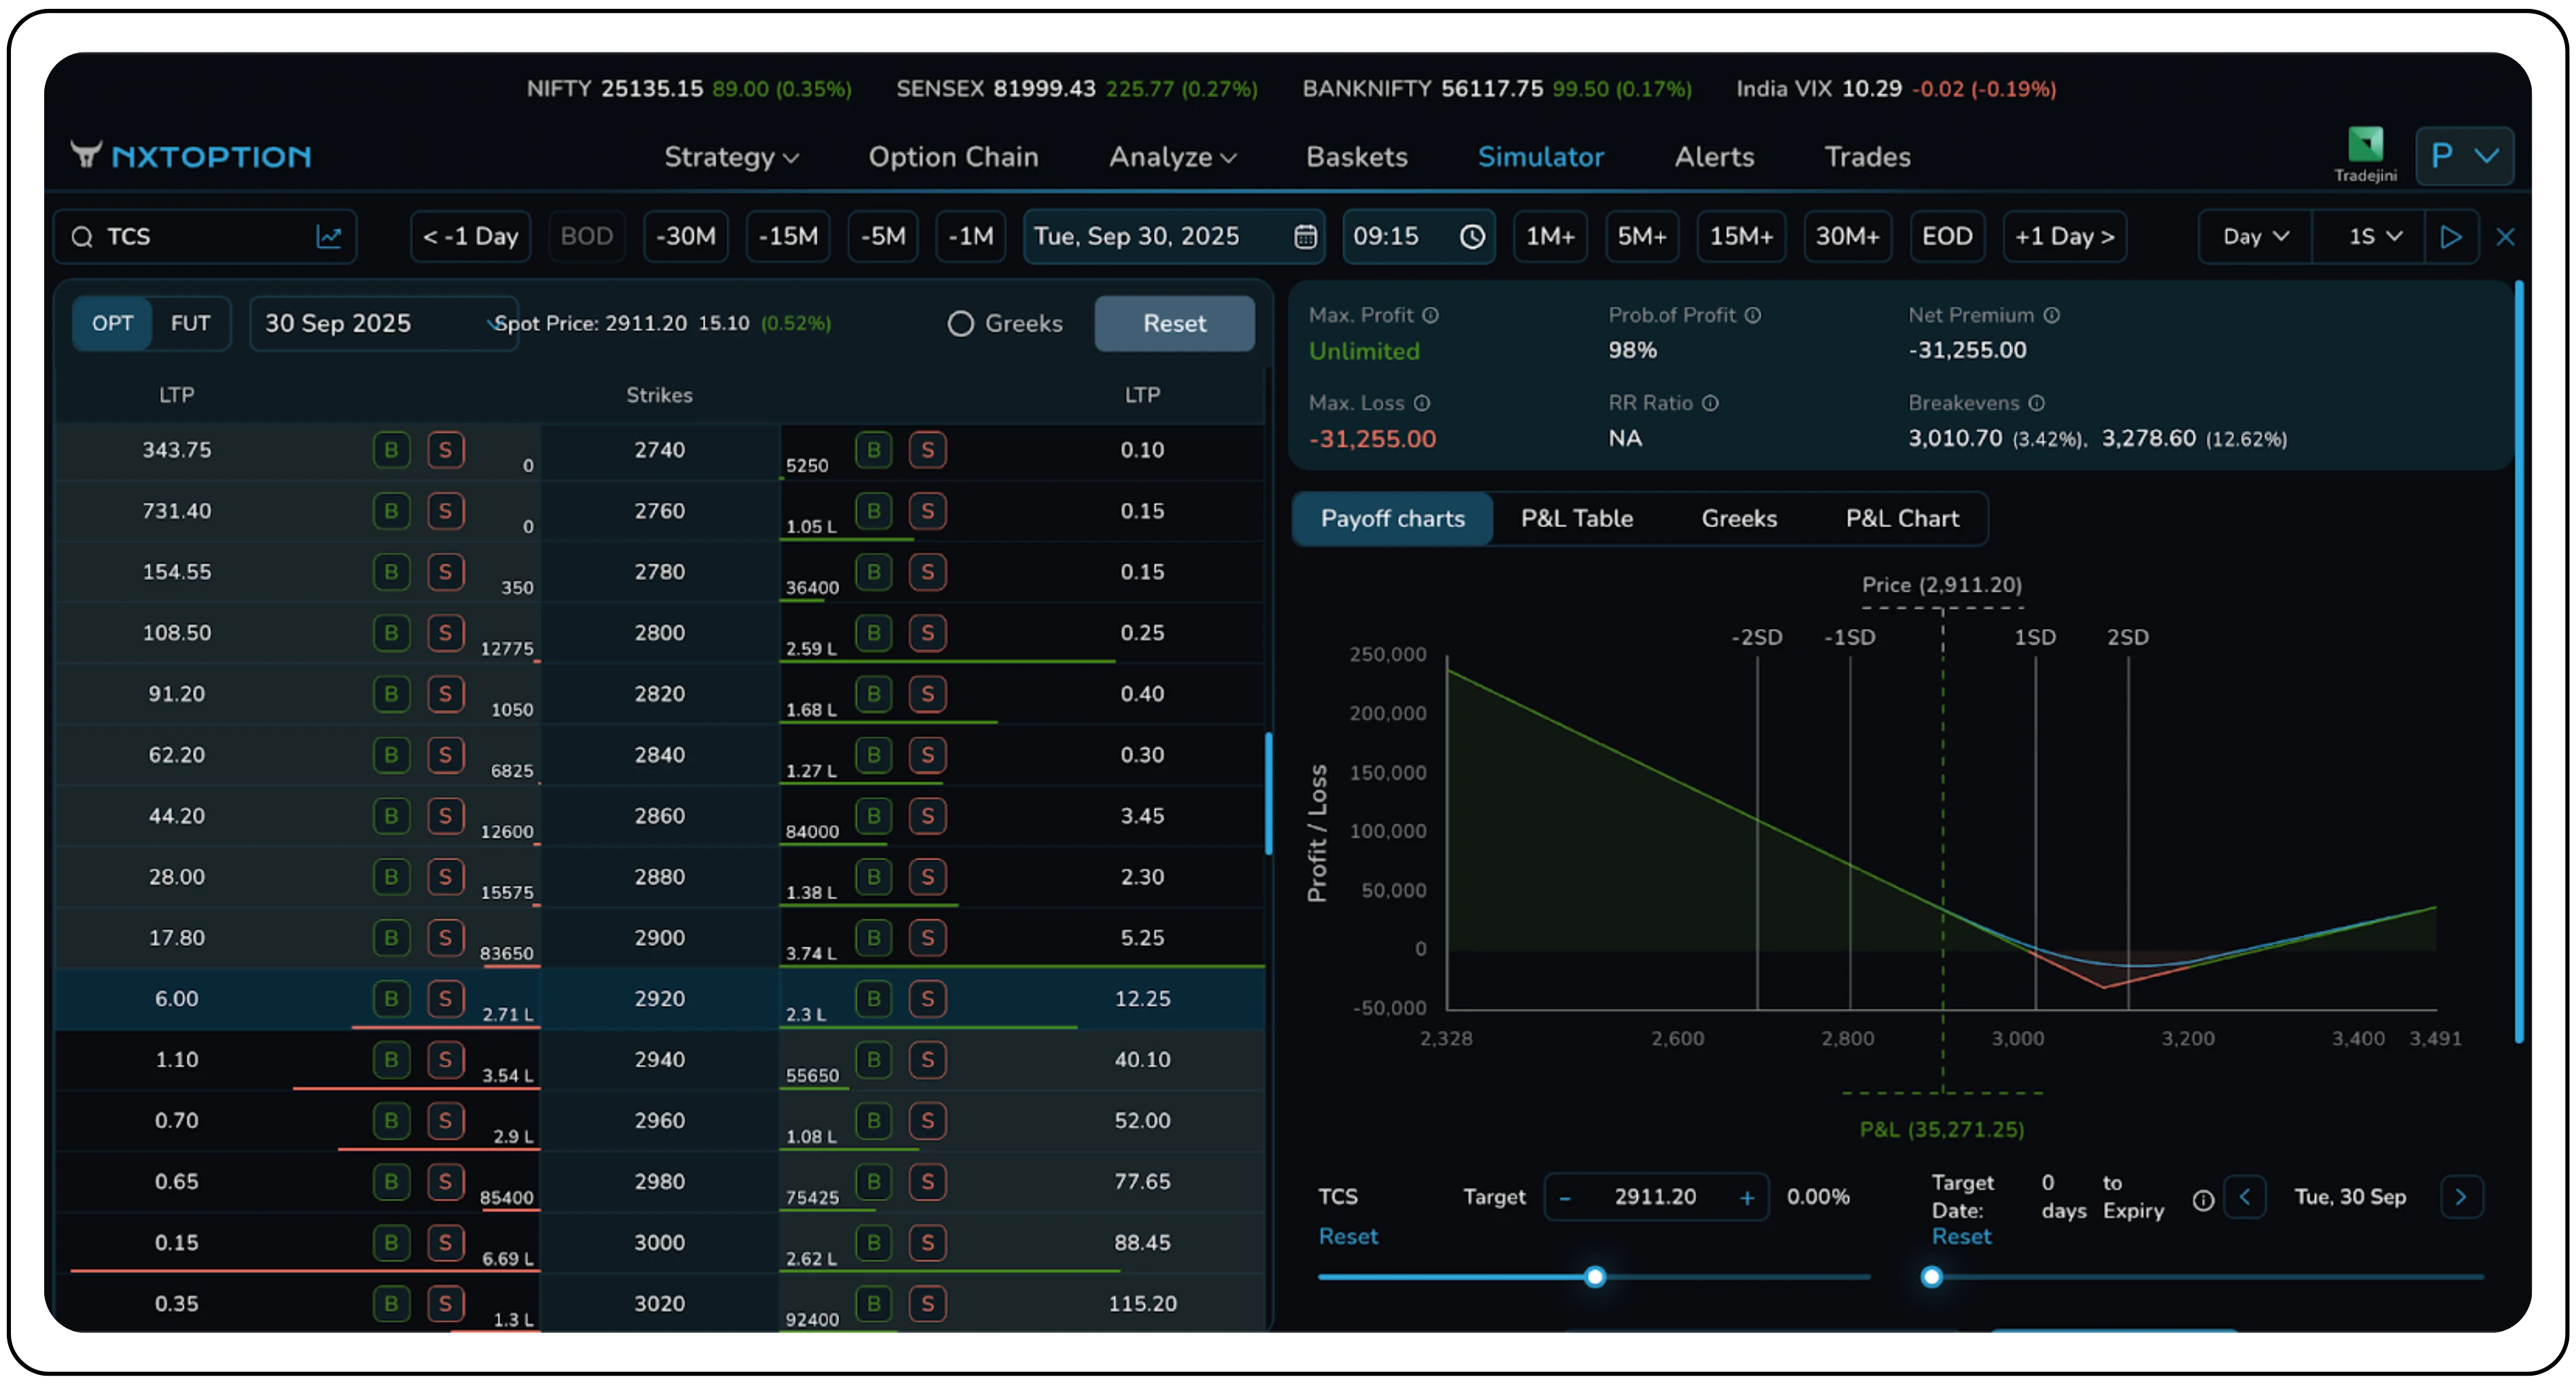
Outcome:
- Expiry: September 30, 2025
- Closing Price: ₹2911.20
- P&L: ₹35,271.25
The trade was established with the expectation of a large price swing (volatility expansion) and was structured with a bearish bias by holding two put options for every one call option.
This expectation played out perfectly. TCS experienced a sharp decline, falling from ₹3107.50 at entry to ₹2911.20 at expiry. This drop of over 6% pushed the stock price well below the lower breakeven point of ₹3010.70.
The downward bias materialized as hoped, and the two long put options generated substantial gains that far outweighed the cost of the single long call, which expired worthless. Furthermore, such a sharp price drop was accompanied by a spike in implied volatility, which would have further increased the value of the long options and amplified the overall profit.
Strap Example
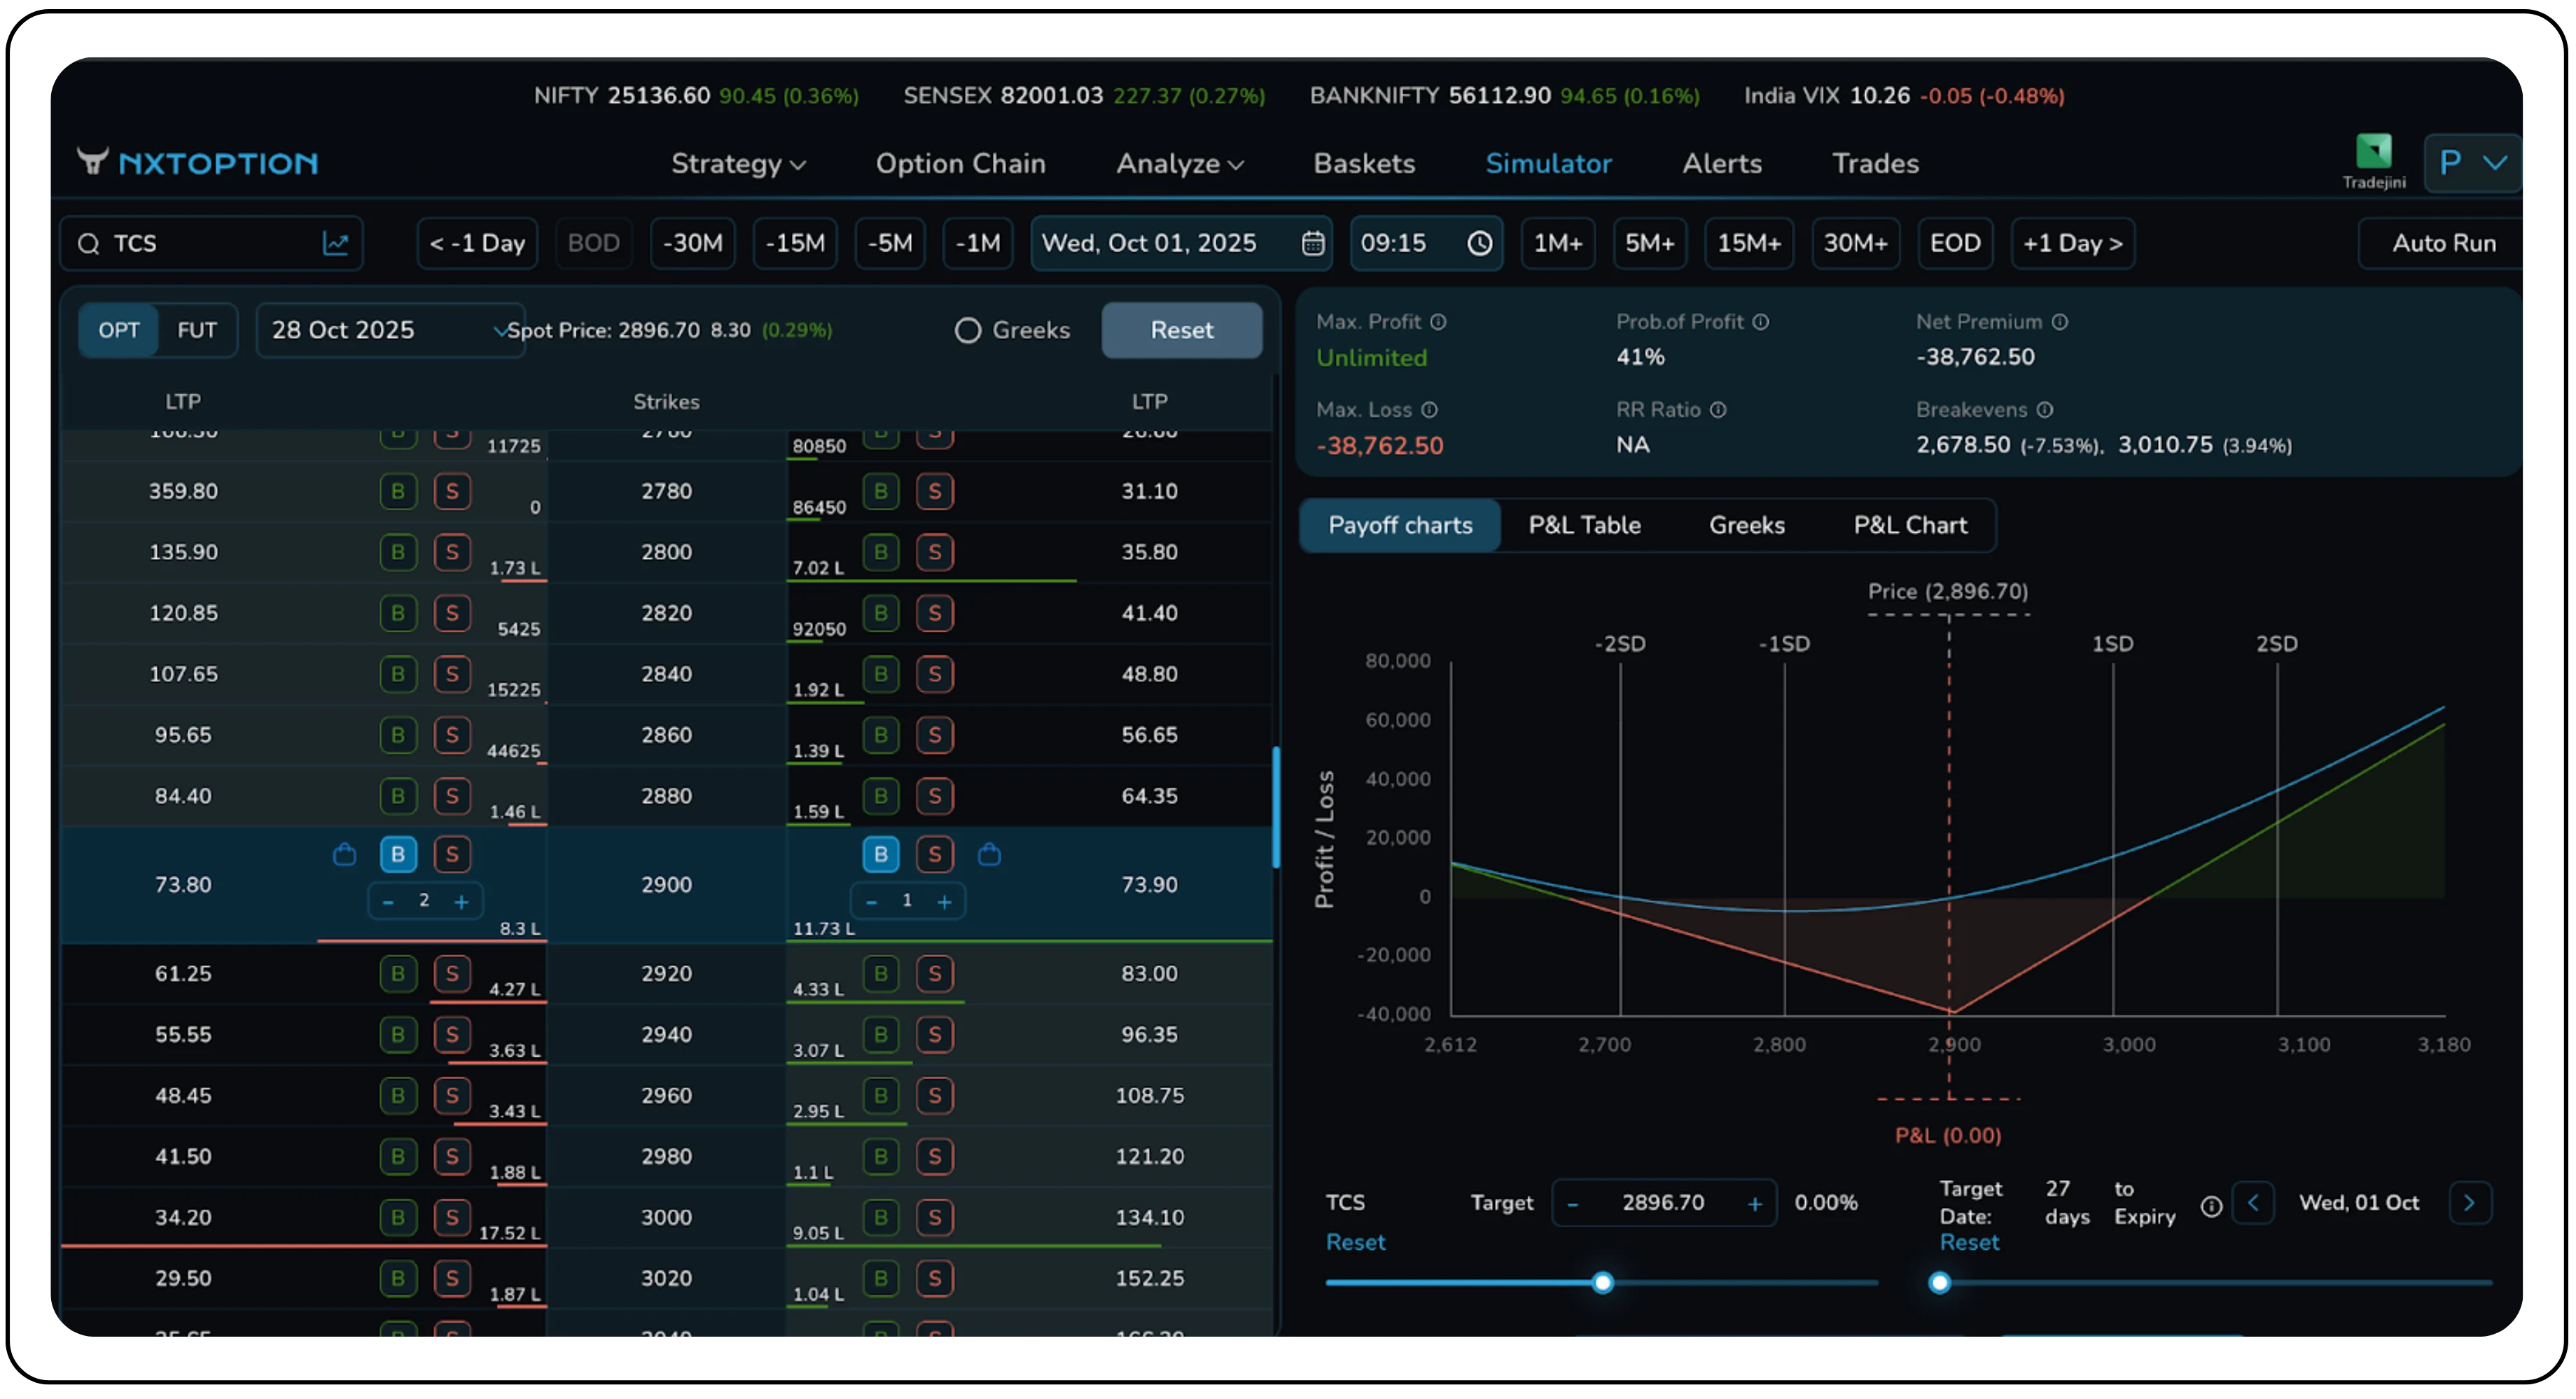
On October 1, 2025, a Long Strap options strategy was deployed on TCS, which was trading at ₹2896.70. This is a long volatility strategy with a bullish bias, structured to achieve maximum gains from a significant upward breakout in the stock price.
Legs of the Strategy:
- Buy 2× ATM Call @ ₹73.8
- Buy 1× ATM Put @ ₹73.9
Trade Metrics:
- Net Debit: ₹38,762.50
- Maximum Profit: Unlimited on the downside; substantial profit on the upside.
- Maximum Loss: ₹38,762.50 (net premium)
- Breakeven Points: Upper: ₹3,010.75 / Lower: ₹2,678.50
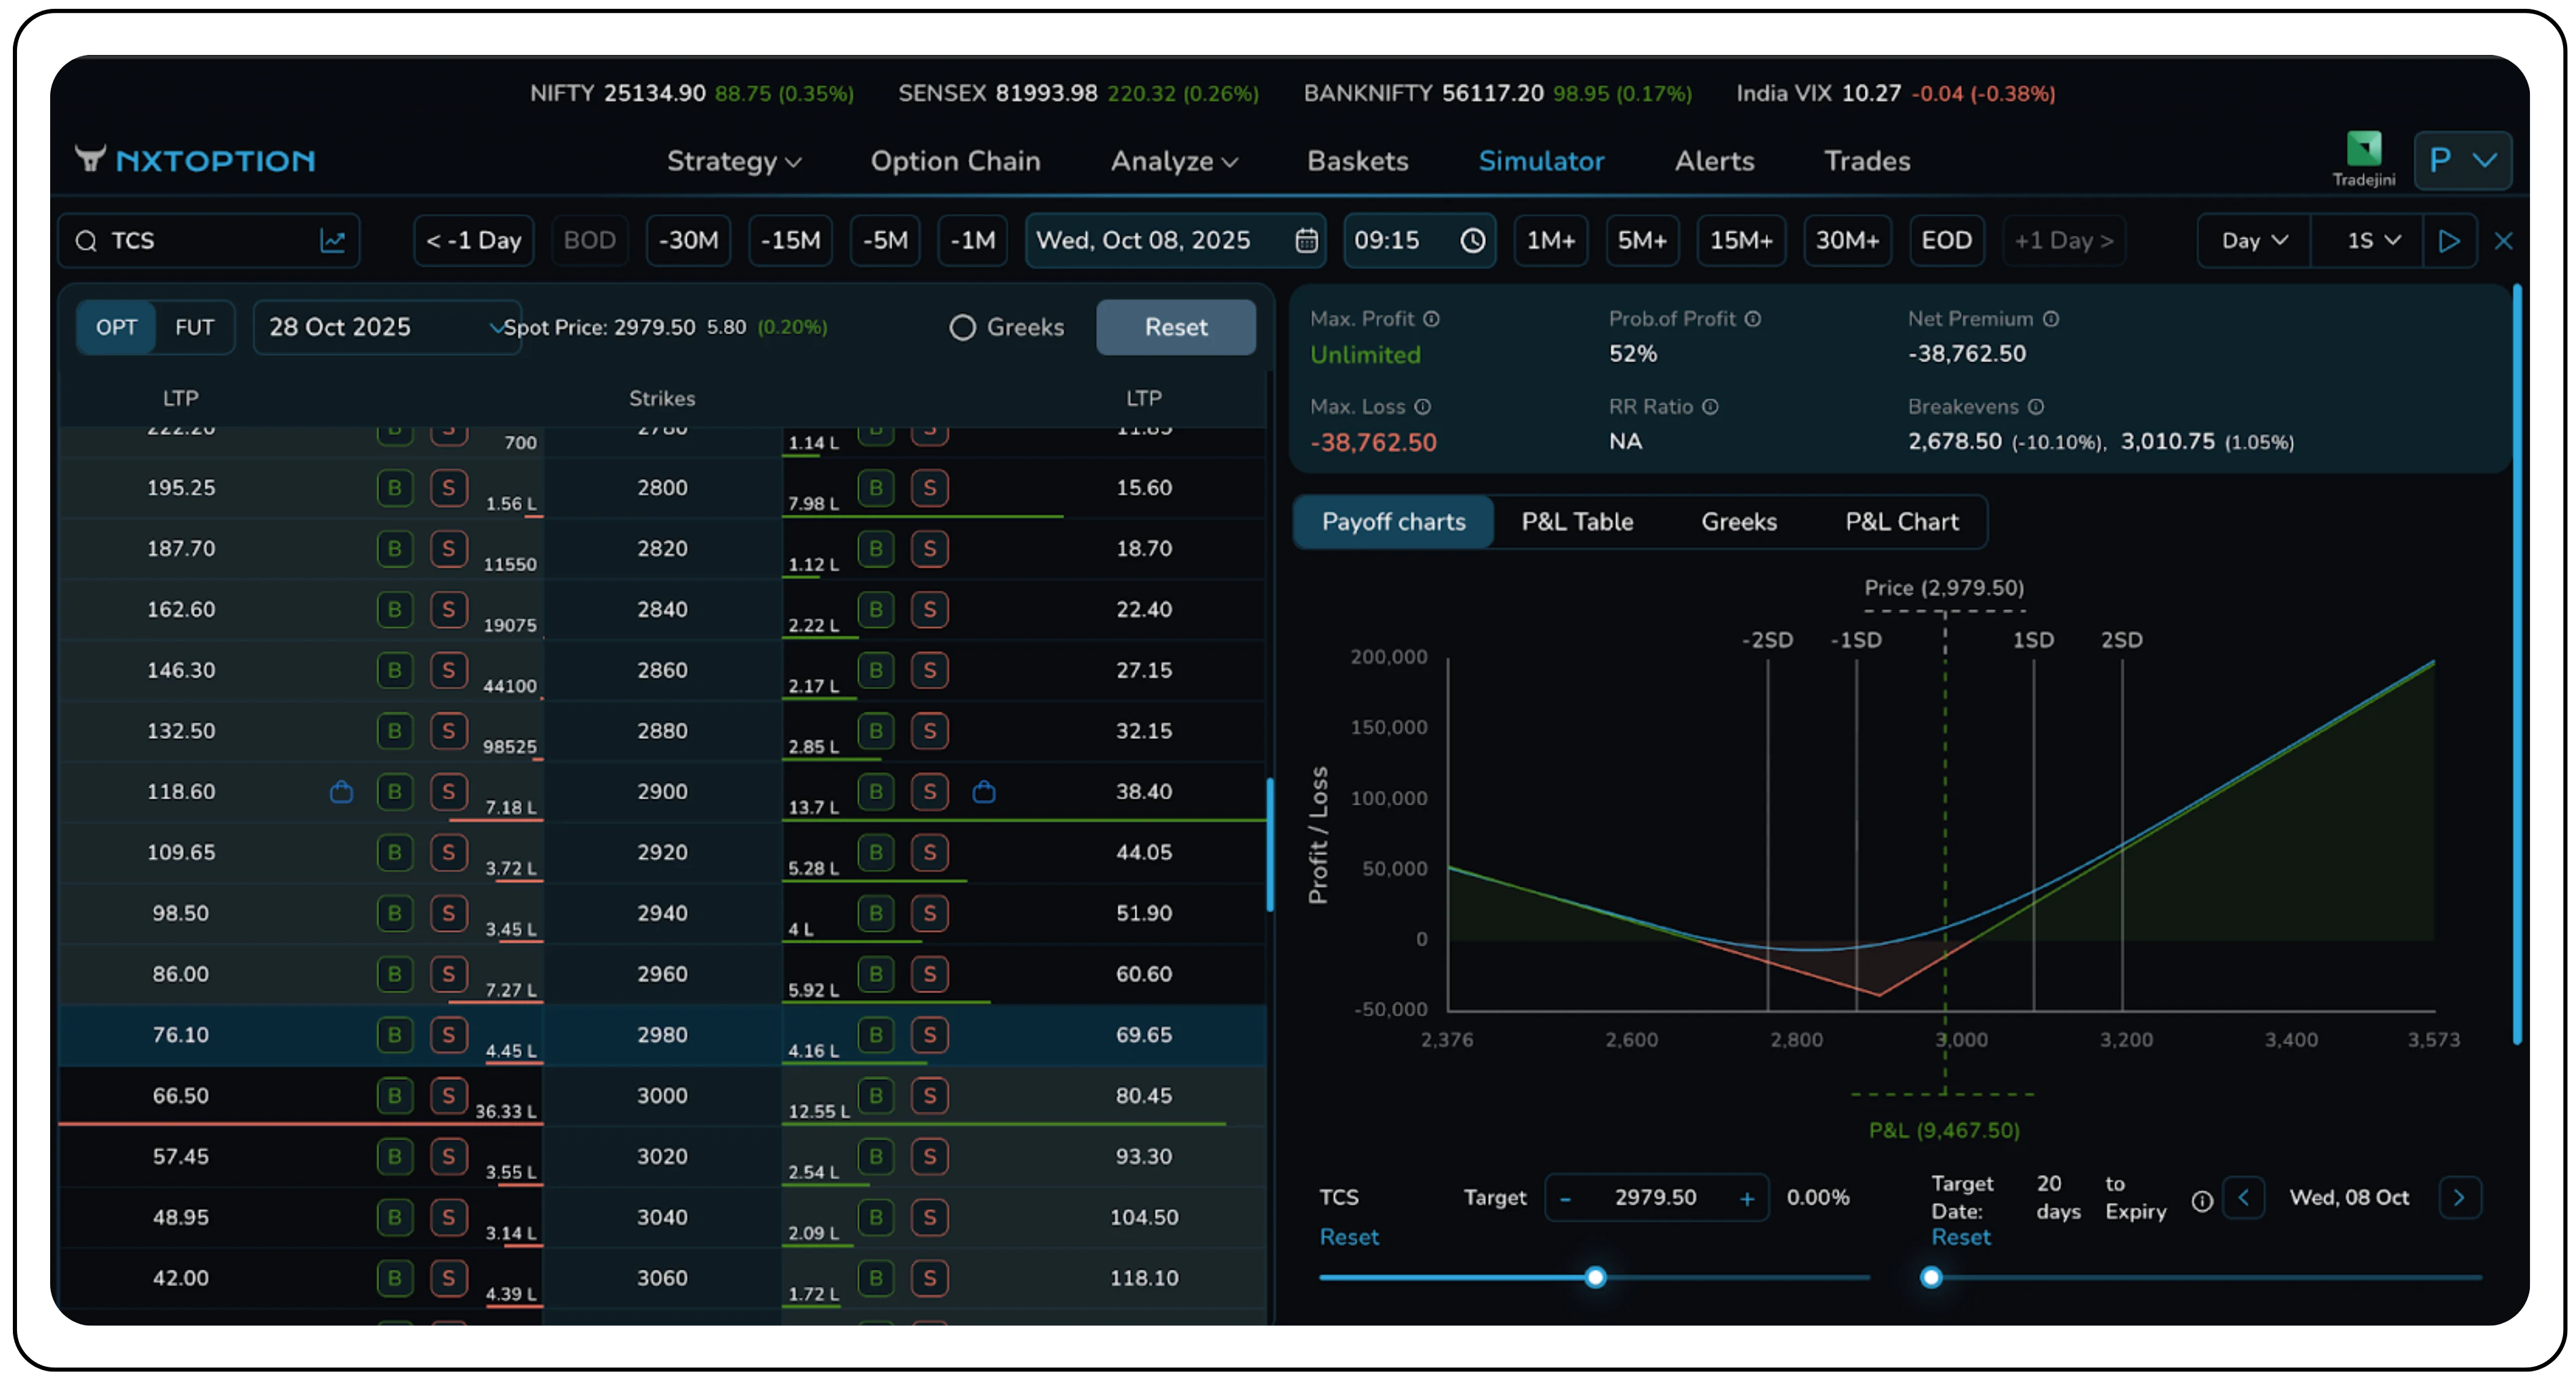
Outcome:
- Expiry: October 28, 2025
- Closing Price: ₹2979.50
- P&L: ₹9,467.50
Analysis:
The trade is currently profitable, with market dynamics moving in a favorable direction. The stock has rallied from ₹2896.70 to ₹2979.50, a move largely driven by market anticipation ahead of the upcoming Q2 earnings call. Given that TCS has a consistent history of posting good results, investors appear to be positioning for a positive announcement.
This pre-earnings environment is crucial for the strategy's success. The run-up to an earnings event typically causes Implied Volatility (IV) to increase as uncertainty builds. The position's profitability, despite the stock price not yet crossing the upper breakeven point of ₹3,010.75, is a clear indicator of this IV expansion.
Risk Management
The main danger in strip and strap strategy in options is stagnation in range bound market conditions—when the underlying asset trades within a narrow band around the strike price in range trading scenarios with limited market exposure. In this case, all three call and put options lose time value, leading to a full loss of the net premium paid with no profit potential.
Mitigation Techniques:
- Strike Selection: Choose exact ATM strikes for high sensitivity; slightly OTM strikes reduce cost but delay profitability.
- Event Timing: Deploy 5–10 days before expected volatility surge; close before IV collapses post-event.
Exit Triggers:
- Exit if the underlying stock price makes ±5–7% price movements before event (lock profit and manage market exposure).
- Exit if implied volatility drops 20% below entry levels.
Position Adjustment:
- Convert a losing strip position into a ratio spread to modify the risk profile and downside risk by selling an extra OTM put if downside move occurs early.
- For the strap strategy, sell one out of the money call option to turn it into a call ratio spread, managing the unlimited risk exposure if upside momentum fades.
Capital Allocation:
- Limit total market exposure to ≤2–3% of portfolio based on risk tolerance.
- Avoid during extreme IV spikes as premiums are inflated.
When Not to Use:
- In range bound market conditions with low catalysts where the underlying price shows limited price movements.
- When IV is already high (e.g., post-announcement).
- For long-term positions—time decay erodes profitability.
Advanced Techniques:
Experienced traders hedge delta dynamically by shorting/longing small quantities of the underlying to neutralize directional drift, or track IV percentile to time exits precisely.
Greeks Interpretation
| Greek | Strip (Bearish Bias) | Strap (Bullish Bias) |
|---|---|---|
| Delta | Slightly negative delta because of 2 puts vs 1 call. Profits accelerate with downward moves. | Slightly positive delta because of 2 calls vs 1 put. Profits accelerate with upward moves. |
| Theta | Theta-negative – three long options lose value over time. Holding through expiry without movement leads to loss. | Theta-negative as well, but slightly higher decay due to two calls. Both require timing precision. |
| Gamma | Long gamma, benefiting from fast price moves either way; larger downside gamma effect. | Long gamma, benefiting from large upward spikes; gamma ensures responsiveness to sharp moves. |
| Vega | Long vega, profits when IV rises (common pre-event). Volatility expansion helps recover time decay. | Long vega, similar behavior; strap benefits more when upside IV skew increases. |
Understanding the Greek profile is non-negotiable. Both strategies demand accurate volatility forecasting and disciplined exits.
Strategic Positioning
The Strip and Strap are the strategist’s tools for volatility trading with directional bias. While straddles treat both directions equally, strips and straps allow traders to express conviction about which side might dominate. The mindset required is one of anticipation, not prediction—positioning for movement rather than direction, but leaning subtly toward one.
Strips fit traders expecting fear-driven volatility, like earnings misses or global sell-offs. Straps align with optimism-driven volatility, such as policy boosts or strong sector momentum.
They outperform a simple long straddle when there's asymmetric risk distribution in the same underlying stock.
However, they require discipline—knowing when to cut losses before theta decay erodes value. Used correctly, these strategies serve as powerful volatility engines during uncertain macro phases.
Conclusion
The strip and strap strategy in options are two sides of the same volatility coin, both offering defined risk with varying profit potential—one bearish, one bullish. They both profit from large moves but assign more weight to one direction.
Before deploying, traders must ask:
- Do I expect significant price movement or range bound stagnation in the underlying stock?
- Which direction has higher probability up or down?
- Am I comfortable paying premium to express that bias?
Understanding the Greek behavior and risk profile particularly delta, gamma, and theta is essential for these options strategies to mastering these tools. These are not “set-and-forget” strategies; they demand active monitoring and precise exit timing.
When used with sound risk management, appropriate market outlook, and timing discipline based on hedging strategies principles, Strip and Strap strategies can transform volatility forecasts into controlled, asymmetric reward opportunities—especially when combined with platforms like CubePlus, which display real-time Greeks and IV changes for every leg.
Disclaimer: The information provided in our blogs is for informational purposes only and should not be construed as financial, investment, or trading advice. Trading and investing in the securities market carries risk. Always conduct your own research and consult with a qualified financial advisor before making any investment decisions. Past performance is not indicative of future results. Copyrighted and original content for your trading and investing needs.
© 2025 — Tradejini. All Rights Reserved.