


One of the most popular tools traders use to find support and resistance zones during a trend is the Fibonacci retracement, or, as some call it, the Fibonacci pullback. Different words, same concept.
But here is the catch: while almost every trading platform offers this drawing tool, most people do not use it correctly or consistently.
Let us break it down step by step in a way that actually makes sense.
What is a Fibonacci retracement?
Fibonacci retracement levels are a tool used in technical analysis to identify possible reversal points in a stock's price movement. They are based on specific ratios that come from the Fibonacci sequence — a series of numbers where each one is the sum of the two before it.
The most commonly used retracement levels are 61.8%, 0.50% and 38.2%, often rounded off to 62% and 38%. Traders apply these levels after a price rise to predict how much the price might pull back (or correct) before it possibly continues upward again. Similarly, after a decline, they can be used to predict how far a bounce might go.
Fibonacci retracement levels do not guarantee reversals but serve as warning zones where a price change might occur. When used alongside other tools like candlestick patterns, volume, or momentum indicators, they can become powerful parts of a trading strategy.
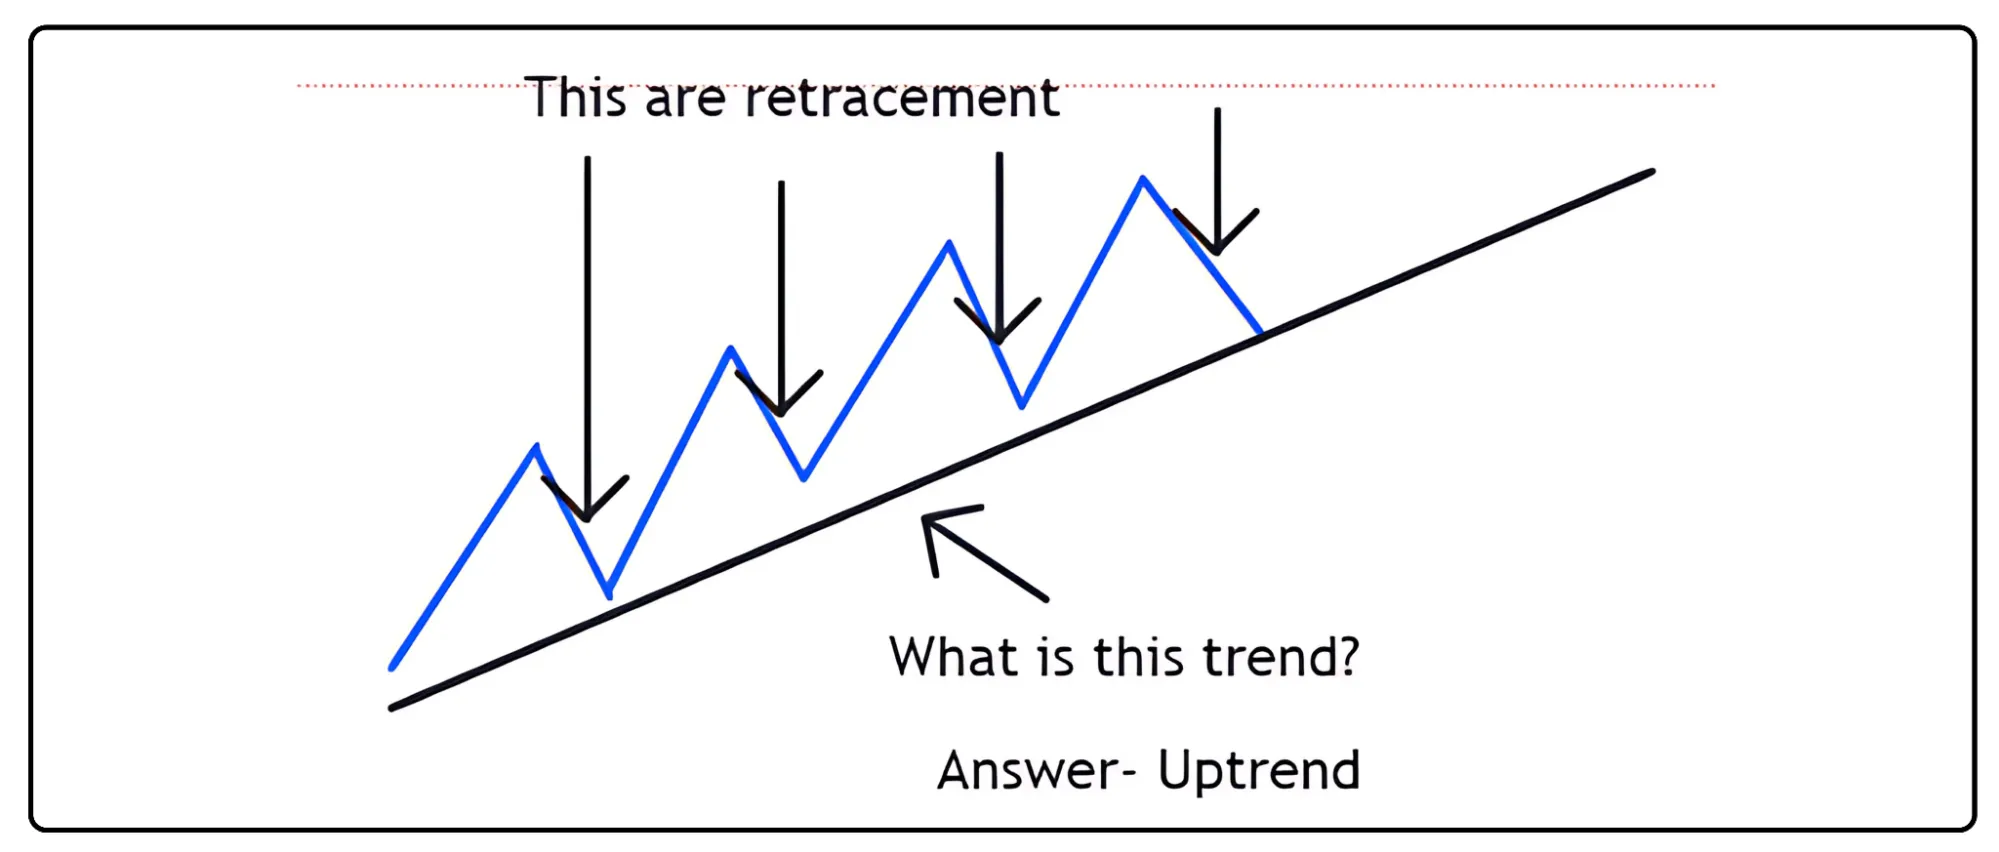
The image below illustrates Fibonacci levels and how price movements may retrace, reverse, or consolidate around these levels.
When the market is in an uptrend
You draw your Fibonacci from the swing low to the swing high. This helps you identify where the price might retrace before moving higher.
Let us learn how to plot Fibonacci levels step by step.
Step 1: Identify the Swing Low and Swing High
Swing Low: This is the lowest point before the uptrend started. This is where buyers stepped in and the price began to rise.
Swing High: This is the highest point where the price peaked before it started to pull back or consolidate.
Step 2: Open the Fibonacci drawing tool on cubeplus
Find it in your toolbar — usually represented by a percentage icon or labeled ‘Fib retracement.’
Step 3: Draw from Bottom Wick to Top Wick
Using the tool:
Click on the lowest wick of the swing low (start point).
Drag your cursor to the highest wick of the swing high (end point).
Release the mouse or tap when you are done.
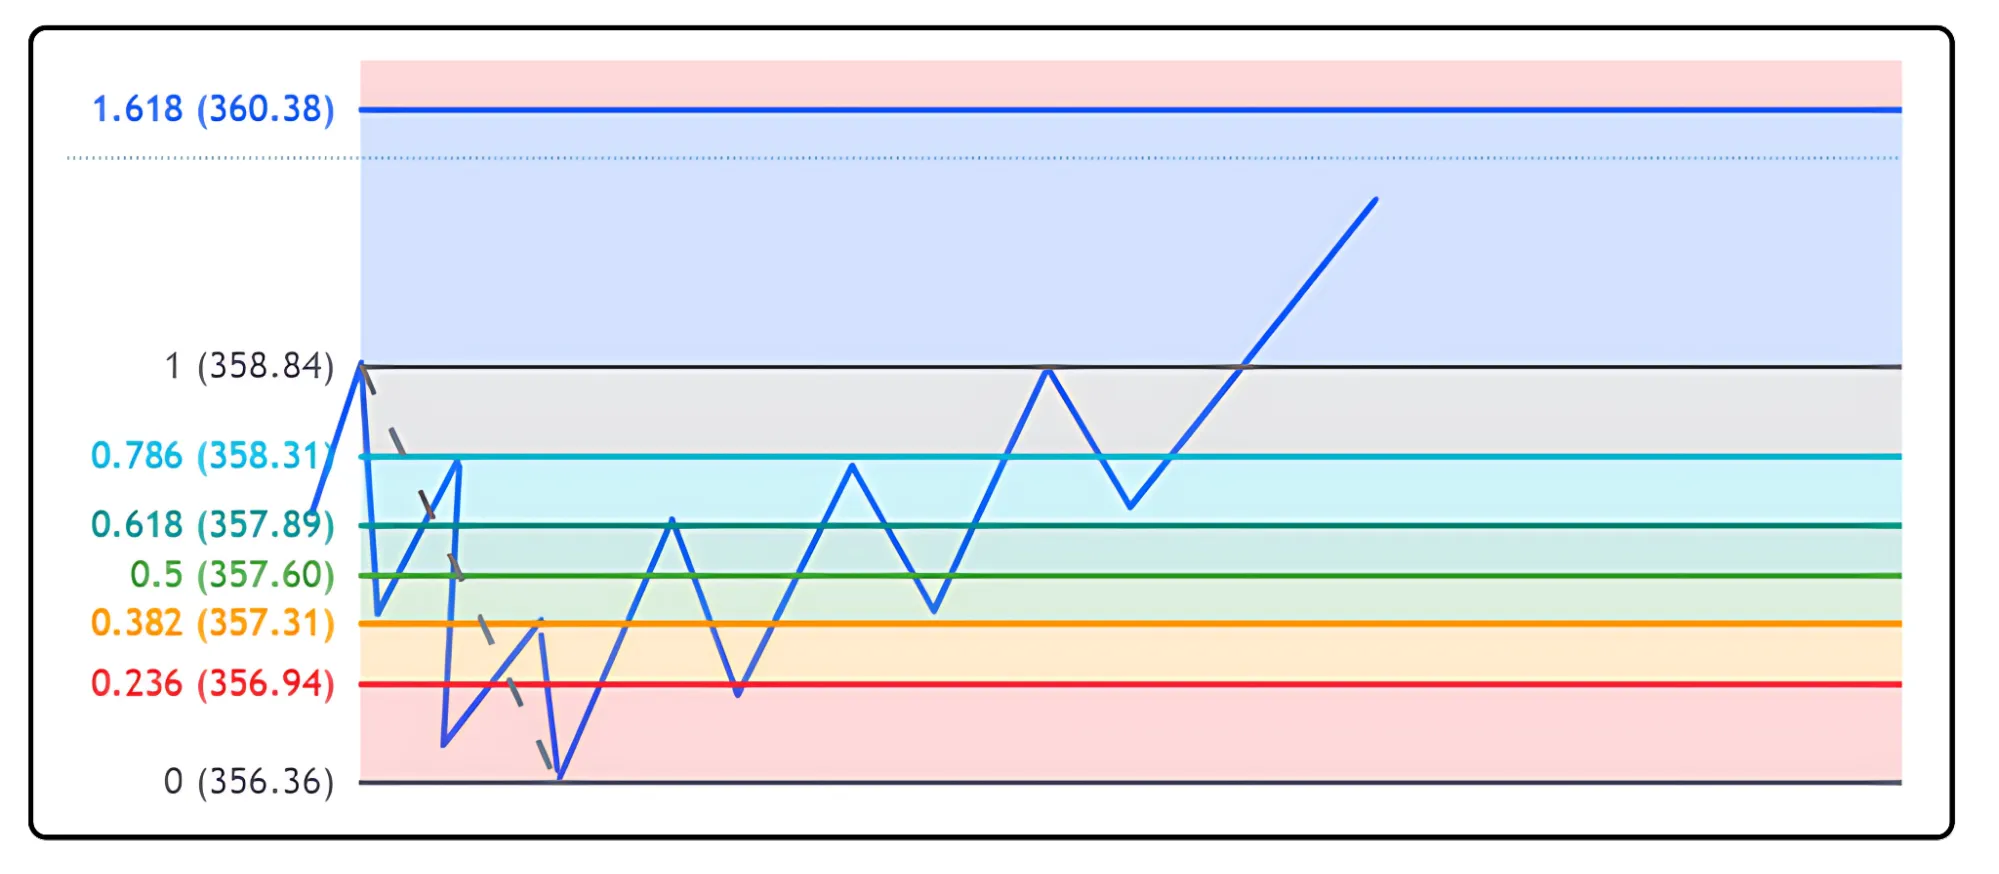
This will plot horizontal lines at key Fibonacci levels like 23.6%, 38.2%, 50%, and 61.8%, and sometimes more.
Step 4: Observe the Pullback Zones
Now that the Fibonacci levels are drawn, wait and watch:
If the price pulls back after the uptrend, it often bounces from one of the Fibonacci lines.
The 38.2%, 50%, and 61.8% levels are the most common support zones where the price might reverse and continue upward.
There are two valid ways to draw it:
1. Wick-to-wick method
Start from the lowest wick of the swing low and drag it to the highest wick of the swing high.
This captures the full price movement — including intraday extremes.
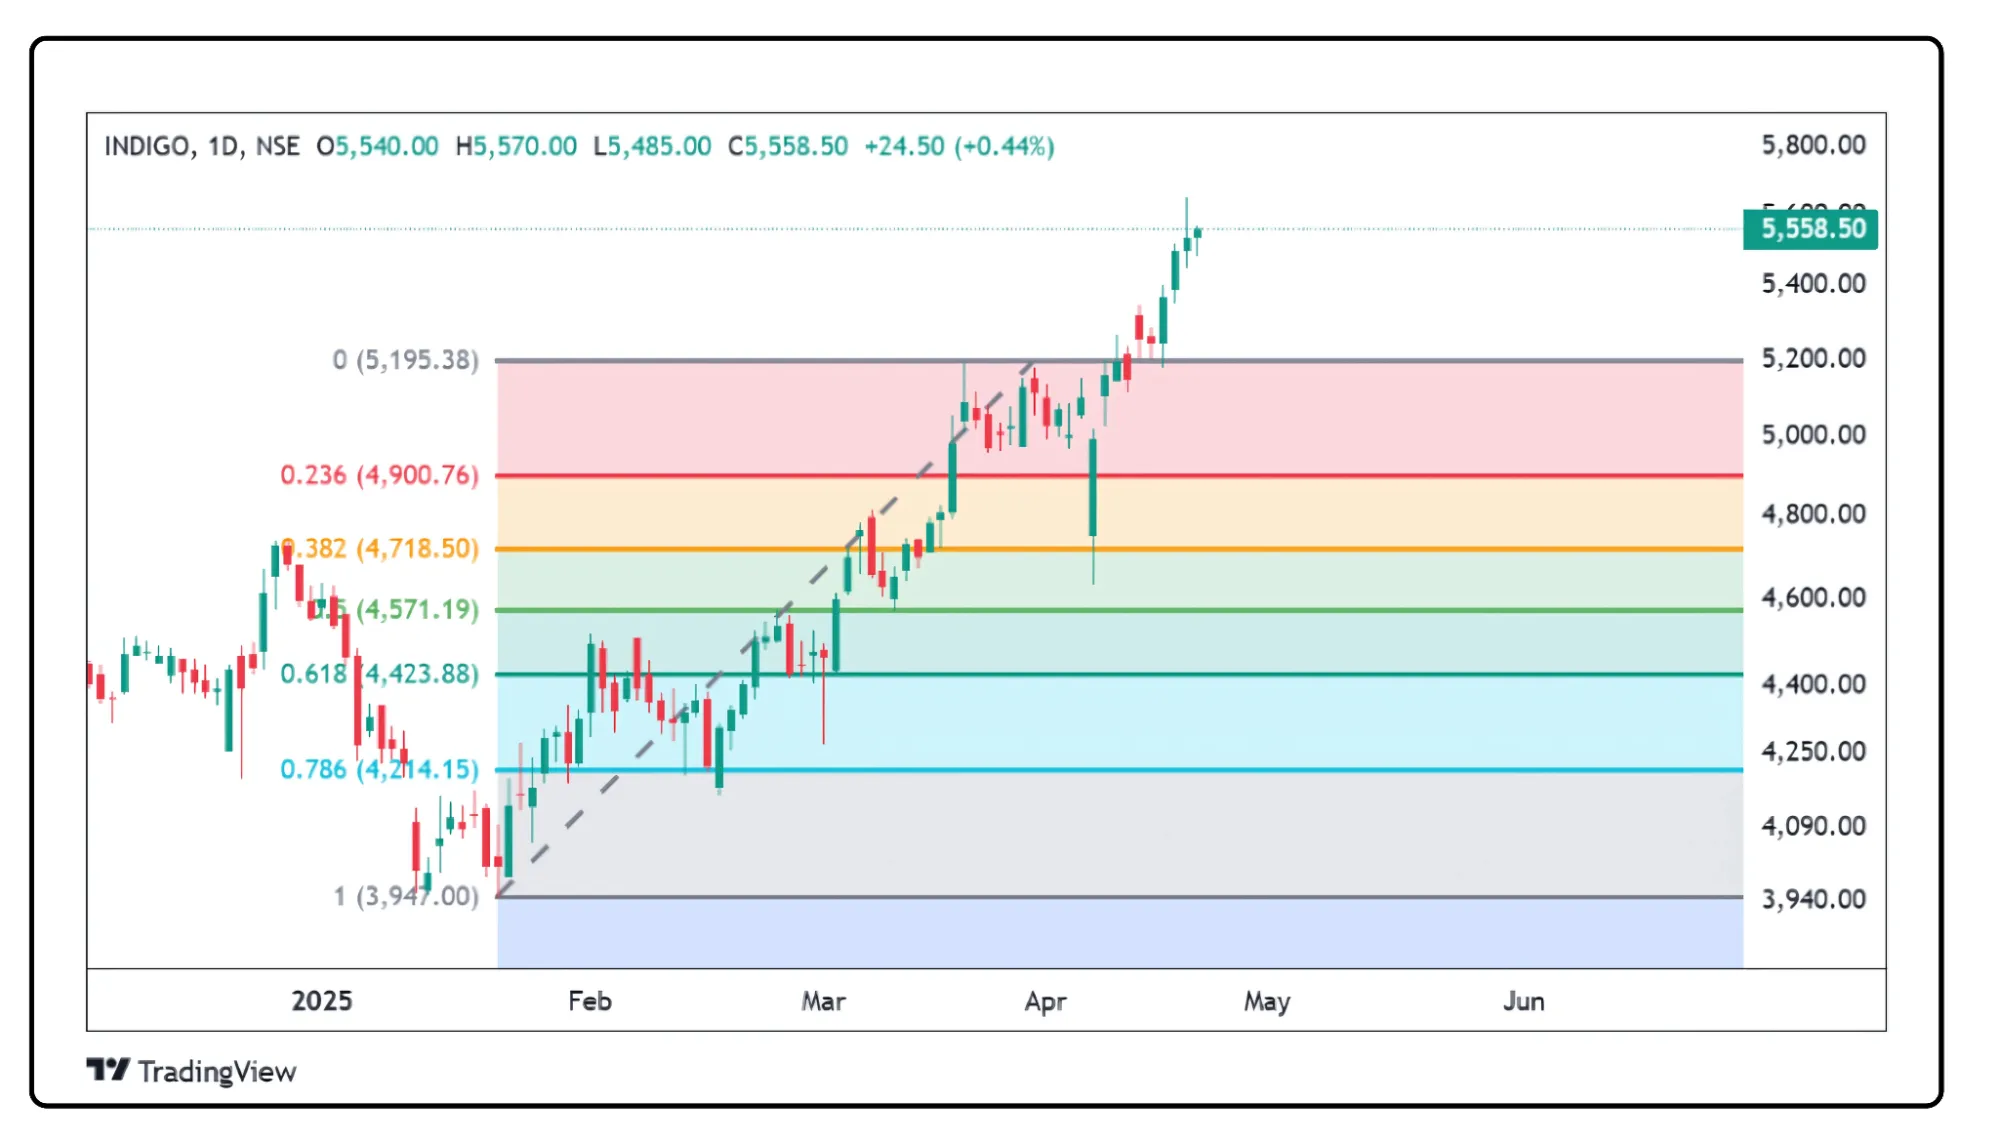
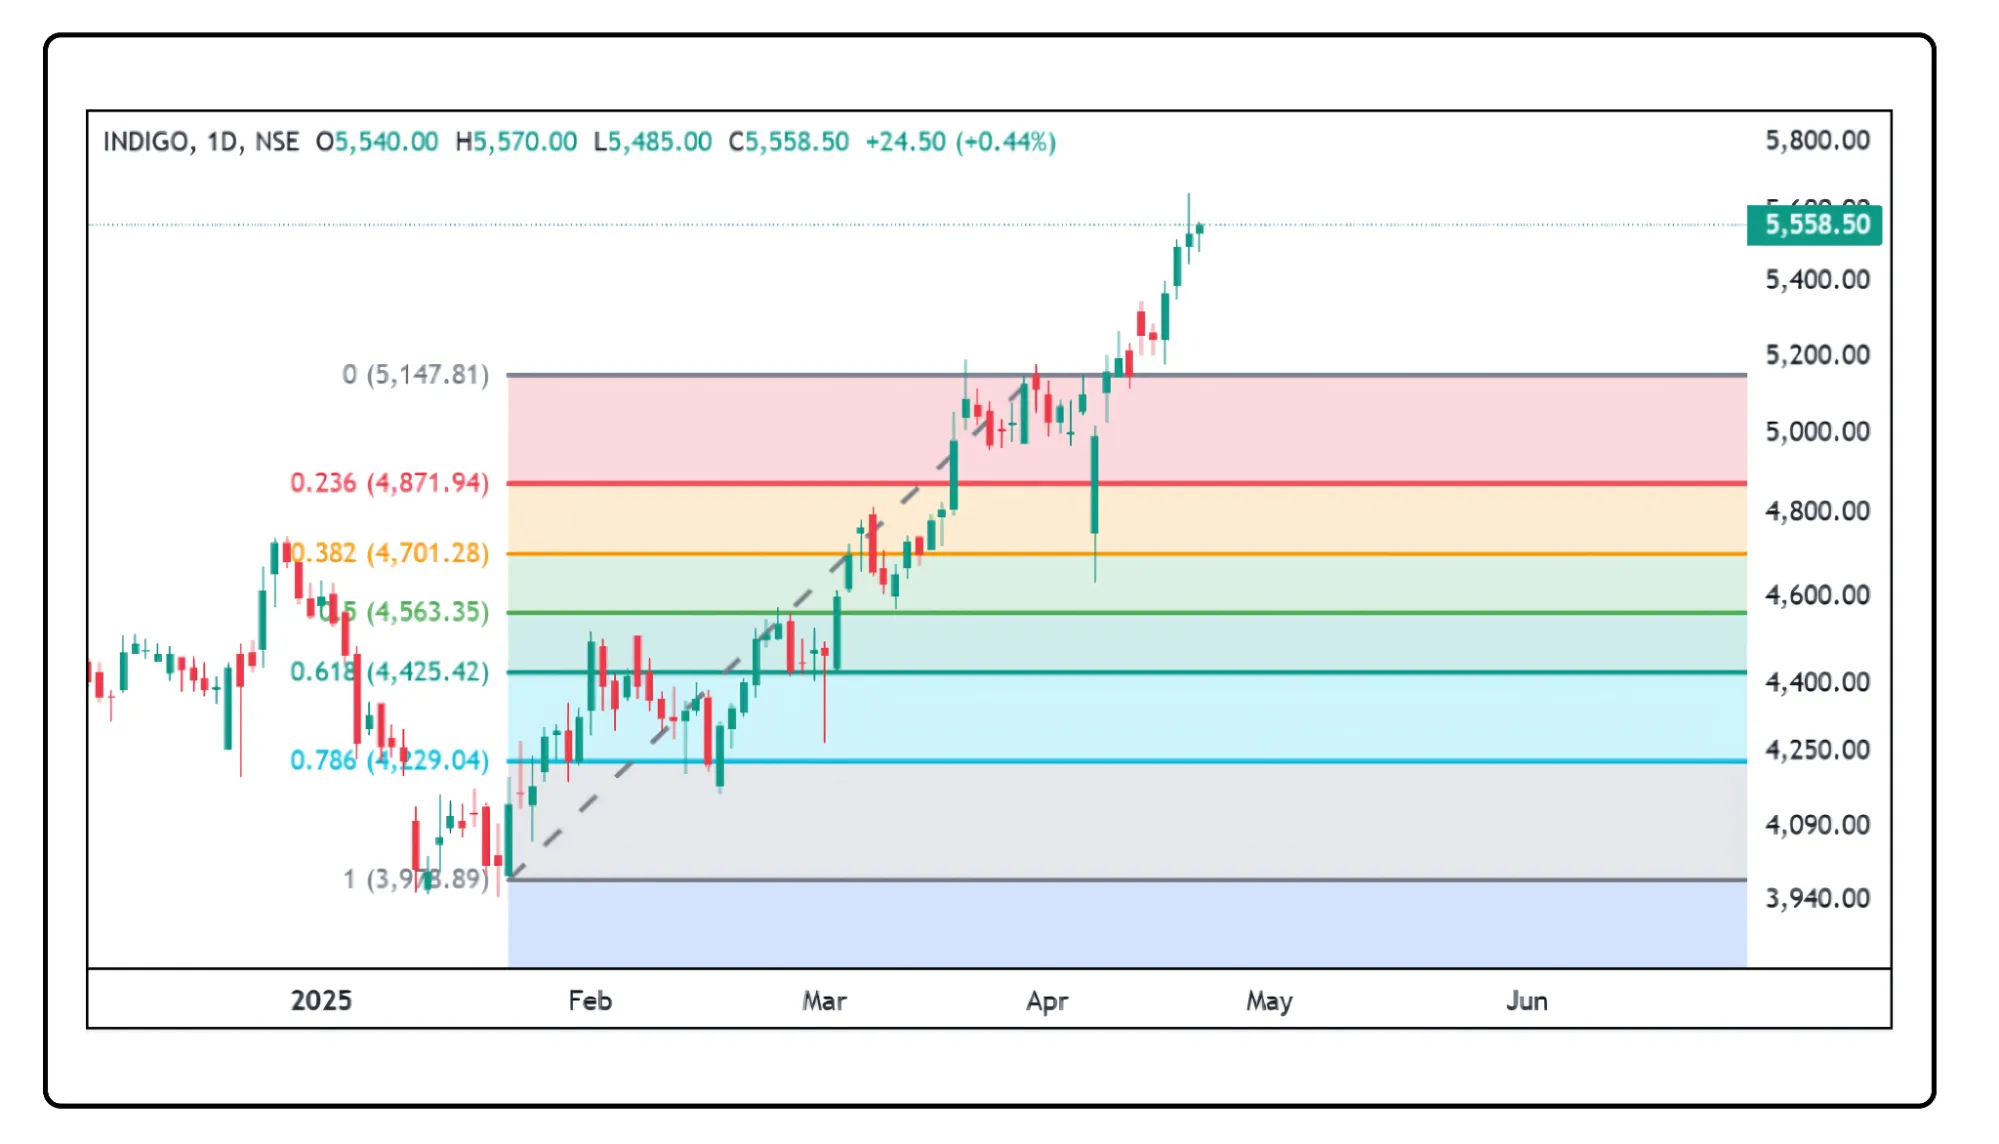
On the Indigo chart, once the uptrend began, Fibonacci levels were plotted. The price took pullbacks at the 0.786, 0.618, 0.5, and 0.382 levels before continuing its upward movement. This pattern makes it easier to identify potential entry points during pullbacks within the ongoing trend.
2. Close-to-close method
Draw from the closing price of the swing low candle to the closing price of the swing high candle.
This is more conservative and works well if you prefer focusing on closing prices over wicks.
Both methods are correct. The key is consistency. Pick one and stick with it.
In a downtrend
Draw from the swing high to the swing low using either the wick-to-wick or close-to-close method. This helps you spot resistance levels, where price might bounce temporarily before continuing downward.
Step 1: Open the Fibonacci drawing tool on CubePlus
Locate it in your toolbar — usually shown as a percentage icon or labeled ‘Fib retracement.’
Step 2: Draw from Top Wick to Bottom Wick
Using the tool:
Click on the highest wick of the swing high (start point).
Drag your cursor down to the lowest wick of the swing low (end point).
Release the mouse or lift your finger when done.
This action will draw horizontal lines at key Fibonacci levels like 61.8%, 50%, 38.2%, and 23.6%, and sometimes additional levels.
Step 3: Observe the Pullback Zones
With the Fibonacci levels in place, keep an eye on the price movement:
After a downtrend, if the price starts to pull back upward, it often faces resistance at one of the Fibonacci lines.
The 38.2%, 50%, and 61.8% levels are the most common resistance zones where the price may halt its recovery and continue downward.
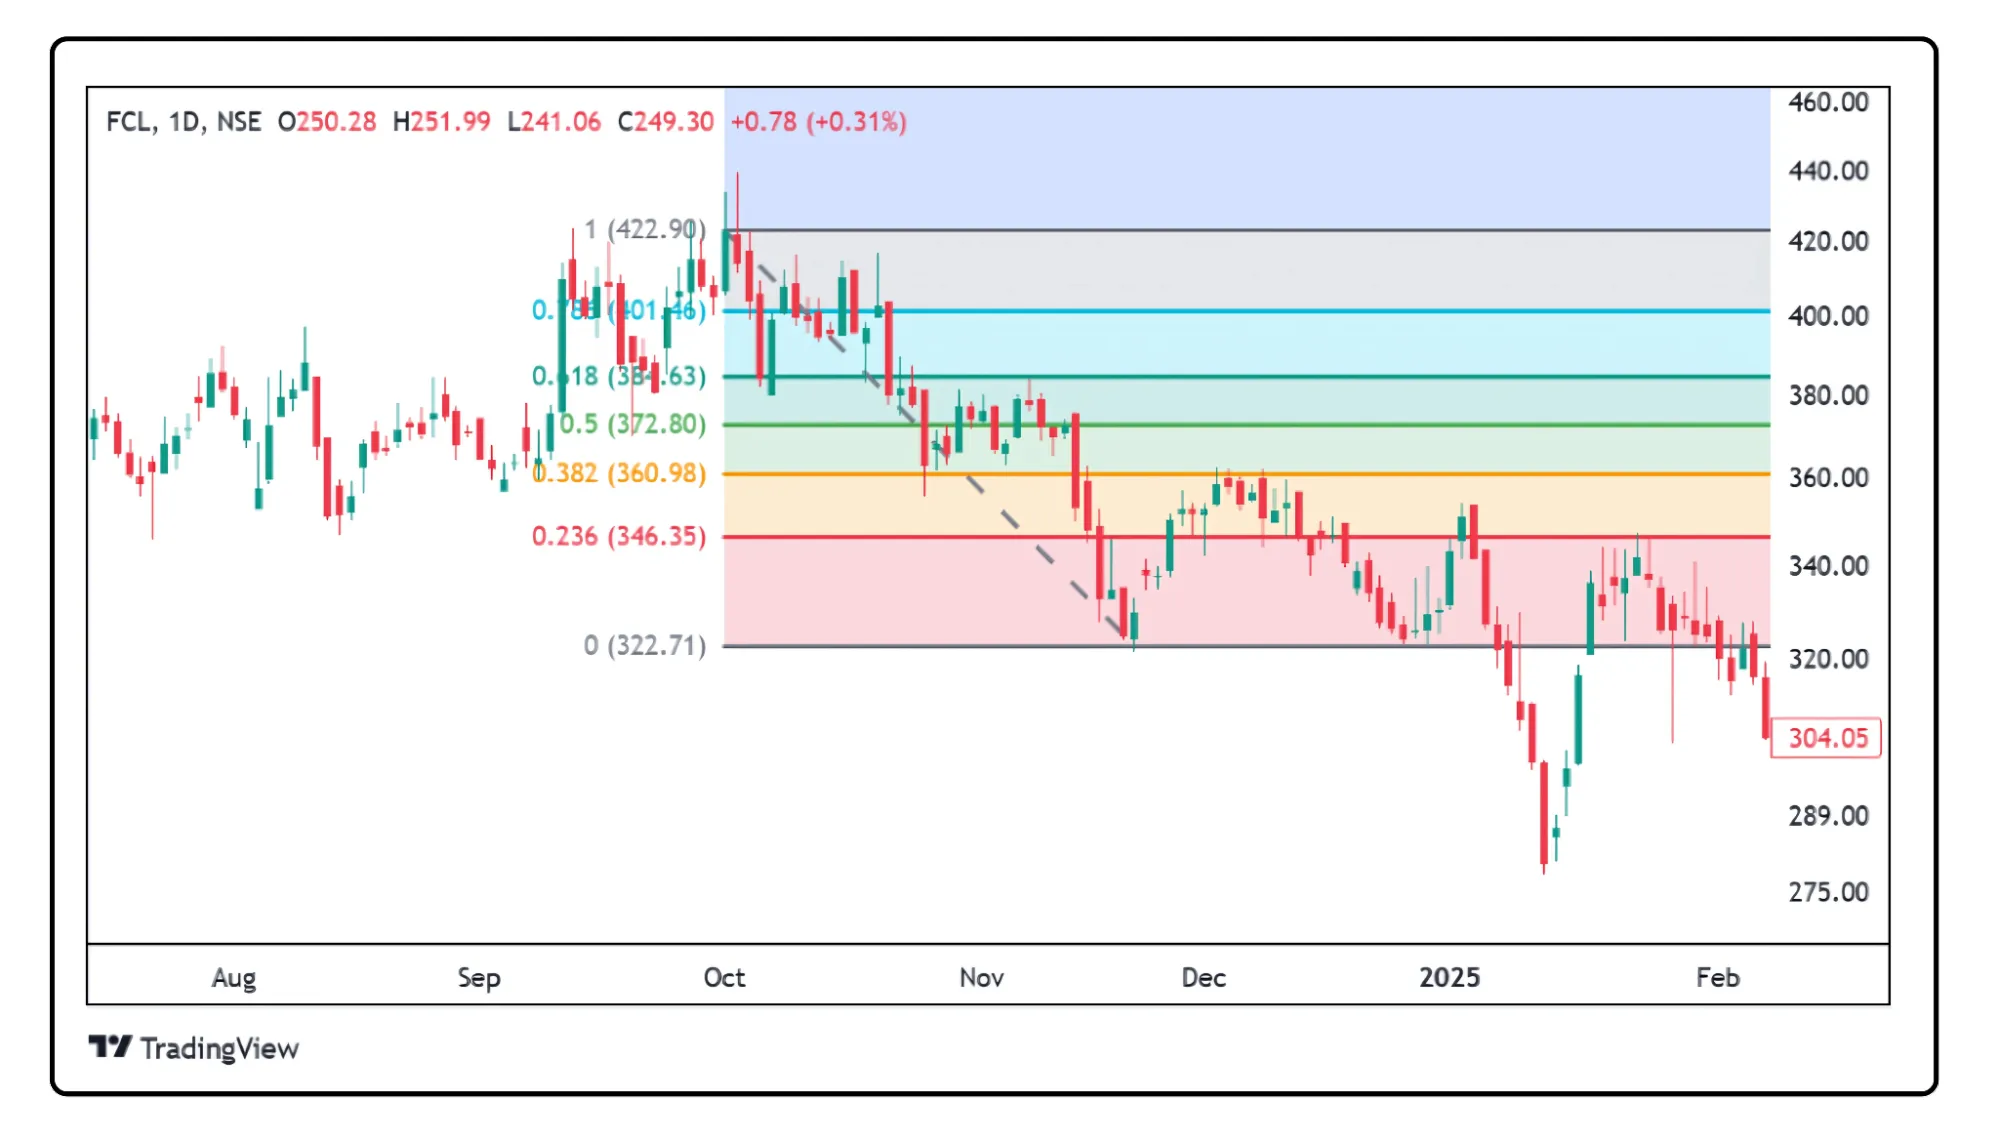
On the FCL chart, Fibonacci levels were plotted after the stock shifted into a downtrend by identifying a clear swing high and swing low. The chart shows how the price bounced off the 0.618, 0.382, and 0.236 levels before continuing its downward move. These bounce points offered potential sell entry opportunities in line with the downtrend.
Why does consistency matter?
Think of Fibonacci like a compass. If you keep switching how you use it, how will you trust where it is pointing?
Using different methods randomly leads to:
Confusion
Inaccurate support/resistance levels
Missed or mistimed entries
So, whether you choose wicks or closes — be disciplined. Stick with one style across your charts.
Putting It All Together
Fibonacci retracement levels help traders and investors estimate how far a pullback or bounce might go before the original trend resumes. They do not give you exact answers but act as ‘alert zones’ where you should watch the market more closely.
While 23.6% retracements do happen, most pullbacks or bounces fall somewhere between 38.2% and 61.8% — with 50% sitting right in the middle. Think of this range as your ‘reversal watchlist.’
To make the most of these levels, combine them with other tools — candlestick signals, chart patterns, indicators, or volume trends. The more clues you get pointing to a reversal, the stronger the case.
Disclaimer: The information provided in our blogs is for informational purposes only and should not be construed as financial, investment, or trading advice. Trading and investing in the securities market carries risk. Always conduct your own research and consult with a qualified financial advisor before making any investment decisions. Past performance is not indicative of future results. Copyrighted and original content for your trading and investing needs.
©️ 2025 — Tradejini. All Rights Reserved.