


When people think of technical analysis, the usual suspects that come to mind are trendlines, moving averages, maybe a few candlestick patterns. But there is one tool that quietly sits in the background, used by traders who like to dig a little deeper, that is the Gann Fan.
It may sound like something complex from a geometry textbook, but at its core, it is just a smarter way to read price action through the lens of time. Built on the idea that markets move in predictable angles, the Gann Fan helps you track trends, spot reversals, and add structure to your trading.
Imagine a Fan on chart
Think of a fan opening up from a specific price point on a chart. That is literally what the Gann Fan looks like.
From a swing high or swing low, you draw several diagonal lines (called Gann angles) at fixed angles. These act as dynamic support and resistance levels. As price moves, these lines help you track:
Strength of the trend
Momentum shifts
Potential reversal zones
What do these lines mean?
The most important line in the Gann Fan is the 1x1 angles — also known as the 45-degree line. Here is what it (and other angles) represent:
| Gann Angle | Meaning | Trend Indication |
|---|---|---|
| 1x1 | 1 unit price : 1 unit time | Balanced trend (45°) |
| 2x1 | 2 units price : 1 unit time | Strong uptrend (steeper) |
| 1x2 | 1 unit price : 2 units time | Weak trend / slowing momentum |
| ... | Other angles (3x1, 4x1, etc.) | Indicate varying strength |
How to Use
Step-by-step instructions:
Right-click anywhere on your chart.
Select the option labeled ‘Settings’ and go to the ‘Scales’ tab.
Check the box that says ‘Lock Price to Bar Ratio’.
Once this is enabled, adjust your chart vertically or horizontally until the 1 by 1 line appears at a perfect forty-five degree angle.
.webp?alt=media&token=6ecf9fac-115f-4677-bca2-5fa93d7471bc)
Why the setting is important
When you lock the price to bar ratio, it ensures that your chart maintains a one-to-one relationship between price and time. In other words, one unit of price movement equals one unit of time. This is critical because the Gann Fan's one-by-one line is designed to represent a true forty-five degree angle. Without this setting, the angle can get distorted depending on how zoomed in or out your chart is, which can make your analysis inaccurate.
Visual guidance:
After enabling the lock, try zooming in or out and adjusting the chart until the one-by-one line looks perfectly diagonal. It should split the chart evenly, creating a balanced visual between time and price.
The fan will project diagonal lines (e.g., 1x1, 2x1, 1x2, etc.) that act as trend guides.
Price action moving along a specific fan line shows trend strength or possible breakouts.
Ensure the 1x1 line is at a 45-degree angle. Price movement along this line signals trend strength, while deviations suggest possible breakouts or reversals.
These observations help you make trading decisions like entries, exits, or setting stop-losses.
How to Interpret It
1x1 Line (45-degree angle): Represents a balanced market. If price stays above this, the trend is bullish.
2x1 Line: A stronger uptrend. If price stays above this, momentum is increasing.
1x2 Line: A weaker trend, meaning price is slowing down.
If price breaks below key fan lines, it signals a potential reversal.
Gann Fan vs Traditional Trendlines
You might wonder—why not just use normal trendlines? Here’s a quick comparison:
| Feature | Gann Fan | Traditional Trendline |
|---|---|---|
| Based on | Fixed angles (price + time) | Connecting highs/lows |
| Predictive power | Projects future support/resistance | Follows existing price |
| Complexity | Higher – needs practice | Simple to draw |
| Scaling sensitive | Yes | No |
The key difference? Gann believed time is just as important as price. Most tools only measure price. Gann’s fan aims to bring both into balance.
Understanding when a Gann Fan is valid or invalid
The usefulness of a Gann Fan depends entirely on how price behaves in relation to its angles over time. If price respects the fan lines and reacts to them, the tool can offer meaningful insights. But if price starts to ignore those lines, the fan loses its effectiveness. Let us break it down clearly.
When is a Gann Fan considered valid?
A Gann Fan is generally considered valid as long as a few key conditions are met:
Price continues to respect the fan angles. For example, you might see price bouncing off lines like the one-by-one or two-by-one, or getting resisted by them.
The original anchor point, whether it is a swing high or swing low, remains unbroken.
The market keeps moving within the structure created by the fan. As long as price flows within those channels, the fan remains relevant.
When does the Gann Fan becomes invalid?
A Gann Fan starts to lose its reliability under the following conditions:
The anchor point gets broken. For instance, if you drew the fan from a swing low and price falls below that low, the fan setup is no longer valid.
Price begins to ignore the fan lines completely, moving through them without any noticeable reaction.
A new major swing high or swing low forms. In that case, it is time to draw a fresh fan to reflect the updated price structure.
How long does a Gann Fan typically remain valid?
The timeframe you are using plays a big role in how long a Gann Fan stays relevant. Here is a general guide:
On a one-minute chart, the fan may remain valid for around thirty minutes to two hours. This is because short timeframes can shift quickly.
On a five-minute chart, it may stay valid for one to two trading sessions, which is roughly a full day of trading.
On a daily chart, the fan can remain useful for several days to a few weeks, depending on how stable the trend is.
For example, on a one-minute chart of the Nifty index, a Gann Fan usually remains valid for about twenty to fifty candles, which translates to roughly thirty to ninety minutes, as long as the trend holds. Once price clearly breaks the structure or shifts direction, it is a sign that the fan needs to be redrawn.
Trading examples on the chart
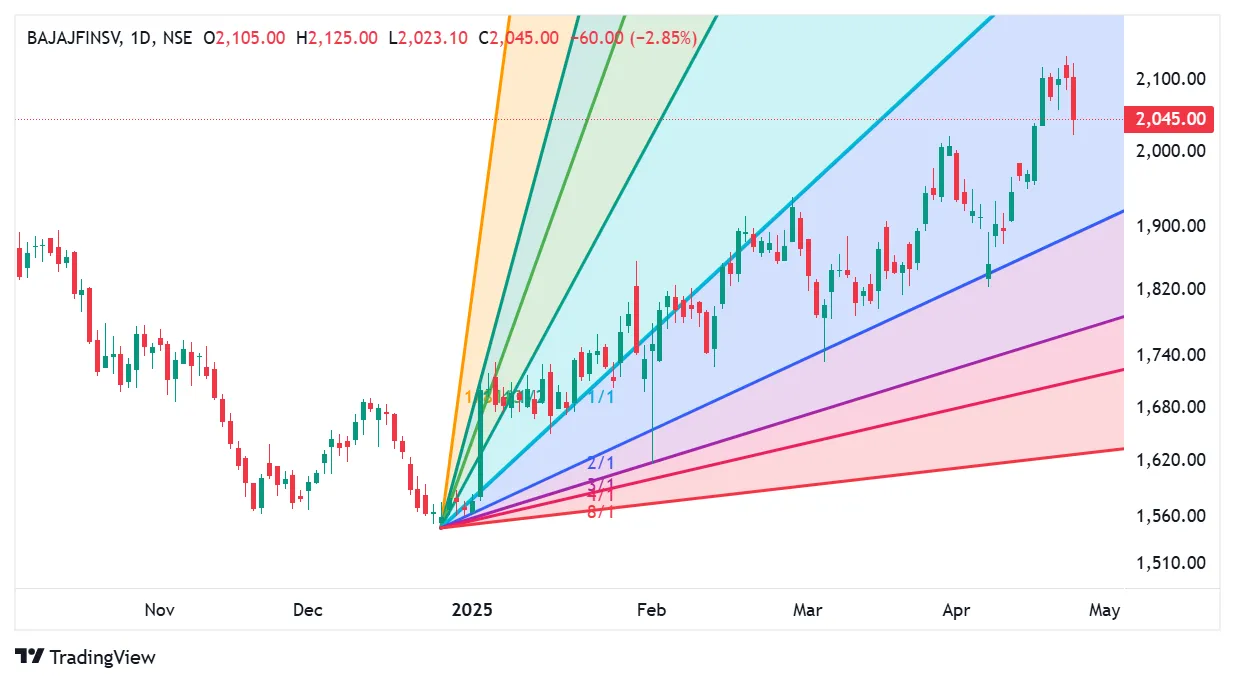
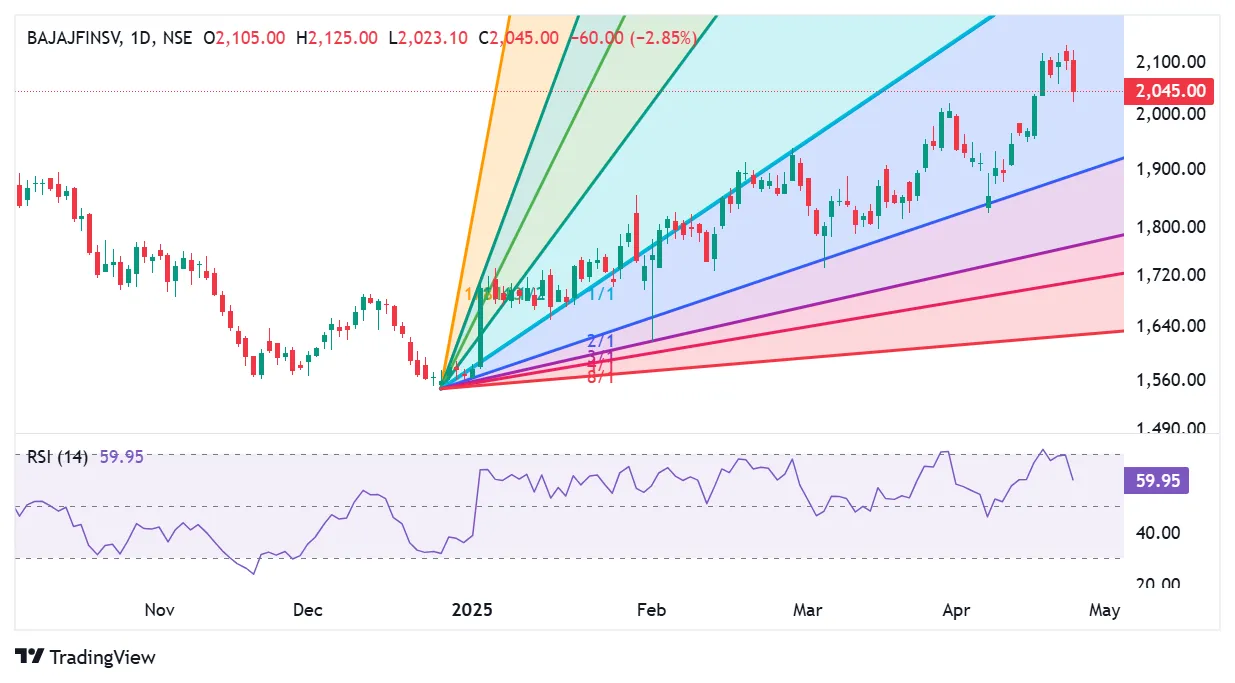
On the BAJAJFINSV chart dated 26th December 2024, a Gann Fan was plotted, and it was observed that the stock remained below the 1x1 line but consistently respected the 2x1 line, indicating underlying strength in the uptrend. A potential entry signal could be considered when the stock bounces off the 2x1 line, with an initial target towards the 1x1 line. For those looking to trail their position, a breakout above the 1x1 line could signal a stronger uptrend, offering scope for better returns. Entry opportunities were triggered around the ₹1,650, ₹1,750, and ₹1,850 levels. As of 25th April 2025, the stock continues to remain in an uptrend, validating the strength of the setup.
When applying RSI on the above chart, it also showed a bounce from the 50 level, providing additional confirmation to enter the trade when supported by another indicator.
Example - 2
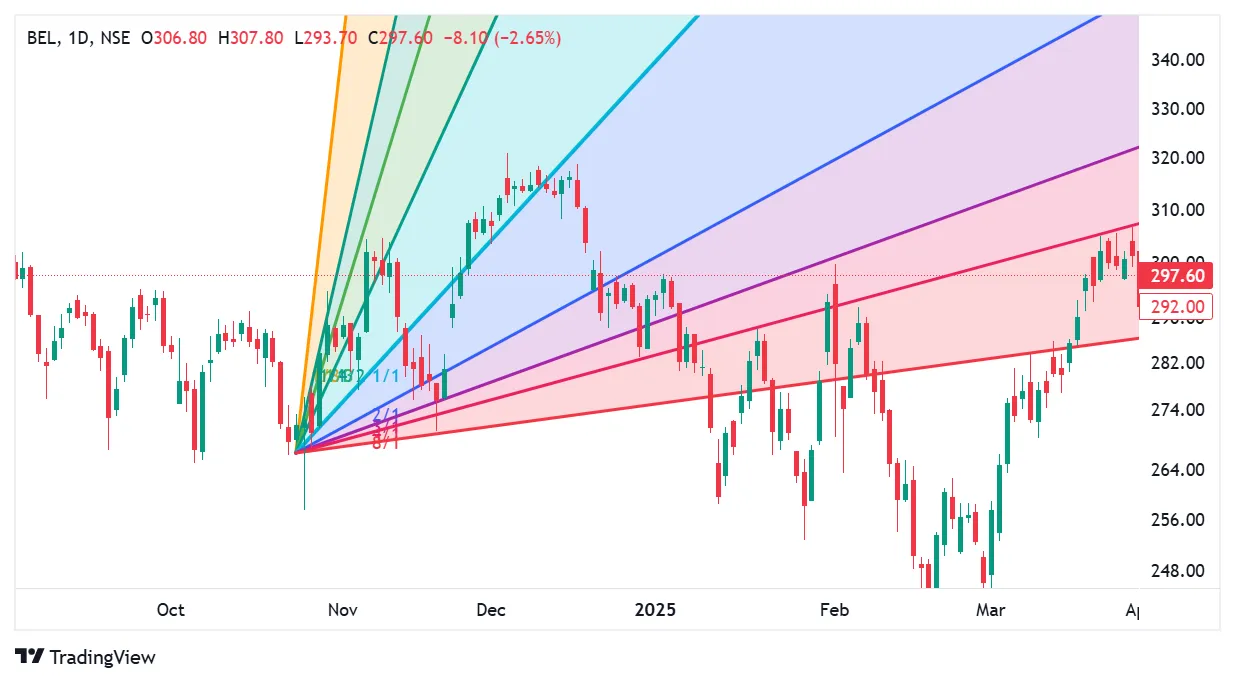
On the BEL chart dated 25th October 2024, when the downtrend reversed into an uptrend, a Gann Fan was plotted with the 1x1 line (45-degree angle) marking the ideal trend strength. However, the price failed to sustain above the 1x1 line, indicating weakness in the uptrend. As the trend lost momentum, the stock began to decline, breaking through the 2x1, 4x1, and eventually the 8x1 support lines, confirming a continued downtrend.
What are the catch points?
Like any tool, the Gann Fan has a few challenges:
Scaling Issues: It only works if your chart is properly scaled. If time is compressed or stretched, the angles become inaccurate.
Subjectivity: Choosing the starting point can be tricky. Two traders might pick different swing highs/lows.
Not Standalone: It works best when combined with other tools like RSI, volume, or candlestick patterns.
Charts meets geometry
The Gann Fan is not a magic tool, but for traders willing to look beyond traditional patterns, it offers a fresh perspective on market behavior. It demands patience, consistent practice, and the right chart setup to be used effectively. When applied correctly, the Gann Fan acts like a protractor for price, helping you measure the angle, strength, and rhythm of market movements. If that approach resonates with your trading style, it is definitely worth exploring.