


When it comes to technical analysis, identifying patterns and predicting price movements is the name of the game. While indicators and oscillators give you useful data, drawing tools offer a clear, visual way to understand market trends and structures.
Many traders come across tools like Parallel Channels, Regression Trends, Flat Top/Bottom formations, and Disjoint Channels but struggle to use them effectively. If that sounds familiar, don’t worry. This guide will break down each tool, show you how to use it,.
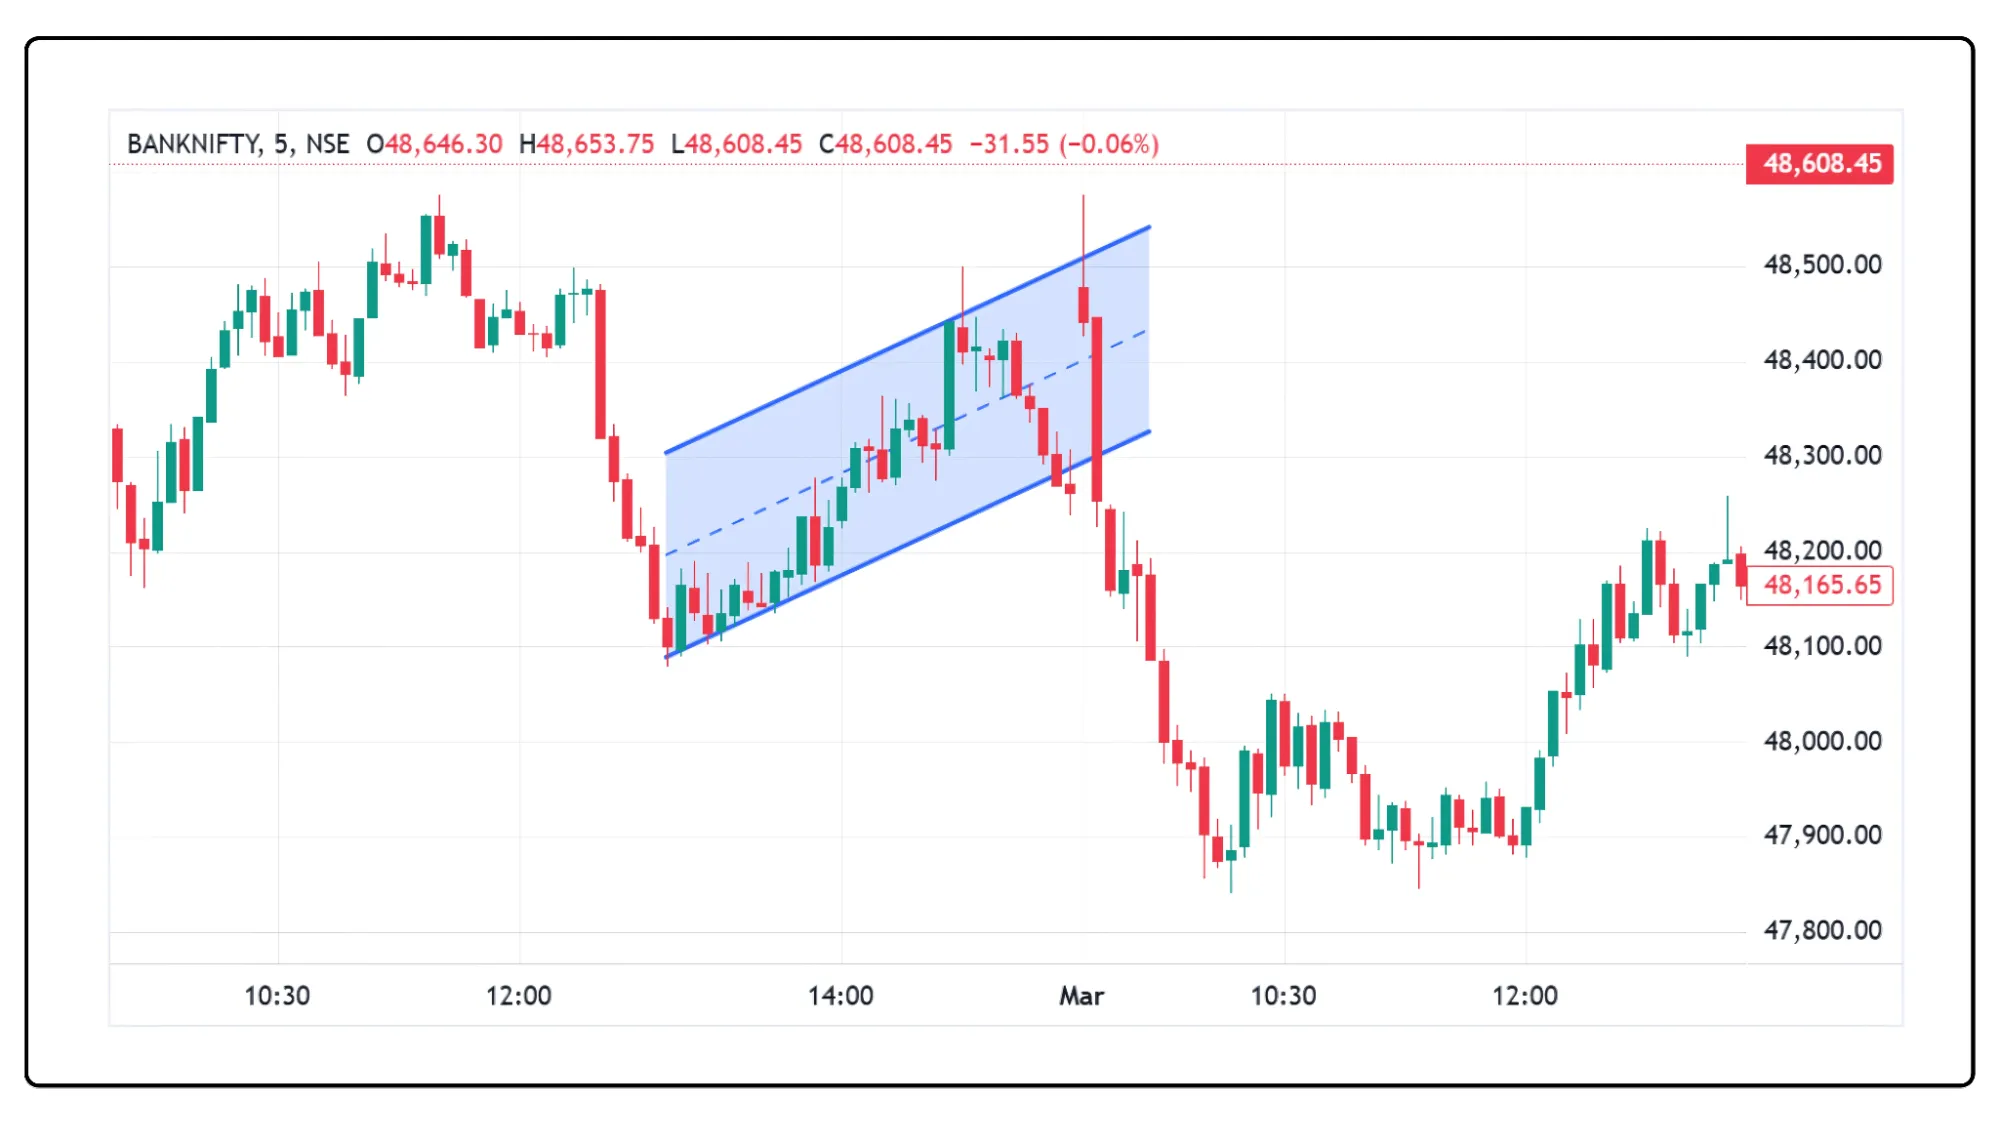
Parallel Channel
Where to Find It
In Cube Plus, head to the drawing tools section and search for "Parallel Channel."
What Is It?
A Parallel Channel consists of two trendlines that run parallel, encapsulating price movement. It helps traders confirm trends and anticipate breakouts.
How to Use It
Pick two key swing points (highs or lows) to create the first trendline.
Extend a parallel line to enclose price movement within the channel.
Adjust the width to fit most price action inside the channel.
How to Interpret It
If price remains within the channel, the trend is strong.
A breakout above signals a bullish move; a drop below signals bearish momentum.
The midpoint of the channel often acts as dynamic support or resistance.
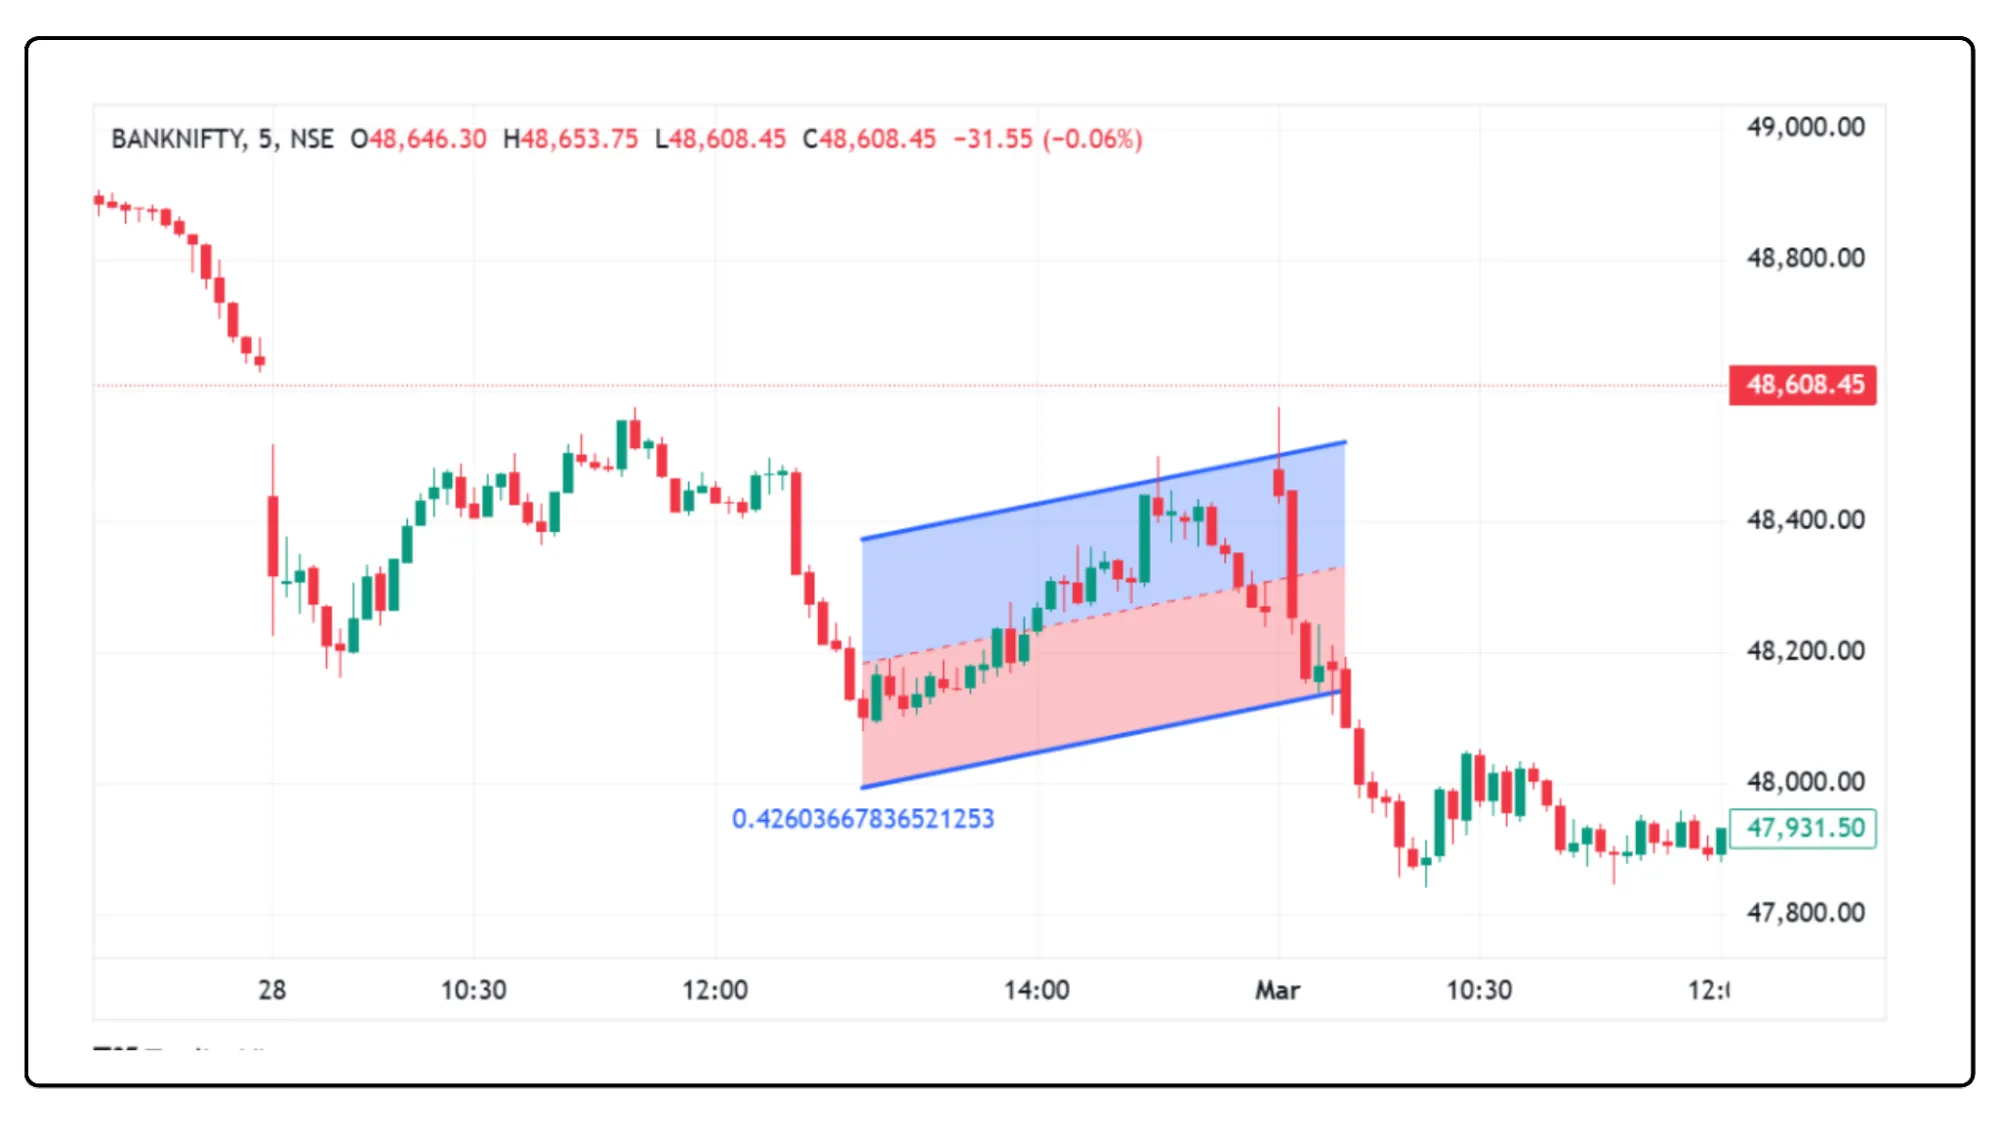
Regression Trend
Where to Find It
Locate it in Cube Plus under the trend analysis section.
What Is It?
A Regression Trend plots a best-fit line through price data, showing the market’s overall direction, along with deviation bands that indicate price extremes.
How to Use It
Select a start and end point on the chart.
The tool automatically draws a central trendline with upper and lower deviation bands.
Watch how price interacts with these bands.
How to Interpret It
If price stays above the regression line, the trend is bullish.
If price stays below, the trend is bearish.
The deviation bands act as flexible support and resistance zones.
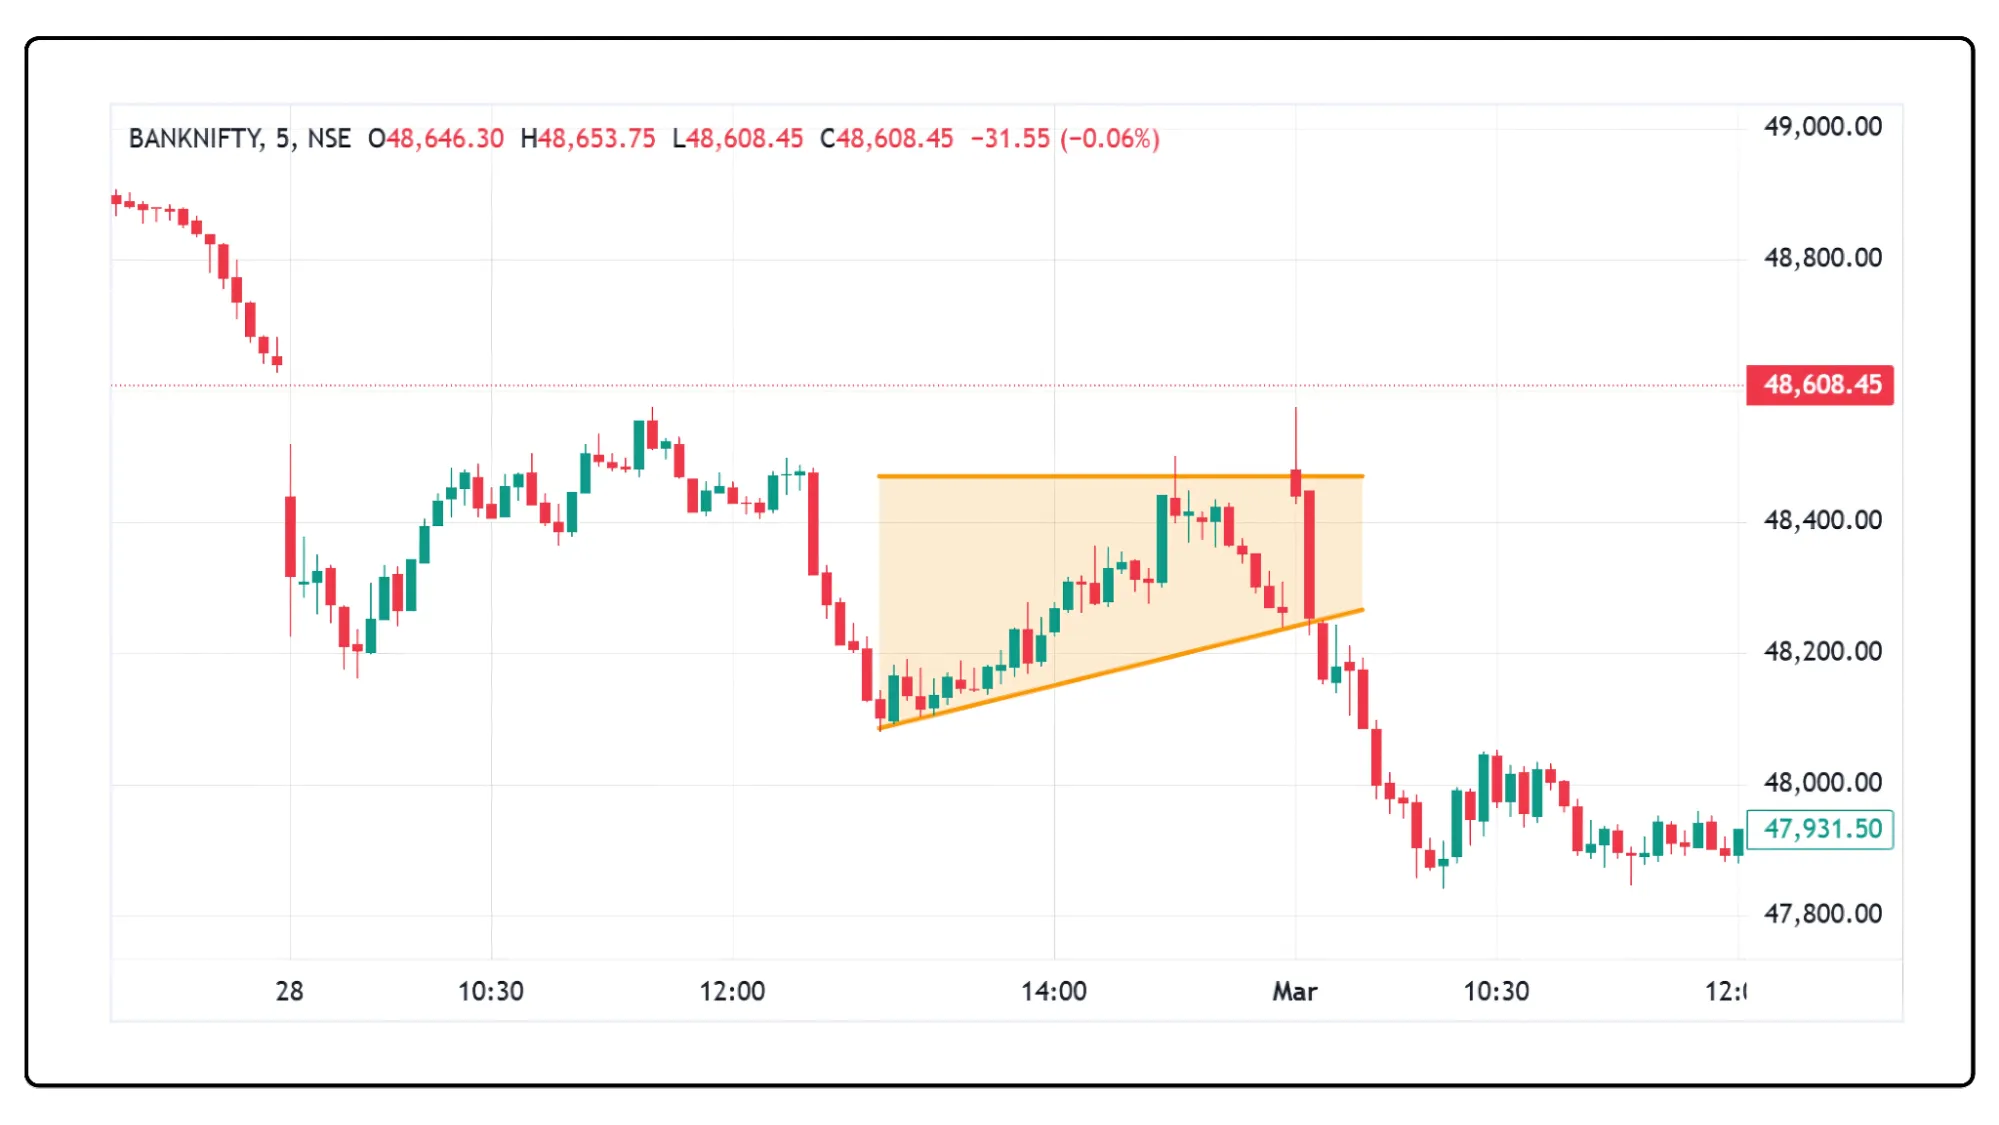
Flat Top/Bottom
Where to Find It
Locate it in Cube Plus under the trend analysis section.
What Is It?
Flat Top/Bottom formations indicate price consolidation, typically leading to breakouts. A Flat Top suggests bullish pressure, while a Flat Bottom signals bearish pressure.
How to Use It
Identify a series of price highs (Flat Top) or price lows (Flat Bottom) forming a horizontal level.
Draw a straight line connecting these points.
Watch for a breakout above or below this level.
How to Interpret It
A breakout above a Flat Top suggests a strong upward move.
A breakdown below a Flat Bottom signals a bearish move.
Repeated testing of the level without breaking may indicate accumulation or distribution.
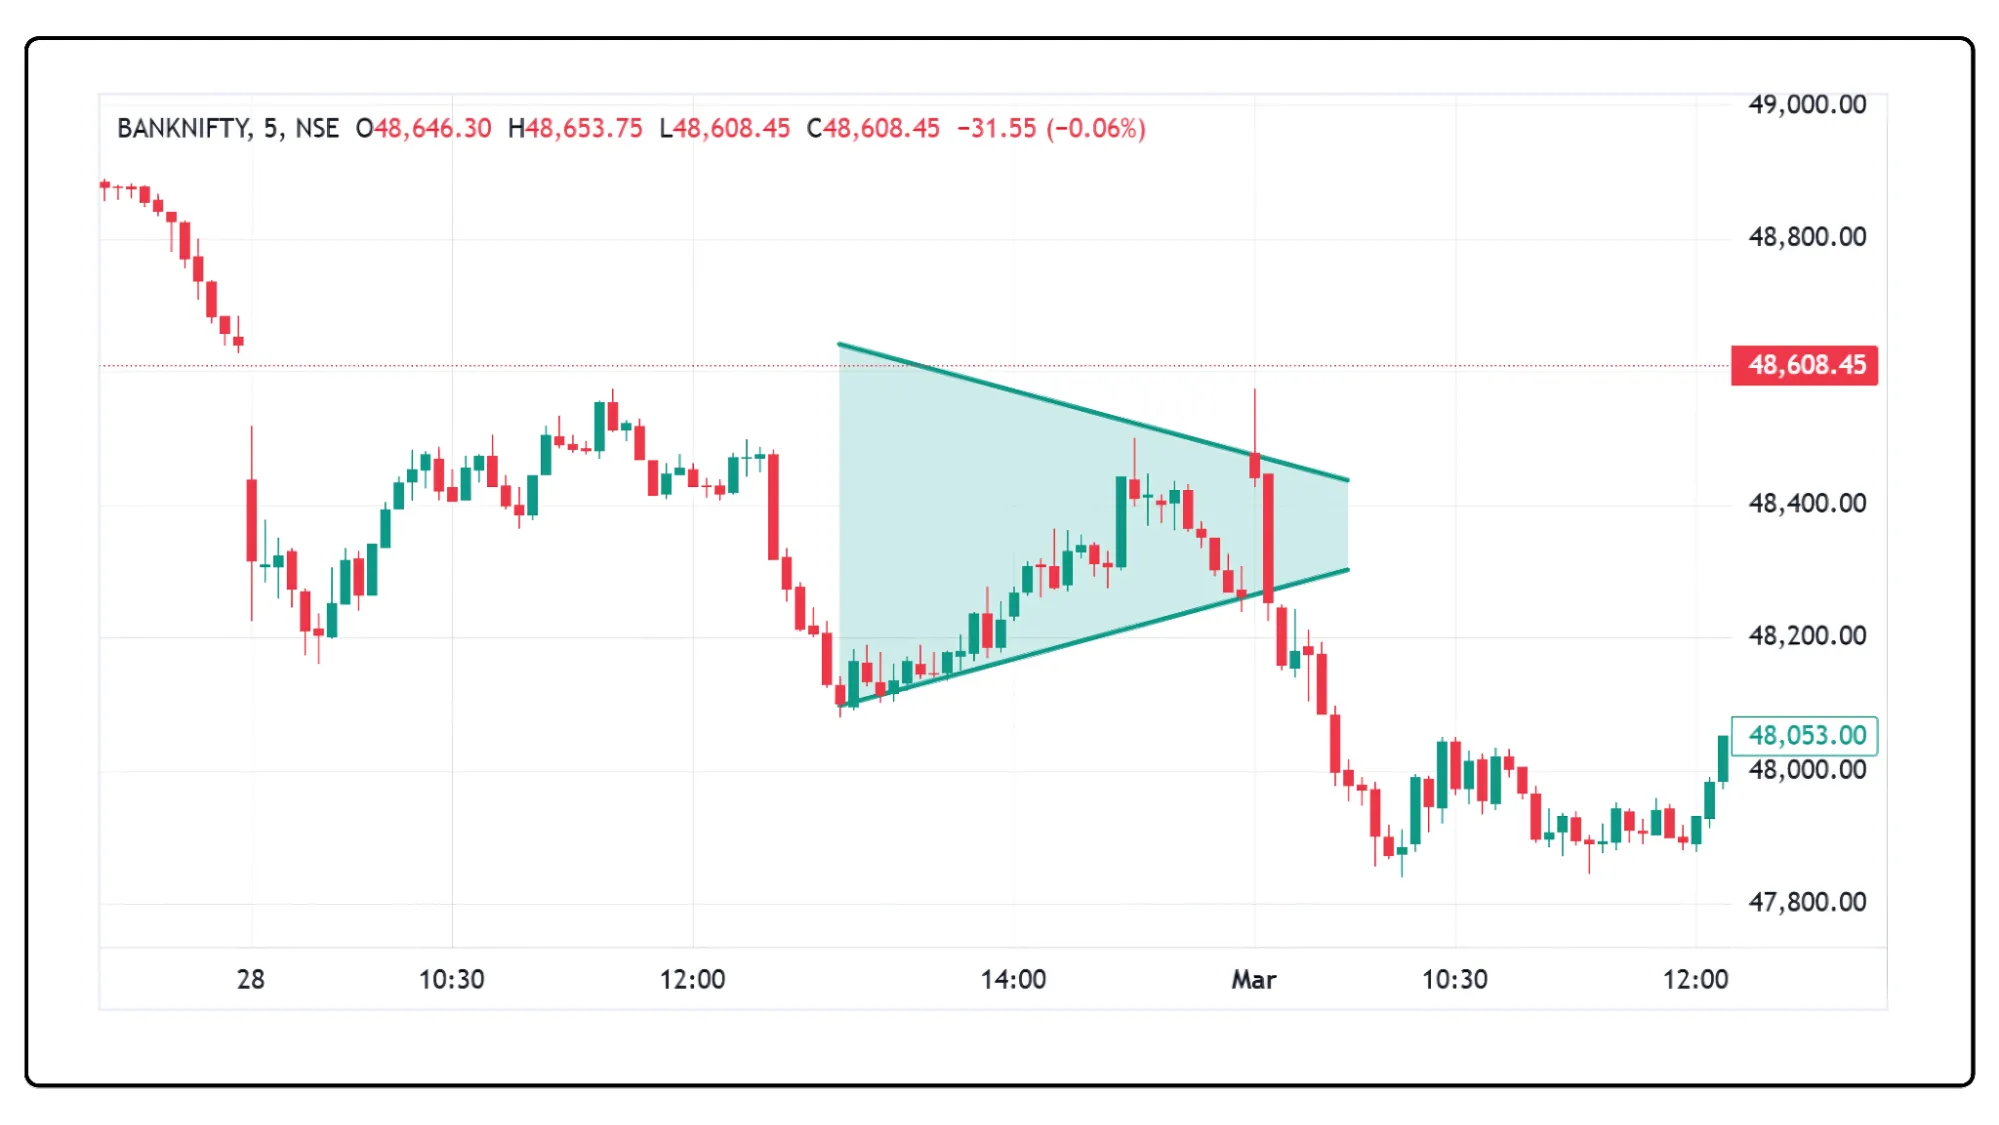
Disjoint Channel
Where to Find It
You’ll find the Disjoint Channel tool in Cube Plus under advanced drawing tools.
What Is It?
Unlike a Parallel Channel, a Disjoint Channel consists of two trendlines that are not parallel, making it ideal for capturing non-linear trends and market volatility.
How to Use It
Identify two major swing points to create the first trendline.
Draw a second trendline that follows price movement but doesn’t have to be parallel.
Adjust both lines to include most price action.
How to Interpret It
A widening Disjoint Channel suggests increasing volatility.
A narrowing Disjoint Channel may indicate an impending breakout or trend reversal.
Price action near either trendline can offer potential trade opportunities.
Which Tool Should You Use?
Each tool serves a unique purpose:
Parallel Channels & Regression Trends help track structured trends and price movement.
Flat Top/Bottom formations & Disjoint Channels assist in identifying breakout points and irregular trends.
If you want to level up your technical analysis, mastering these drawing tools is a must. The key is practice—apply them on demo charts, experiment with different timeframes, and refine your trading strategy.
Disclaimer: The information provided in our blogs is for informational purposes only and should not be construed as financial, investment, or trading advice. Trading and investing in the securities market carries risk. Always conduct your own research and consult with a qualified financial advisor before making any investment decisions. Past performance is not indicative of future results. Copyrighted and original content for your trading and investing needs.
©️ 2025 — Tradejini. All Rights Reserved.