


Ever jumped into a trade thinking the momentum was on your side, only to watch the if price lose momentum (no change ) or reverse right after? It happens to the best of us. That is where indicators like RSI come in—they act like a pulse check for the market. In the world of technical analysis, the Relative Strength Index (RSI) is your go-to tool for spotting when prices might be stretched too far in one direction. In this article, we will break down RSI in simple terms—what it means, how to read it, and how to actually use it to time smarter entries and exits.
What Exactly Is RSI?
Think of RSI as a speedometer for price movement. It tracks how fast and how far prices are moving, then shows that strength as a number between 0 and 100. When the RSI goes above 70, it usually means the stock is getting overbought—maybe too many people are rushing in to buy. When it drops below 30, it suggests the opposite: the stock might be oversold, with too much selling pressure.
But RSI is more than just a number. It is a momentum oscillator, and momentum is about direction and speed. RSI helps traders see if a stock has the energy to keep moving in its current direction or if a reversal might be around the corner.
How Is RSI Calculated?
The formula for RSI is:
RSI = 100 minus (100 divided by (1 plus RS))
RS = Average Gain divided by Average Loss
Where RS is the average gain over a set period divided by the average loss over that same period. By default, traders use a 14-period RSI. This could be 14 days, 14 hours, or even 14 minutes—depending on your chart.
To break it down:
First, you calculate the average gain and average loss over the past 14 periods.
Then you apply a smoothing technique—sort of like giving more weight to recent movements but not completely ignoring past data.
This smoothing gives you a more stable RSI that filters out noise and helps you focus on the trend.
The final RSI number will always be between 0 and 100:
RSI near 0 = the stock dropped every single one of those 14 periods.
RSI near 100 = the stock went up every single time.
So What Are the ‘Right’ RSI Settings?
The default setting of 14 periods works well in most cases, but it is not a one-size-fits-all. For example:
If you want more earlier signals, use a shorter period like 10 or even 7.
If you want smoother, less frequent signals, try a longer period like 20 or 21.
Also, the overbought (70) and oversold (30) thresholds are not written in stone. For high-volatility stocks, some traders raise the bar to 80 for overbought and drop it to 20 for oversold to reduce false signals.
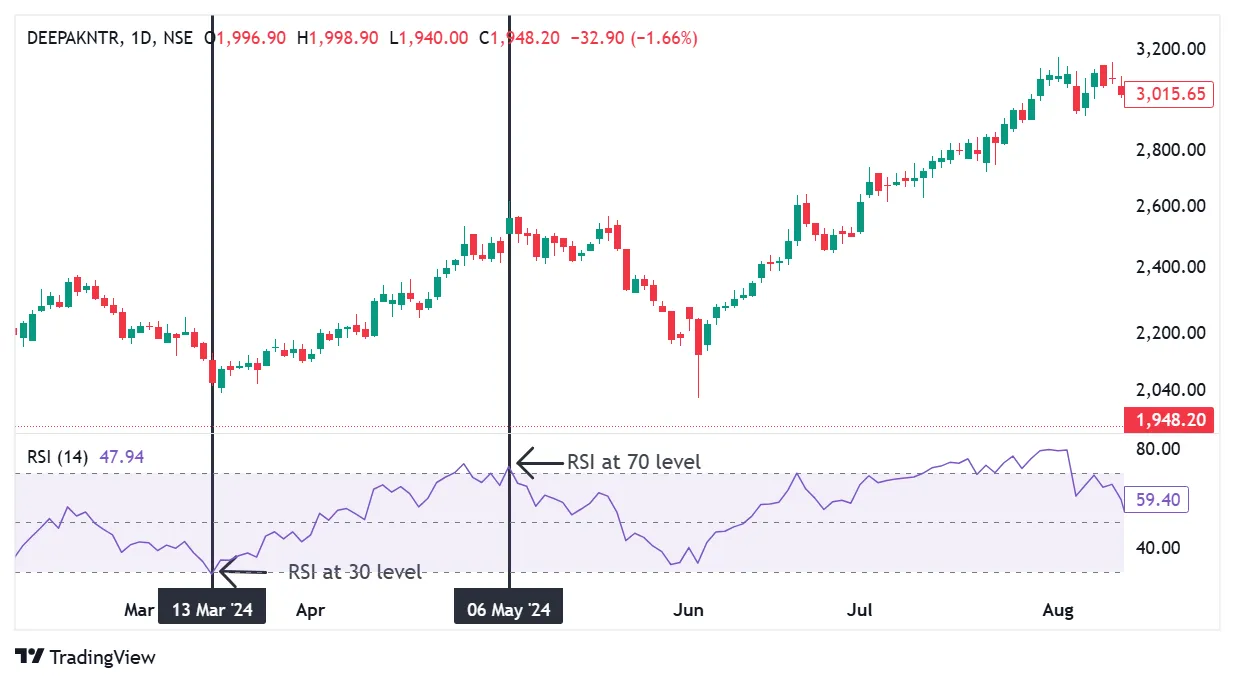
Below on Indigo chart applied RSI level overbought 70 and oversold 30
Using RSI in real trading what to look For
1. Overbought and Oversold Conditions
When RSI crosses above 70, it is a sign the stock might be stretched to the upside. But that does not mean you short it right away. Some stocks can stay overbought for weeks in a strong uptrend.
Likewise, an RSI below 30 might signal a potential bottom, but it is not a guarantee. Think of these levels more as a heads-up to pay closer attention, not instant buy/sell alerts.
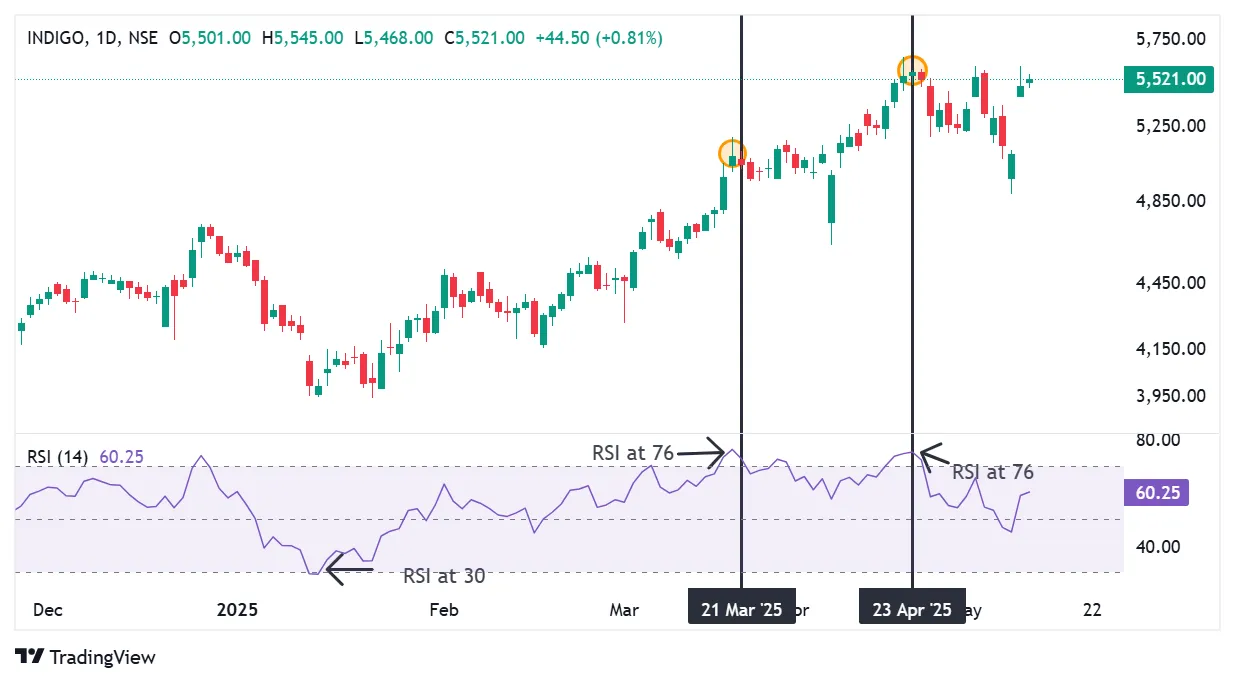
Always check the price action—what is the price telling you? As seen on the Indigo chart below, the RSI crossed the 70 mark on March 18, 2025, when the stock price was around ₹4,815. It continued to stay above 70 and climbed to an RSI level of 76 as the price rose to ₹5,170. The price then dropped to ₹4,630 on April 7, and later rallied again to ₹5,600, with the RSI once again staying above 70.
This shows that trading decisions should not be based solely on RSI. Always confirm signals with price action.
2. Divergences are when price and RSI Disagree
This is where it gets interesting. Let us say a stock makes a new high, but RSI does not follow and makes a lower high. That is called a bearish divergence—momentum is fading even though the price looks strong. It could be a warning of an upcoming pullback.
On the flip side, a bullish divergence happens when the price hits a new low, but RSI makes a higher low. That tells you the selling pressure might be easing, even if the chart looks negative.
Divergences are not magic. They can be misleading during strong trends. Use them as part of a bigger picture.
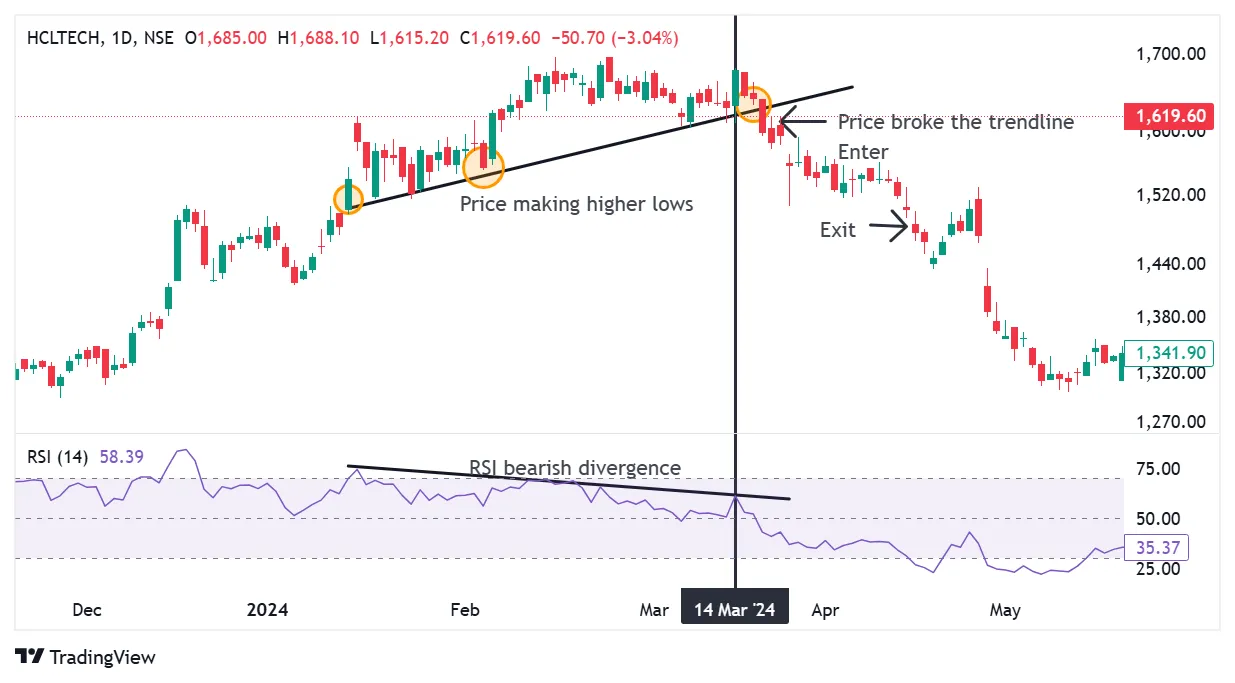
This daily chart of HCLTECH as on Jan 2024 to March 2024 shows a clear example of bearish RSI divergence, which often indicates a potential trend reversal or a weakening of upward momentum.
Price Action: The price has been forming higher lows over time. This pattern typically reflects strength and a continuation of the uptrend.
RSI Indicator:On the other hand, the RSI is forming lower highs. This creates a bearish divergence, which suggests that while prices are rising, the buying strength is weakening.
What this means:
This divergence between price and RSI acts as an early warning that the uptrend may be losing momentum. Even though the price continues to move higher, the declining RSI hints that fewer participants are driving the rally with strength. This scenario often precedes a price correction or reversal.
How to trade this setup:
A common strategy is to wait for the RSI to move below the midpoint level of 50. This is often seen as a sign of shifting momentum toward sellers.
Alternatively, one can consider entering a sell trade when the price trendline breaks. As seen on the chart dated 19th March 2024, an entry could have been made around the price level of ₹1610. Exit place at earlier support which is at ₹1480.
However, since this trade goes against the prevailing trend, it should be approached in scalping mode—aiming for quick, short-term gains. In such cases, the exit should be placed as soon as the RSI line crosses back above the 50 level.
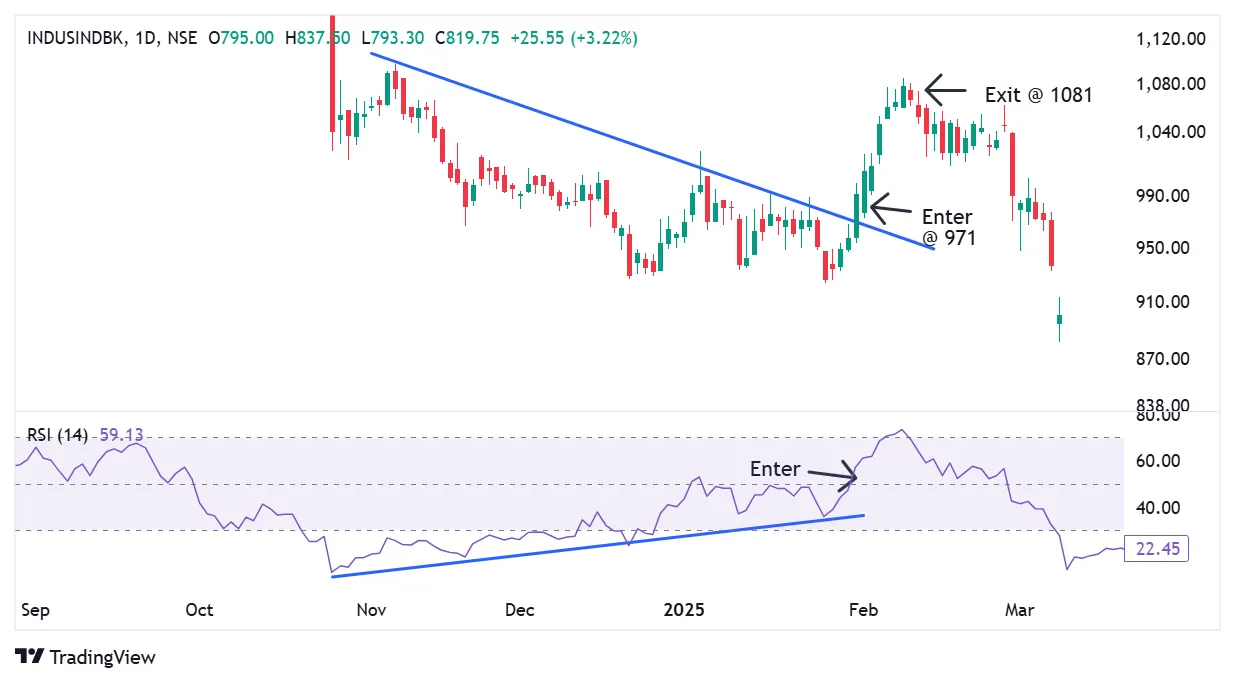
RSI bullish divergence seen on INDUSBNK stock on 29 October 2024. Giving the gain of around 90 points
3. Failure swings
Sometimes, RSI tells you what is happening purely through its own movement—without comparing to price at all. These are called failure swings and they can be powerful.
A bullish failure swing occurs when RSI dips below 30 (oversold), climbs back up, and then holds above 30 during the next pullback before breaking higher. That higher low on the RSI can signal that the momentum is shifting back to the upside.
A bearish failure swing is the opposite. RSI goes above 70 (overbought), pulls back, tries to climb again but fails to reach 70, then breaks below the previous low. That is a signal momentum is weakening and a drop could follow.
How to trade this setup:
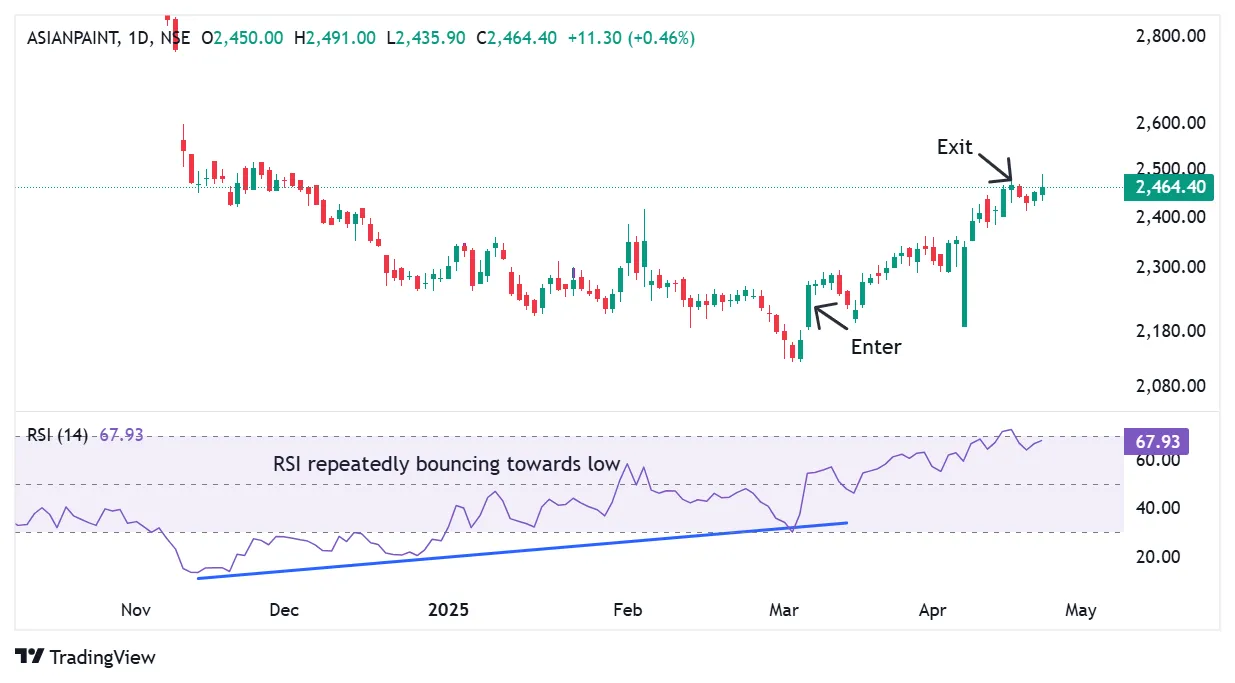
A bullish failure swing can be observed on the chart of Asian Paints between 11th November 2024 and 6th March 2025. During this period, the RSI consistently remained below the 30 level, indicating weakness, but gradually began forming higher highs, signaling a buildup in strength. On 6th March 2025, the RSI finally crossed above the 50 level, which acted as a confirmation for a potential long entry around the price of 2250. The trade could be held until the RSI approached the 70 level, which occurred on 17th April 2025, when the stock reached a price of 2460. This setup provided a gain of approximately 200 points.
4. Spotting trends with RSI ranges
RSI is not just for finding reversals. You can also use it to identify trends. In an uptrend, RSI tends to stay above 40, and in a downtrend, it usually stays below 60. If you see RSI bouncing off the 40-50 zone repeatedly, that is a strong hint the trend is up. Conversely, if it keeps getting rejected around 50-60, the trend might be down.
This is really helpful if you are trying to ride the trend instead of picking tops and bottoms.
How to trade this setup:
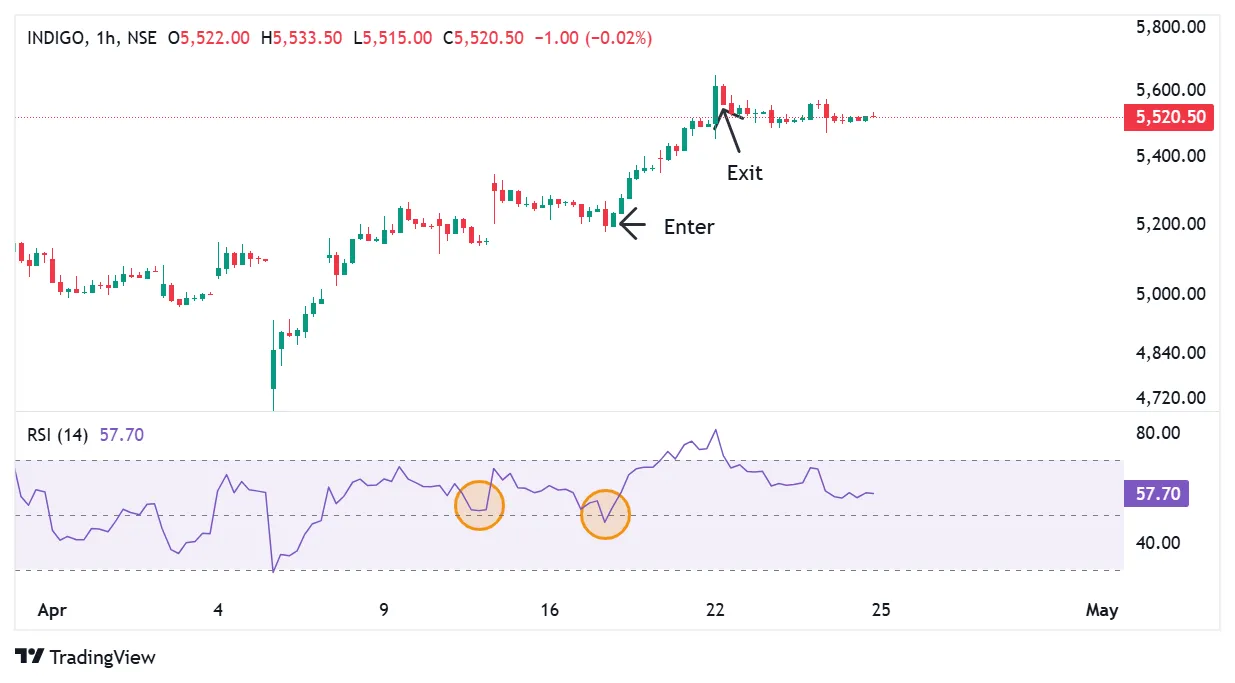
On the INDIGO chart, between 7th April and 17th April 2025, the RSI showed a strong recovery after rebounding from the 30 level. It first bounced off the 50 level on 11th April and again on 17th April, indicating a buildup of bullish momentum. An entry signal was triggered on 17th April when the RSI crossed above the 50 level, with the price at 5215. The trade could be exited once the RSI started turning downward from the 70 level, which occurred when the price reached 5550. This move delivered a gain of approximately 300 points.
RSI in action interpreting momentum with precision
RSI is like a Swiss Army knife for traders. It can help you spot when a stock is overbought or oversold, detect changes in momentum, confirm or question a trend, and highlight potential reversals. But like any tool, it works best when you use it with others—like trendlines, support/resistance, or volume indicators.
Remember, RSI does not predict the future. It gives you a clearer view of what is happening under the surface of price movement. The real magic happens when you combine it with your understanding of price action and market context.
If you are just starting out, keep it simple. Stick with the 14-period RSI, look for overbought and oversold levels, and get used to how RSI behaves in different kinds of markets. Once you are comfortable, explore divergences, failure swings, and reversals to deepen your edge.