


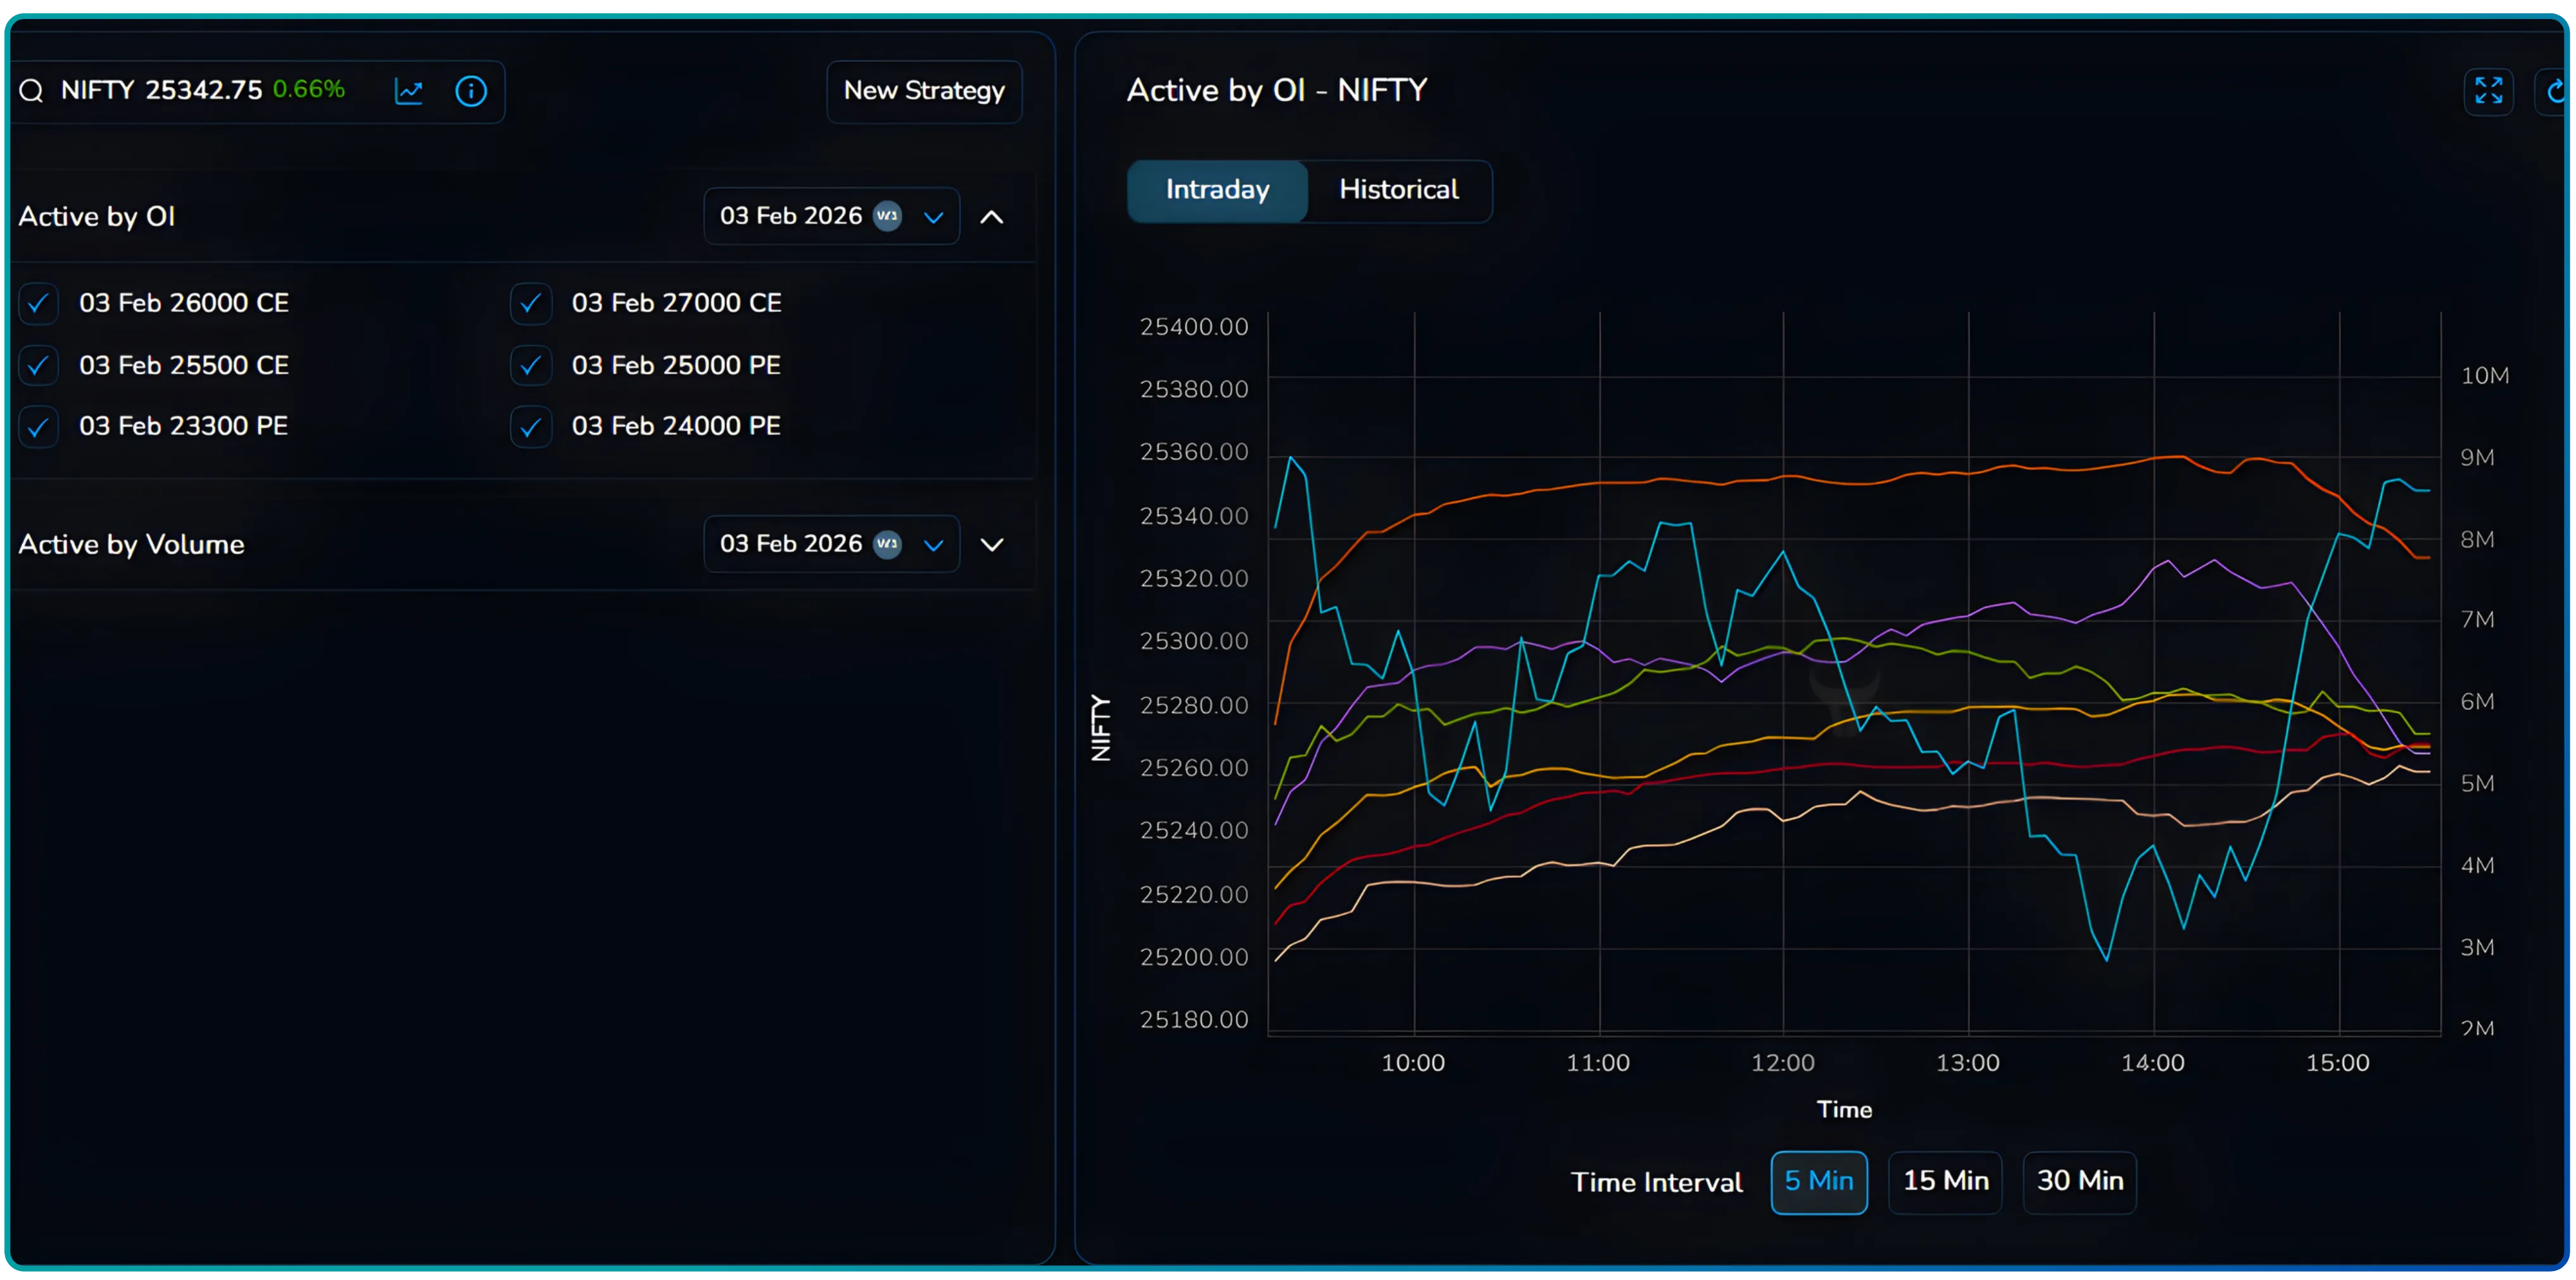
The MultiStrike OI Chart is a visualization tool that tracks open interest changes across multiple option strikes simultaneously throughout the trading session. Open interest refers to the number of outstanding contracts for a particular strike price, and it measures the total number of these outstanding contracts to provide an overview of market participation.
This multi-dimensional view helps traders monitor institutional activity, position building, and unwinding behavior across numerous strike values simultaneously for better decision-making. By plotting multiple strikes as color-coded lines, the chart highlights where significant positions are concentrated. High open interest at a specific strike price can indicate key support or resistance levels in the market.
The ability to track changes in OI and volume patterns as they happen is a key feature of many options trading platforms, helping traders gain insights into market positioning.
With selectable intervals of 5, 15, and 30 minutes, the chart caters to both intraday scalpers and positional traders, making it a practical tool for options-based strategies and risk management.
Accessing MultiStrike OI Analysis
- Navigate to MultiStrike OI: Click Analyse on the header tab and select Open Interest. From the main dashboard, choose MultiStrike OI from the left sidebar.
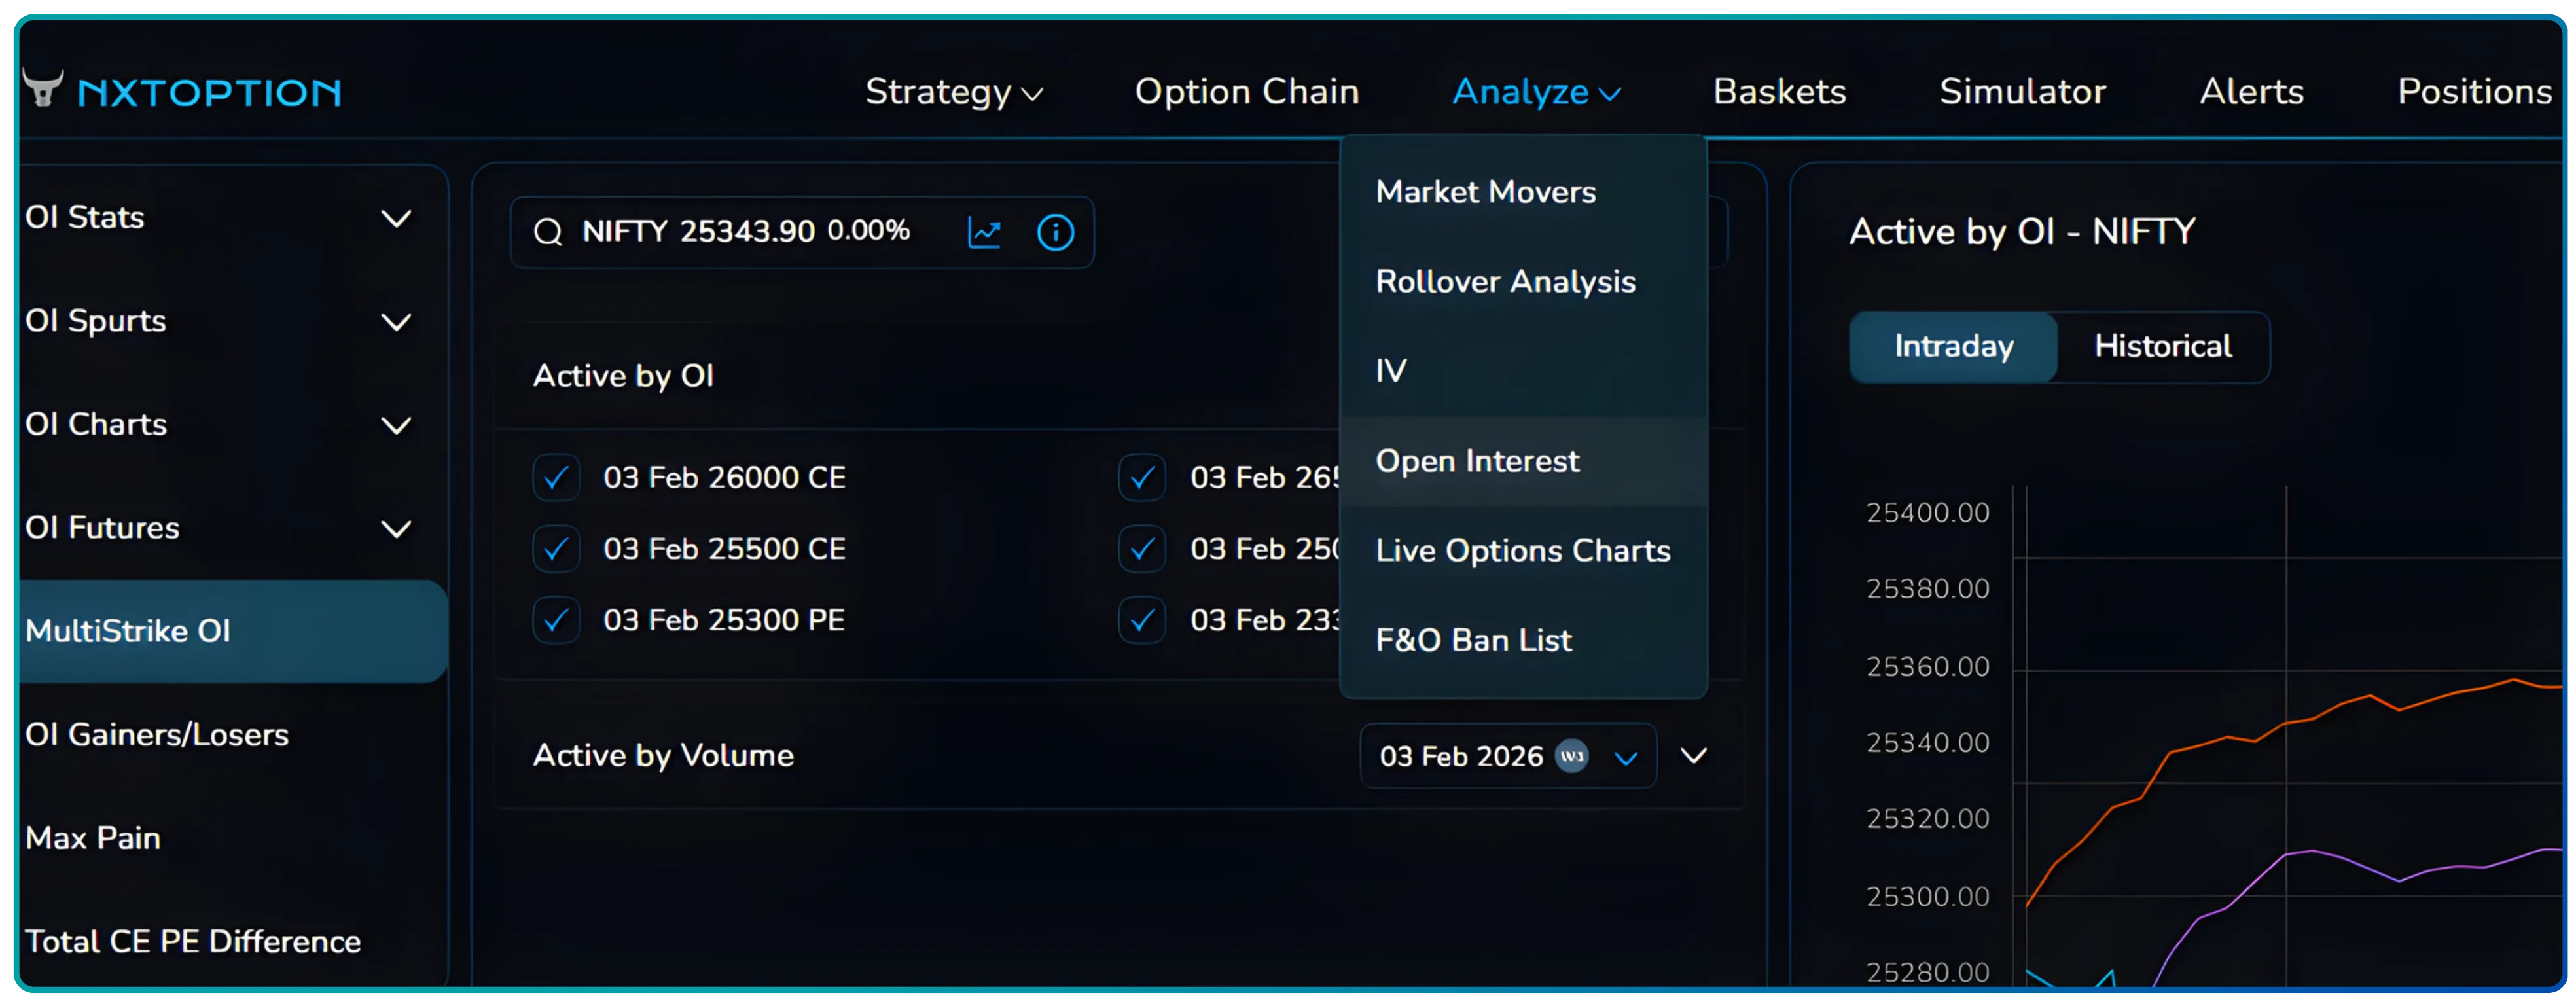
Select the Underlying Asset: Use the search bar to enter your preferred underlying (e.g., NIFTY).
Choose the Expiry Date: Use the date dropdown to select your desired expiry.
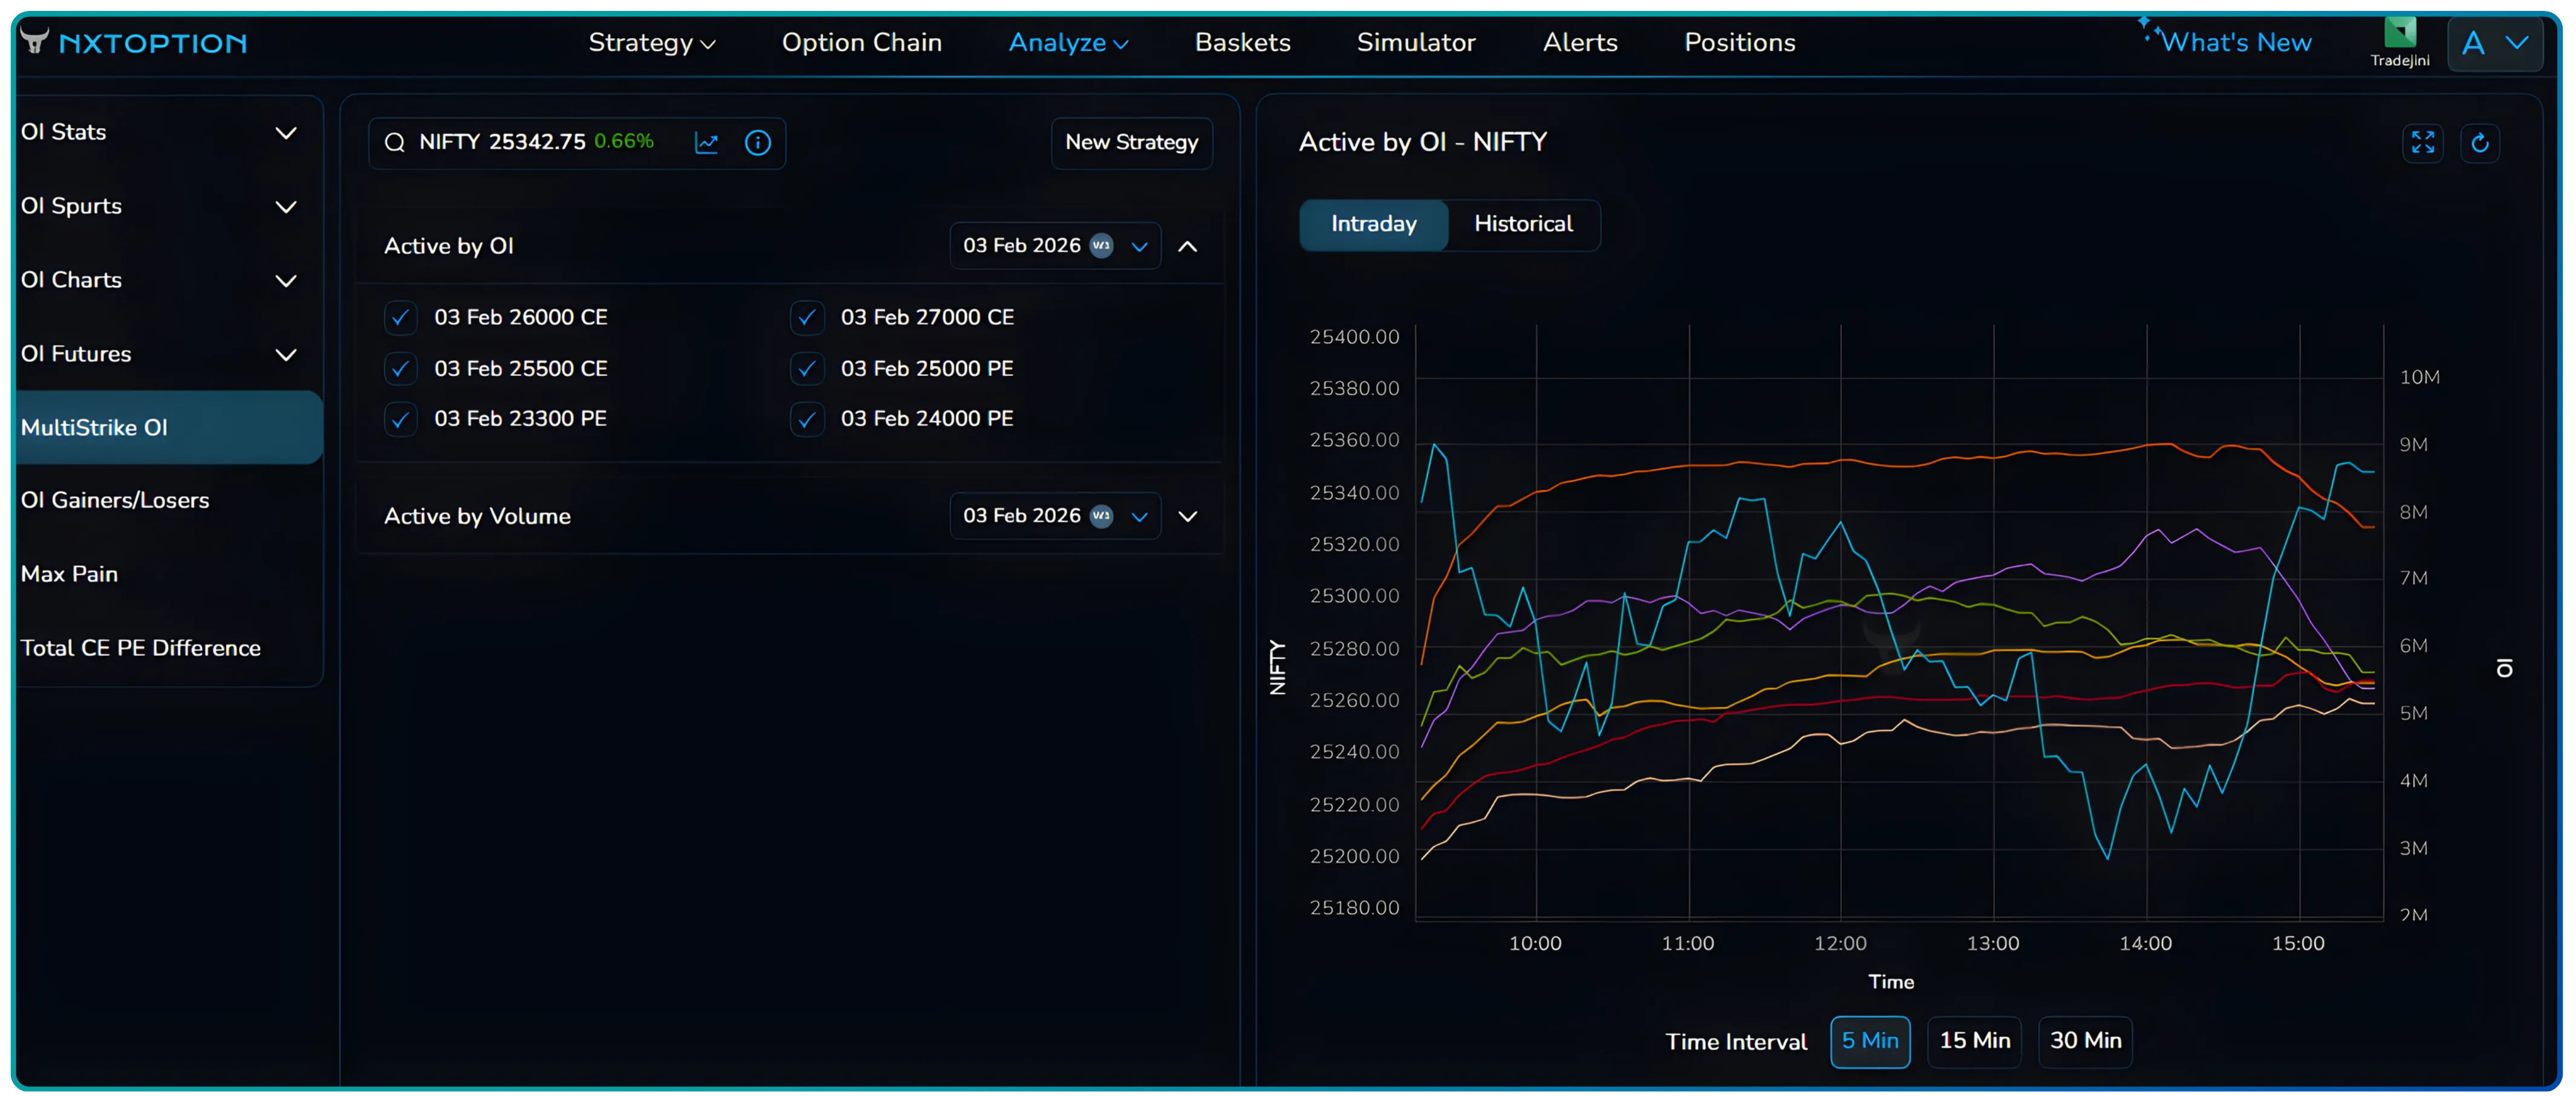
Strike Selection Methods
The platform offers three distinct methods to identify and select strikes for analysis:
- Active by OI (Open Interest): Displays strikes ranked by highest open interest. An increase in open interest indicates that traders are opening new positions, suggesting bullish sentiment, while a decrease means traders are closing positions, indicating bearish sentiment.
- Active by Volume: Shows strikes with the highest trading volume. High volume in the volume chart indicates a strong interest in the option contract, reflecting high participation from traders.
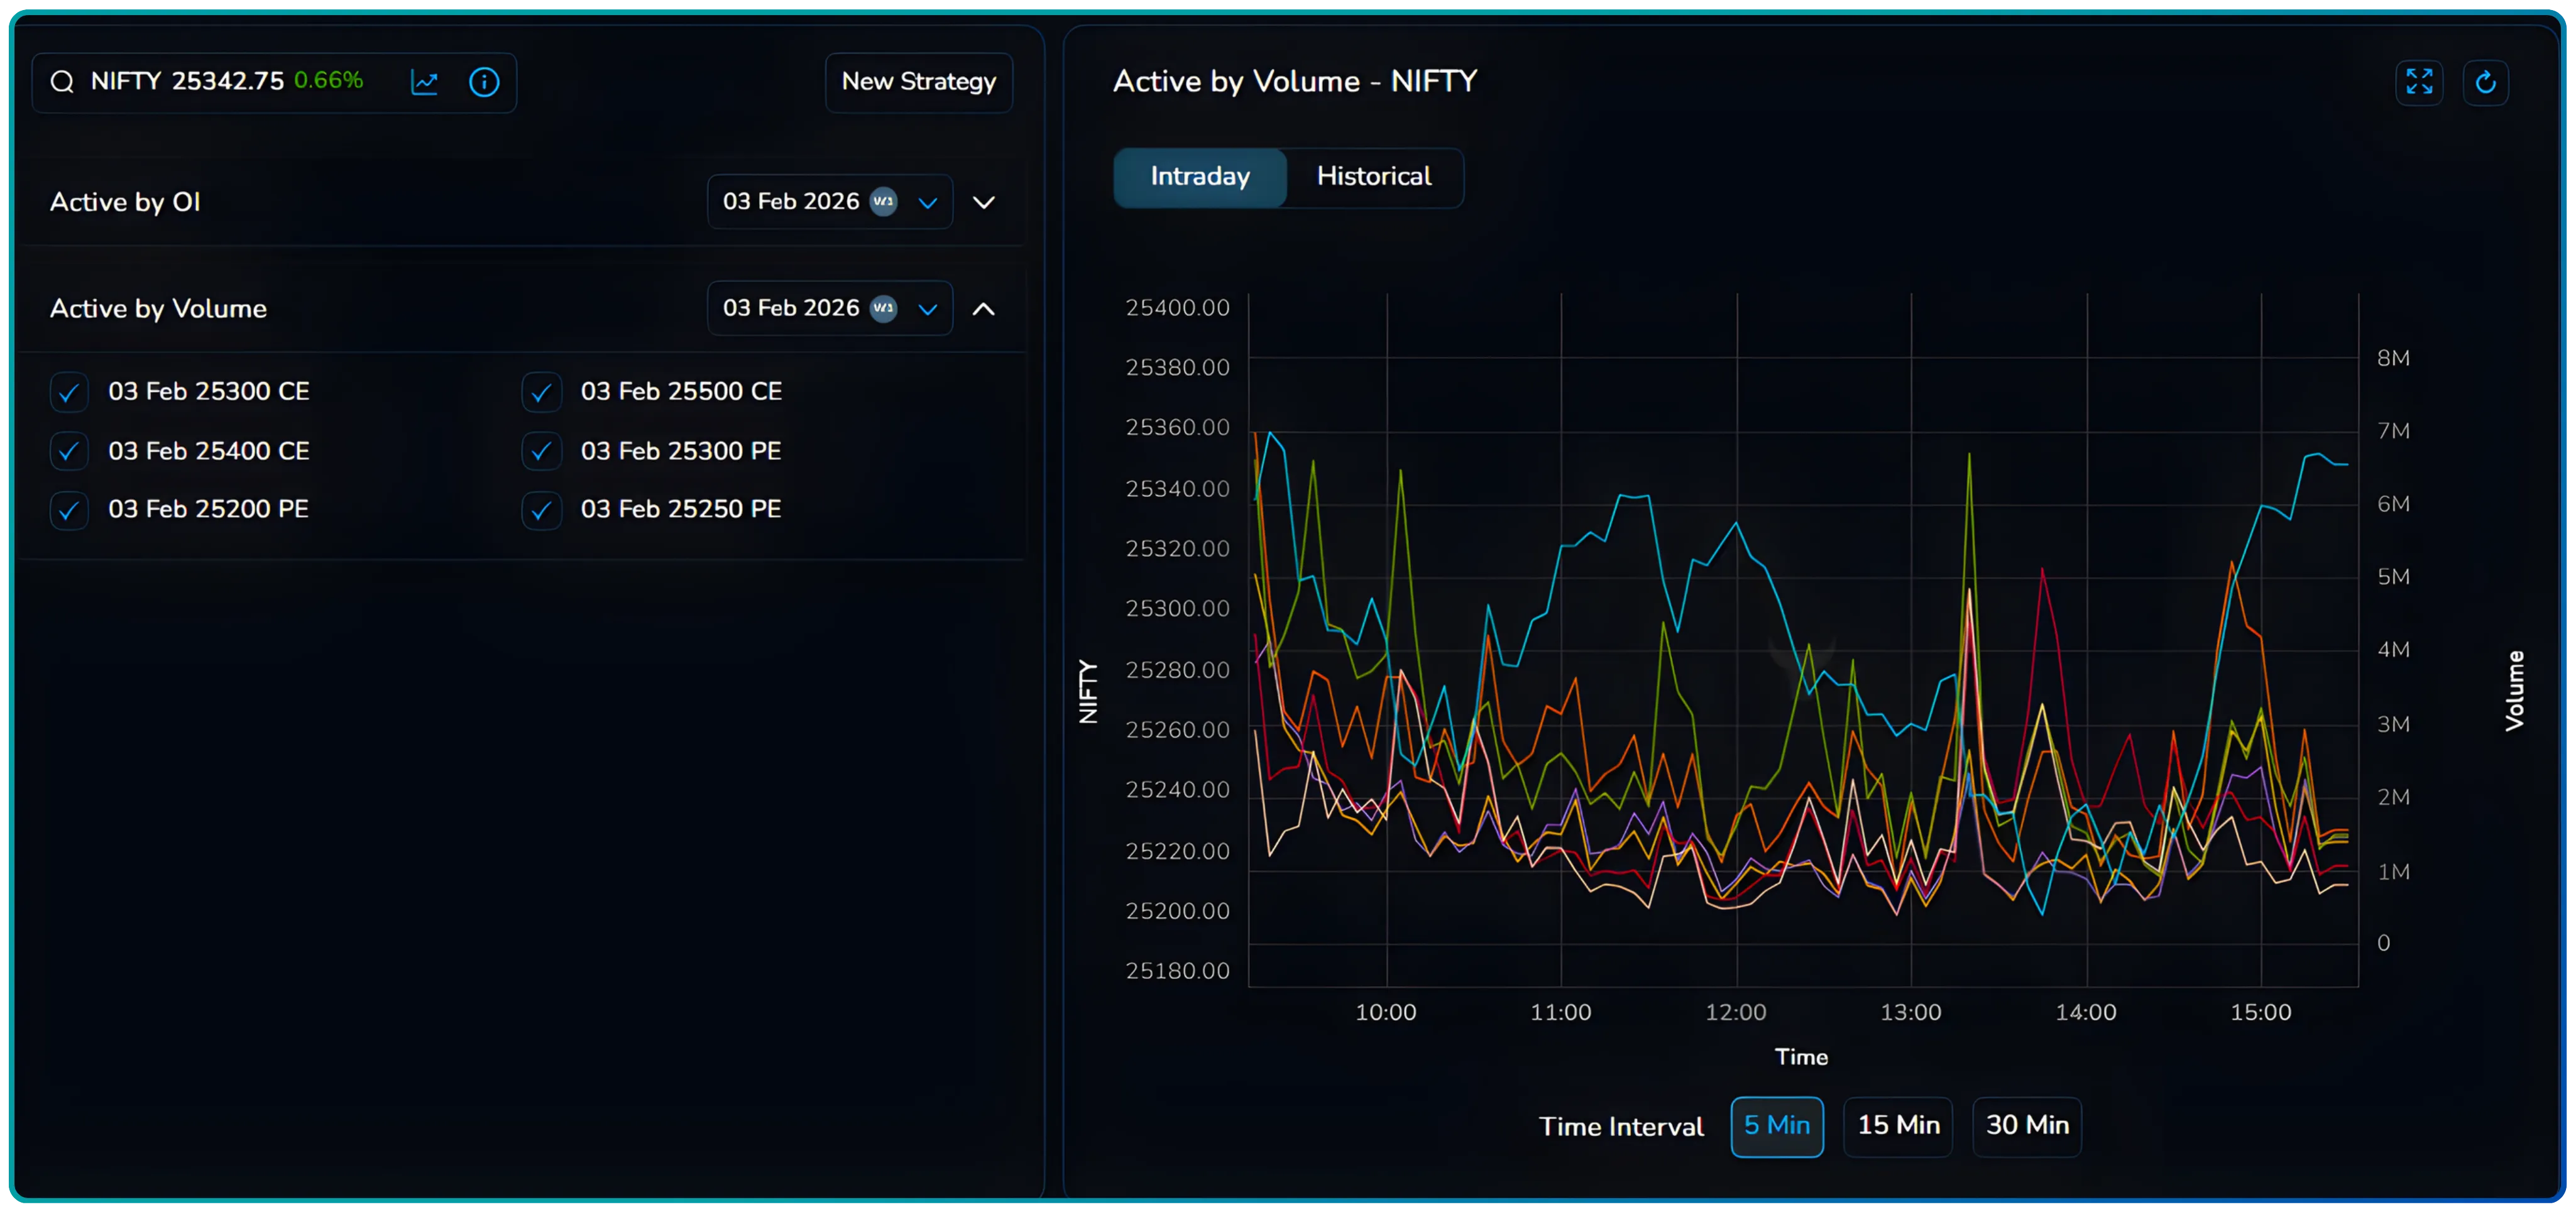
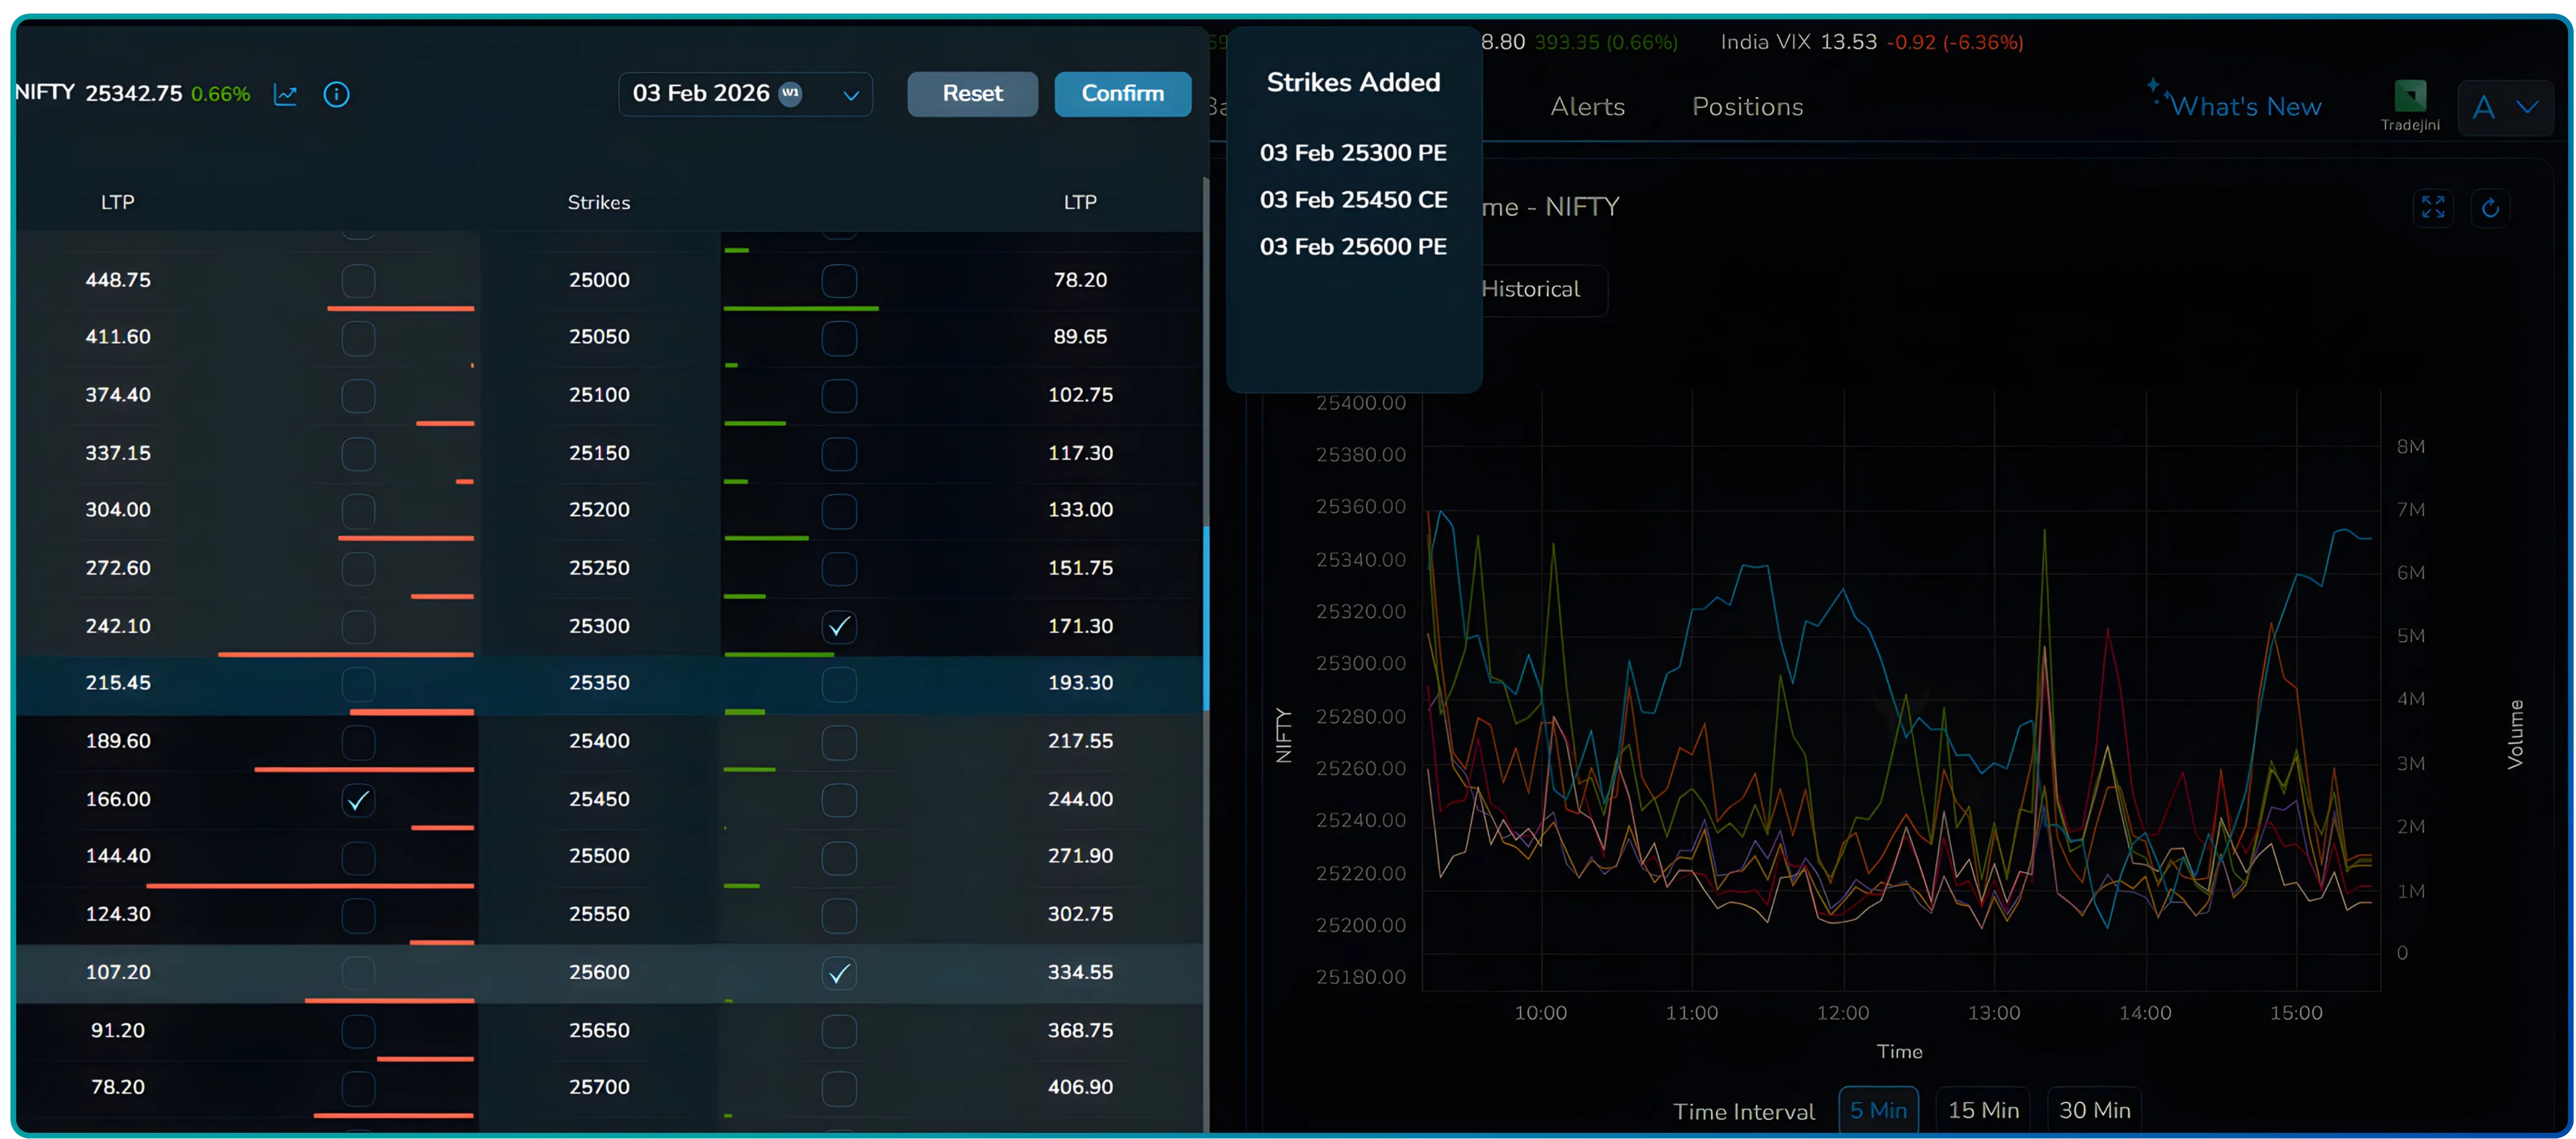
- Manual Strike Selection: Click individual strikes to build a custom selection. This allows traders to track changes in OI and volume across different strikes of stocks and indices, similar to tools like OIHelper.
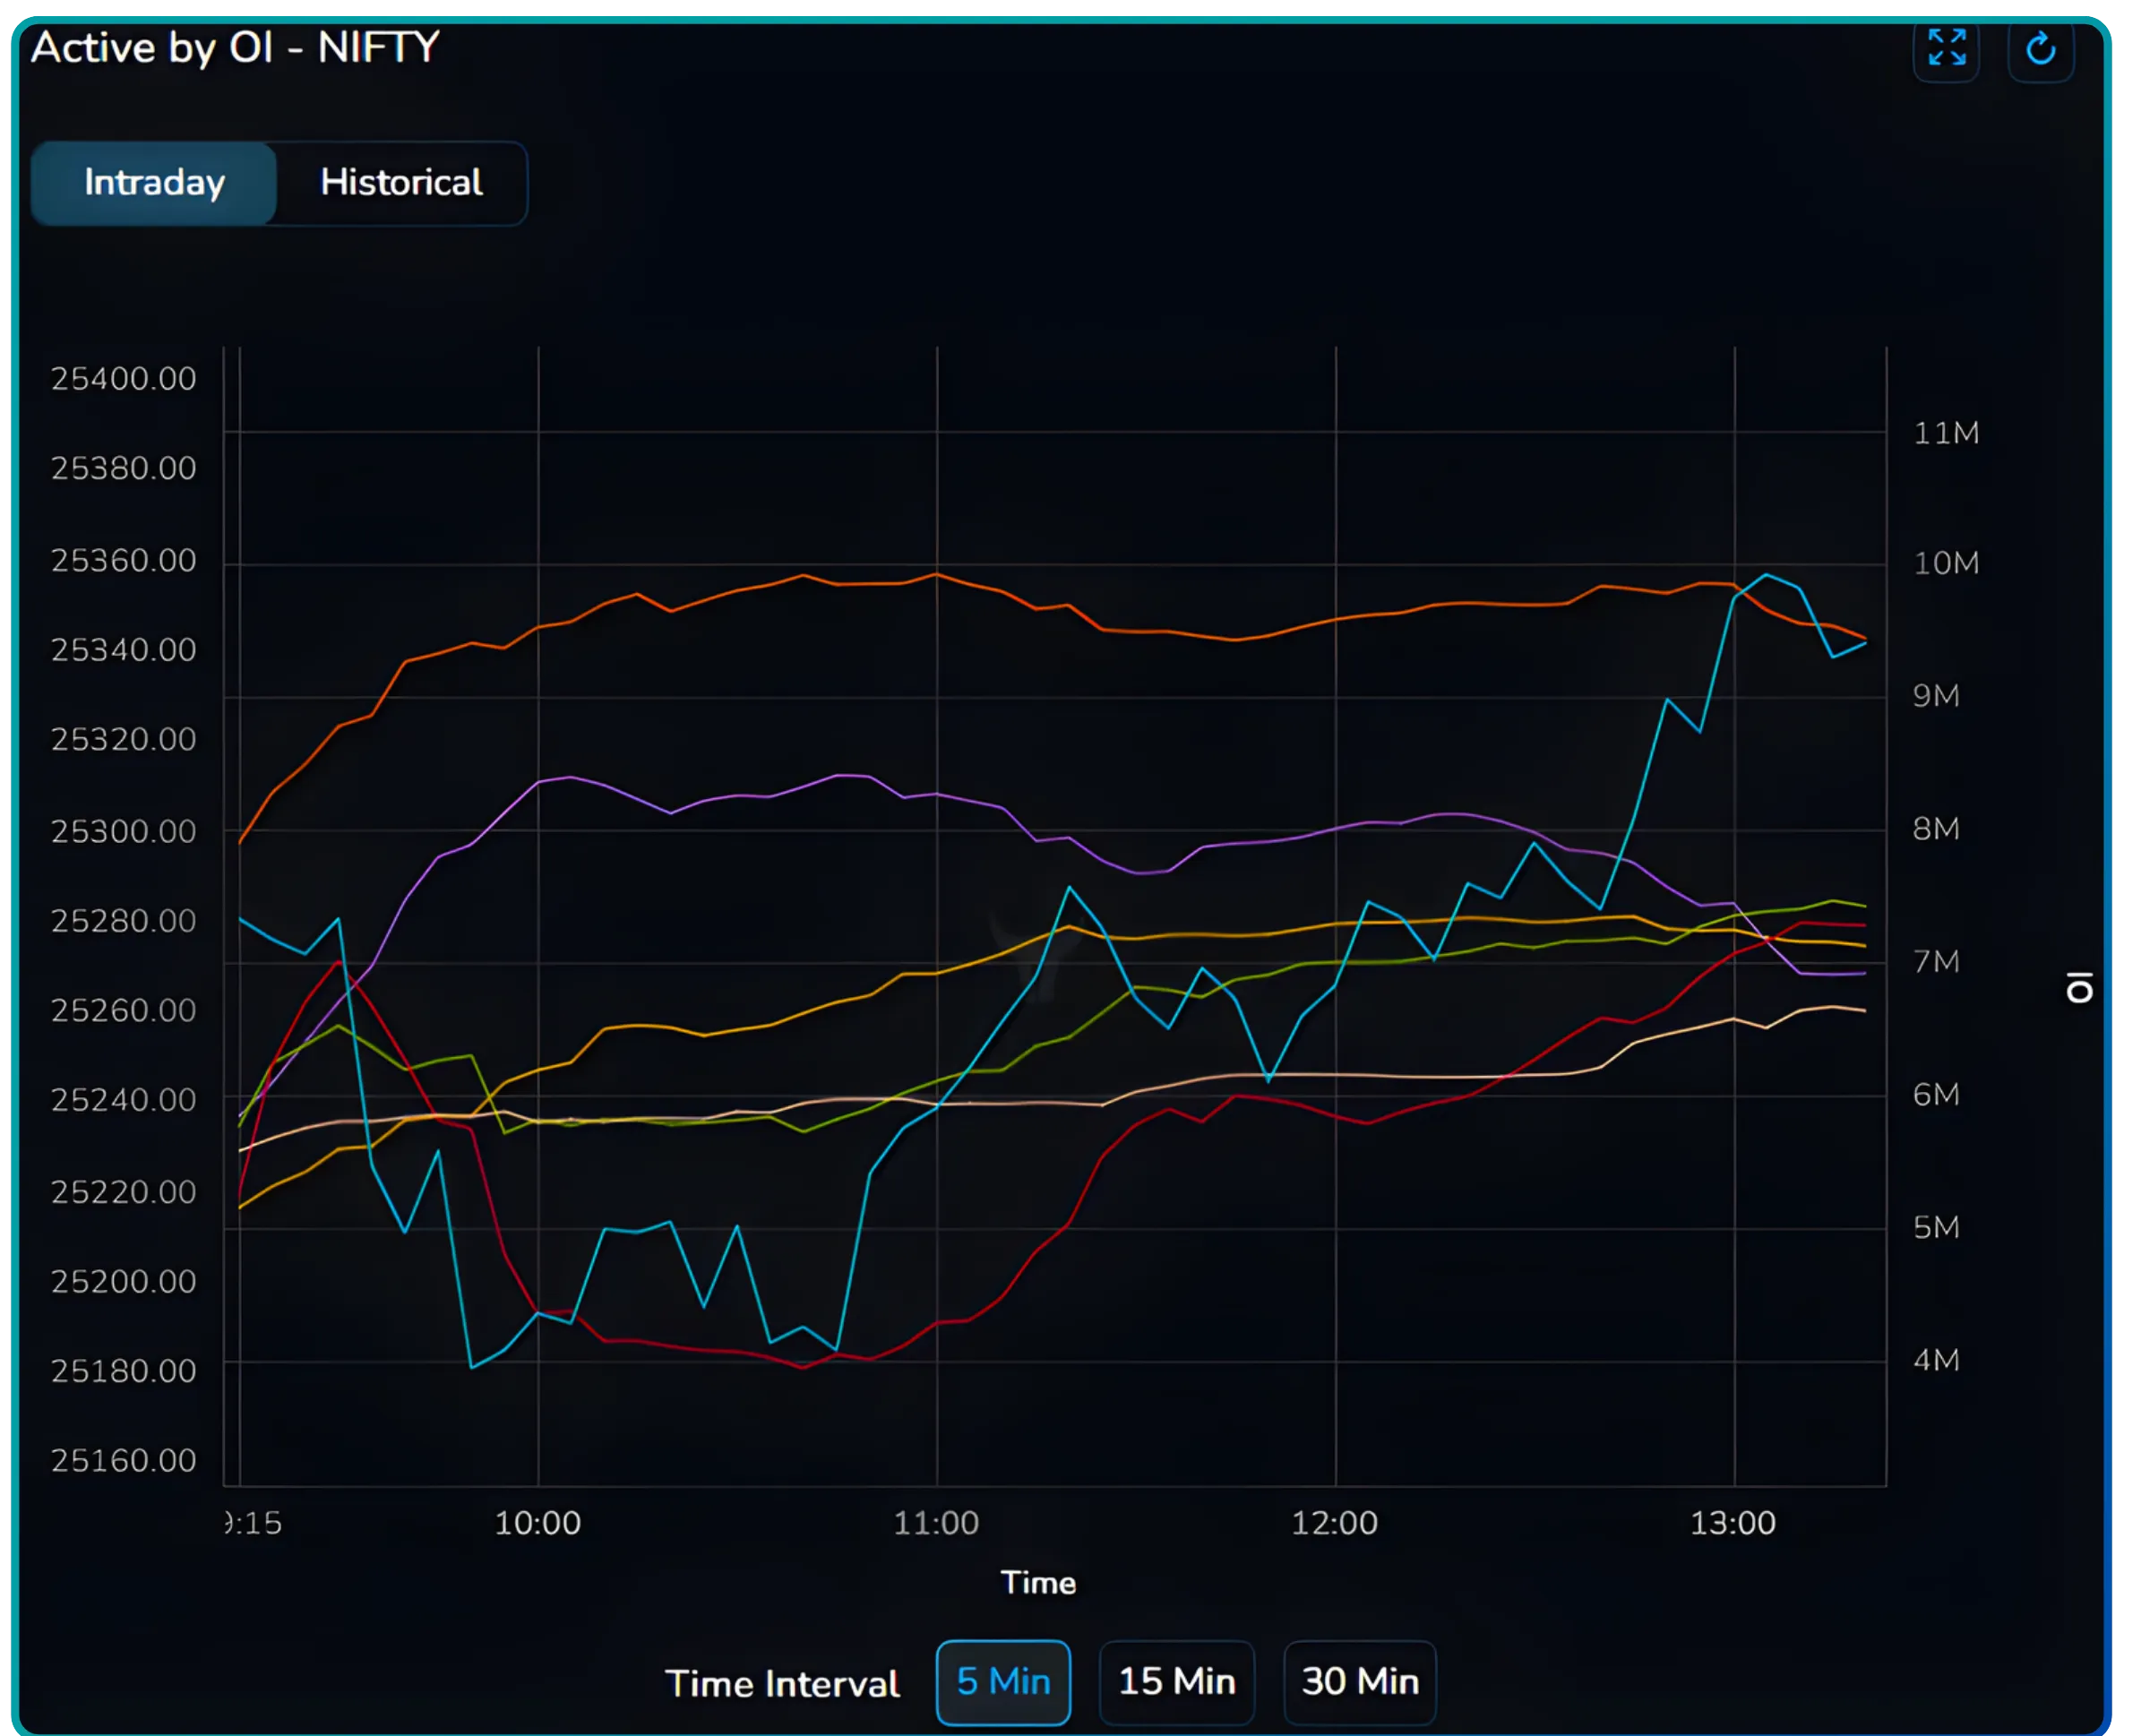
Interpreting the OI Chart
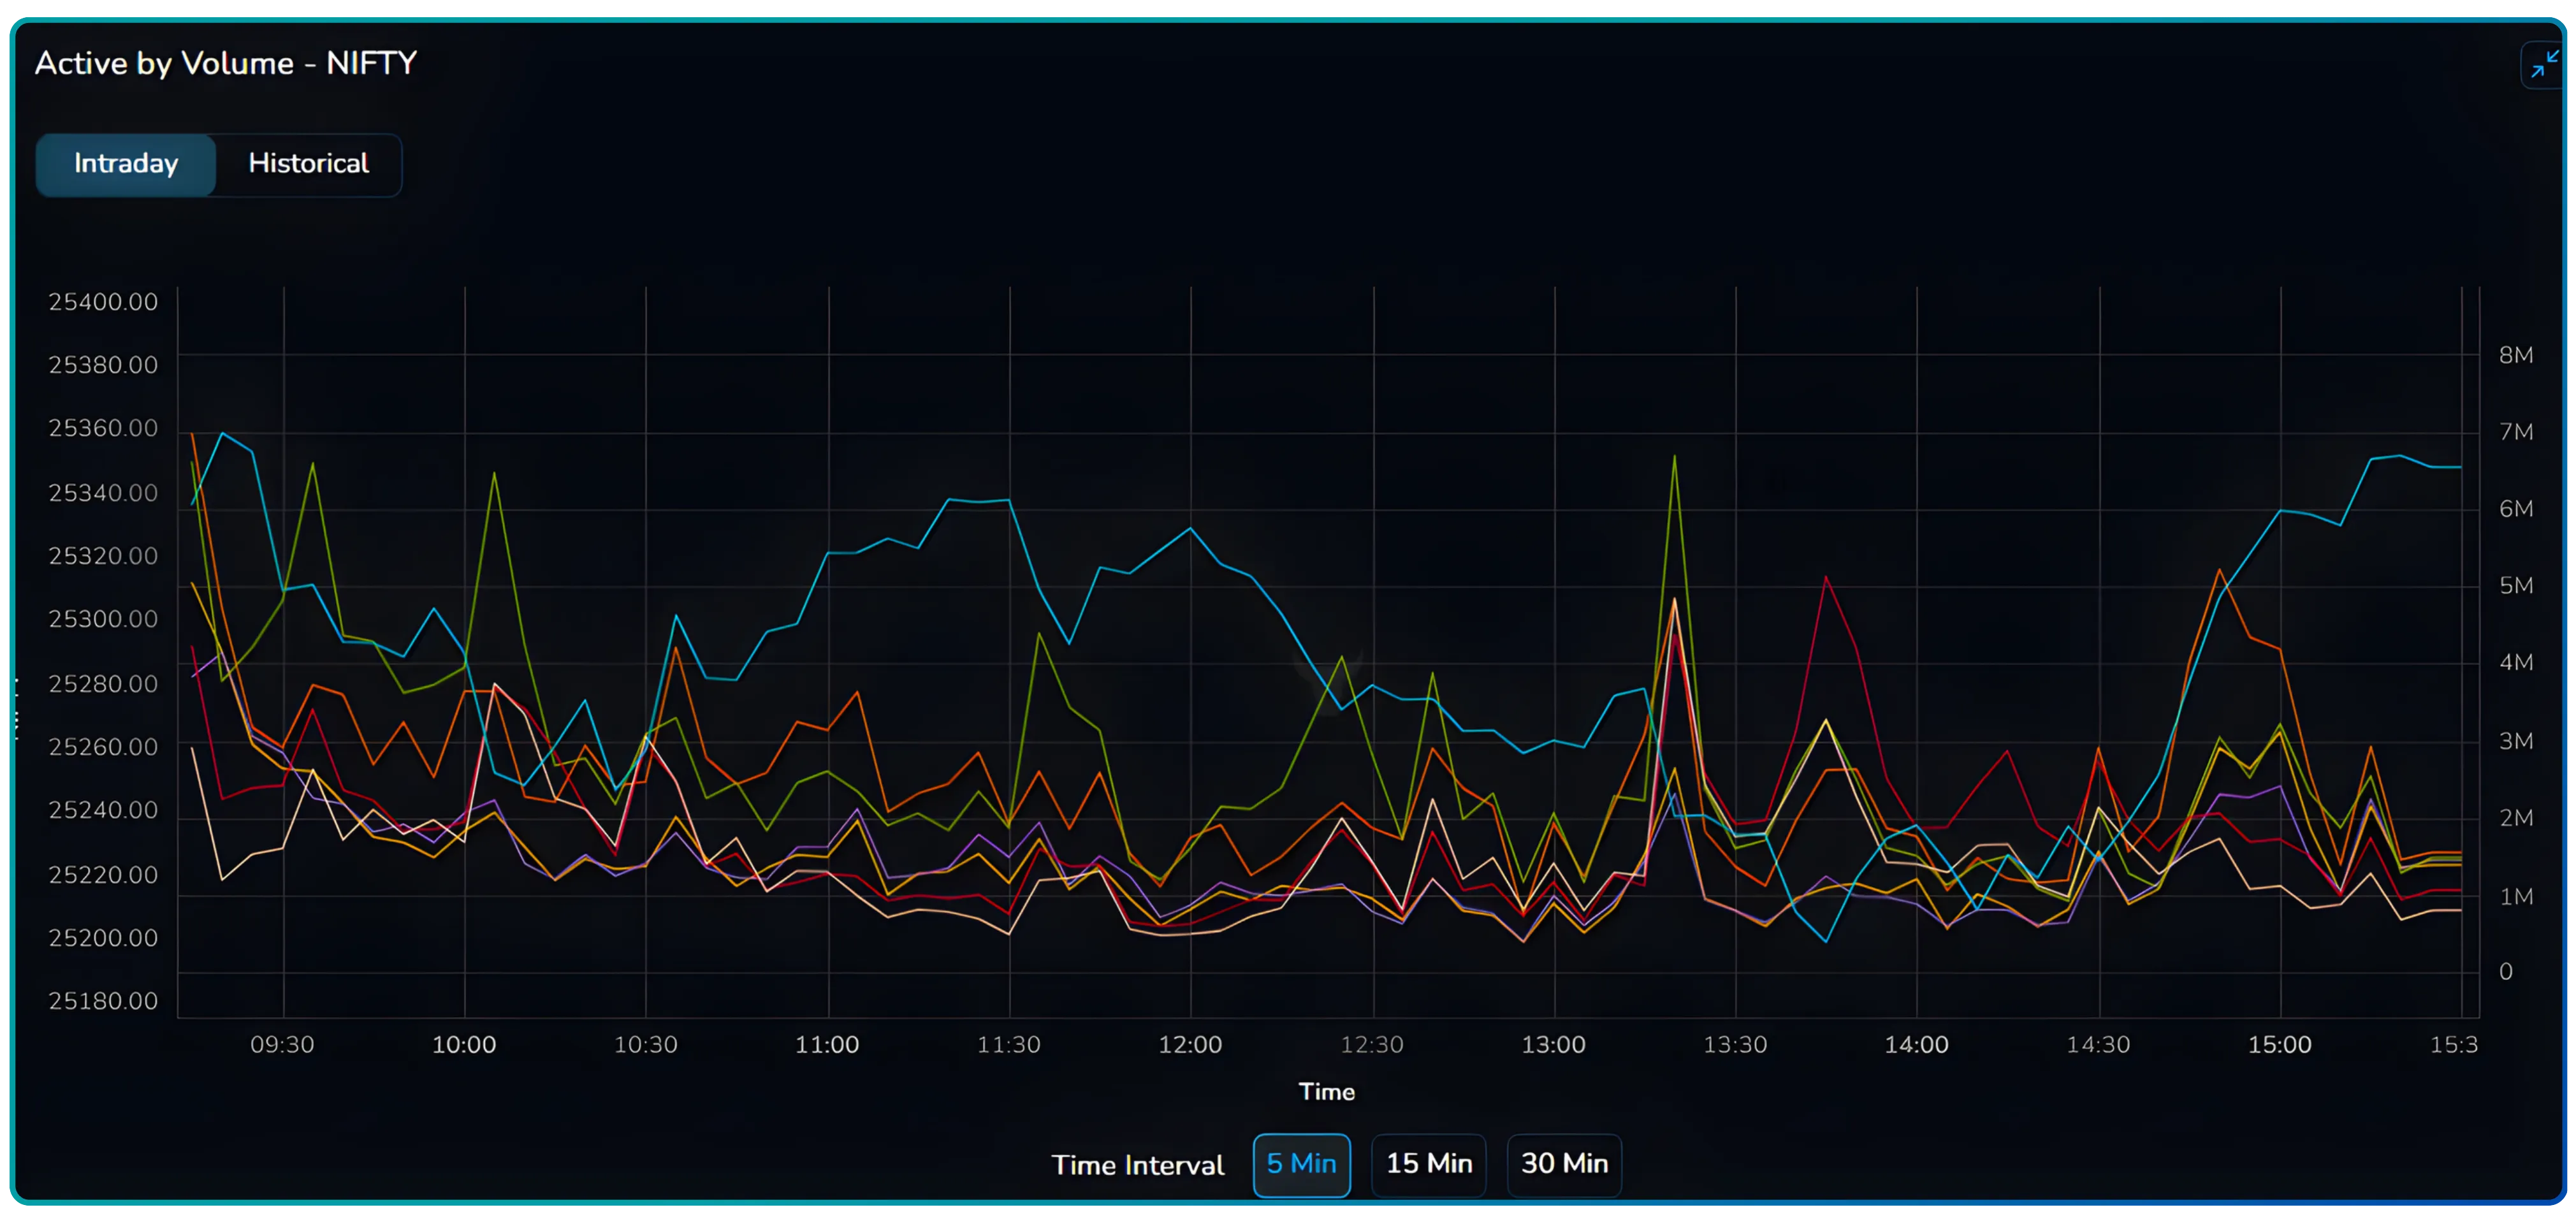
The OI chart shows the open interest for the option contract over time, helping to identify market sentiment. Each colored line represents OI movement:
- Rising lines indicate position building (potential accumulation).
- Falling lines indicate unwinding (potential distribution).
Analyzing changes in open interest across multiple strikes can help traders identify market trends, sentiment, and potential market breakouts or reversals. For example, a sudden increase in open interest at a strike price may indicate that traders are expecting a price movement in that direction.
Advanced Multi-Strike Strategies
A multi-strike strategy in options trading involves simultaneously buying and/or selling two or more options contracts with different strike prices and/or expiration dates on the same underlying asset. Common strategies include:
Spreads: Vertical spreads involve buying one call option at a lower strike price and selling another call at a higher strike price.
Straddles and Strangles: Straddles involve buying both a call and put for the same strike; a strangle uses different strike prices. Buying combinations like a strangle instead of a straddle can reduce the total premium paid.
Butterflies and Iron Condors: Strategies like iron condors are designed to profit from a market expected to remain range-bound with low volatility.
Risk Management:
Legging Risk: Executing multiple legs as a single order reduces leg-out risk and minimizes latency risk associated with price changes.
Margin Benefits: Multi-leg strategies significantly reduce the margin required compared to selling uncovered options and cap the maximum potential loss.
Complexities: These strategies are more complex than single-option trades and require a thorough understanding of how each leg interacts, as misunderstanding can lead to unexpected losses.
Disclaimer: The information provided in our blogs is for informational purposes only and should not be construed as financial, investment, or trading advice. Trading and investing in the securities market carries risk. Always conduct your own research and consult with a qualified financial advisor before making any investment decisions. Past performance is not indicative of future results. Copyrighted and original content for your trading and investing needs.
© 2026 — Tradejini. All Rights Reserved.