


Scalping in the derivatives market is like being a sniper in a fast-moving battlefield. It’s a high-octane trading style that demands precision, speed, and a laser focus on small, fleeting opportunities. Unlike swing or positional trading, scalping isn’t about chasing big trends. captures tiny price moves within seconds or minutes for consistent gains.
Do you thrive on:
Quick decision-making under pressure?
The adrenaline rush of rapid trades?
Small, frequent profits with disciplined risk control?
If so, scalping Nifty options could be your ideal strategy.
When Does Scalping Work Best?
Scalping works best in the right market conditions. Random trades won’t help, you need to act when the market shows strong movement and clear signals.
| Ideal Time/Condition | Why It Works |
|---|---|
| 9:15 AM – 10:00 AM | High volatility post-market open; strong momentum. |
| Trending Days | Clean directional moves with fewer fakeouts. |
| News-Based Moves | Volatility spikes drive rapid premium changes. |
| Weekly Expiry Days | Increased volume and fast option price swings. |
To succeed, you must identify these high-probability windows and act swiftly.
Choosing the Right Options
A common mistake is choosing deep out of the money options just because they look cheap. But cheap doesn’t always mean better. These options often move slowly and lack liquidity, making profits harder to come by.
Scalper’s Selection Criteria:
ATM or ITM Option: For responsive premium movement.
Weekly Expiry Options: Offer high liquidity and tight bid-ask spreads.
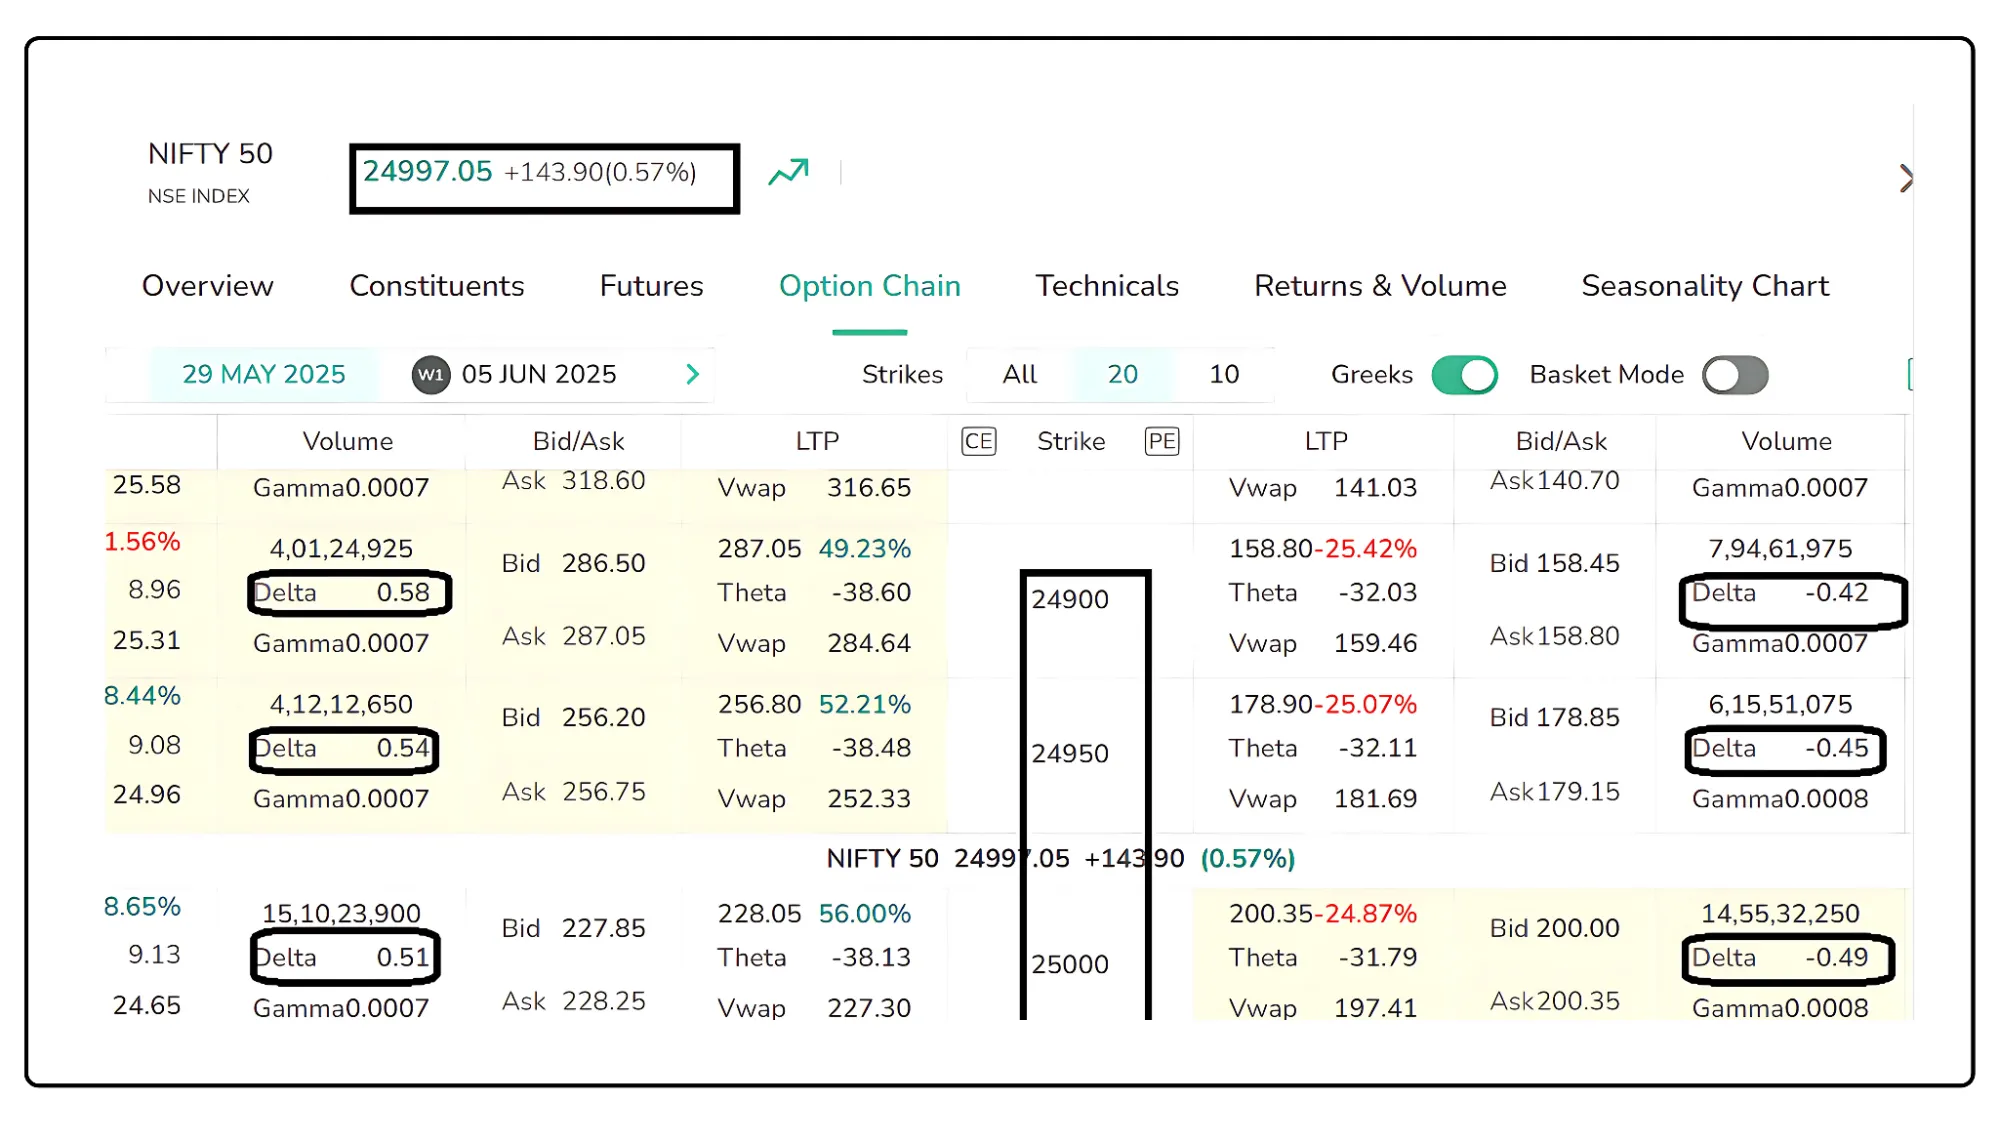
Delta between 0.40 and 0.60: Balances sensitivity to price moves and cost.
Interesting Fact: ATM options with delta ~0.50 move roughly ₹0.50 for every ₹1 move in Nifty, making them a sweet spot for scalping efficiency. Below image shows how to plot delta of an option through CubePlus.
Tools for Trade
Scalping needs the right setup. Here's what you will need to build your trading cockpit and stay ahead of the moves.
| Tool | Why You Need It |
|---|---|
| 1-min or 3-min charts | Pinpoint entry/exit timing. |
| VWAP | Tracks intraday trend and acts as a dynamic support/resistance. |
| 9 & 21 EMA | Spots short-term momentum shifts. |
| Volume Indicator | Confirms breakouts or reversals. |
| CubePlus Scalper | Ensures lightning-fast order execution. |
Risk Management Rules
Scalping without risk management is a recipe for disaster. Here’s your golden rulebook:
Risk Limit: Never risk more than 1–2% of your capital per trade.
Stop-Loss: Always set a stop-loss (₹10–15 max for Nifty options).
Profit Target: Aim for ₹10–20 per lot and stick to it.
Trade Limit: Cap at 3–5 trades per day to avoid overtrading.
Trading Journal: Log every trade to analyze and improve.
Quote: Scalping isn’t about being right every time. it's about stacking small wins and cutting losses fast.
VWAP Pullback Scalping Strategy
The Volume Weighted Average Price (VWAP) is a trader’s compass for intraday trends. It calculates the average price of Nifty, weighted by trading volume, providing a benchmark for institutional and retail traders alike.
Why Traders Love VWAP:
Institutional Benchmark: Large players use it to gauge trade execution.
Dynamic Support/Resistance: Acts as a magnet for price pullbacks.
Trend Indicator: Price above VWAP signals bulls; below VWAP signals bears.
Interesting Fact: VWAP was first used by institutional traders in the 1980s to optimize large block trades, ensuring buys or sells were near the market’s ‘fair’ price.
Strategy Objective
The VWAP Pullback Scalping Strategy focuses on:
Entering trades in the direction of the trend when Nifty retraces to VWAP.
Exiting quickly with small, consistent profits (₹10–20 per lot).
Avoiding top or bottom picking, instead riding short retracements.
Indicators Required:
VWAP (available on platforms like Cube).
1-minute or 3-minute chart.
Volume indicator.
Trade Rules
LONG TRADE (Buy Call Option):
Nifty price is above VWAP, indicating a bullish trend.
Price pulls back to VWAP and forms a bullish candle or bearish candle.
Volume spike (optional) confirms strength.
Entry: Buy ATM or slightly ITM Call Option (Delta ~0.40–0.60).
Stop Loss: ₹10–15 below entry premium or below VWAP.
Target: ₹10–20 per lot or 15–25 Nifty points.
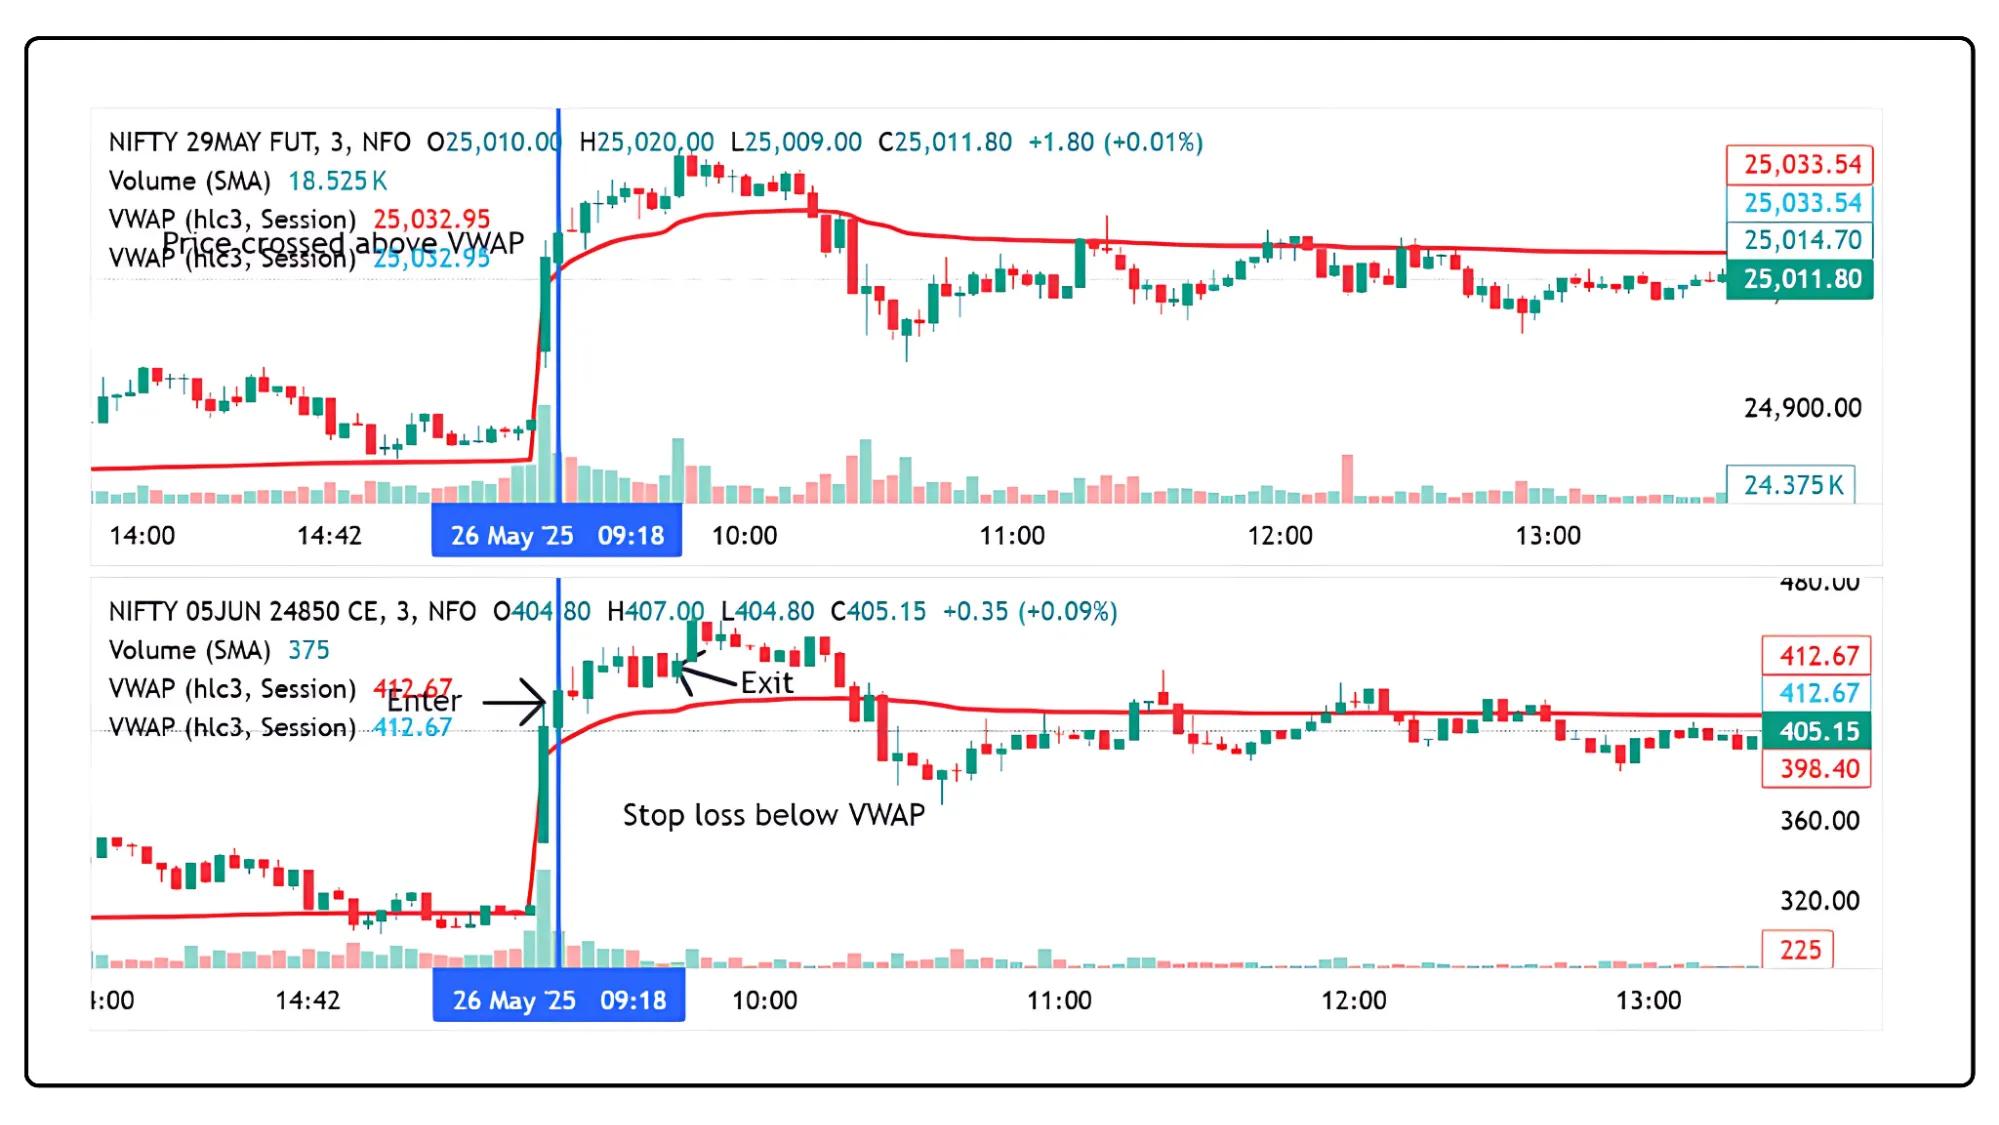
As seen in the image from 26th May 2025 at 9:19 AM, Nifty Futures crossed above the VWAP, signaling a potential buy opportunity.
A trade was taken with the strike 24850 CE at ₹417, which later moved to ₹441, giving a gain of 20+ points.
Here, a smart approach is to book 70% profits and trail the remaining lots with a stop loss at ₹428 or simply at the entry price (₹417). This strategy locks in gains and gives you a chance to ride any further rally with nothing to lose on the rest.
SHORT TRADE (Buy Put Option):
Nifty price is below VWAP, signaling a bearish trend.
Price pulls back to VWAP and forms a bearish candle.
Volume spike (optional) supports the move.
Entry: Buy ATM or slightly ITM Put Option (Delta ~0.40–0.60).
Stop Loss: ₹10–15 above entry premium or above VWAP.
Target: ₹10–20 per lot or 15–25 Nifty points.
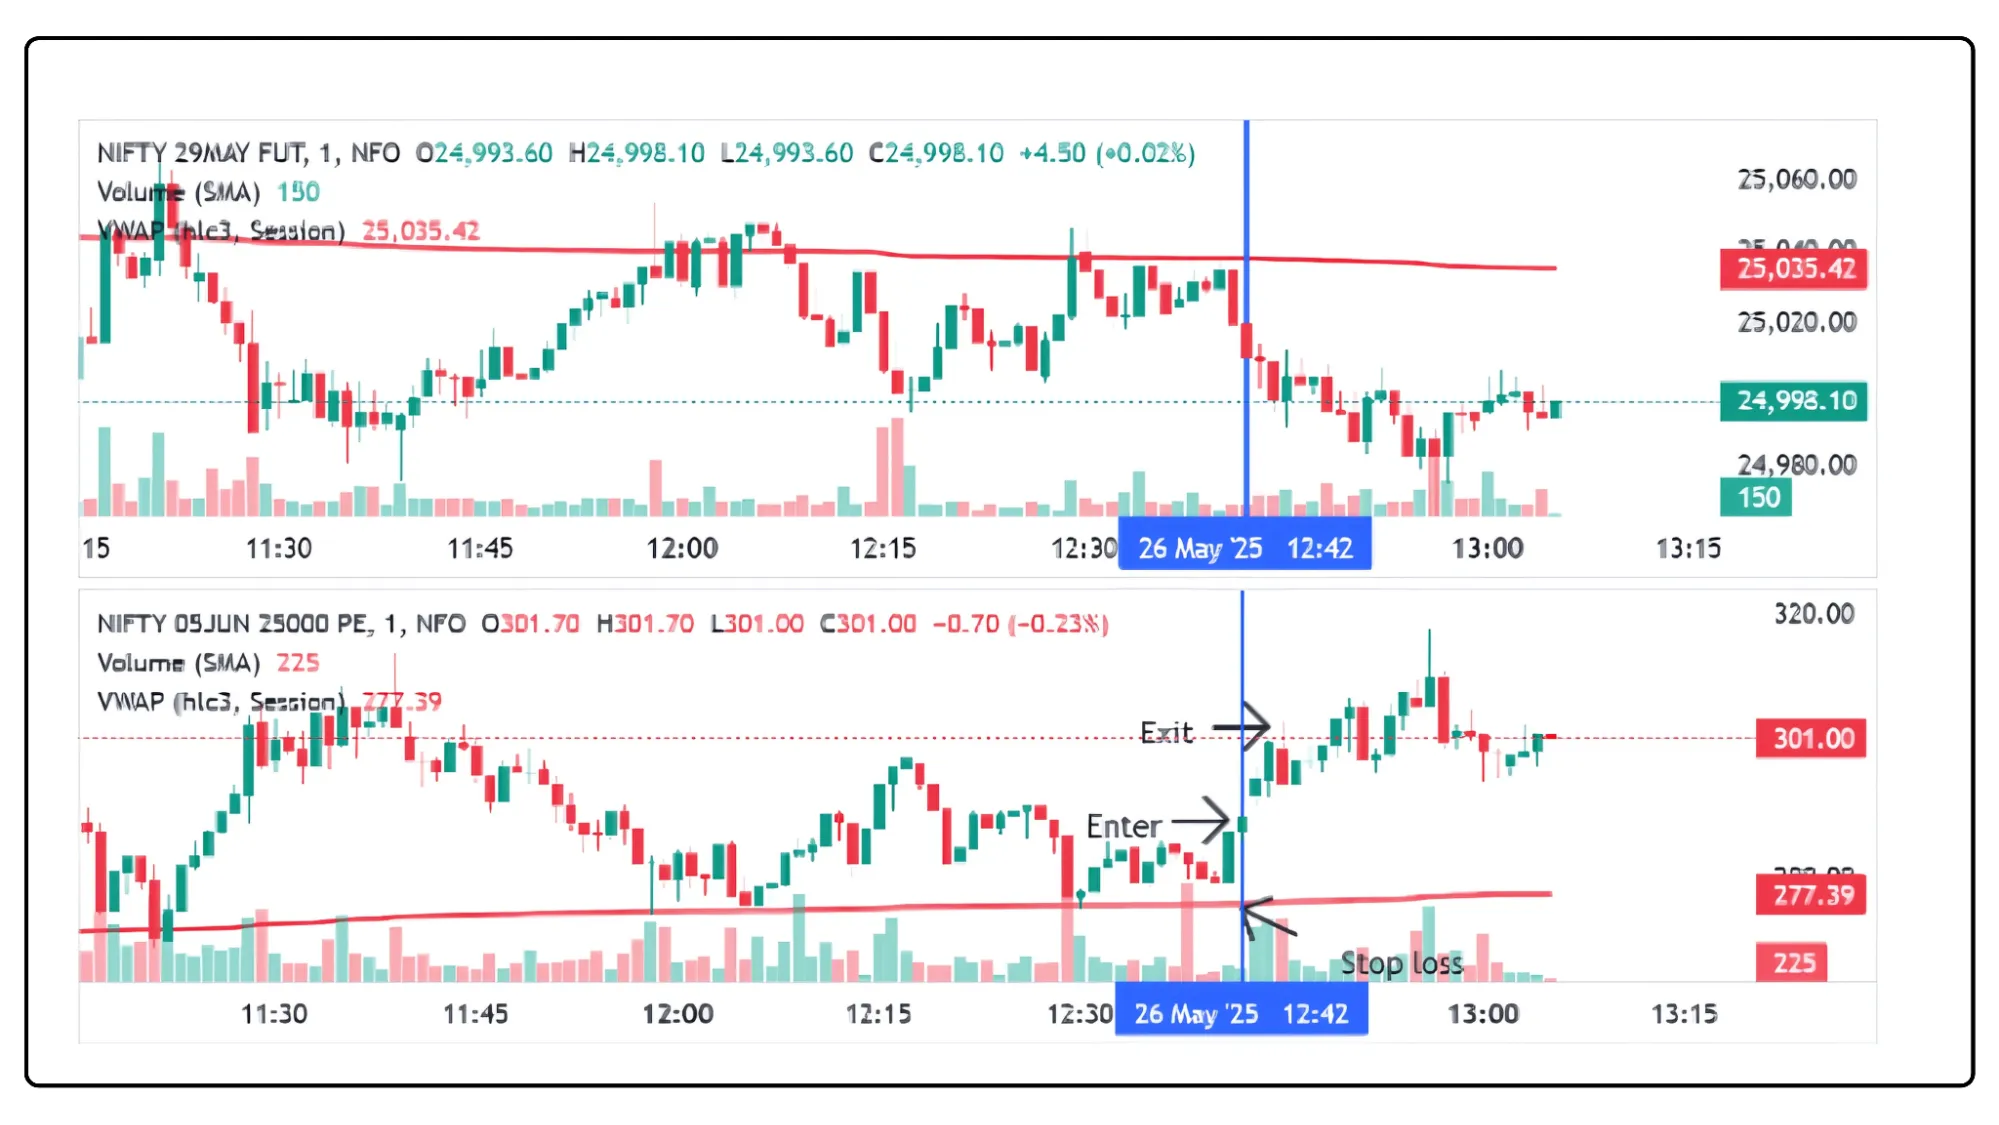
In the chart of NIFTY 50 as on 26th May 2025 at 12:42 PM,, VWAP is applied on Nifty Futures. After the price crossed below VWAP and a bearish candle closed, we waited for the price to pullback to VWAP before entering. The entry was triggered in NIFTY 25000 PE at ₹288.
Support appeared just 10 points below, so instead of exiting fully, we booked 70% of the profits and trailed the rest with stop loss moved to cost (₹288). The price later hit ₹308, showing how partial booking + trailing helps protect profits and ride bigger moves.
Strategy Tips
Trend Alignment: Only trade pullbacks in the direction of the VWAP trend (above for Calls, below for Puts).
Avoid Choppy Markets: Skip mid-day (12:30 PM – 2:00 PM) unless volatility is high.
Volume Confirmation: Higher volume near VWAP signals stronger reversals.
Liquidity Focus: Use weekly ATM or 1-strike ITM options for tight spreads.
Common Mistakes to Avoid
| Mistake | Why It Hurts | Solution |
|---|---|---|
| Trading against VWAP trend | Lowers win rate | Align entries with VWAP direction. |
| Entering without candle confirmation | False signals | Wait for a strong bullish/bearish candle. |
| Using deep OTM options | Slow premium movement | Stick to ATM or ITM options. |
| Holding too long | Misses scalping’s quick nature | Exit within 5–10 minutes. |
EMA Crossover Scalping Strategy
Understanding EMA for Scalping
Exponential Moving Averages (EMAs) are perfect for scalping because they prioritize recent price action, making them more responsive than Simple Moving Averages (SMAs).
Setup:
9 EMA: Fast-moving, tracks short-term price shifts.
21 EMA: Slower, reveals the underlying trend.
Signals:
Bullish Signal: 9 EMA crosses above 21 EMA.
Bearish Signal: 9 EMA crosses below 21 EMA.
Strategy Objective
The EMA Crossover Scalping Strategy aims to:
Capture rapid momentum bursts after a 9 EMA crosses the 21 EMA.
Enter during breakouts or post-consolidation moves, skipping retracements.
Secure ₹10–20 per lot in 5–10 minutes.
Ideal for traders who love jumping into early momentum, especially after sideways markets or news-driven spikes.
Indicators Required:
9 EMA (blue), 21 EMA (red).
Volume indicator.
Optional: VWAP (to align with trend bias).
Trade Rules
LONG TRADE (Buy Call Option):
Nifty price is above both 9 EMA & 21 EMA.
9 EMA crosses above 21 EMA on a 1-min/3-min chart.
Strong bullish candle forms, ideally with a volume spike.
Entry: Buy ATM Call Option (Delta ~0.40–0.60).
Stop Loss: ₹10–15 below entry premium or nearest swing low.
Target: ₹10–20 per lot or exit on candle close below 9 EMA.
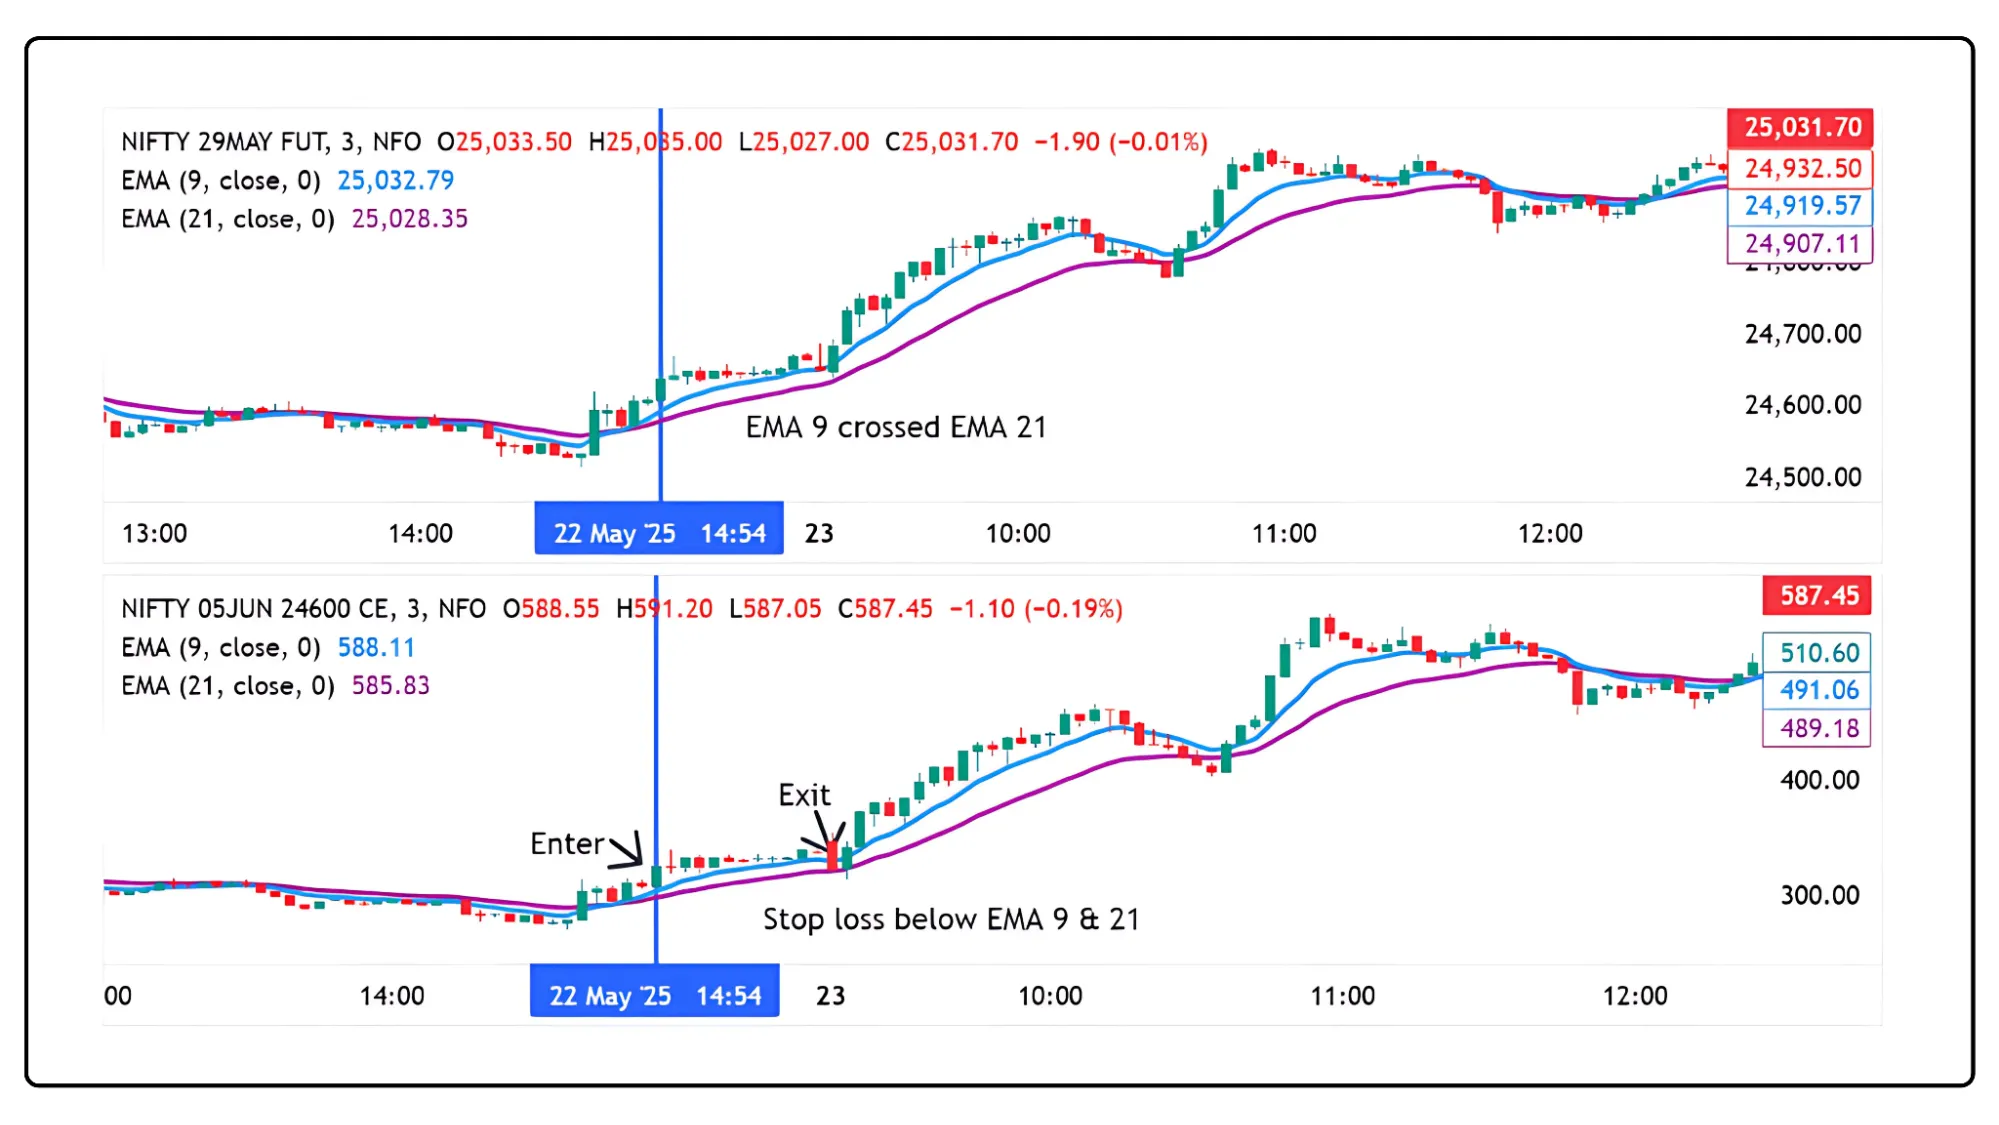
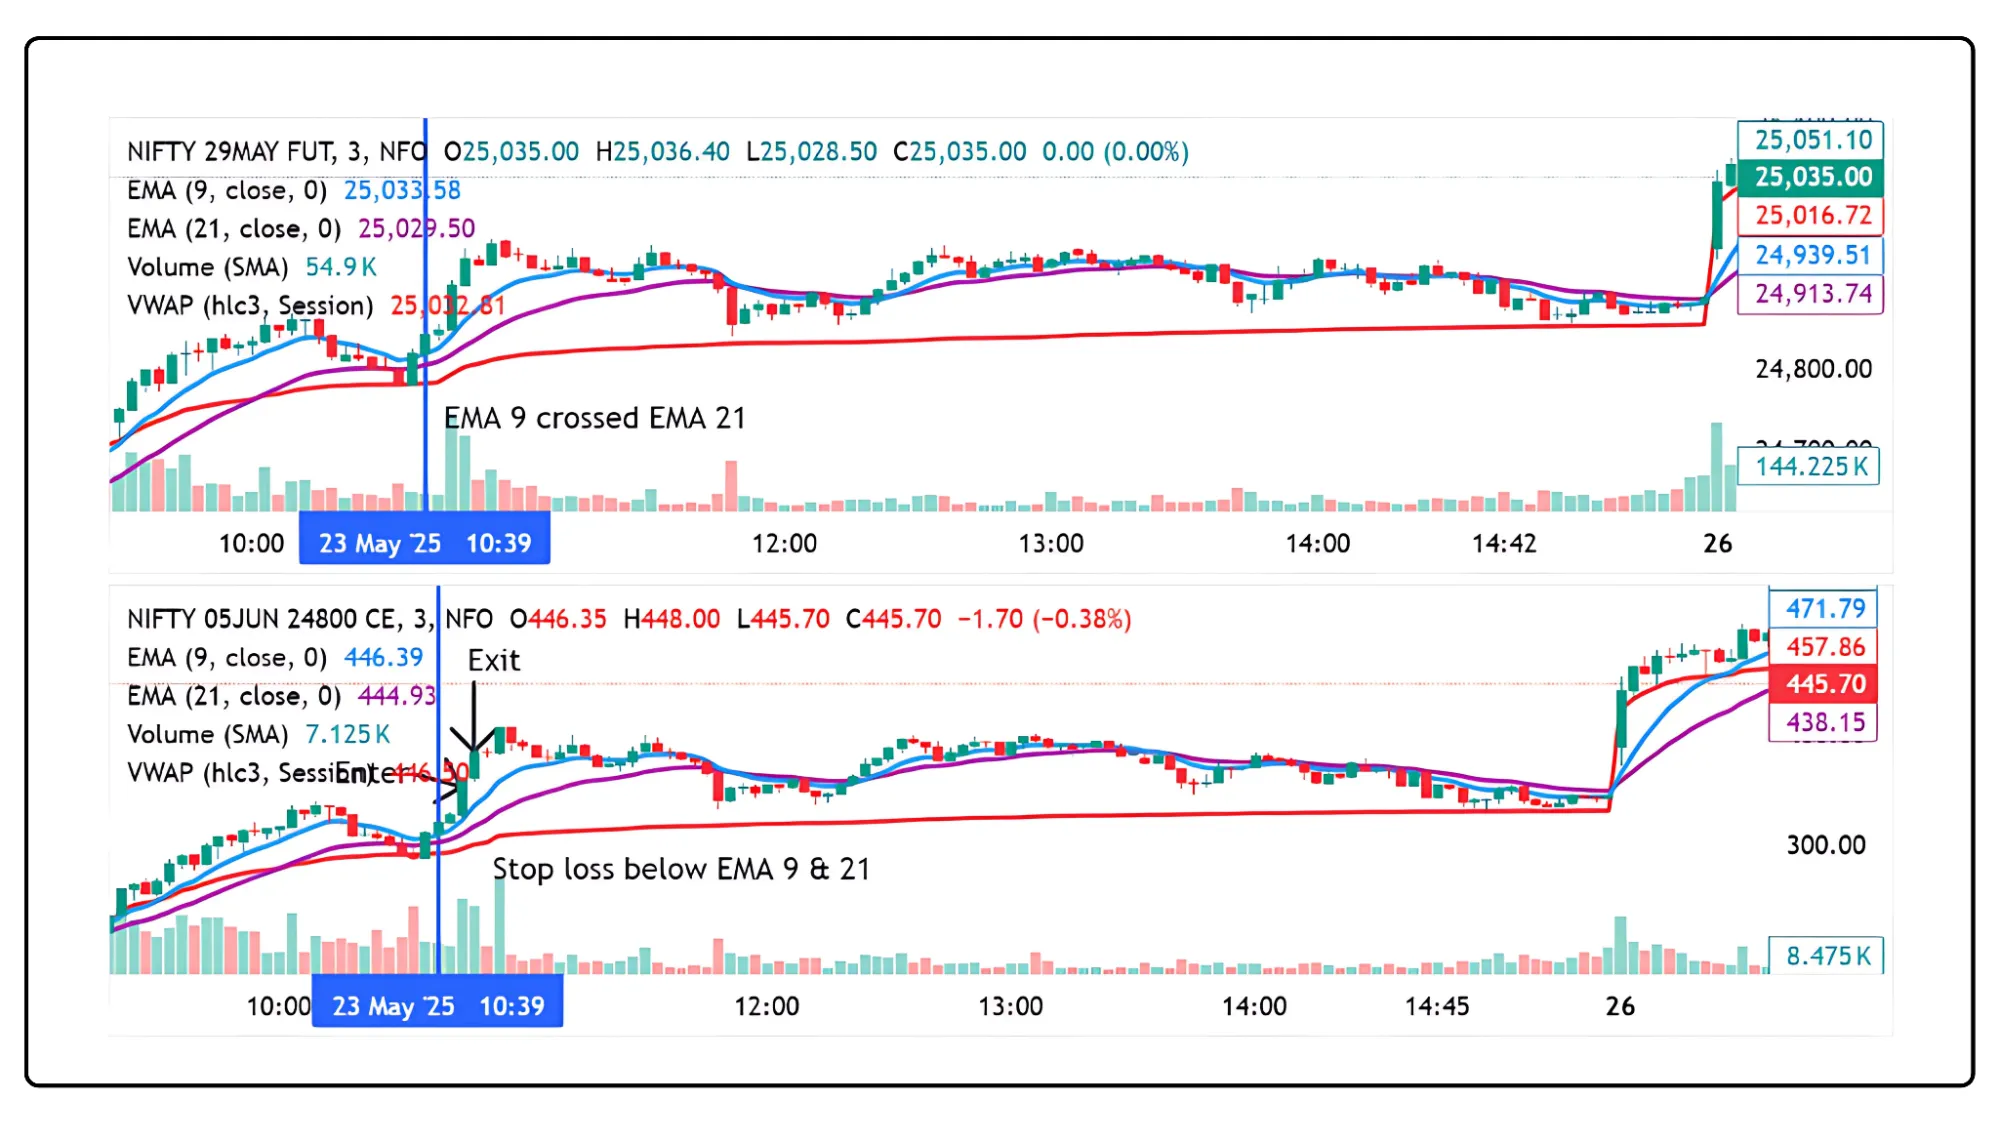
On the NIFTY 50 Futures chart on 22nd May 2025 at 2:54 PM, the 9 EMA crossed above the 21 EMA, triggering a buy entry in the 24600 CE at ₹328.
The initial target was achieved at ₹348, giving a quick 20-point gain. A good strategy here is to book 70% profits and trail the stop loss at the entry price or 10 points below.
If the remaining position was trailed, the option later moved up to ₹428, offering a total gain of 100 points, all with limited risk on the leftover lots.
SHORT TRADE (Buy Put Option):
Nifty price is below both 9 EMA and 21 EMA.
9 EMA crosses below 21 EMA.
Strong bearish candle forms, ideally with a volume spike.
Entry: Buy ATM Put Option (Delta ~0.40–0.60).
Stop Loss: ₹10–15 above entry premium or nearest swing high.
Target: ₹10–20 per lot or exit on candle close above 9 EMA.
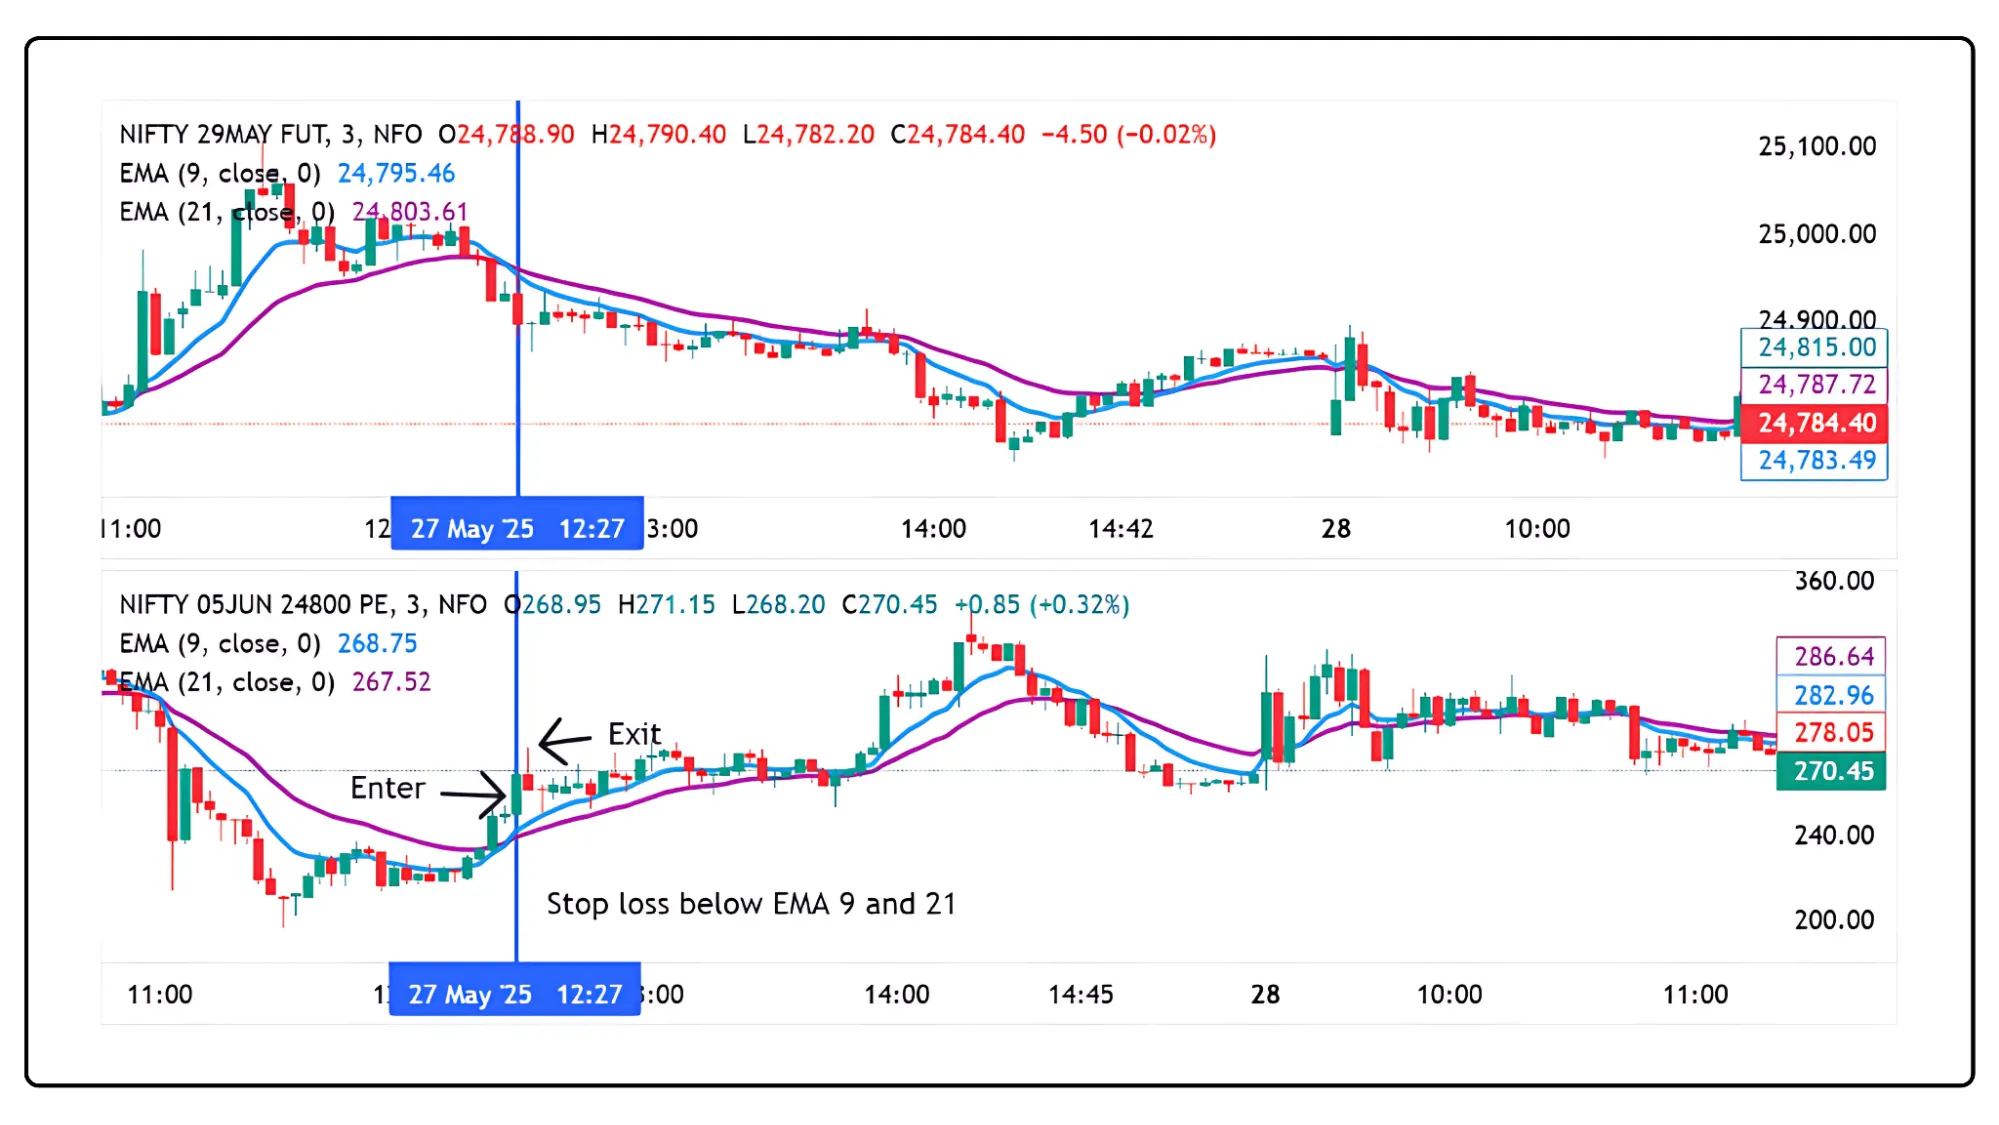
On the NIFTY 50 Futures chart on 27th May 2025 at 12:27 PM, the 9 EMA crossed below the 21 EMA, triggering a buy entry in the 24800 PE at ₹256.
The initial target was achieved at ₹276, giving a quick 20-point gain. A good strategy here is to book 70% profits and trail the stop loss at the entry price or 10 points below.
If the remaining position was trailed, the option later moved up to ₹331, offering a total gain of 76 points, all with limited risk on the leftover lots.
Real Example (Hypothetical)
On May 23, 2025, at 10:45 AM:
NIfty future was at 24800 level
On the 3-min chart, 9 EMA had crossed above 21 EMA ( In this case both crossovers were done one day before but today the EMA came closer and the pull back happened
A strong bullish candle closes at 22,600 with a volume spike.
VWAP confirms bullish bias.
You decide to:
Buy 24850 CE at ₹238.
Set Stop Loss at 20 points.
Target ₹258 (₹20 profit).
By 10:45 AM, Nifty futures hit 24,900, and the option reached ₹258. You exited with a ₹20 profit Trade duration: 3 minutes. Here if one would have exited 70% lots and held reamining trailing stop loss at 10 points above buy price or at buy price, one could have gained around 70 points.
Accuracy Check: The example uses realistic Nifty levels and option premiums, with the 9/21 EMA crossover aligning with standard technical analysis practices for momentum trading.
Strategy Tips
Confirm Entries: Wait for a strong candle to close after the crossover to avoid false signals.
Use VWAP: Crossovers above VWAP (Calls) or below VWAP (Puts) increase reliability.
High-Volume Periods: Focus on market open or expiry days for stronger signals.
Start Small: Trade 1 lot initially to master execution.
Liquidity: Use weekly ATM options for fast fills and tight spreads.
Common Mistakes to Avoid
| Mistake | Why It Hurts | Solution |
|---|---|---|
| Entering before crossover completion | False signals lead to losses | Wait for 9 EMA to fully cross 21 EMA and a confirming candle. |
| Chasing late moves | Poor risk-reward ratio | Enter only on fresh crossovers with volume. |
| Ignoring stop-loss | One loss can wipe out gains | Set a hard SL (₹10–15) on your platform. |
| Trading low-volume options | Slippage hurts profits | Use ATM or 1-strike ITM weekly options. |
Opening Range Breakout (Box Strategy)
The Opening Range Breakout (Box Strategy) leverages the market's initial momentum burst right after the opening bell. The first 15–30 minutes (9:15 AM – 9:30 AM IST) often see intense activity as institutions, retail traders, and algorithms set the day’s tone. This strategy defines a “box” (price range) in the opening minutes and trades breakouts in either direction.
Why It Works:
High volatility at market open drives rapid price moves.
Clear breakout signals offer quick, actionable trades.
Strategy Objective
The goal is to:
Identify the high and low of the first 15 minutes (9:15 AM – 9:30 AM).
Trade breakouts above or below this range with tight risk control.
Capture ₹10–20 per lot from momentum-driven moves.
Strategy Setup
Indicators Required:
1-minute or 3-minute chart.
Volume indicator (to confirm breakout strength).
Optional: VWAP (to gauge trend bias).
Time Frame:
Primary focus: 9:15 AM – 9:45 AM for range setup and breakout.
Secondary: 10:00 AM – 10:15 AM on high-volatility days.
Defining the Box:
At 9:30 AM, mark the highest high and lowest low of Nifty from 9:15 AM to 9:30 AM.
This forms the “box” or range for breakout trades.
Trade Rules
LONG TRADE (Buy Call Option):
The Nifty breaks above the opening range high (9:15 AM – 9:30 AM).
A strong bullish candle closes above the high, ideally with a volume spike.
Optional: VWAP below price for bullish bias.
Entry: Buy ATM or slightly ITM Call Option (Delta ~0.40–0.60).
Stop Loss: ₹10–15 below entry premium or range low.
Target: ₹10–20 per lot or 15–25 Nifty points.
SHORT TRADE (Buy Put Option):
The Nifty breaks below the opening range low.
A strong bearish candle closes below the low, ideally with a volume spike.
Optional: VWAP above price for bearish bias.
Entry: Buy ATM or slightly ITM Put Option (Delta ~0.40–0.60).
Stop Loss: ₹10–15 above entry premium or range high.
Target: ₹10–20 per lot or 15–25 Nifty points.
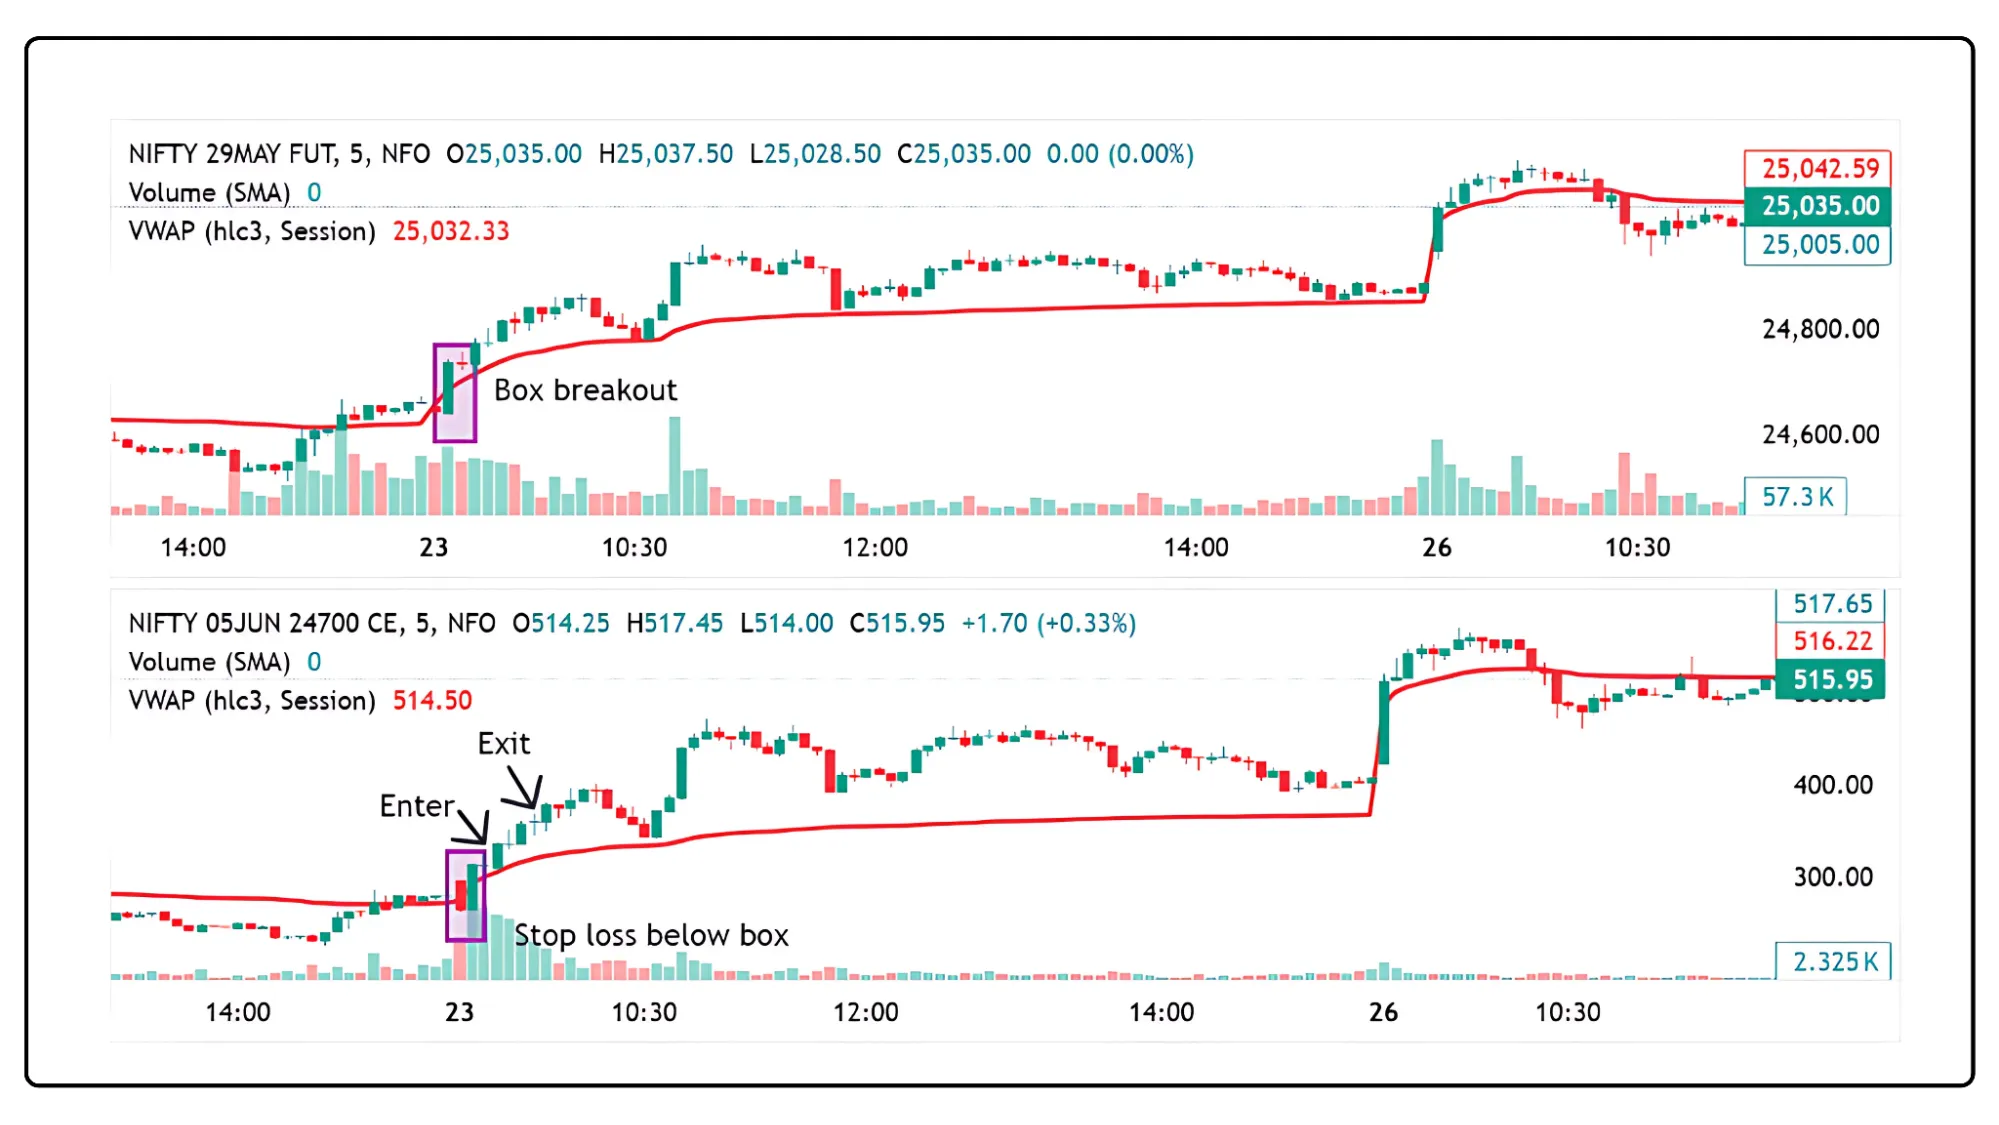
Real Example (Hypothetical)
On May 23, 2025, at 9:30 AM:
Opening range (9:15 AM – 9:30 AM): High 22,750, Low 22,640.
At 9:36 AM, Nifty breaks above 22,750 with a strong bullish candle and volume spike.
VWAP at 22,730 confirms bullish bias.
You decide to:
Buy 24,700 CE at ₹330 (ATM, Delta ~0.50) at ₹90.
Set Stop Loss at (₹15 risk).
Target ₹352(₹20 profit).
By 9:42 AM, Nifty futures hit 22,830, and the option reached ₹362. You exit with a ₹22 profit per lot Trade duration: 7 minutes. But here one would have exited 70% lots and remaining kept trailing at buying price or 10 points above buying price one would have gained around 60 points.
Accuracy Check: The example uses realistic price levels and option behavior, with the 15-minute range breakout being a well-documented intraday trading setup.
Strategy Tips
First Breakout: Trade the day’s first breakout for highest reliability.
Avoid Narrow Ranges: Skip ranges <20 points to reduce fakeouts.
VWAP Alignment: Breakouts above VWAP (Calls) or below VWAP (Puts) are stronger.
Liquidity: Use weekly ATM options for fast execution.
Volatility Check: Avoid low-volume days (e.g., holidays) to prevent weak breakouts.
Common Mistakes to Avoid
| Mistake | Why It Hurts | Solution |
|---|---|---|
| Entering before candle close | False breakouts | Wait for a strong candle close outside the range. |
| Ignoring volume | Weak breakouts reverse | Confirm with a volume spike. |
| Trading multiple breakouts | Later breakouts are less reliable | Focus on the first breakout. |
| Using deep OTM options | Slow premium movement | Use ATM or ITM options. |
Comparison of Key Scalping Setups in Nifty Options
| Component | VWAP Pullback | EMA Crossover | Box Breakout (15-min High/Low) |
|---|---|---|---|
| Setup | Pullback near VWAP with confirming candle | 9 EMA crosses 21 EMA with volume support | High/Low of first 15 minutes (9:15–9:30 AM) |
| Trend Alignment | Above VWAP = bullish, Below VWAP = bearish | Not required, but better with trend | Optional, works well with trend or news-based moves |
| Entry Signal | Confirming candle near VWAP in direction of trend | Strong crossover candle with volume | Breakout of 15-min range with strong candle & volume |
| Indicators Used | VWAP, Volume (optional) | 9 EMA, 21 EMA, Volume, VWAP (optional) | Volume (essential), VWAP (optional) |
| Option Type | ATM or slightly ITM CE/PE (weekly expiry) | ATM CE/PE (weekly expiry, Delta ~0.40–0.60) | ATM or slightly ITM CE/PE (weekly expiry) |
| Stop Loss | ₹10–15 per lot | ₹10–15 per lot | ₹10–15 per lot |
| Target | ₹10–20 per lot or 15–25 Nifty points | ₹10–20 per lot or 15–25 Nifty points | ₹10–20 per lot or 15–25 Nifty points |
Combining VWAP, EMA, and Box Strategy for Precision Scalping in Nifty
Combining VWAP, EMA crossovers, and box range setups in Nifty scalping creates a high-probability framework rooted in structure, not guesswork. VWAP guides trend bias, EMAs catch momentum shifts, and box ranges filter breakouts. Success lies in reacting to price behavior, not predicting it. With discipline, real-time observation, and strong risk control, this trio helps traders align with market momentum efficiently.
Disclaimer: The information provided in our blogs is for informational purposes only and should not be construed as financial, investment, or trading advice. Trading and investing in the securities market carries risk. Always conduct your own research and consult with a qualified financial advisor before making any investment decisions. Past performance is not indicative of future results. Copyrighted and original content for your trading and investing needs.
© 2025 — Tradejini. All Rights Reserved.