


Varroc Engineering is a leading tier-1 automotive component supplier in India. The company operates across four primary business divisions: polymers, electrical and electronics, metallic components, and two-wheeler and three-wheeler lighting systems. It serves leading OEMs in India, including Bajaj Auto, and has a growing footprint in international markets.
Following the sale of its global four-wheeler lighting business in FY23, Varroc streamlined its portfolio to focus on India-centric operations, while maintaining selective exposure to overseas markets. The company has over 30 manufacturing facilities and multiple R&D centers across India. In FY25, Varroc filed 25 patents, taking its cumulative filings to over 120, reinforcing its commitment to innovation and technology leadership.
Varroc’s emphasis on high-value segments, such as EV systems, premiumization of two-wheeler components, and electronics, gives it a strategic edge in a rapidly evolving automotive landscape.
In-depth look at Varroc's business segments
Varroc’s revenue model is well-diversified across multiple product lines:
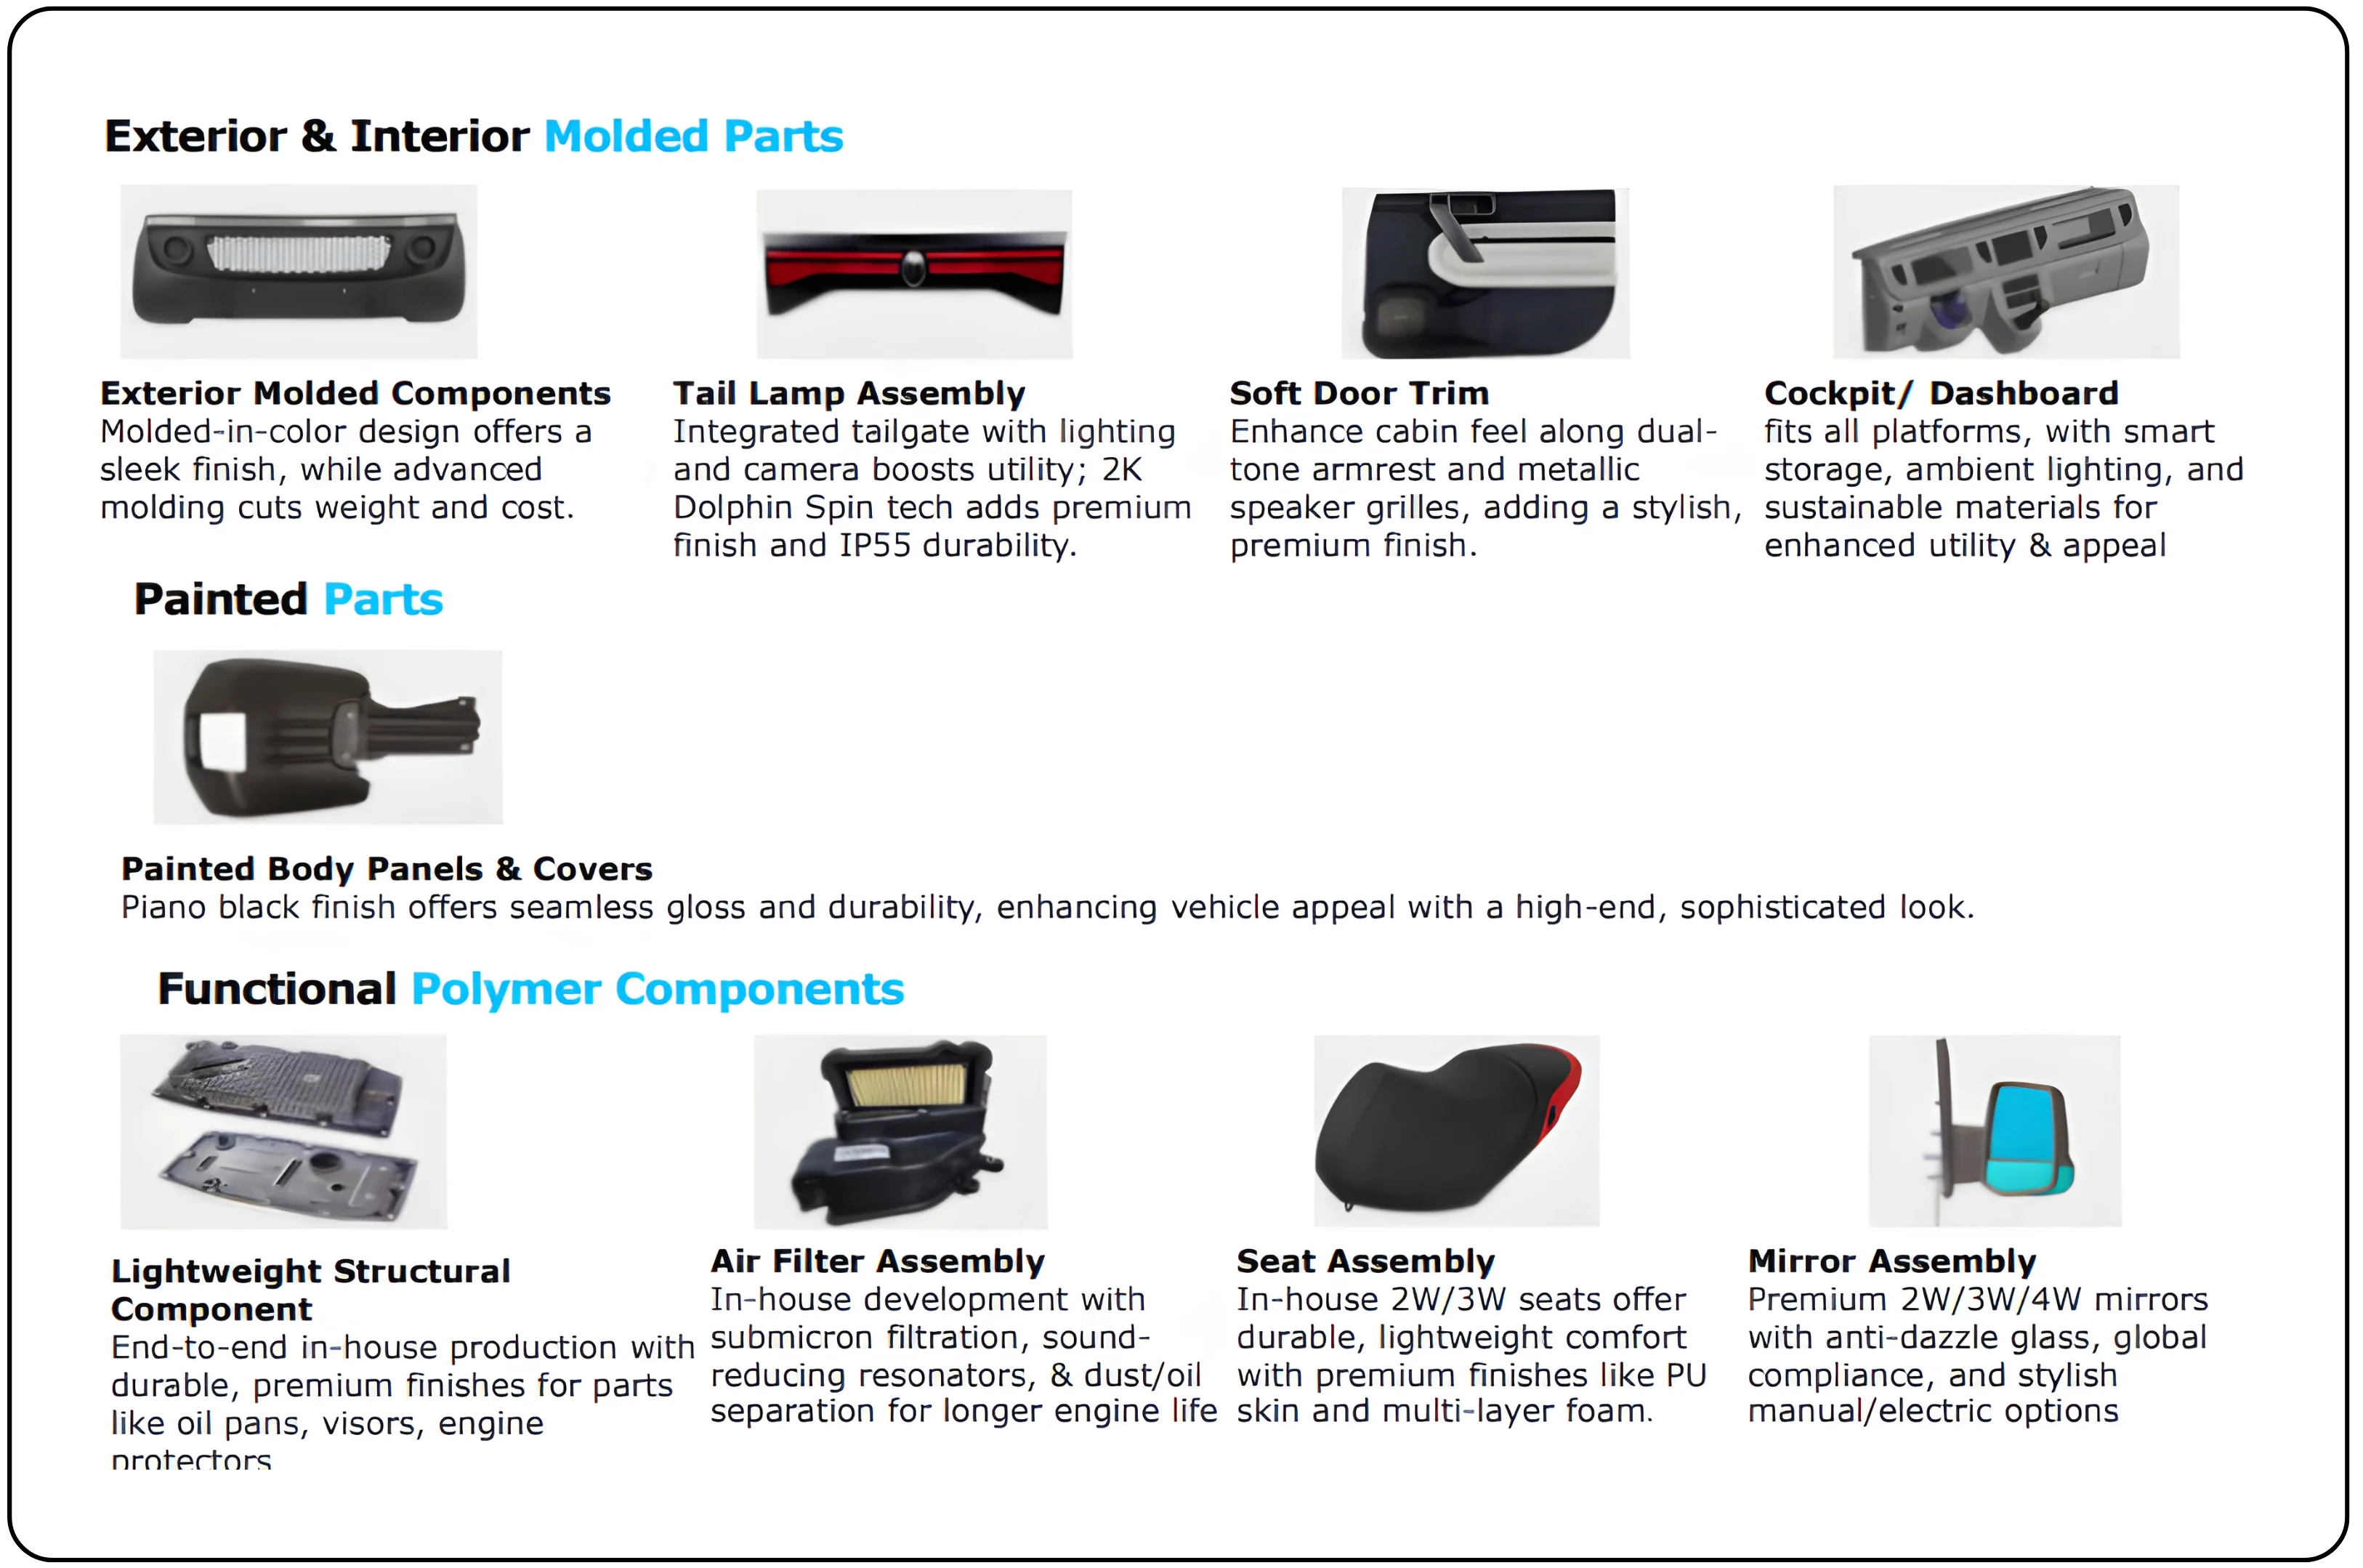
- Polymers: Supplies molded plastic components for automotive interiors and exteriors, designed for lightweighting and cost efficiency.
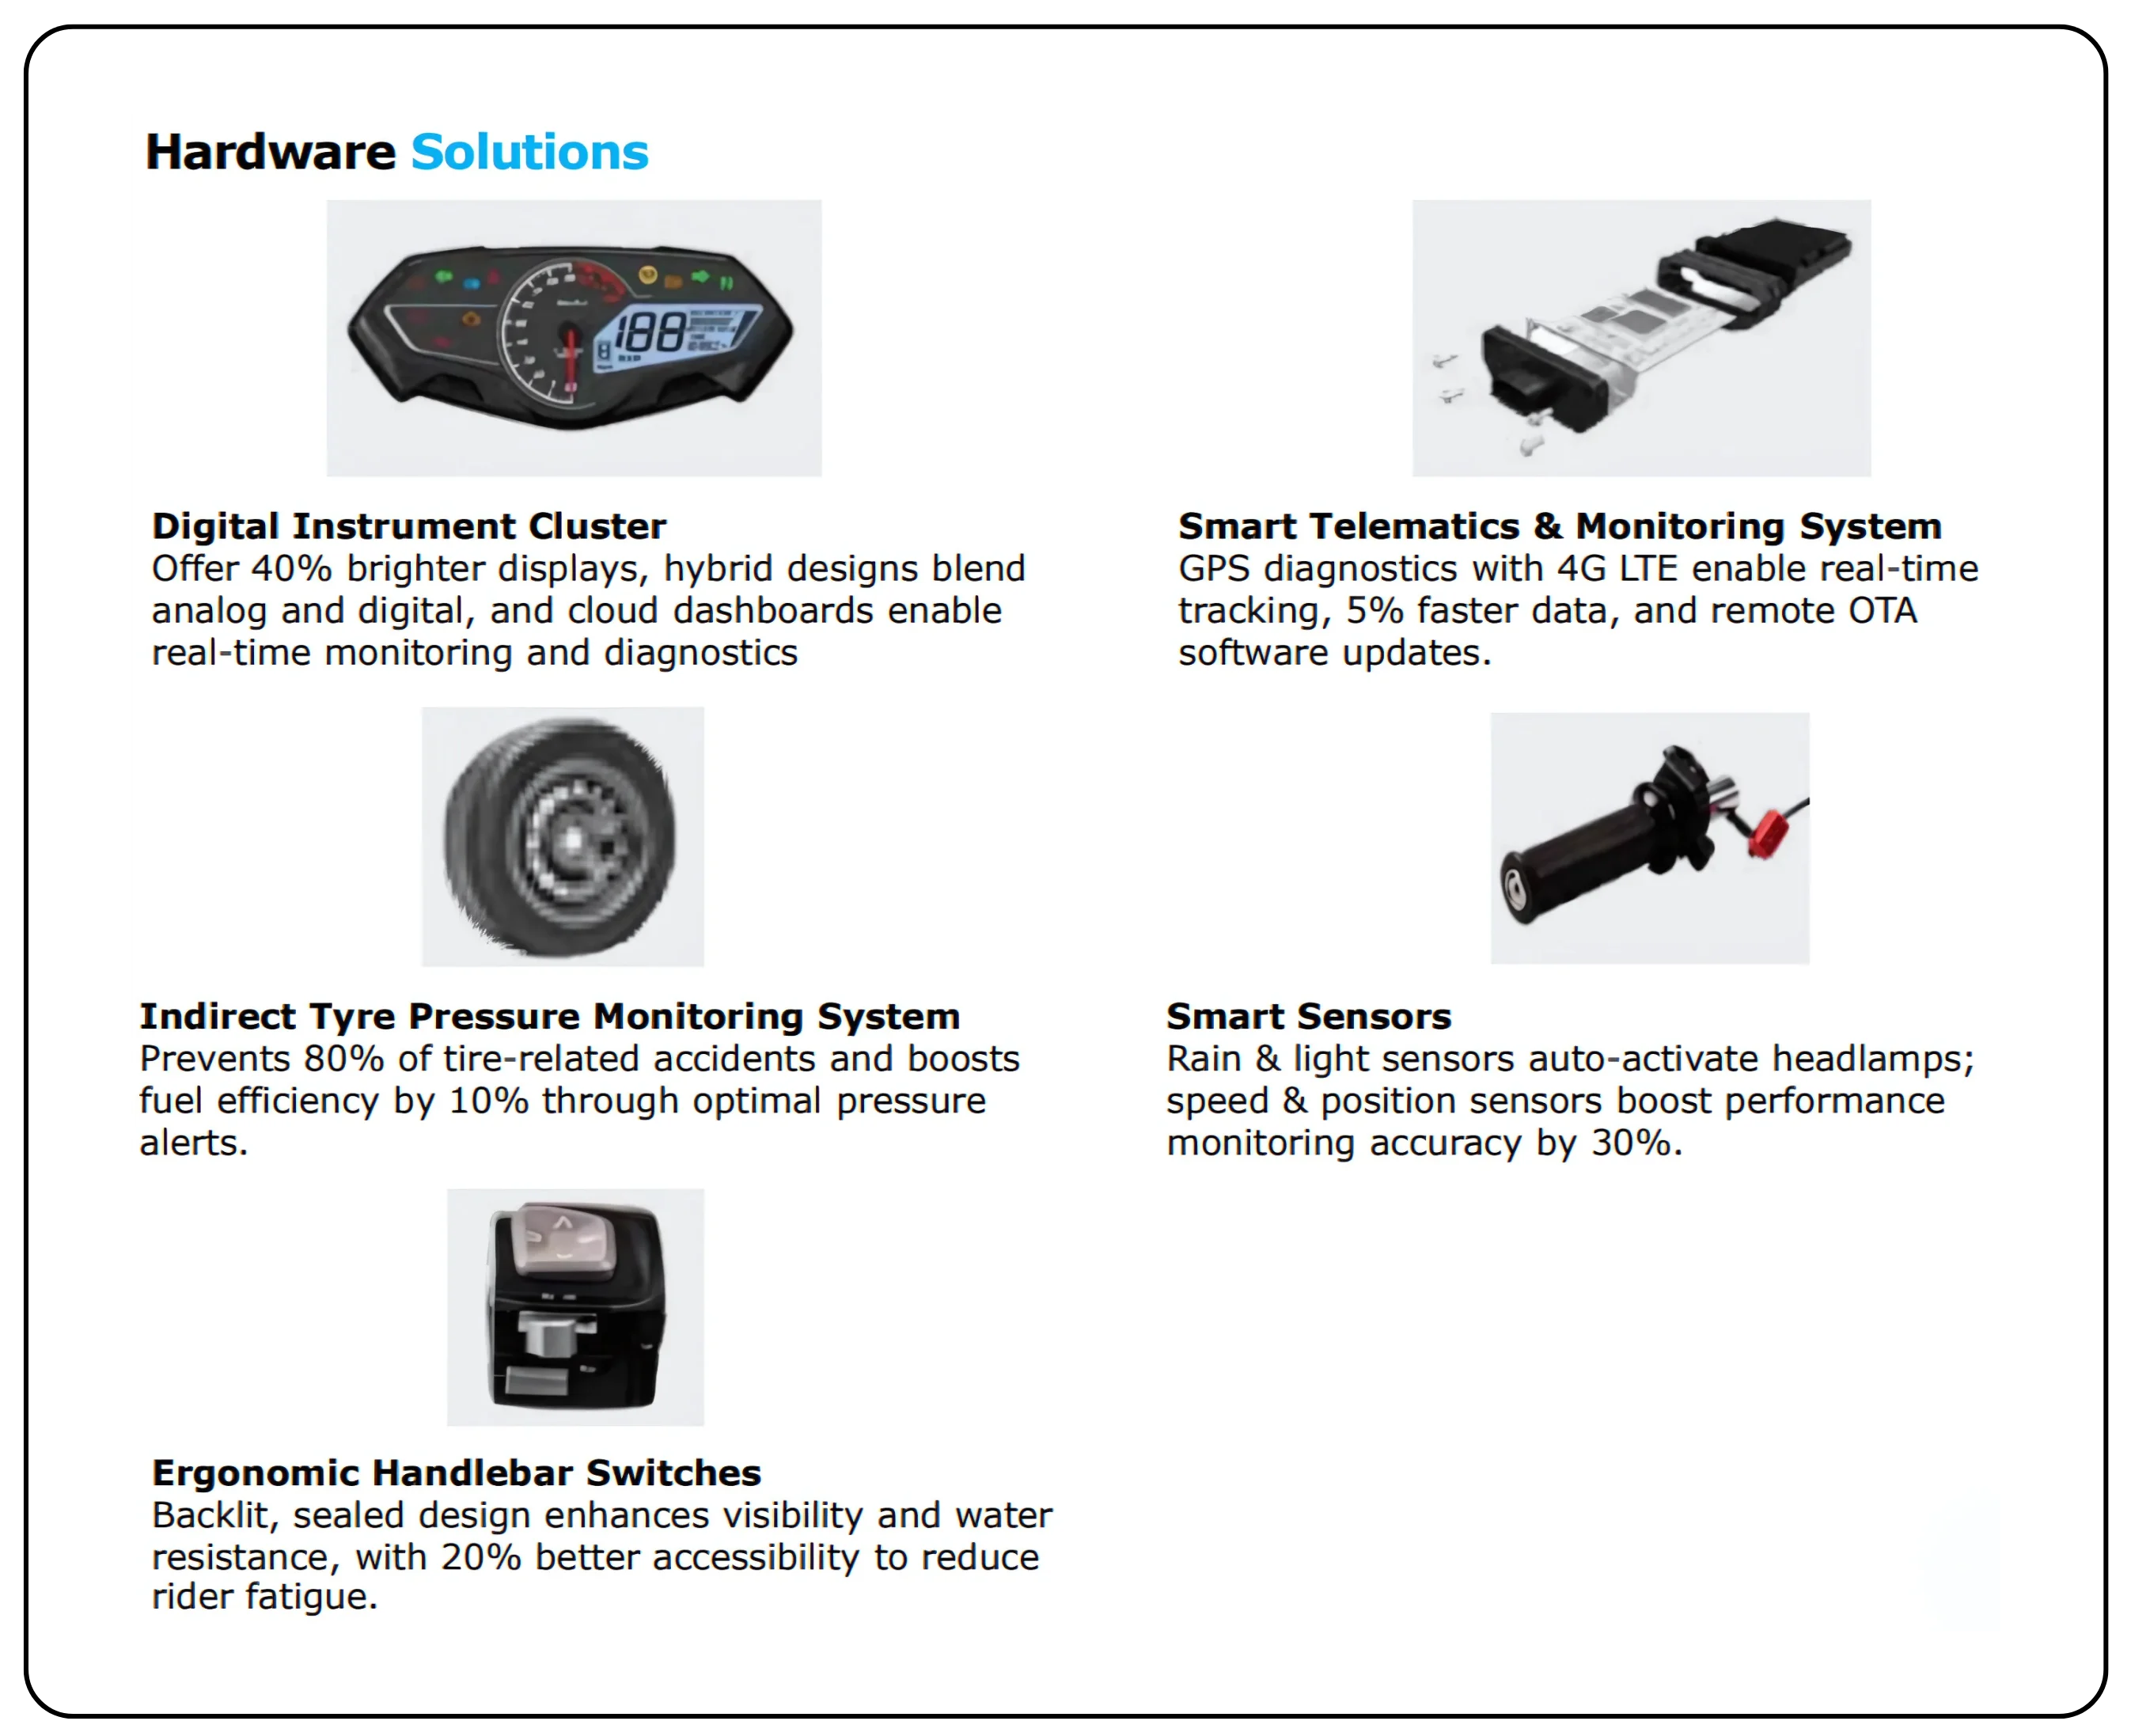
- Electrical & Electronics: Includes instrument clusters, controllers, wiring harnesses, and electronic modules with growing demand from EV platforms.
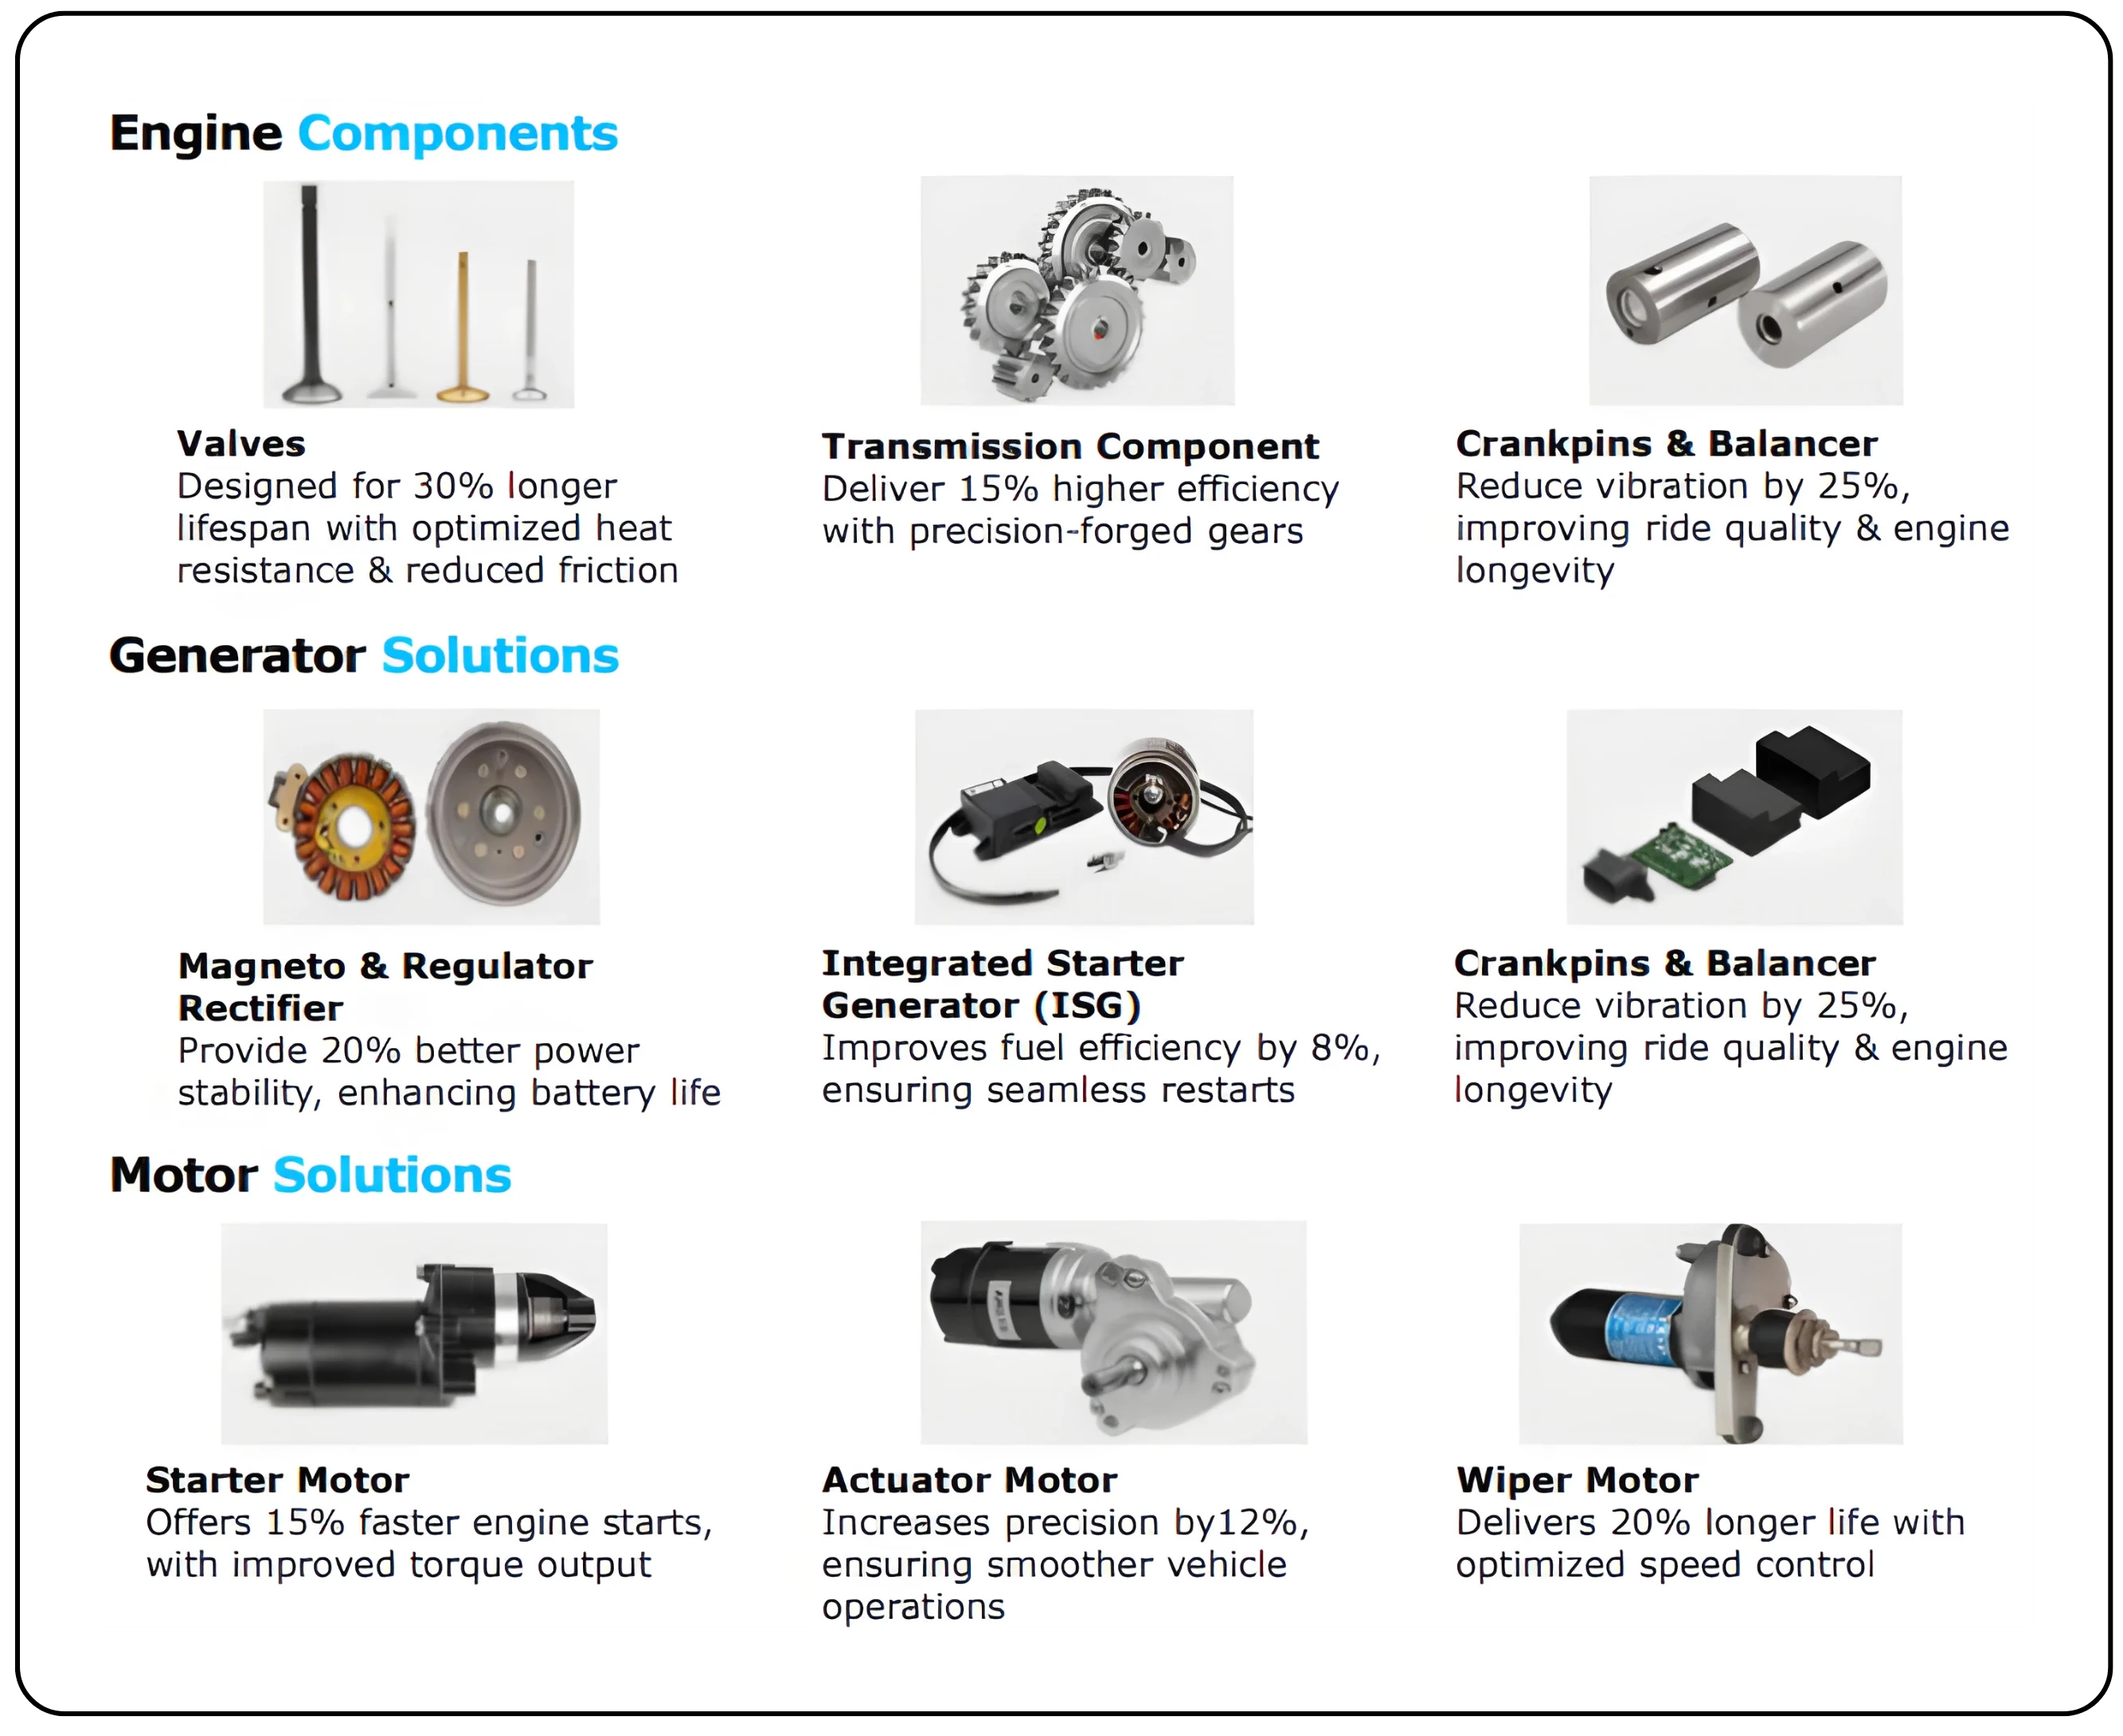
- Metallic Components: Manufactures forgings and machined parts for engine and transmission applications.
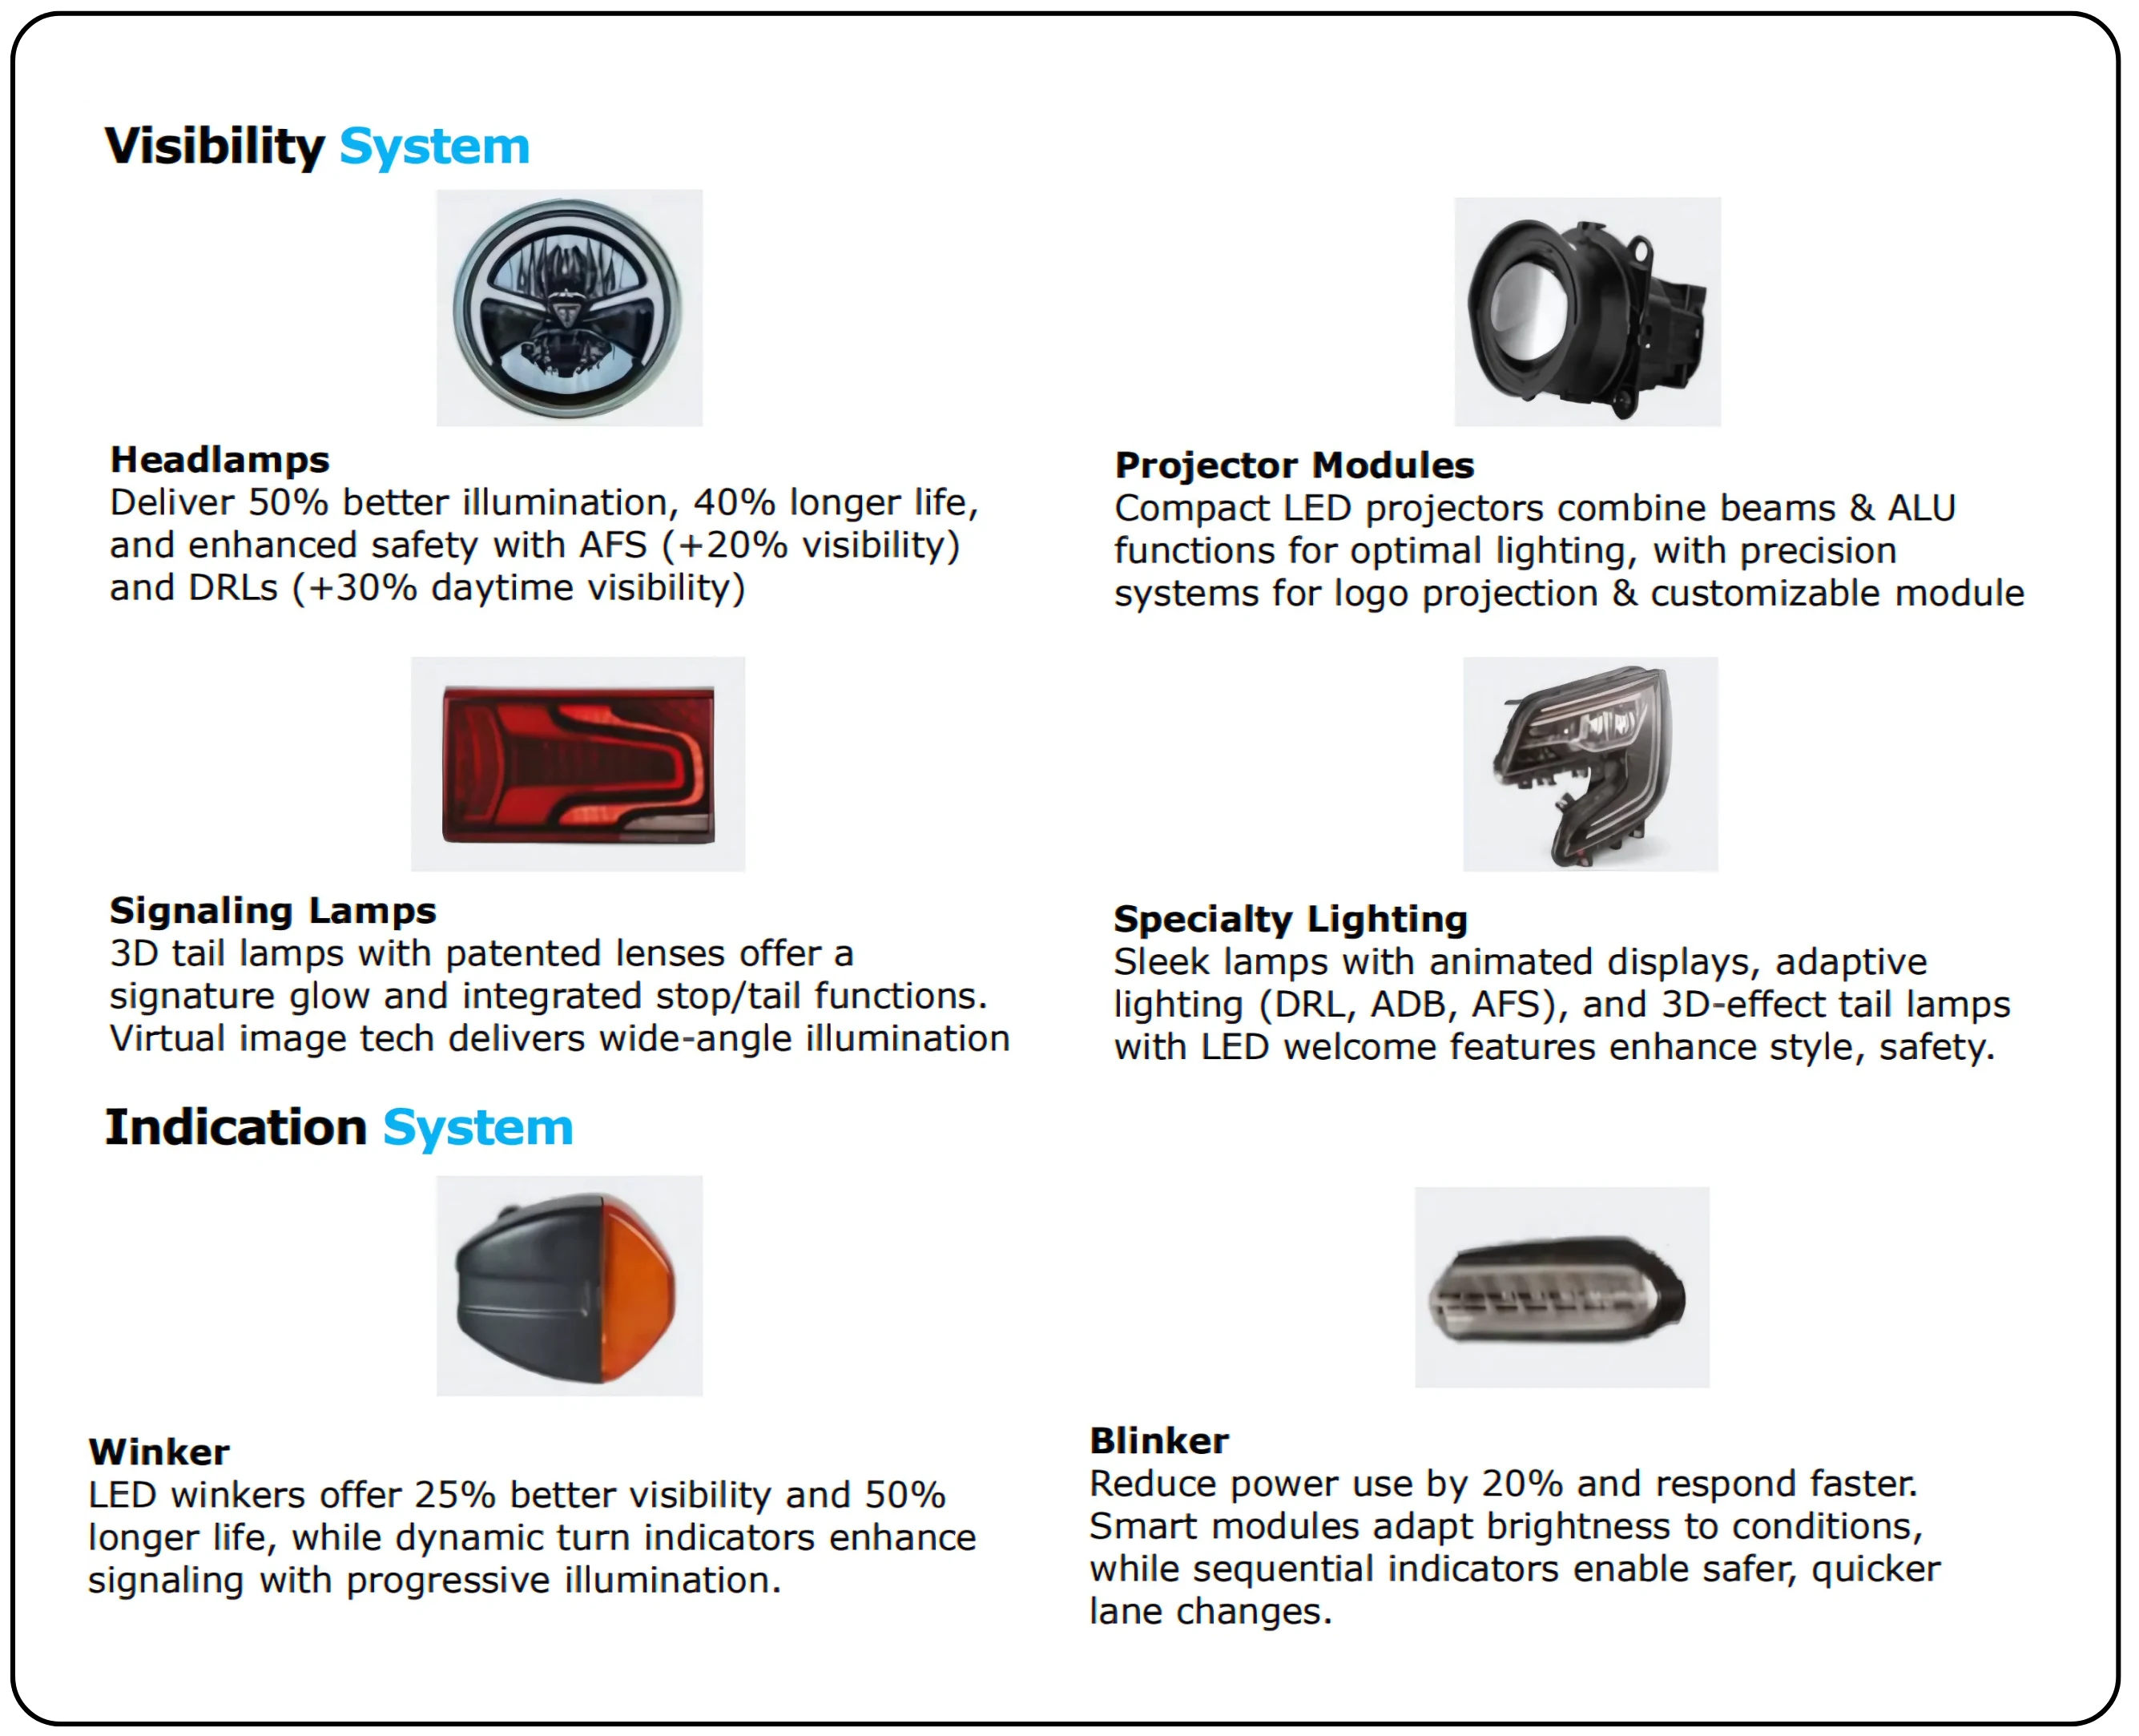
- Lighting for Two-Wheelers and Three-Wheelers: Provides advanced lighting systems, a critical area for premiumization and safety compliance.
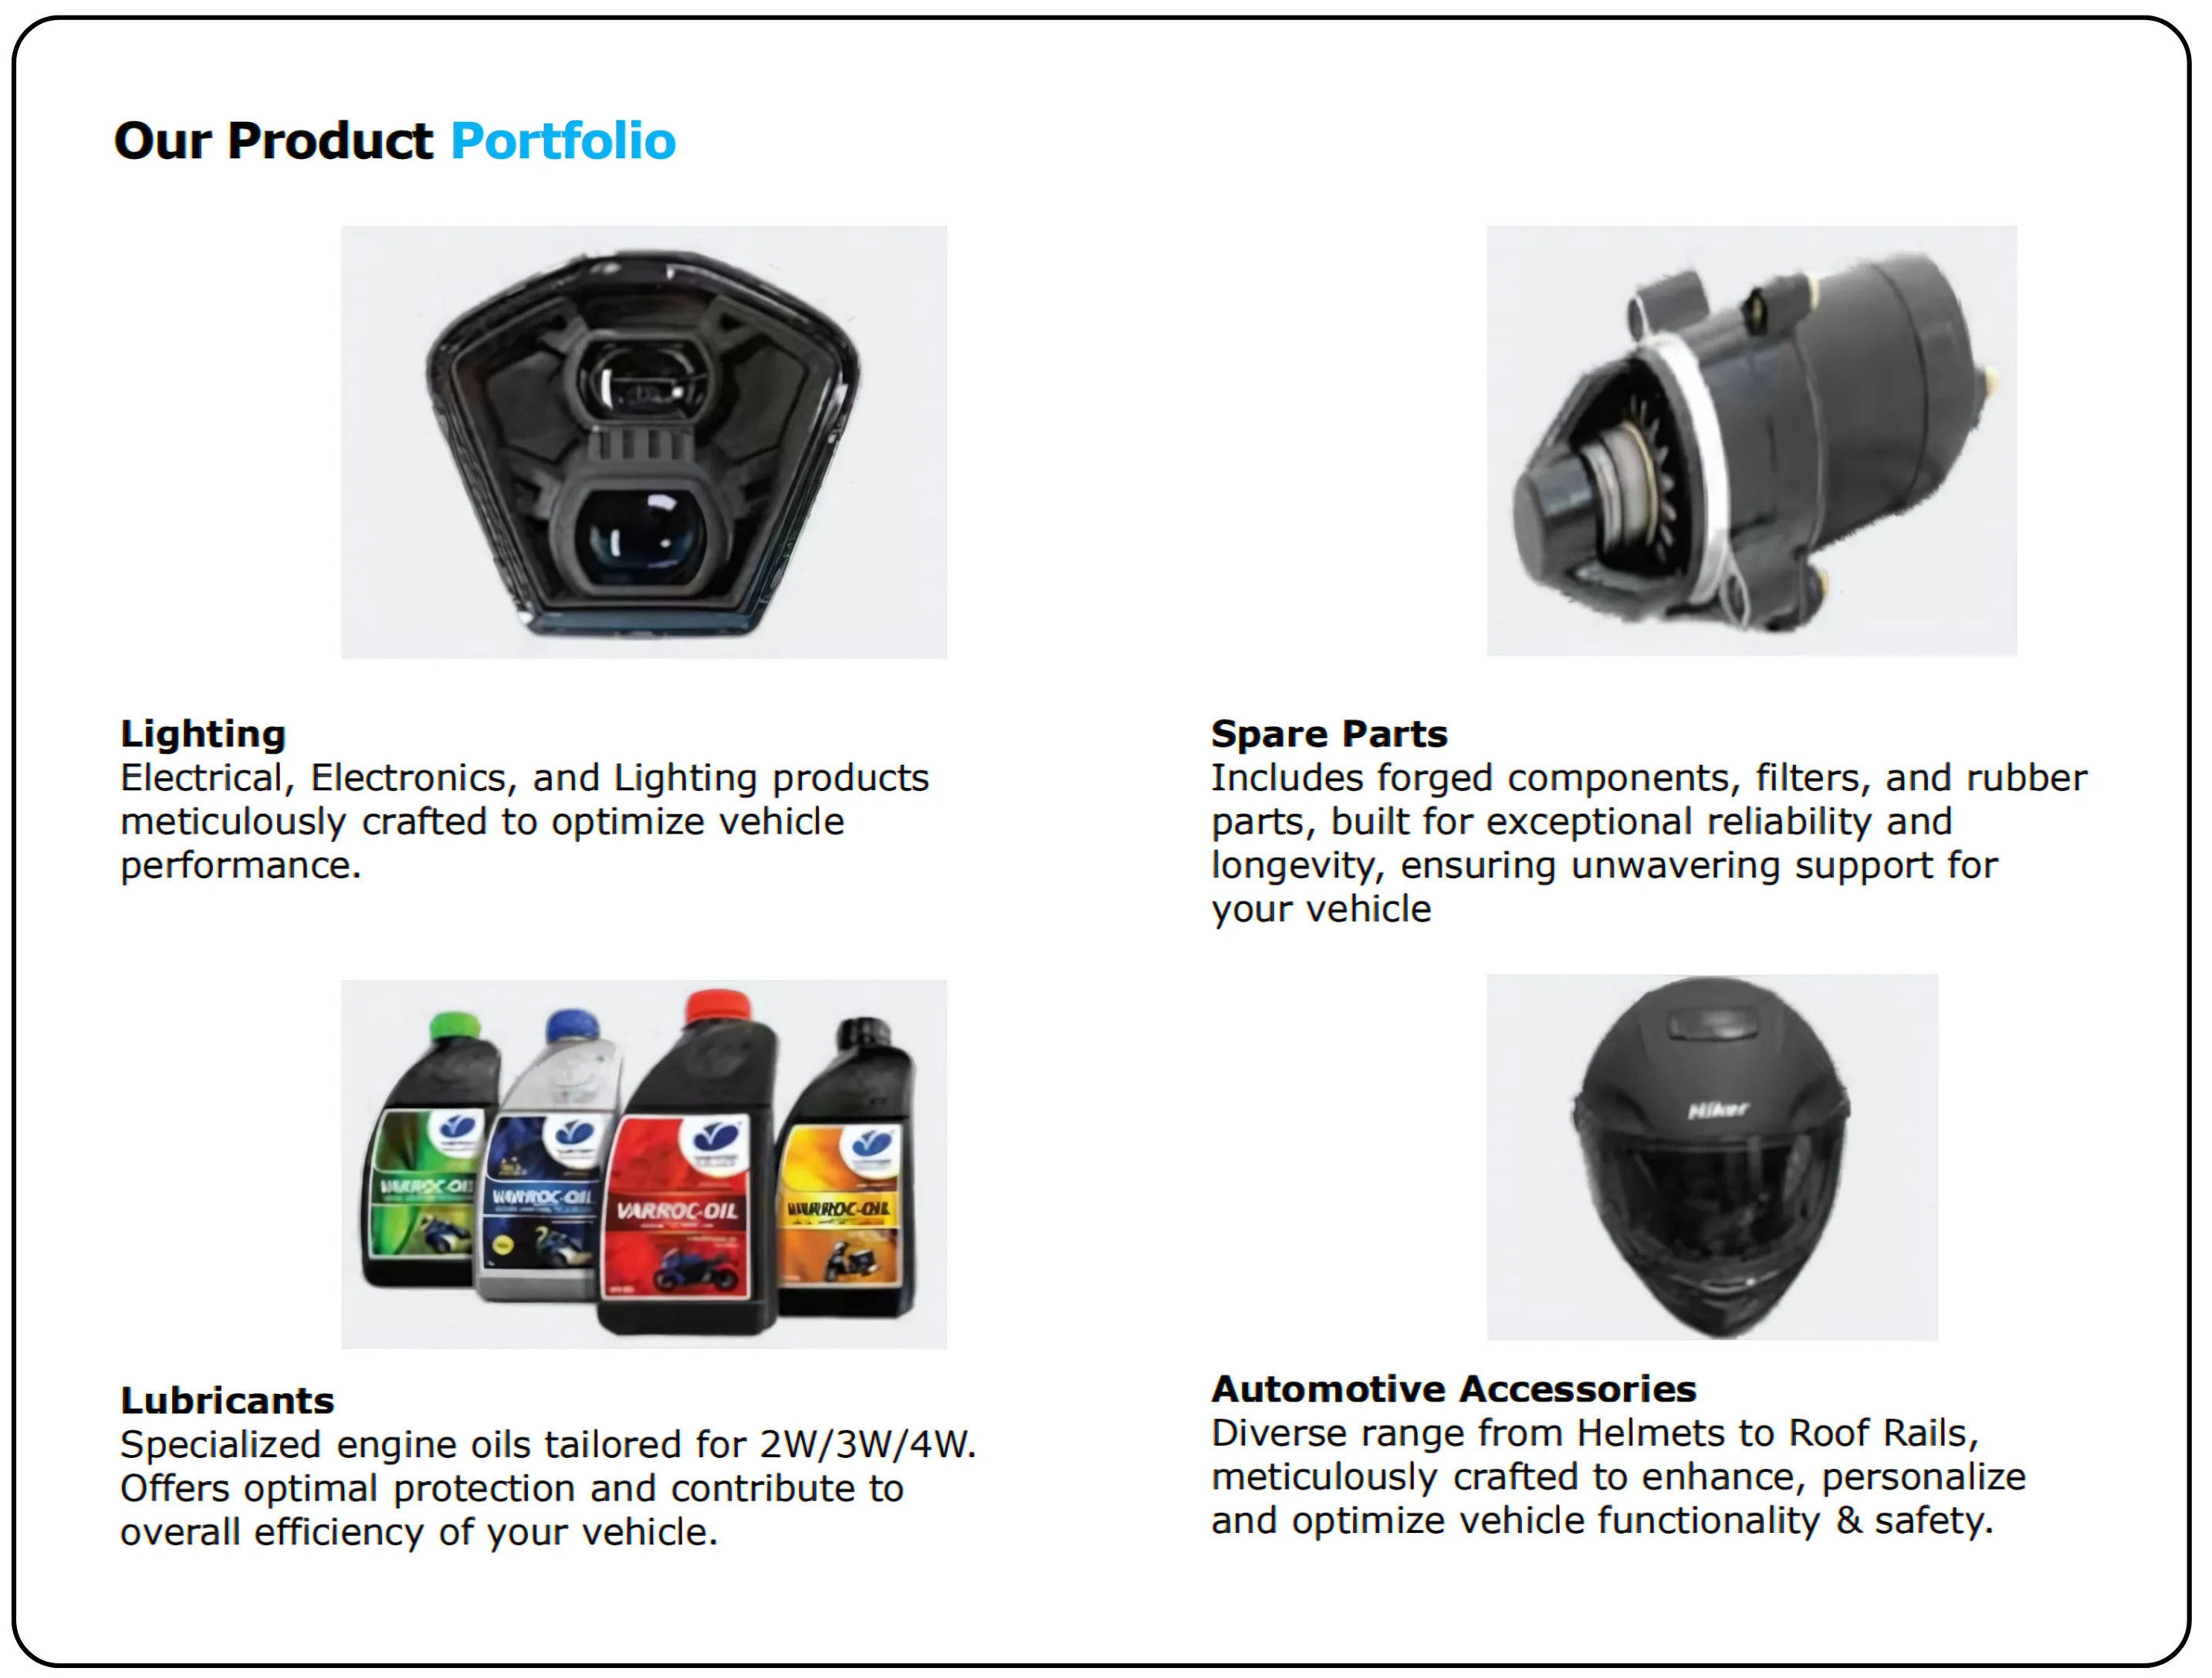
- Aftermarket Segment: Varroc’s aftermarket business offers a comprehensive range of lighting products, spare parts, lubricants, and automotive accessories. Supported by an extensive distribution network spanning 30+ countries, 310 cities, and 720 distributors across India.
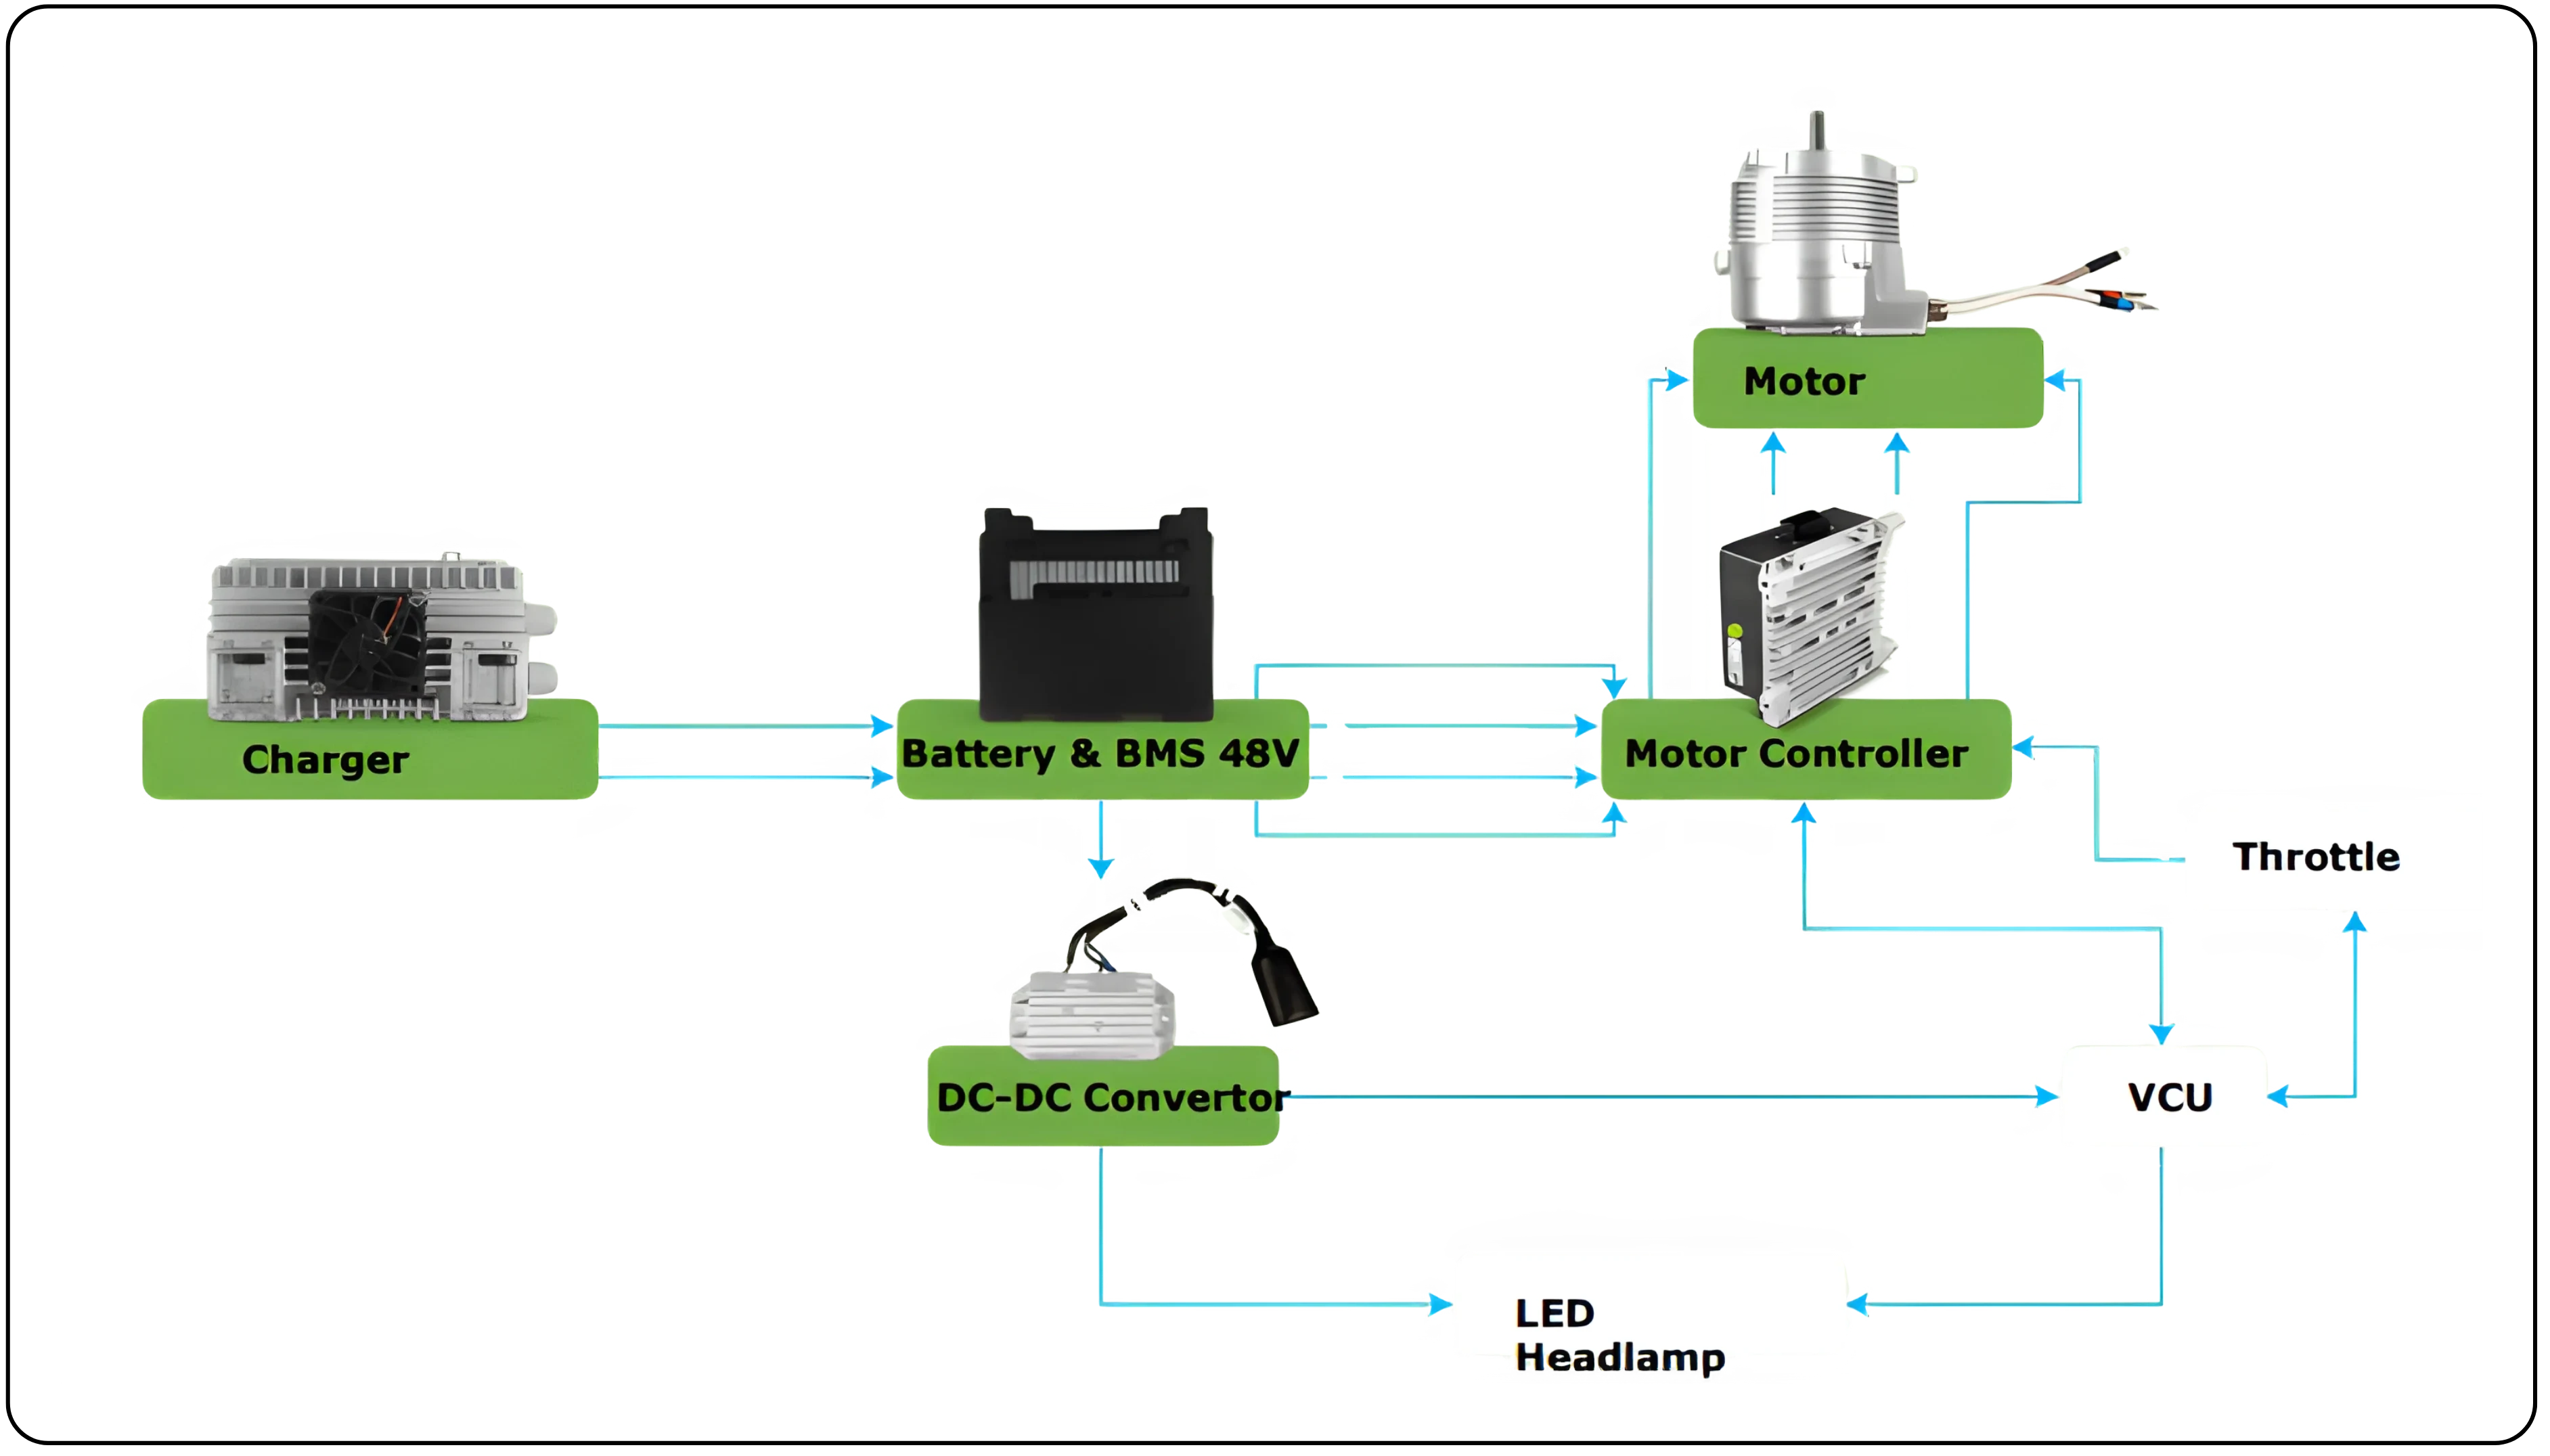
- E-Mobility Segment: The segment develops key components such as chargers, battery management systems, DC-DC converters, motor controllers, and LED headlamps. It also offers advanced testing capabilities through its Motor Dyno Testing System, ensuring reliability and performance for EV platforms.
The company’s revenue is largely India-centric, with exports contributing selectively. While Bajaj Auto remains a major customer, Varroc has been successful in securing new orders from other OEMs, gradually reducing concentration risk.
Varroc’s revenue breakup
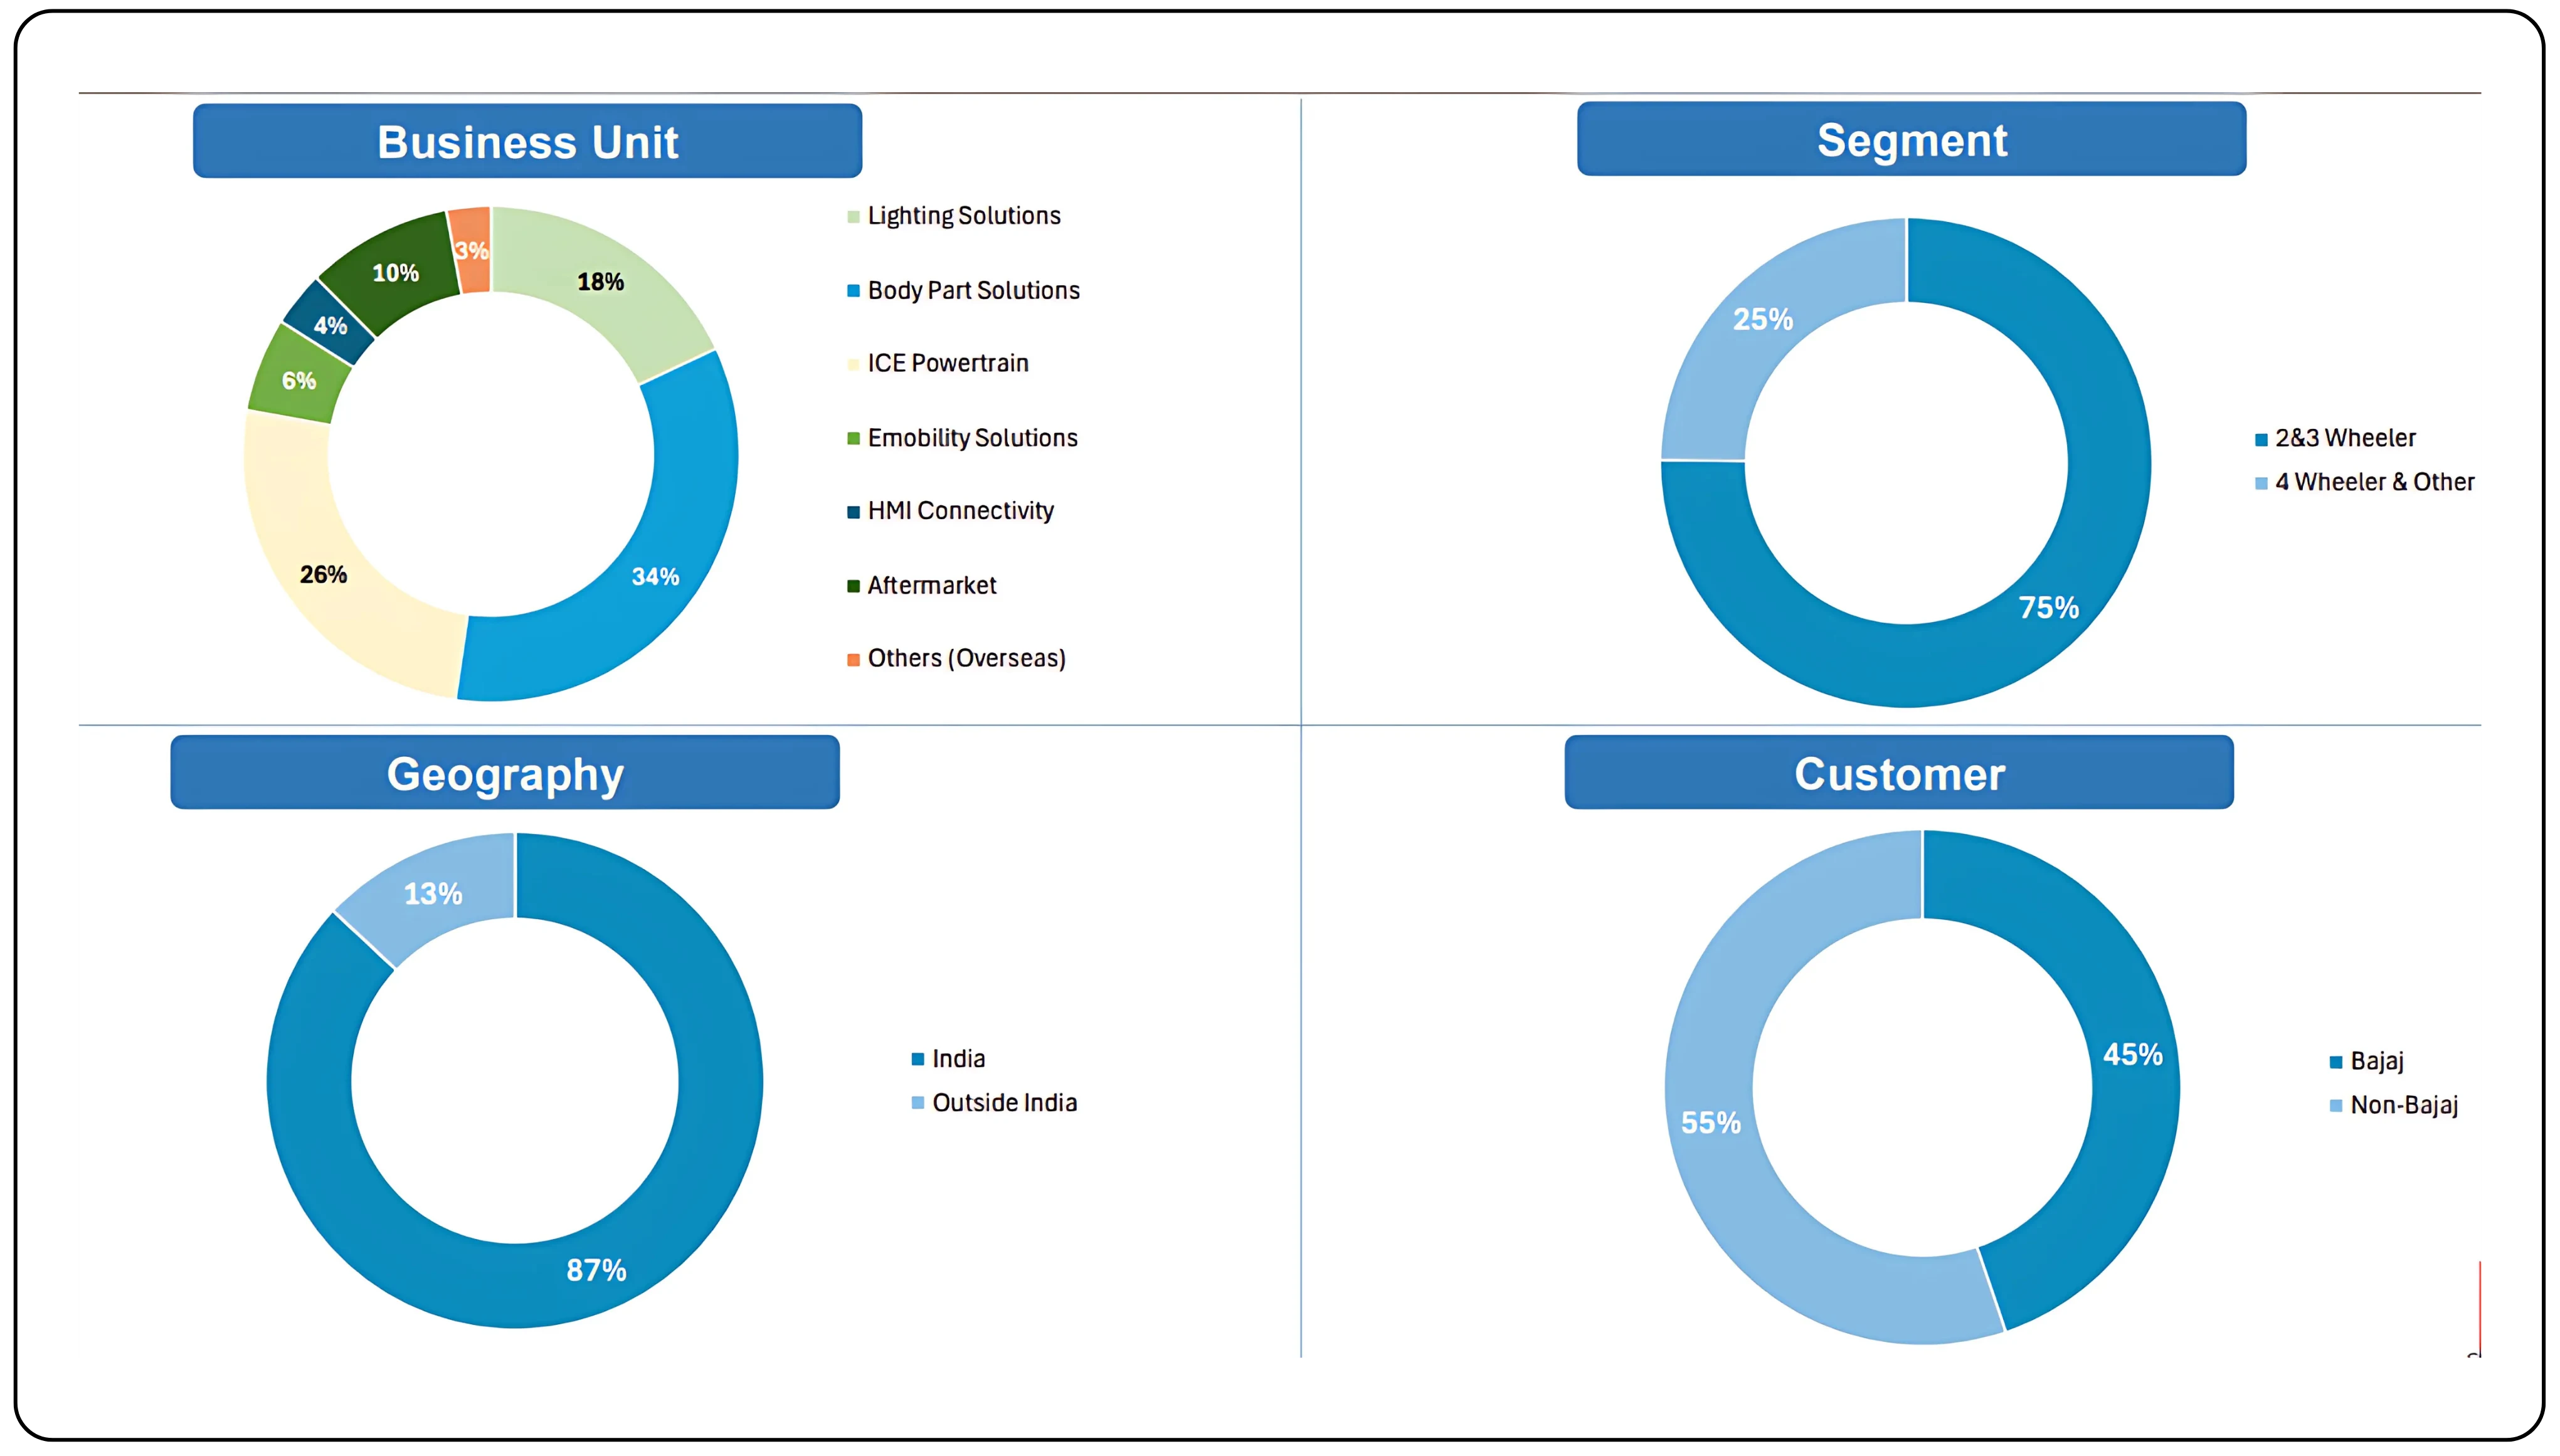
1. Business Unit (Product Mix)
- Lighting Solutions – 34% (largest share and main revenue driver)
- Body Part Solutions – 26%
- ICE Powertrain – 6%
- Emobility Solutions – 4%
- HMI Connectivity – 1%
- Aftermarket – 10%
- Others (Overseas) – 18%
2. Segment (Vehicle Type)
- 2 & 3 Wheelers – 75% (major focus area)
- 4 Wheelers & Others – 25%
3. Geography
- India – 87% (core market)
- Outside India – 13%
The Indian auto component industry landscape
The Indian auto component industry is undergoing a structural shift driven by electrification, emission compliance, premiumization, and localization. With the government pushing for 30% EV penetration by 2030 and increased adoption of advanced electronics in two-wheelers and three-wheelers, suppliers with strong capabilities in EV-related components, electronic clusters, and lightweight polymers are poised to benefit. Additionally, rising regulatory standards, such as BS-VI and future safety norms, further increase the electronic and software content per vehicle, expanding the addressable market for players like Varroc.
Global trends are also creating significant opportunities. The growing demand for EVs and hybrid vehicles in export markets, along with India’s cost advantage in component manufacturing, is encouraging multinational OEMs to source more from India. However, the industry remains cyclical and exposed to commodity price volatility, competitive pricing, and working capital challenges.
Don’t miss our deep dive on GE Vernova’s fundamentals
Analyzing Varroc Engineering’s financial performance
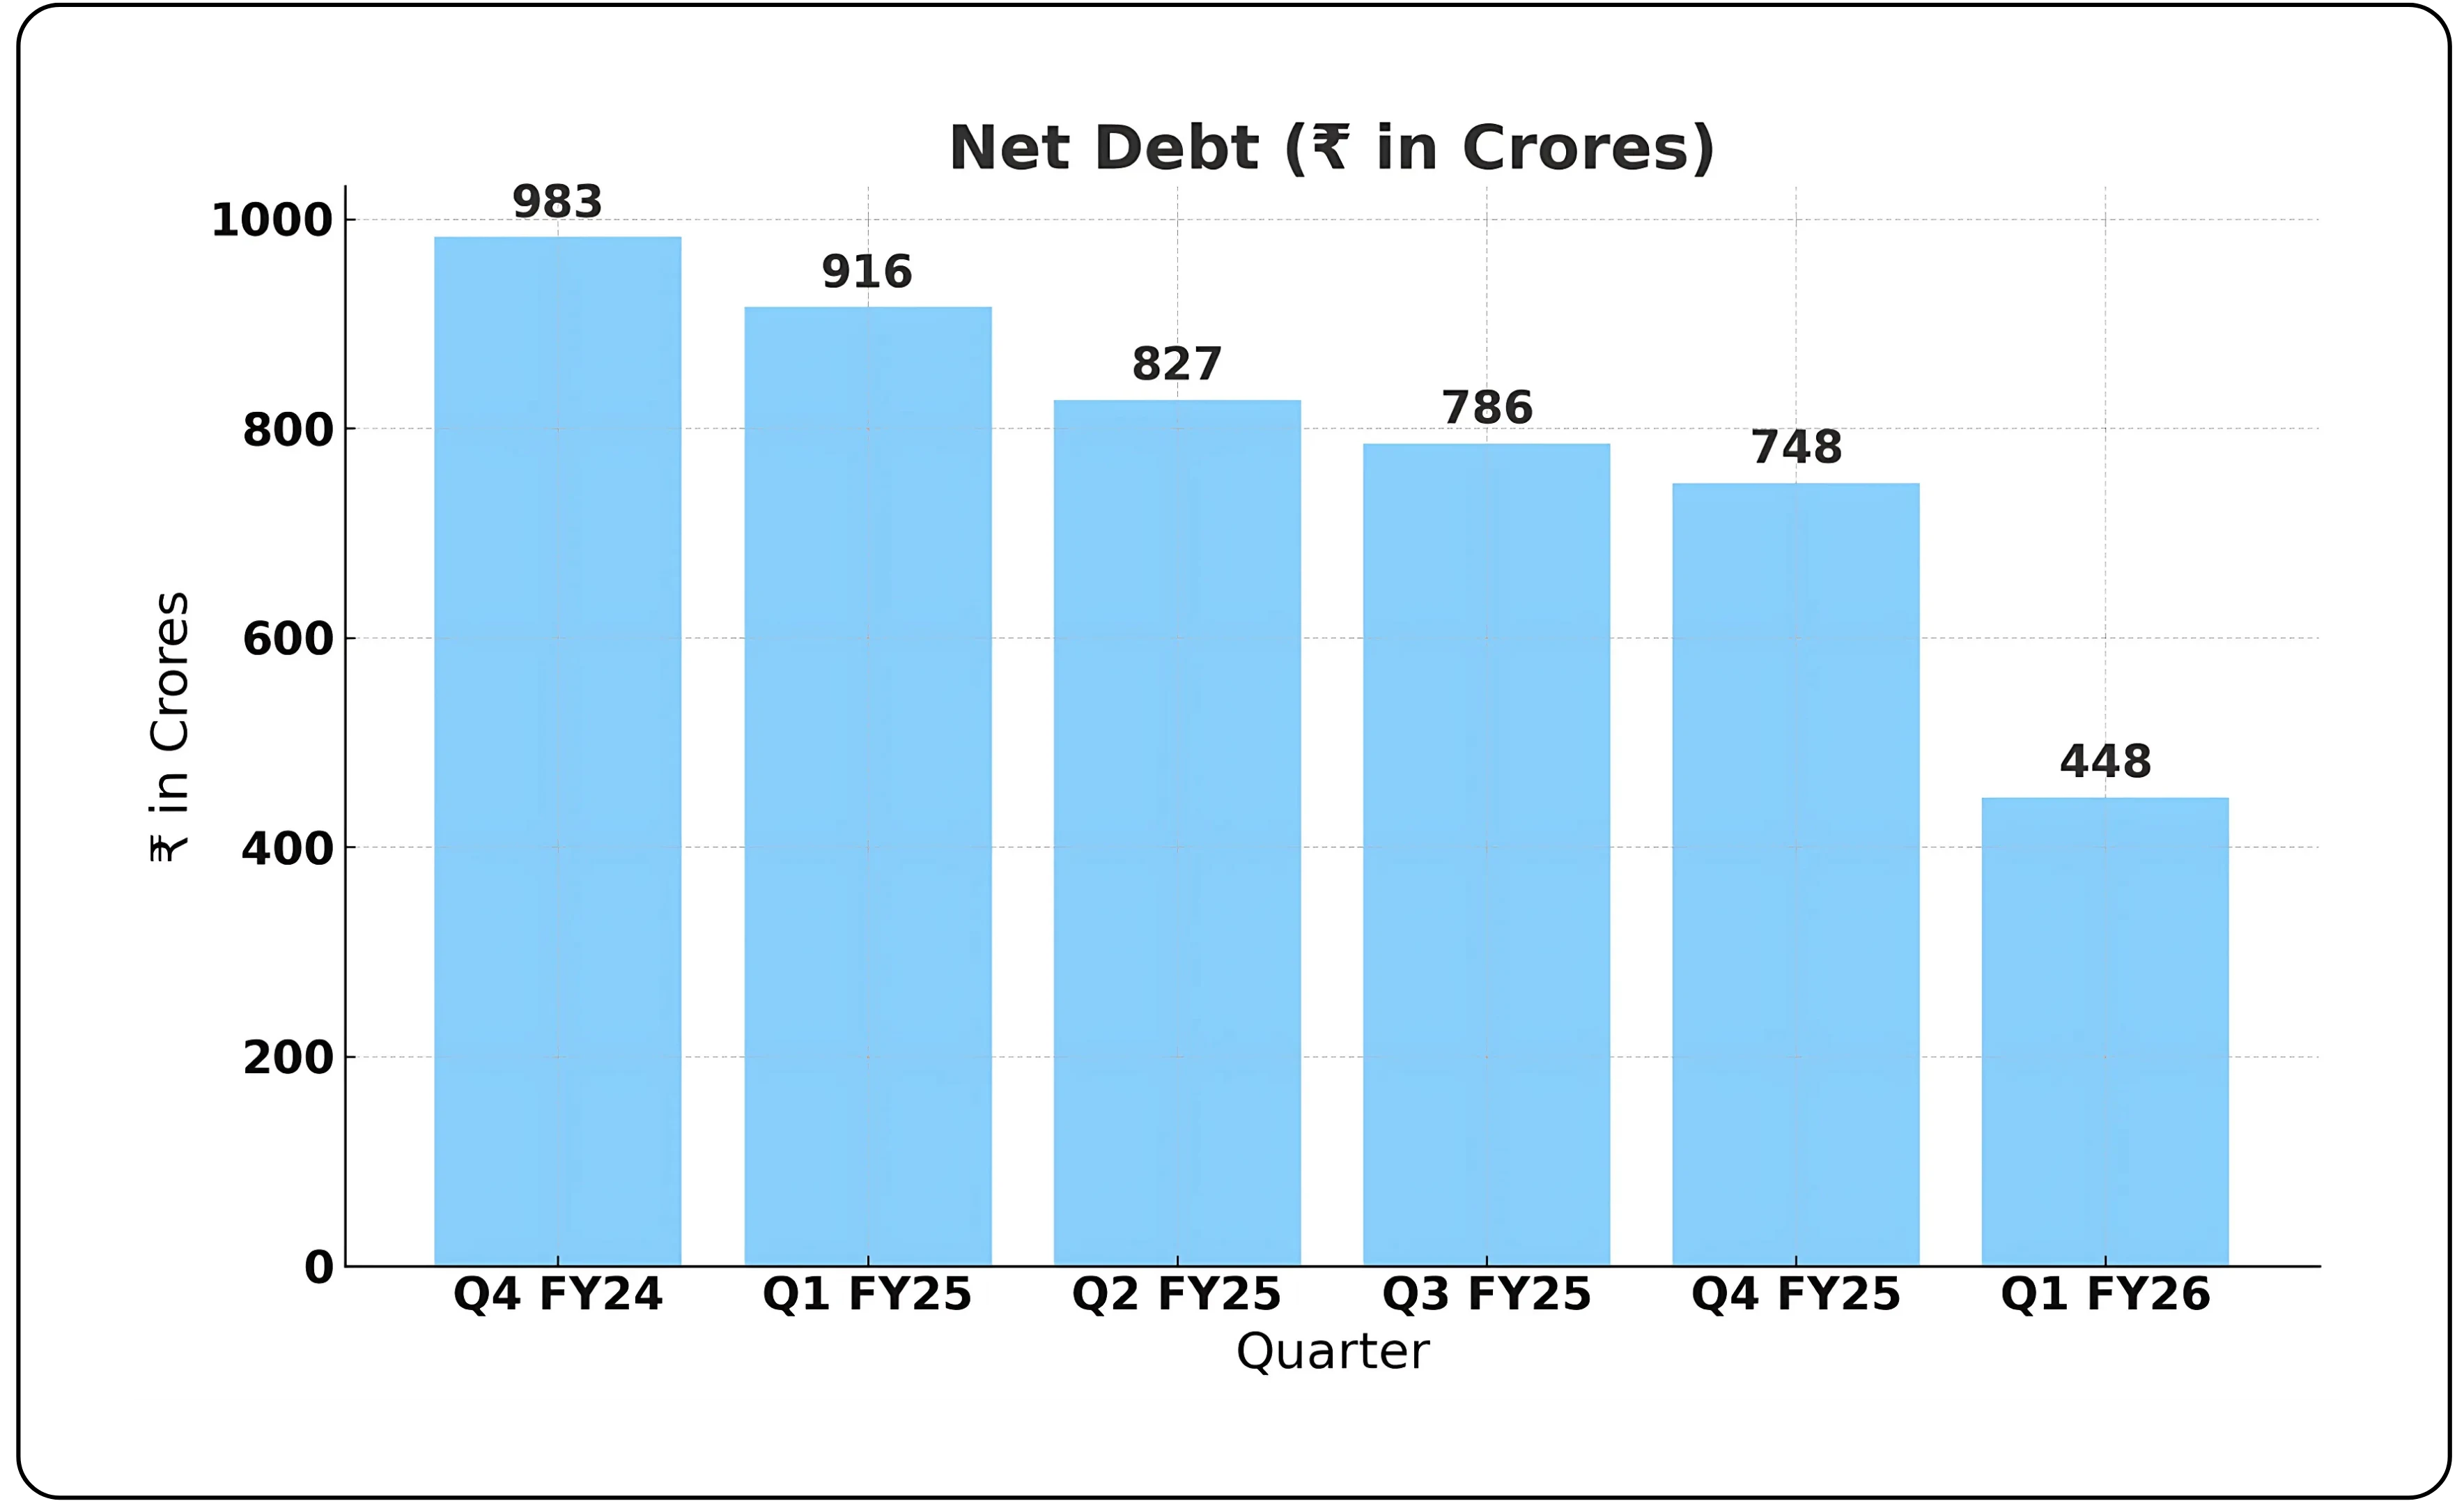
Varroc reported consolidated revenue of around ₹8,170 crore in FY25, up 8% year-on-year. The company’s operating performance improved significantly, with EBITDA margin reaching 9.5% and PBT before exceptional items at 3.8% of revenue. Net debt declined to ₹748 crore at the end of FY25, aided by strong free cash flow generation of ₹312 crore. The company also completed the sale of its stake in the China JV in May 2025, further strengthening the balance sheet.
Q1 FY26 continued the positive trend, with revenue of ₹2,027 crore, EBITDA margin at 9.5%, and PBT margin at 4.1%. Net debt fell further to ₹448 crore.
Importantly, the company secured new lifetime order wins with an annualized peak revenue potential of ₹290 crore in the quarter, over 55% of which was linked to EV programs. The order book provides strong revenue visibility and underscores the company’s focus on high-growth segments.
5-year financial trend
| Year | Sales (Cr) | OPM % | Net Profit (Cr) |
|---|---|---|---|
| Mar-21 | 4036 | 8 | -629 |
| Mar-22 | 5484 | 6 | -1107 |
| Mar-23 | 6316 | 8 | -817 |
| Mar-24 | 6796 | 10 | 532 |
| Mar-25 | 7379 | 10 | 70 |
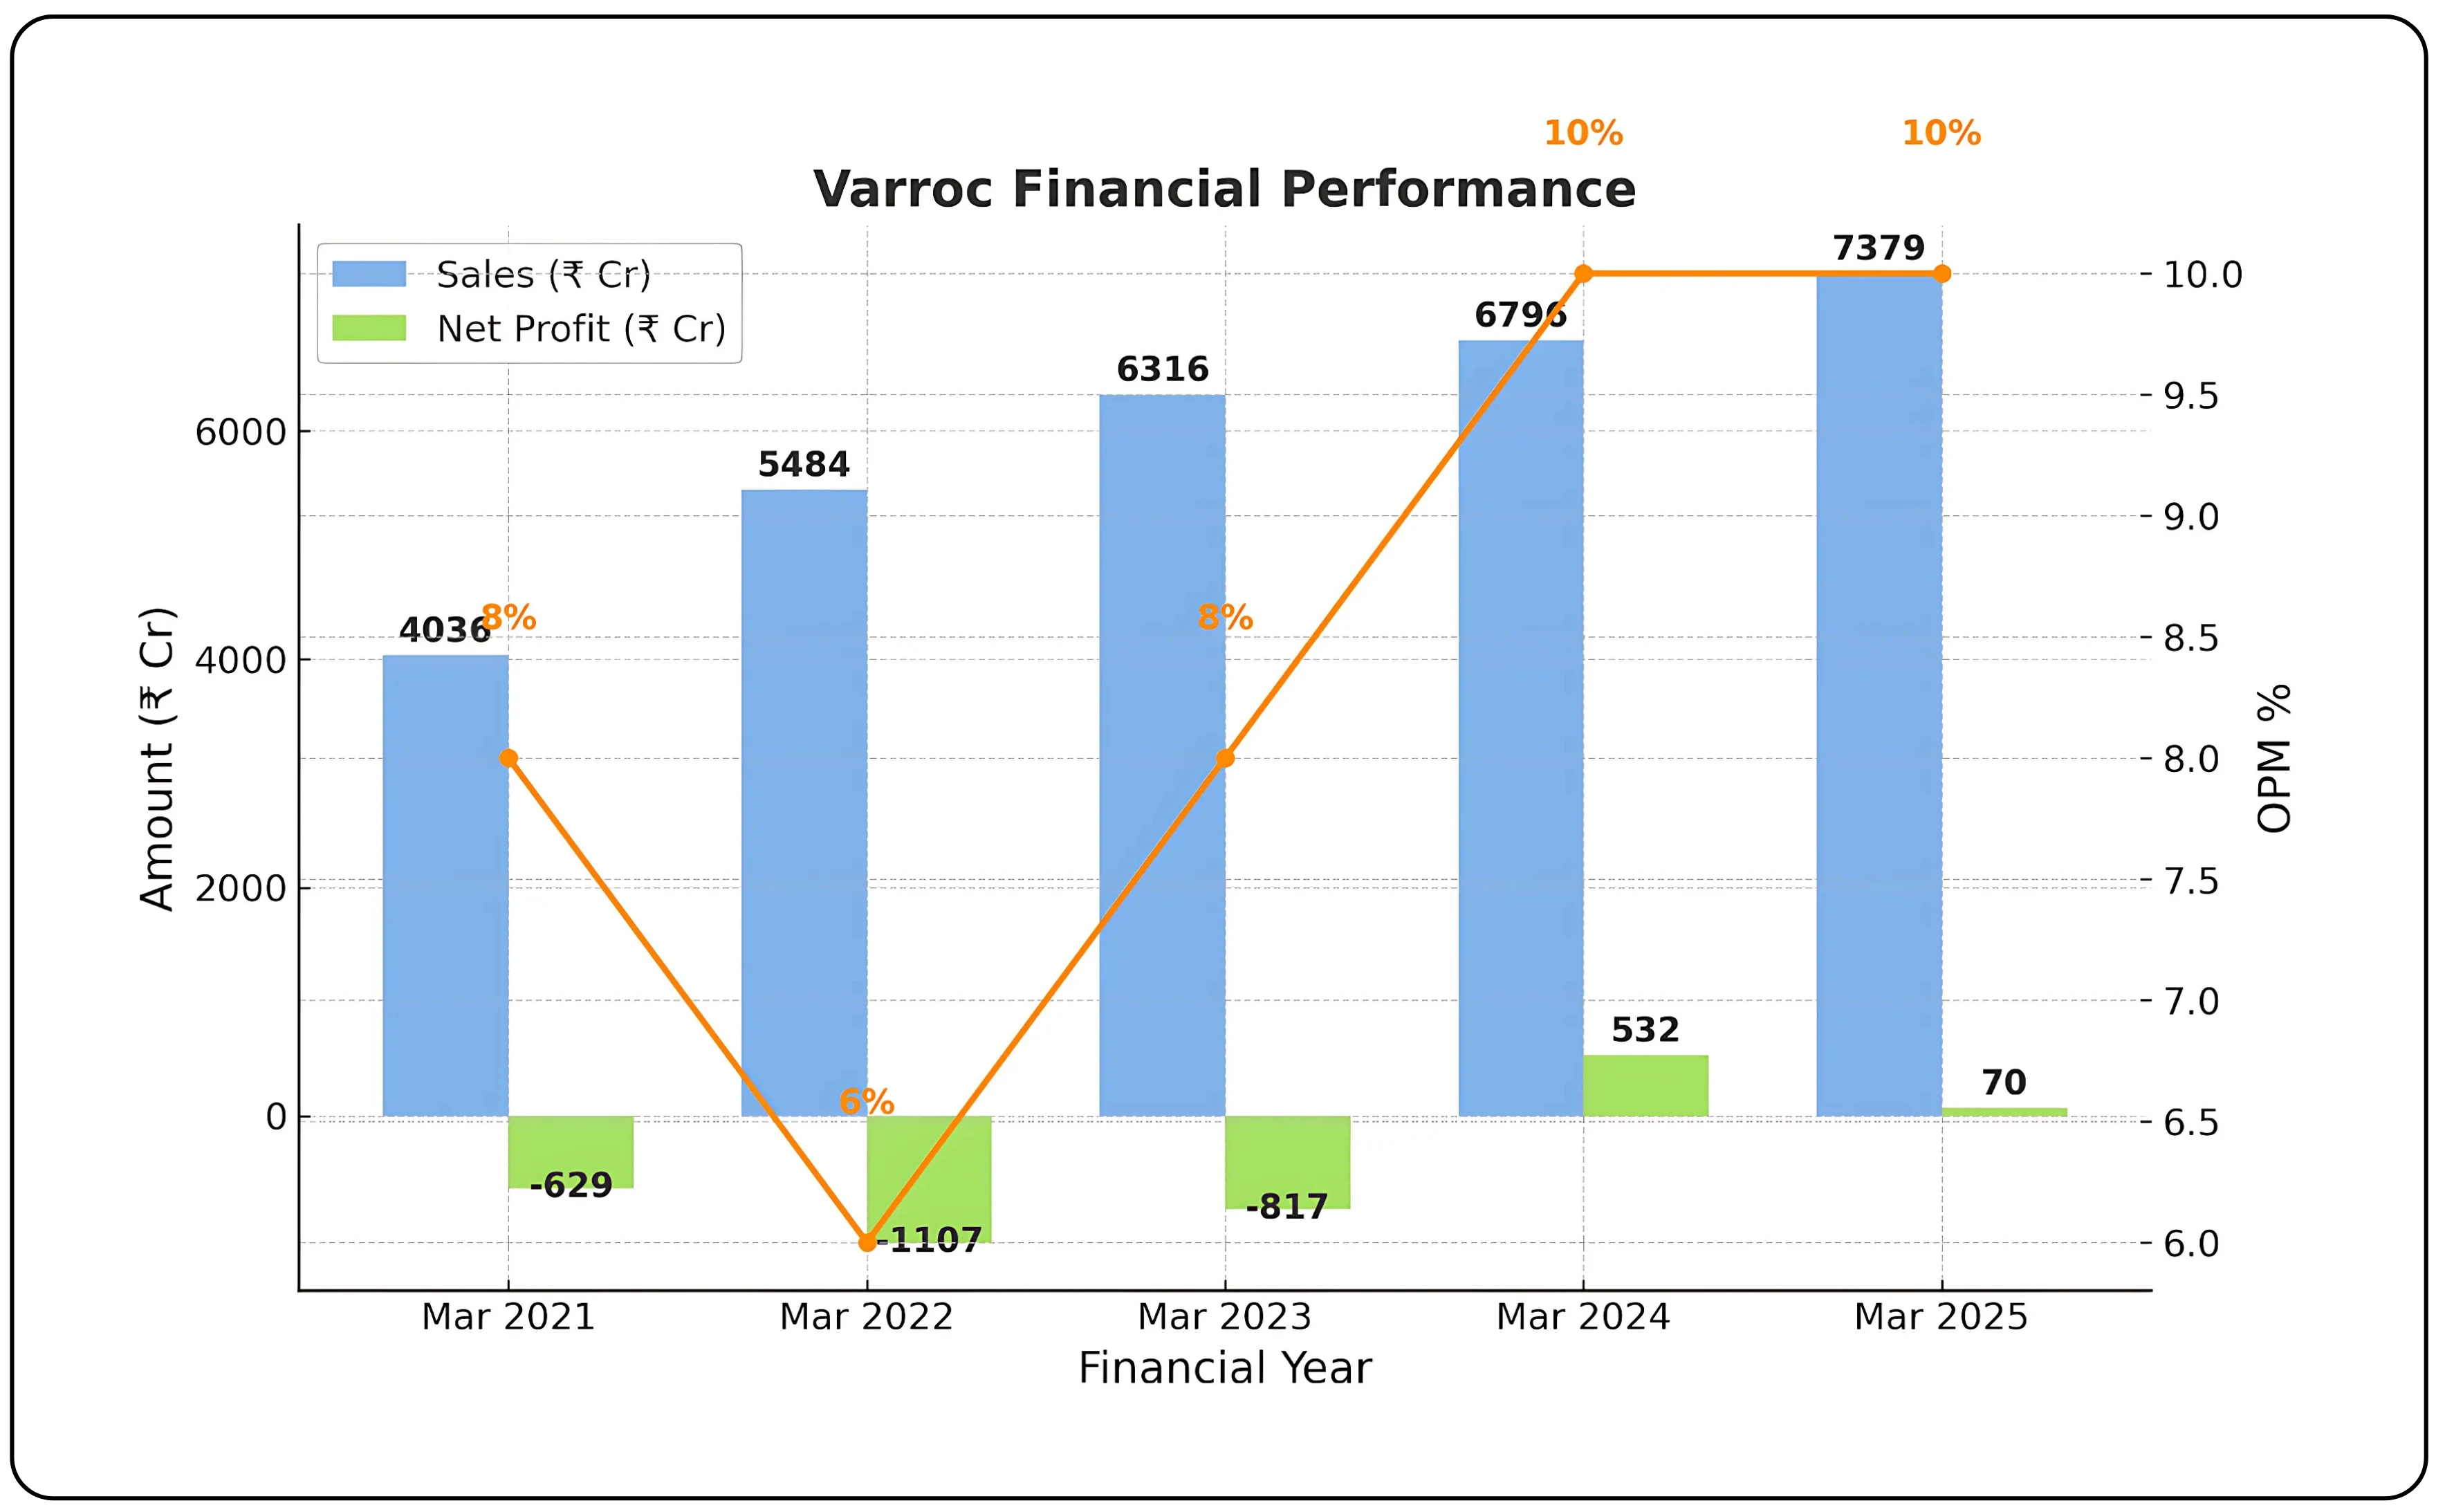
The bar graph illustrates Varroc Engineering’s financial performance from FY21 to FY25. Sales have grown steadily from ₹4,036 crore in FY21 to ₹7,379 crore in FY25. Net profit, which was negative for three consecutive years, turned positive in FY24 at ₹532 crore but moderated to ₹70 crore in FY25. The overlaid line shows operating profit margin (OPM), which improved from 8% in FY21 to 10% in FY24 and FY25, highlighting better cost efficiency and operational control.
Strategic initiatives
Varroc has taken multiple steps to enhance operational efficiency and profitability. The merger of Varroc Polymers with Varroc Engineering simplified the corporate structure, while the exit from the China JV improved capital allocation and reduced complexity. The company is also investing in automation, renewable energy sourcing, and digital manufacturing to boost productivity and ESG compliance. Renewable energy now accounts for 31% of power consumption and is expected to exceed 50% with the rollout of Phase-2 of the renewable energy project.
Key growth drivers and future outlook
The outlook for Varroc is supported by multiple structural drivers. EV adoption is expected to accelerate, and with over 10% of its revenue already coming from EV-related components, Varroc is well-positioned to benefit from this shift. The company is also targeting an increase in electronic content per vehicle through instrument clusters and controllers, which typically offer higher margins than traditional components.
Customer diversification remains a focus, with management actively working to reduce dependence on Bajaj Auto. The rising share of premium two-wheeler models and safety compliance norms are expected to further drive demand for advanced lighting systems and digital clusters. With sustained free cash flow generation, improving return ratios, and a disciplined approach to capex, Varroc aims to continue deleveraging while funding growth initiatives.
Peer comparison: Varroc vs. other auto component companies
| Metric | Varroc Engg | UNO Minda | Endurance Tech | Samvardhana Motherson |
|---|---|---|---|---|
| CMP (₹) | 613 | 1,288 | 3,043 | 98 |
| Market Cap (₹ Cr) | 9,371 | 74,194 | 42,802 | 1,03,391 |
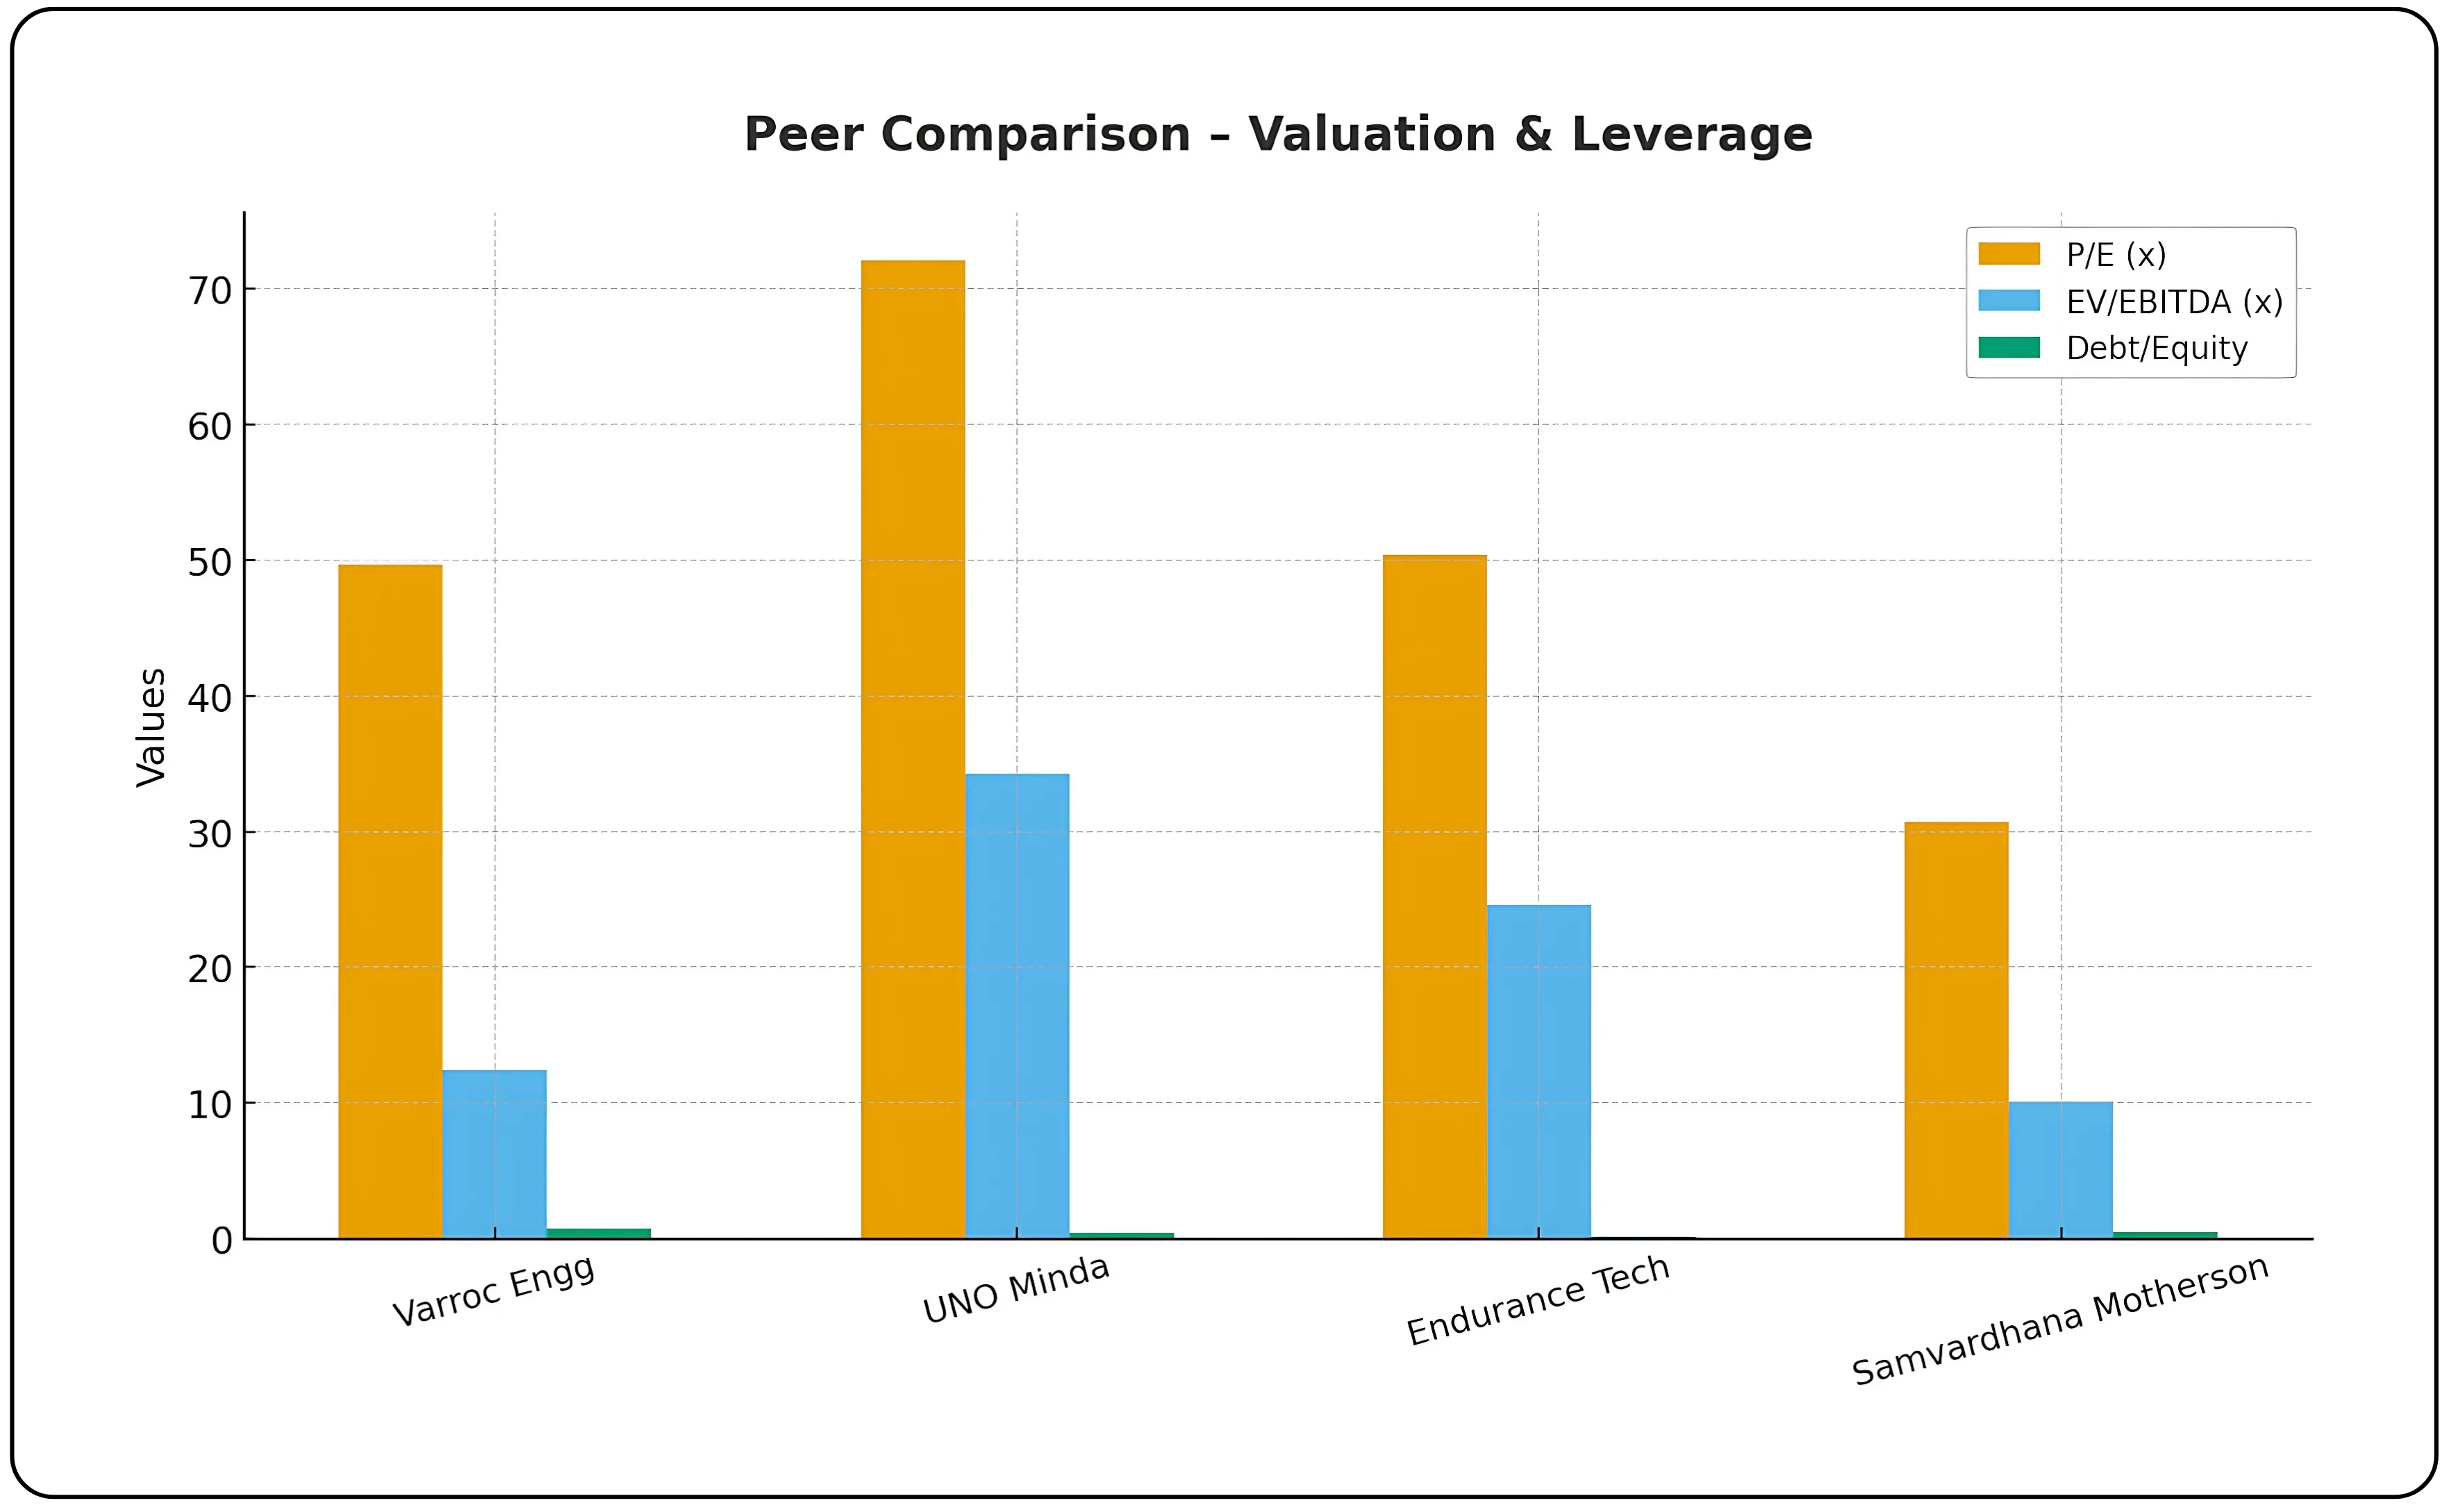
| P/E (x) | 49.7 | 72.1 | 50.4 | 30.7 |
| EV/EBITDA (x) | 12.4 | 34.3 | 24.6 | 10.1 |
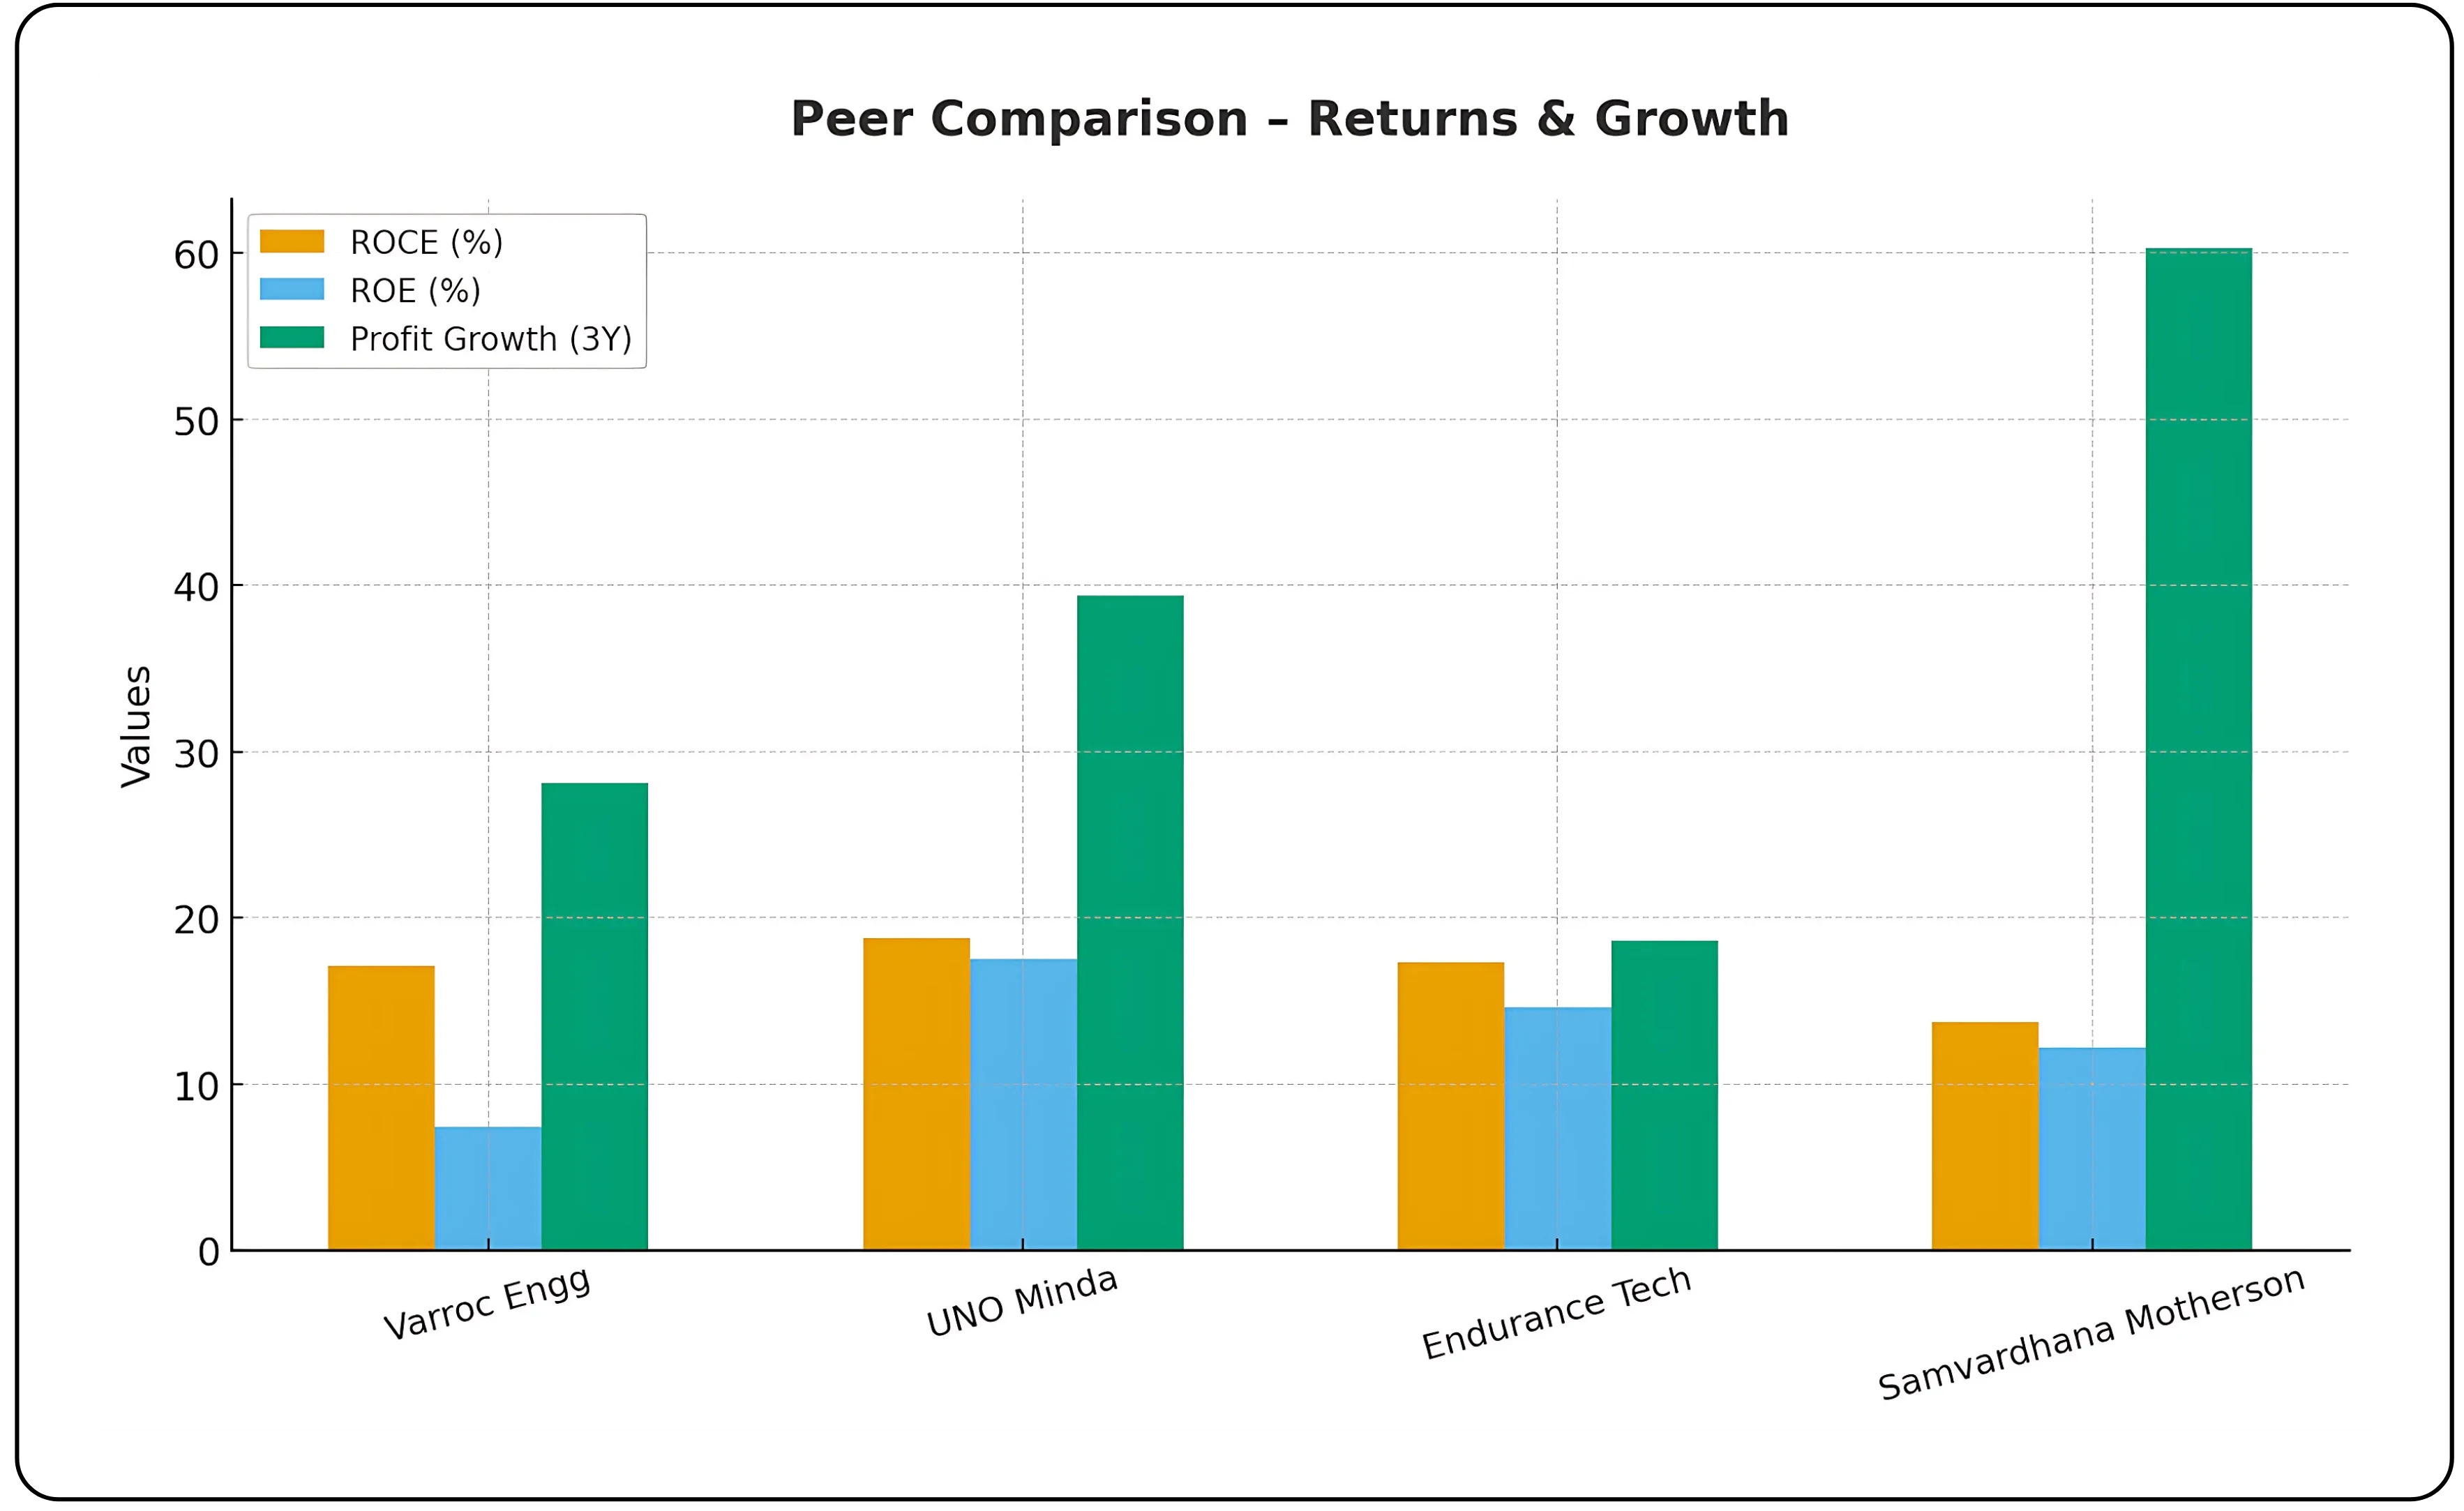
| ROCE (%) | 17.1 | 18.8 | 17.3 | 13.7 |
| ROE (%) | 7.4 | 17.5 | 14.6 | 12.2 |
| Debt/Equity | 0.71 | 0.43 | 0.17 | 0.49 |
| Sales Growth (3Y) | 11.7 | 26.4 | 15.3 | 21.2 |
| Profit Growth (3Y) | 28.1 | 39.4 | 18.6 | 60.3 |
Key insights
- Valuation: Varroc trades at a P/E of 50x, close to Endurance (50x) but much lower than UNO Minda (72x). EV/EBITDA of 12.4x is significantly cheaper than peers (UNO: 34x, Endurance: 24x).
- Profitability: ROCE is decent (17%), but ROE at 7% lags peers, reflecting margin and leverage challenges.
- Growth: Varroc’s 3-year profit growth (28%) is strong but trails Motherson (60%) and UNO (39%).
- Leverage: Varroc’s debt/equity of 0.71 is the highest among peers, signaling higher financial risk.
Also read: BLS International – Scaling New Heights in Visa and Citizen Services
Valuation and investment scenarios
Varroc Engineering’s current TTM EPS stands at ₹8.77, and the stock trades at ₹613, implying a trailing P/E of 49.7. Based on management’s guidance of high double-digit growth in India, an increasing EV content share, and ramp-up of exports and overseas business by FY27, we have built three scenarios for EPS growth and the corresponding implied valuations at the current price.
Assumptions behind growth rates
- Bull Case (35% CAGR): Aggressive EV adoption, strong operating leverage, exports scaling to 10% share within two years, and timely overseas recovery.
- Base Case (25% CAGR): Consistent double-digit India growth, moderate EV contribution, and gradual export ramp-up.
- Bear Case (15% CAGR): Slower EV penetration, pricing pressure, and delays in overseas execution.
Scenario table
| Scenario | EPS FY25 (₹) | EPS FY27 (₹) | CAGR | Implied P/E @ ₹613 |
|---|---|---|---|---|
| Bear | 8.77 | 11.6 | 15% | 52.8× |
| Base | 8.77 | 13.7 | 25% | 44.7× |
| Bull | 8.77 | 16.0 | 35% | 38.3× |
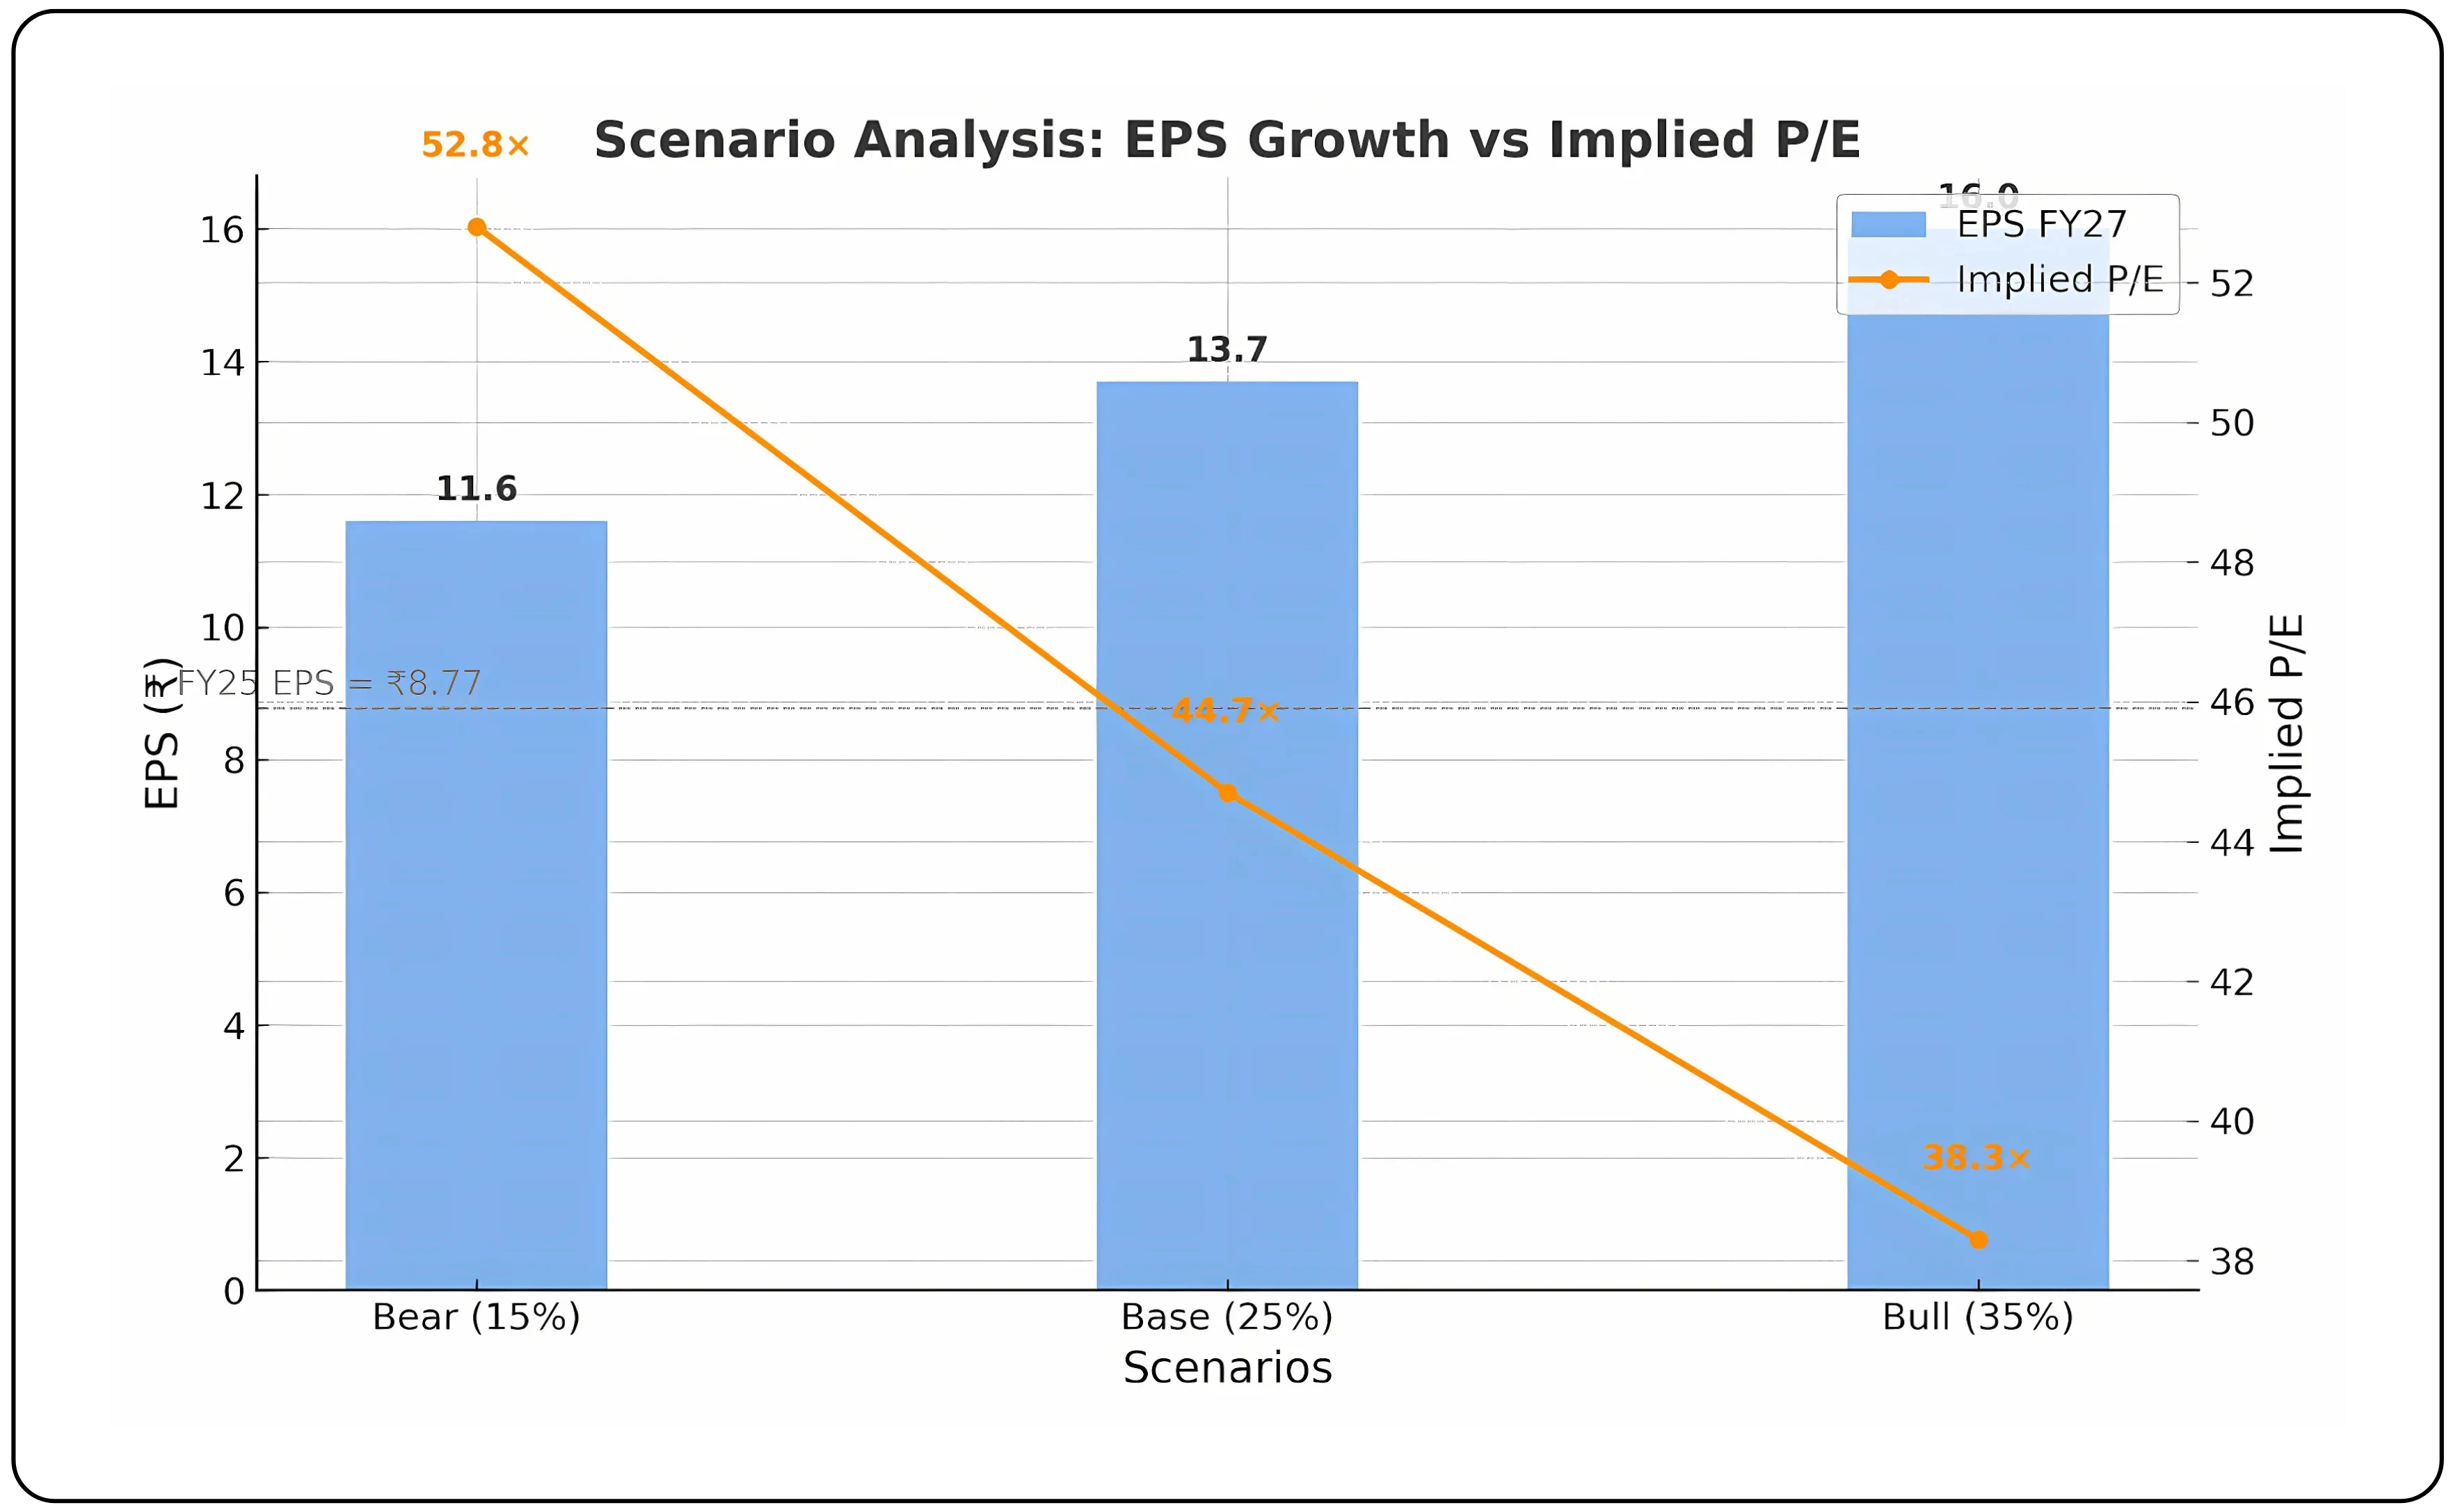
Valuation implications
At the current price of ₹613 (P/E 49.7 on TTM EPS), even under a bullish scenario with a 35% EPS CAGR, the stock would trade at 38× FY27 earnings. The base case assumes 25% CAGR, which brings the implied multiple down to ~45×, while the bear case stays above 50×. This indicates that the current valuation already prices in strong execution, leaving limited room for upside unless growth and margins exceed expectations.
Final perspective on Varroc Engineering
Varroc Engineering has successfully repositioned its business after divesting its global four-wheeler lighting operations, and is now focusing on India-centric segments and emerging areas such as EV systems and electronics. The company is targeting high double-digit growth in domestic operations, improved product mix, and increased export contribution over the next few years. Margin improvement and cost discipline further strengthen its growth narrative.
That said, the current valuation already factors in a significant portion of the expected growth, making consistent execution essential. The timely ramp-up of EV programs, maintaining profitability, and the scaling of exports will remain key drivers for sustaining long-term value creation.
Turn research into action — trade smarter on CubePlus.
Disclaimer: The information provided in our blogs is for informational purposes only and should not be construed as financial, investment, or trading advice. Trading and investing in the securities market carries risk. Always conduct your own research and consult with a qualified financial advisor before making any investment decisions. Past performance is not indicative of future results. Copyrighted and original content for your trading and investing needs.
© 2025 — Tradejini. All Rights Reserved.