


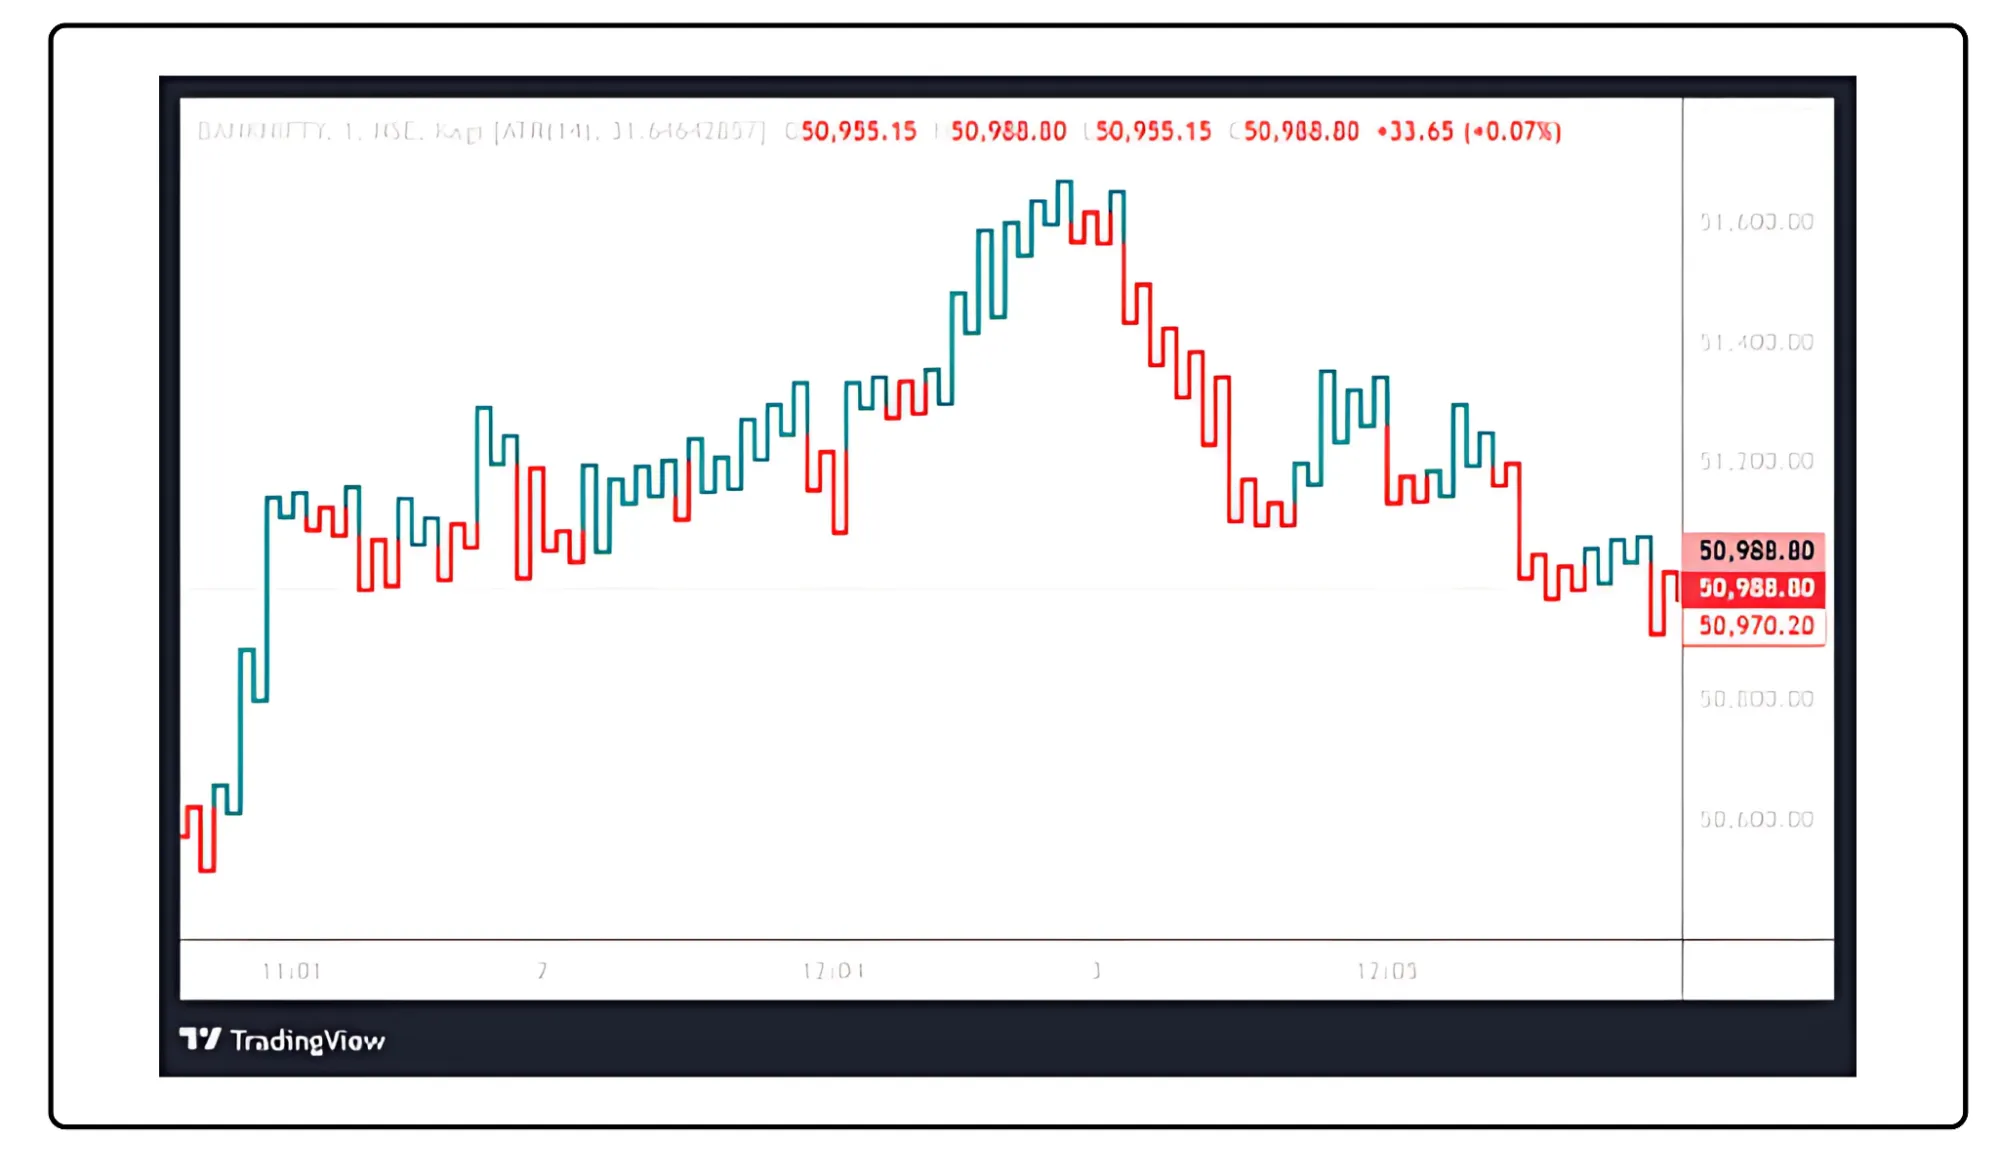
One day, Maya noticed something odd while analyzing her charts. She saw that some indicators would flash a buy signal, but a few minutes later, the signal would just disappear. This left her confused and worried. What if she took a trade based on that signal and ended up losing money? Determined to figure out what was happening, she started digging deeper.
That's when she stumbled upon the concept of repainting. She learned that repainting happens when indicators adjust their old data to fit new price movements. This makes the signals look perfect in hindsight but can be misleading in real-time. This realization sparked her curiosity, and she decided to learn how to spot and handle such situations better.
Maya has always liked Kagi charts for their clarity and ability to cut down on market noise. Unlike candlestick charts, where price movement can sometimes be erratic, Kagi charts move only when a particular price reversal takes place. This property helps the trader focus on trends rather than get carried away by the price movements over a short time.
But Maya learned that even some Kagi indicators have the feature of repainting, that is, altering past signals and distorting her analysis. This would not happen with her; hence, she needed a non-repainting Kagi. This decision, in turn, would open doors for her to base everything on reliable data, knowing that her movements in the markets would be adequately informed.
Kagi Charts
Maya observed that the lines changed thickness based on price movements. When the price broke above a previous high, the line thickened, signaling a bullish trend. Conversely, if the price fell below a prior low, the line became thin, indicating bearish sentiment. This visual cue was essential for her trading strategy, as it provided immediate insight into market momentum.
However, Maya also learned about repainting a phenomenon where these signals could change retroactively based on new price data. She realized that if she saw sudden and unexplained changes in line thickness without corresponding price movements, it could indicate repainting. This realization prompted her to adjust her trading approach, ensuring she relied on confirmed signals rather than those that might shift unpredictably.
By understanding how changes in line thickness indicated potential repainting, Maya became more adept at interpreting Kagi charts. She learned to wait for confirmed signals before making trades, ultimately enhancing her trading accuracy and confidence in the ever-changing market landscape.
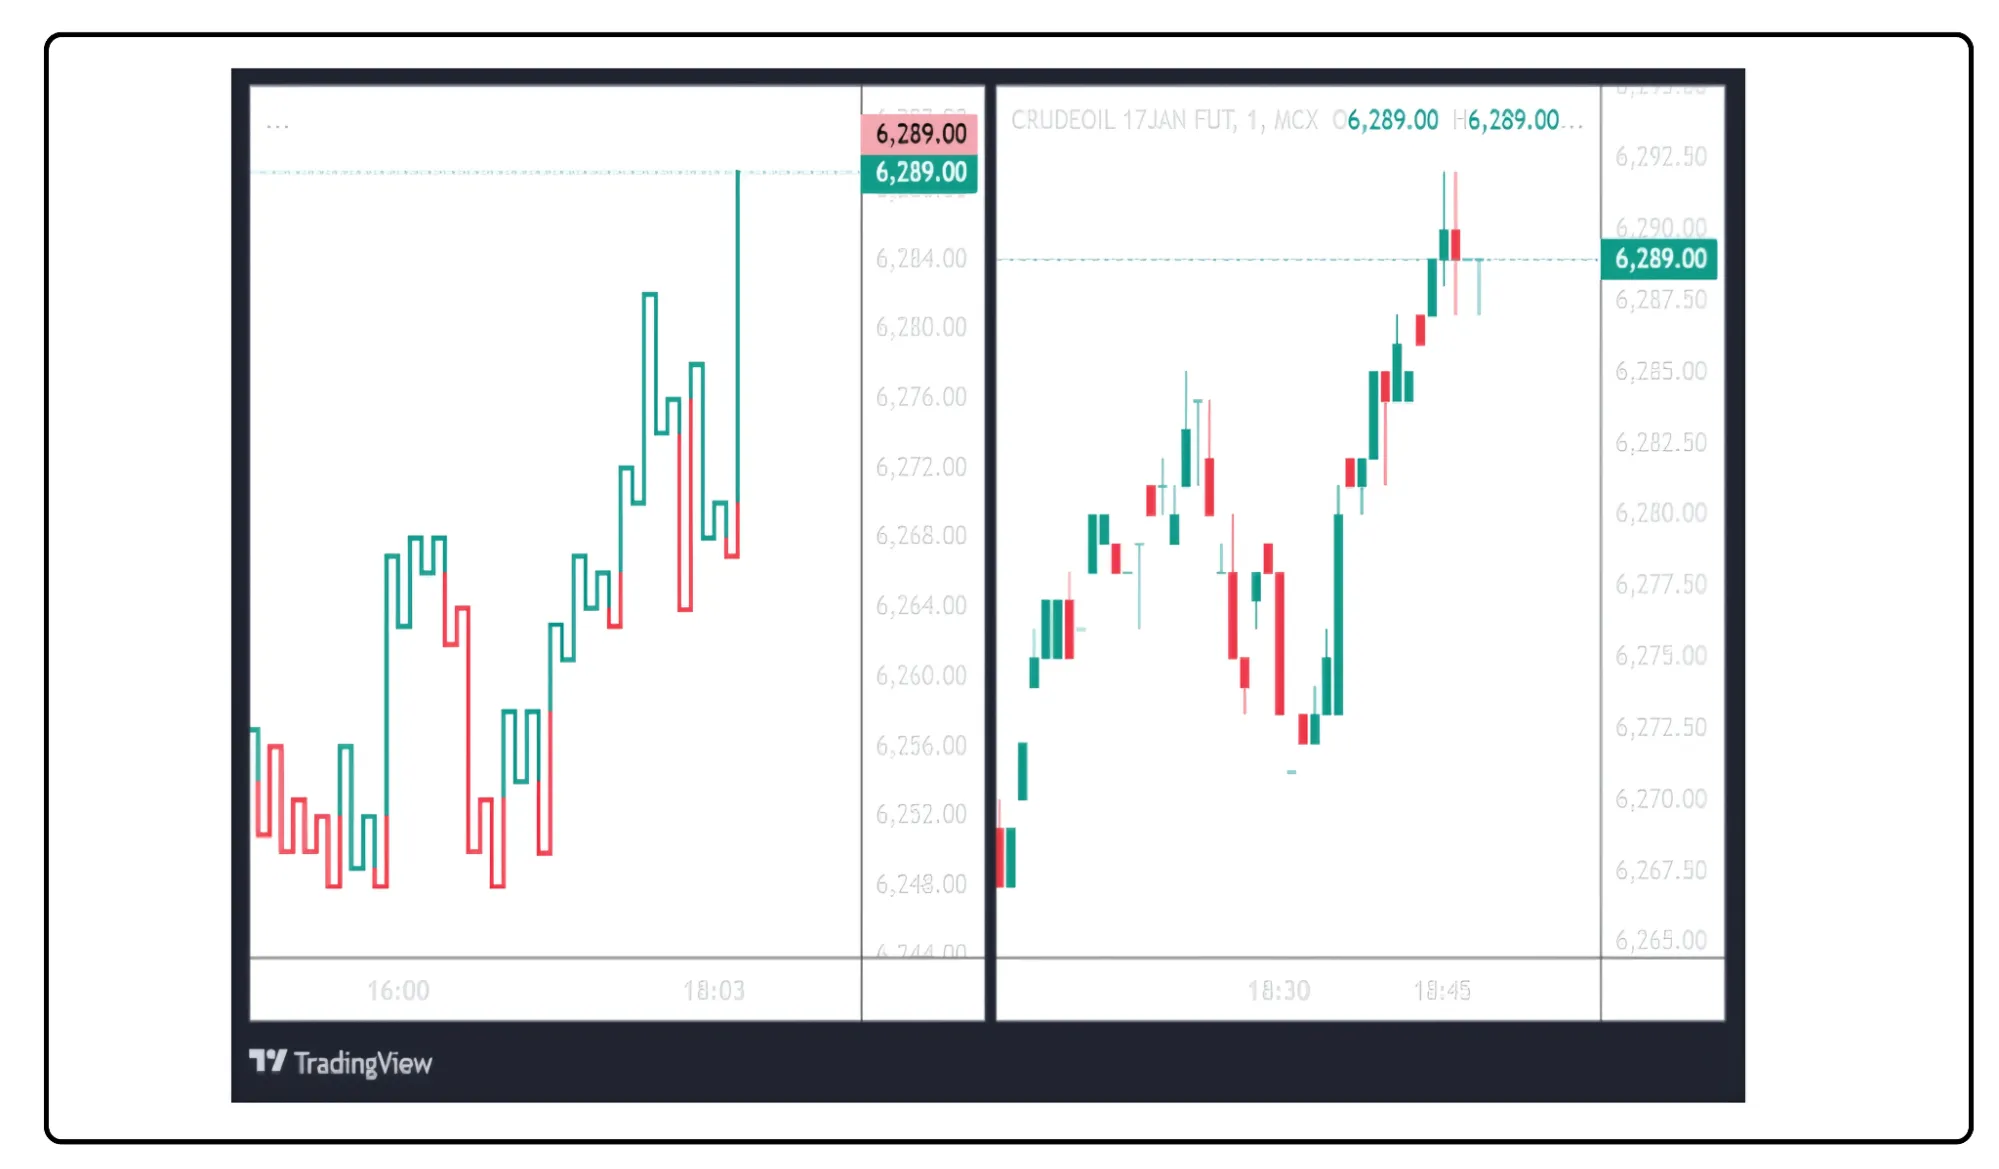
Kagi Chart Vs. Candlestick Chart
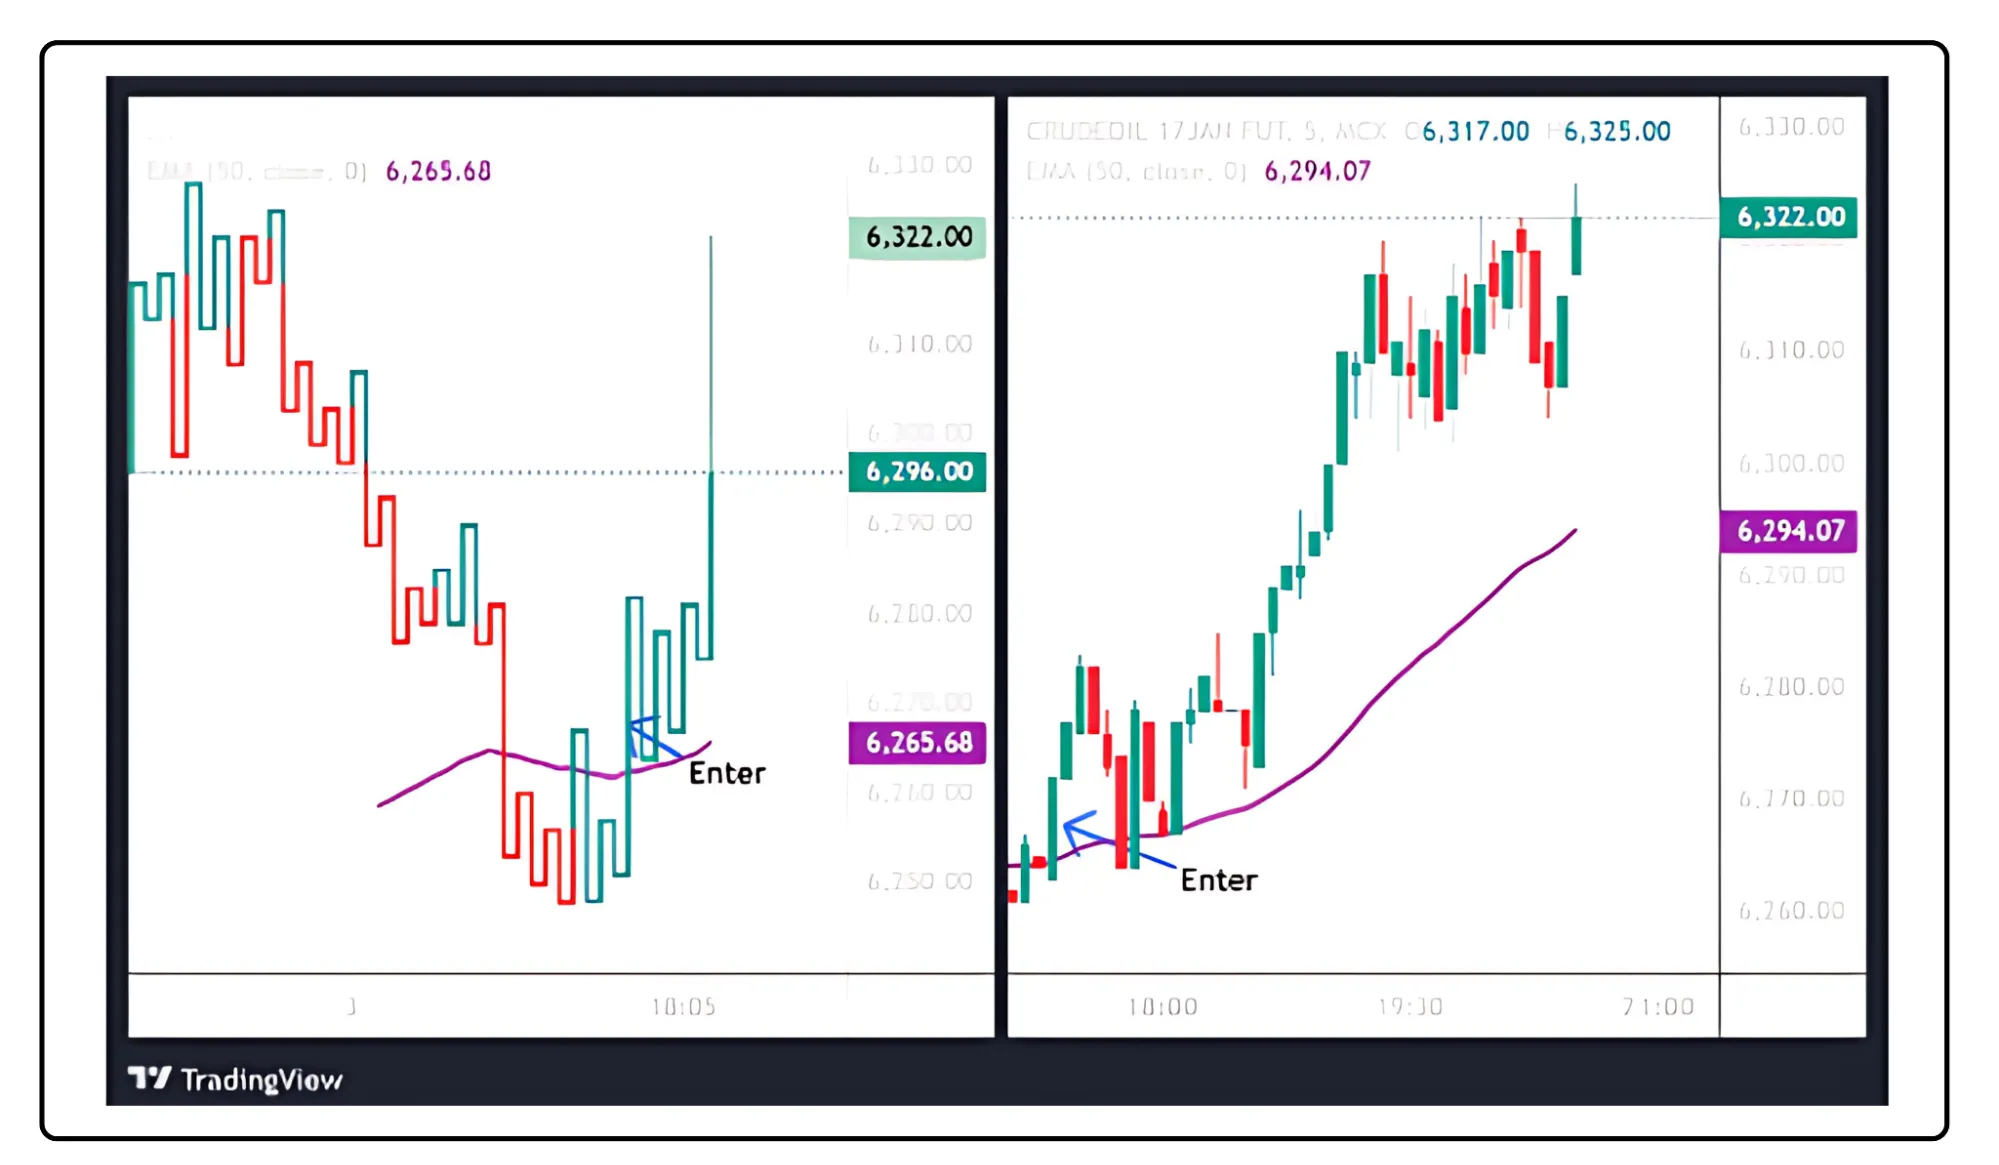
One day, while analyzing her Kagi chart, Maya observed that once the price crossed above the EMA 50, the Kagi line remained stable, showing fewer signs of repainting compared to her candlestick charts. The candlestick signals often led to confusion, especially during periods of high volatility, where buy signals would appear and then quickly vanish as the market fluctuated.
Determined to enhance her trading decisions, Maya decided to combine Kagi charts with other indicators. She integrated the EMA 50 into her analysis, using it as a guiding light for her trades. When the Kagi line crossed above the EMA 50 and confirmed a bullish trend, she felt more confident in her decision to hold onto her positions.
Maya also started learning on price action and chart patterns.
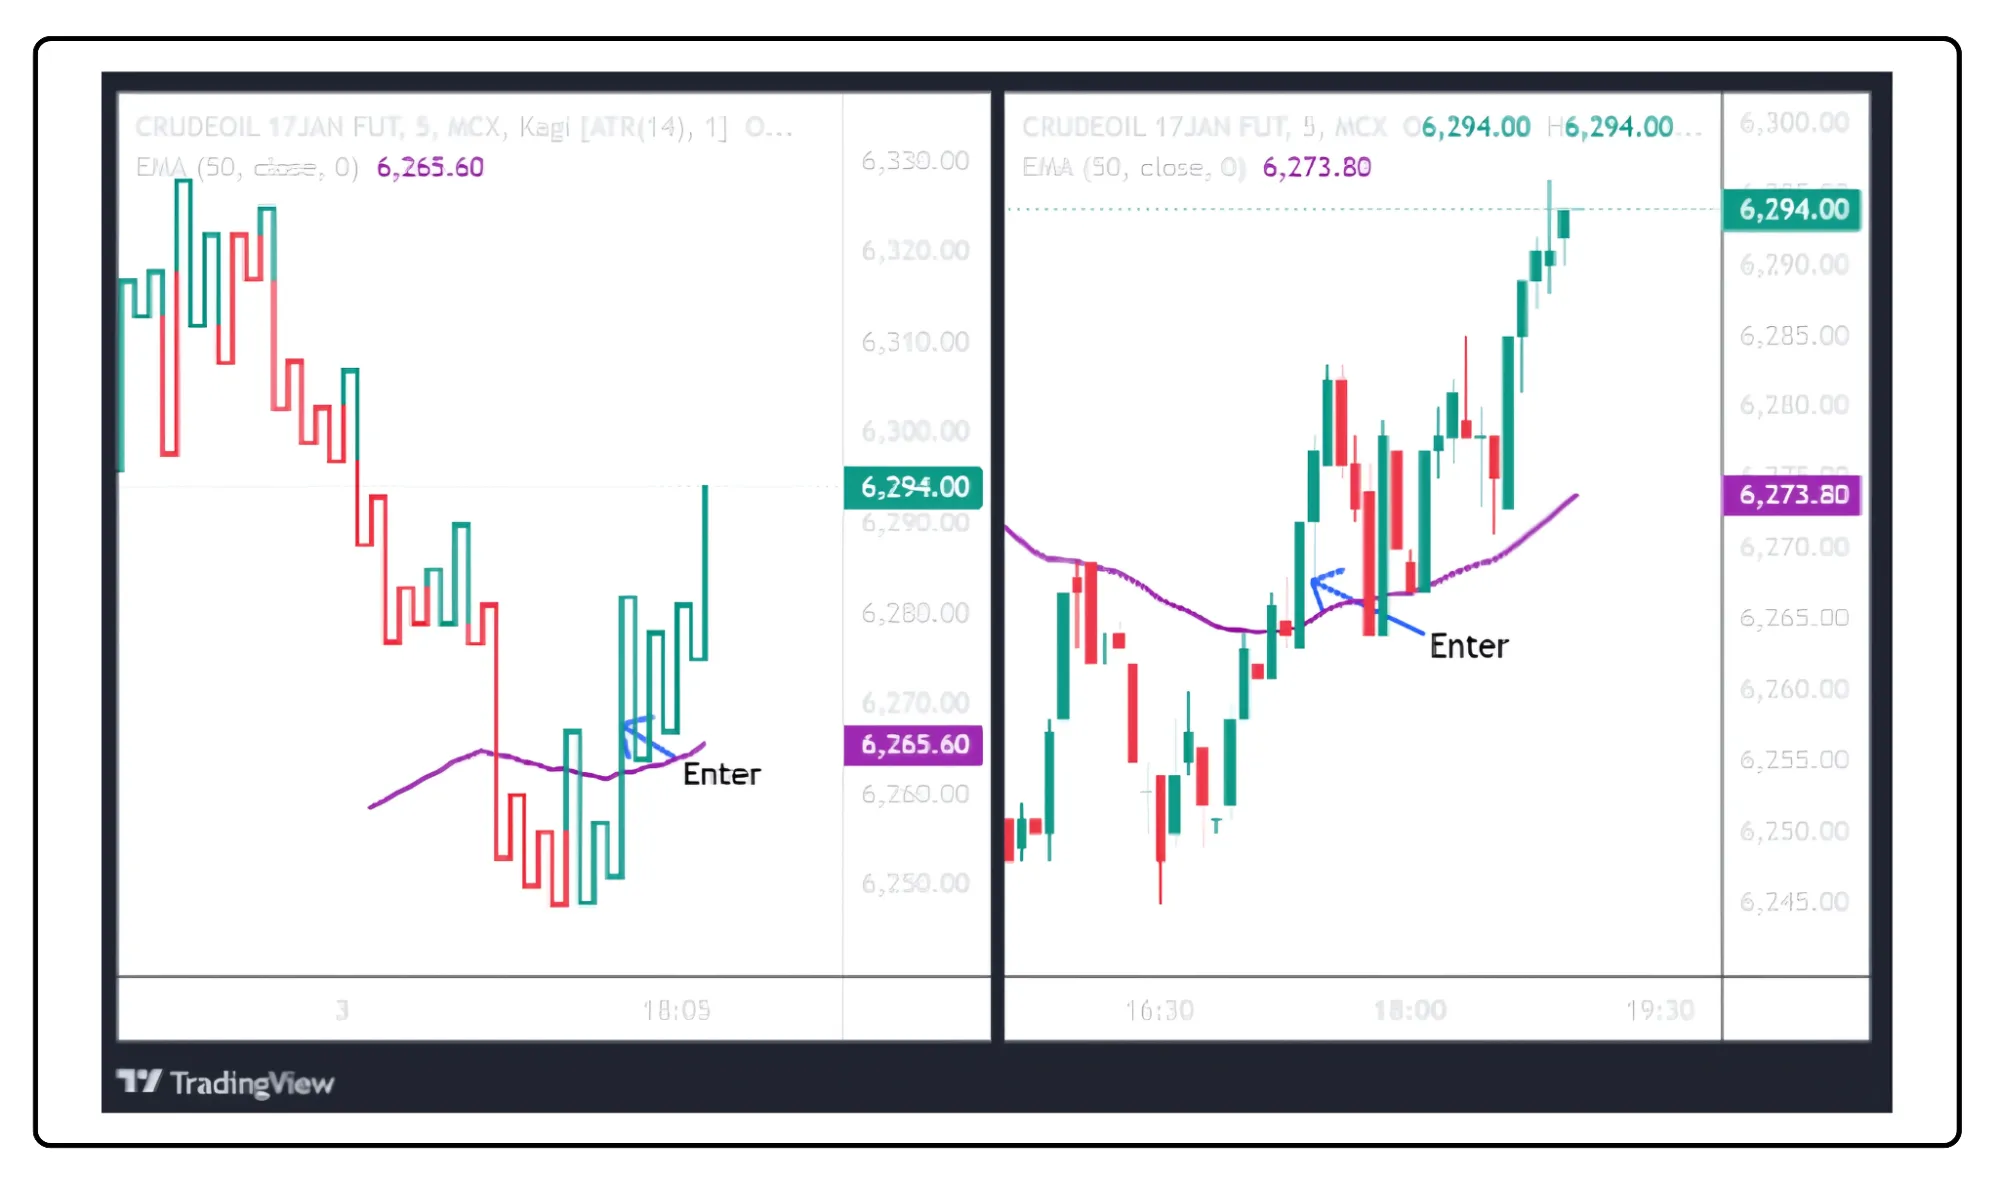
Kagi Chart Entry vs. Candlestick Chart Entry
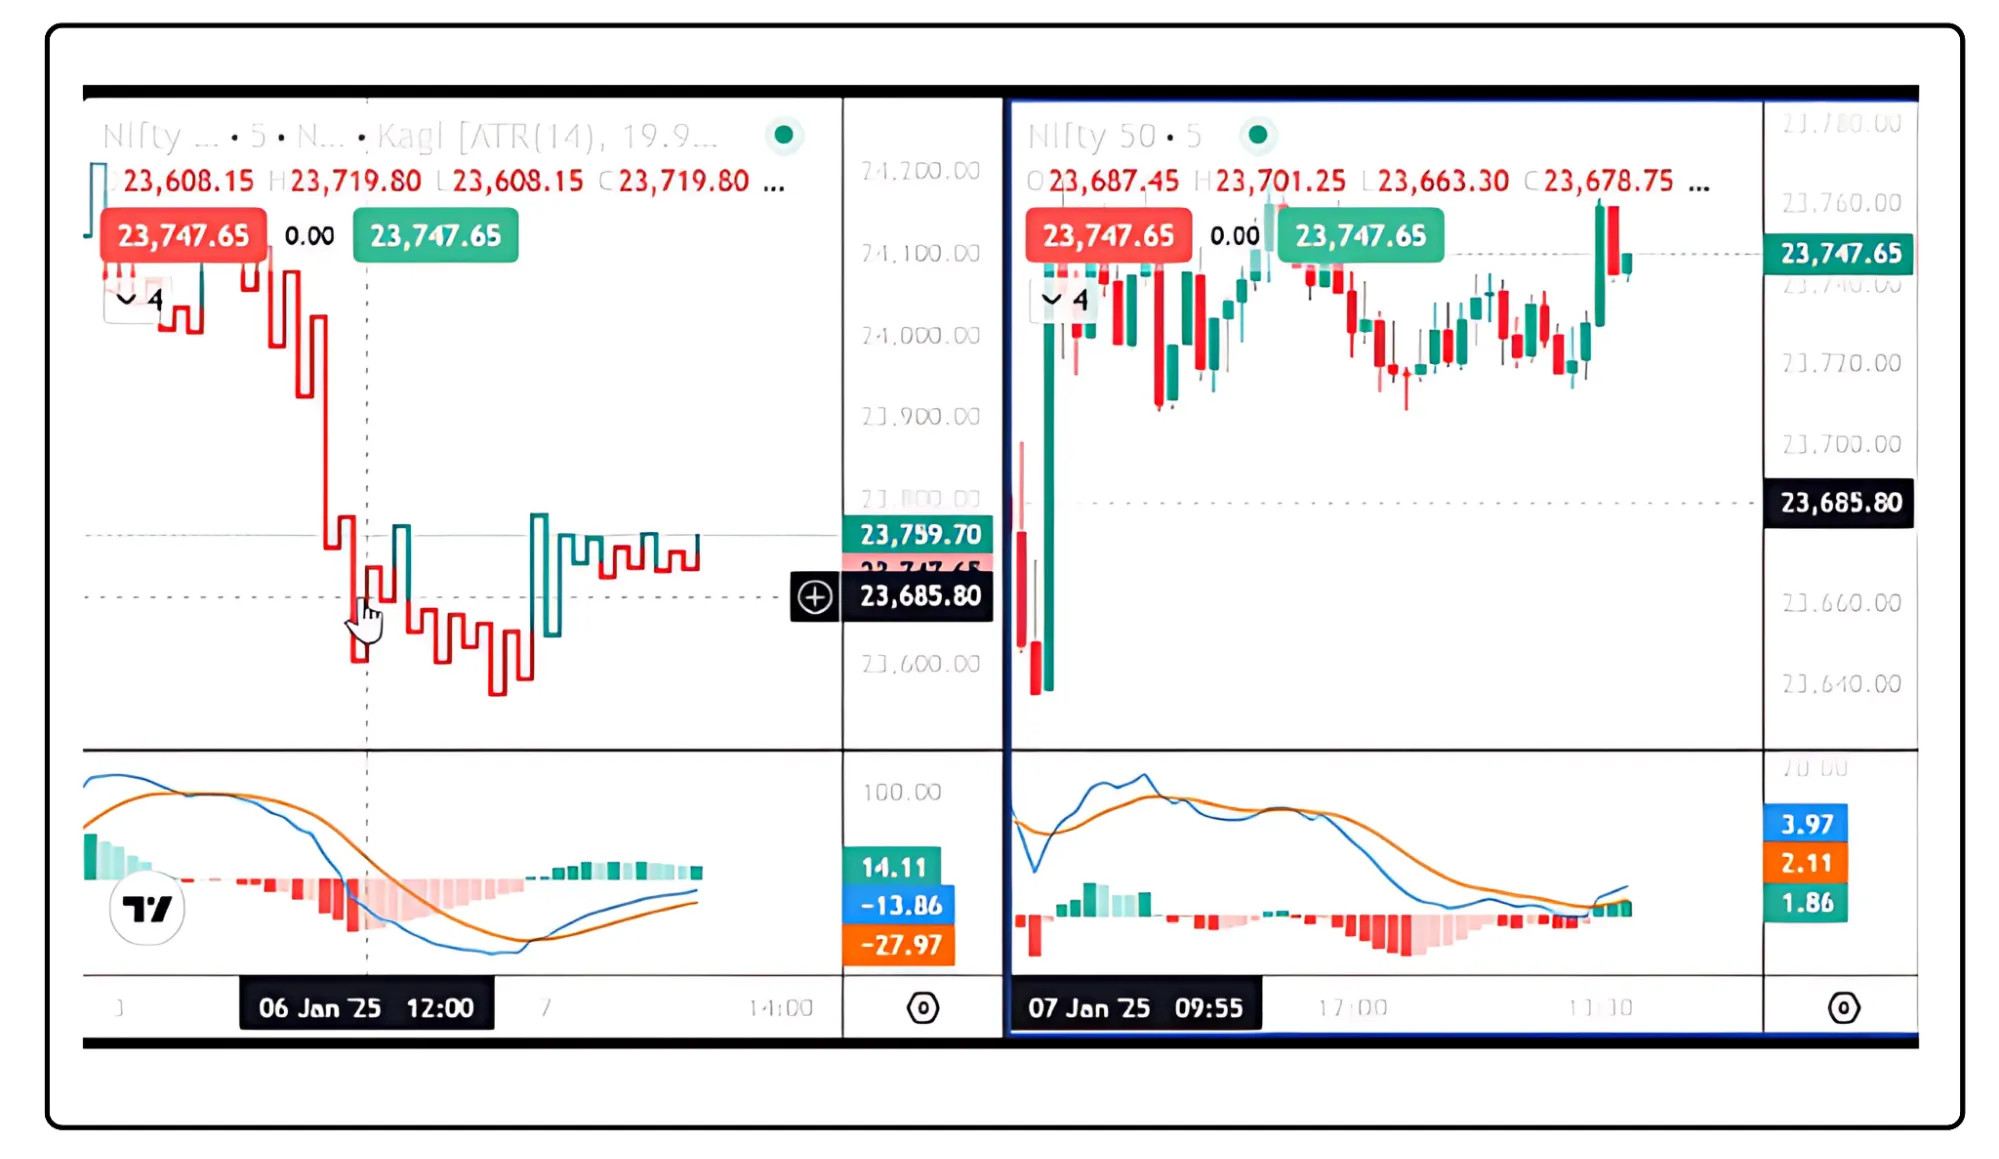
Kagi Chart Live (During Repainting) vs. Candlestick Chart Live
Kagi with MACD Indicator vs. Candlestick with MACD Indicator
Maya decided to combine the Moving Average Convergence Divergence (MACD) indicator with the Kagi chart pattern to refine her trading strategy. The Kagi chart gave her an early buy signal, but she knew it often repaints, turning red and green multiple times, which could lead to premature exits. To avoid this, she used MACD as a confirmation tool.
When the market was at 23,650, both the Kagi chart and MACD aligned, signaling a strong entry point. Maya entered the trade and watched as the market climbed to 23,750, securing a 100-point gain. Thanks to MACD, she confidently held the position despite Kagi’s fluctuations.
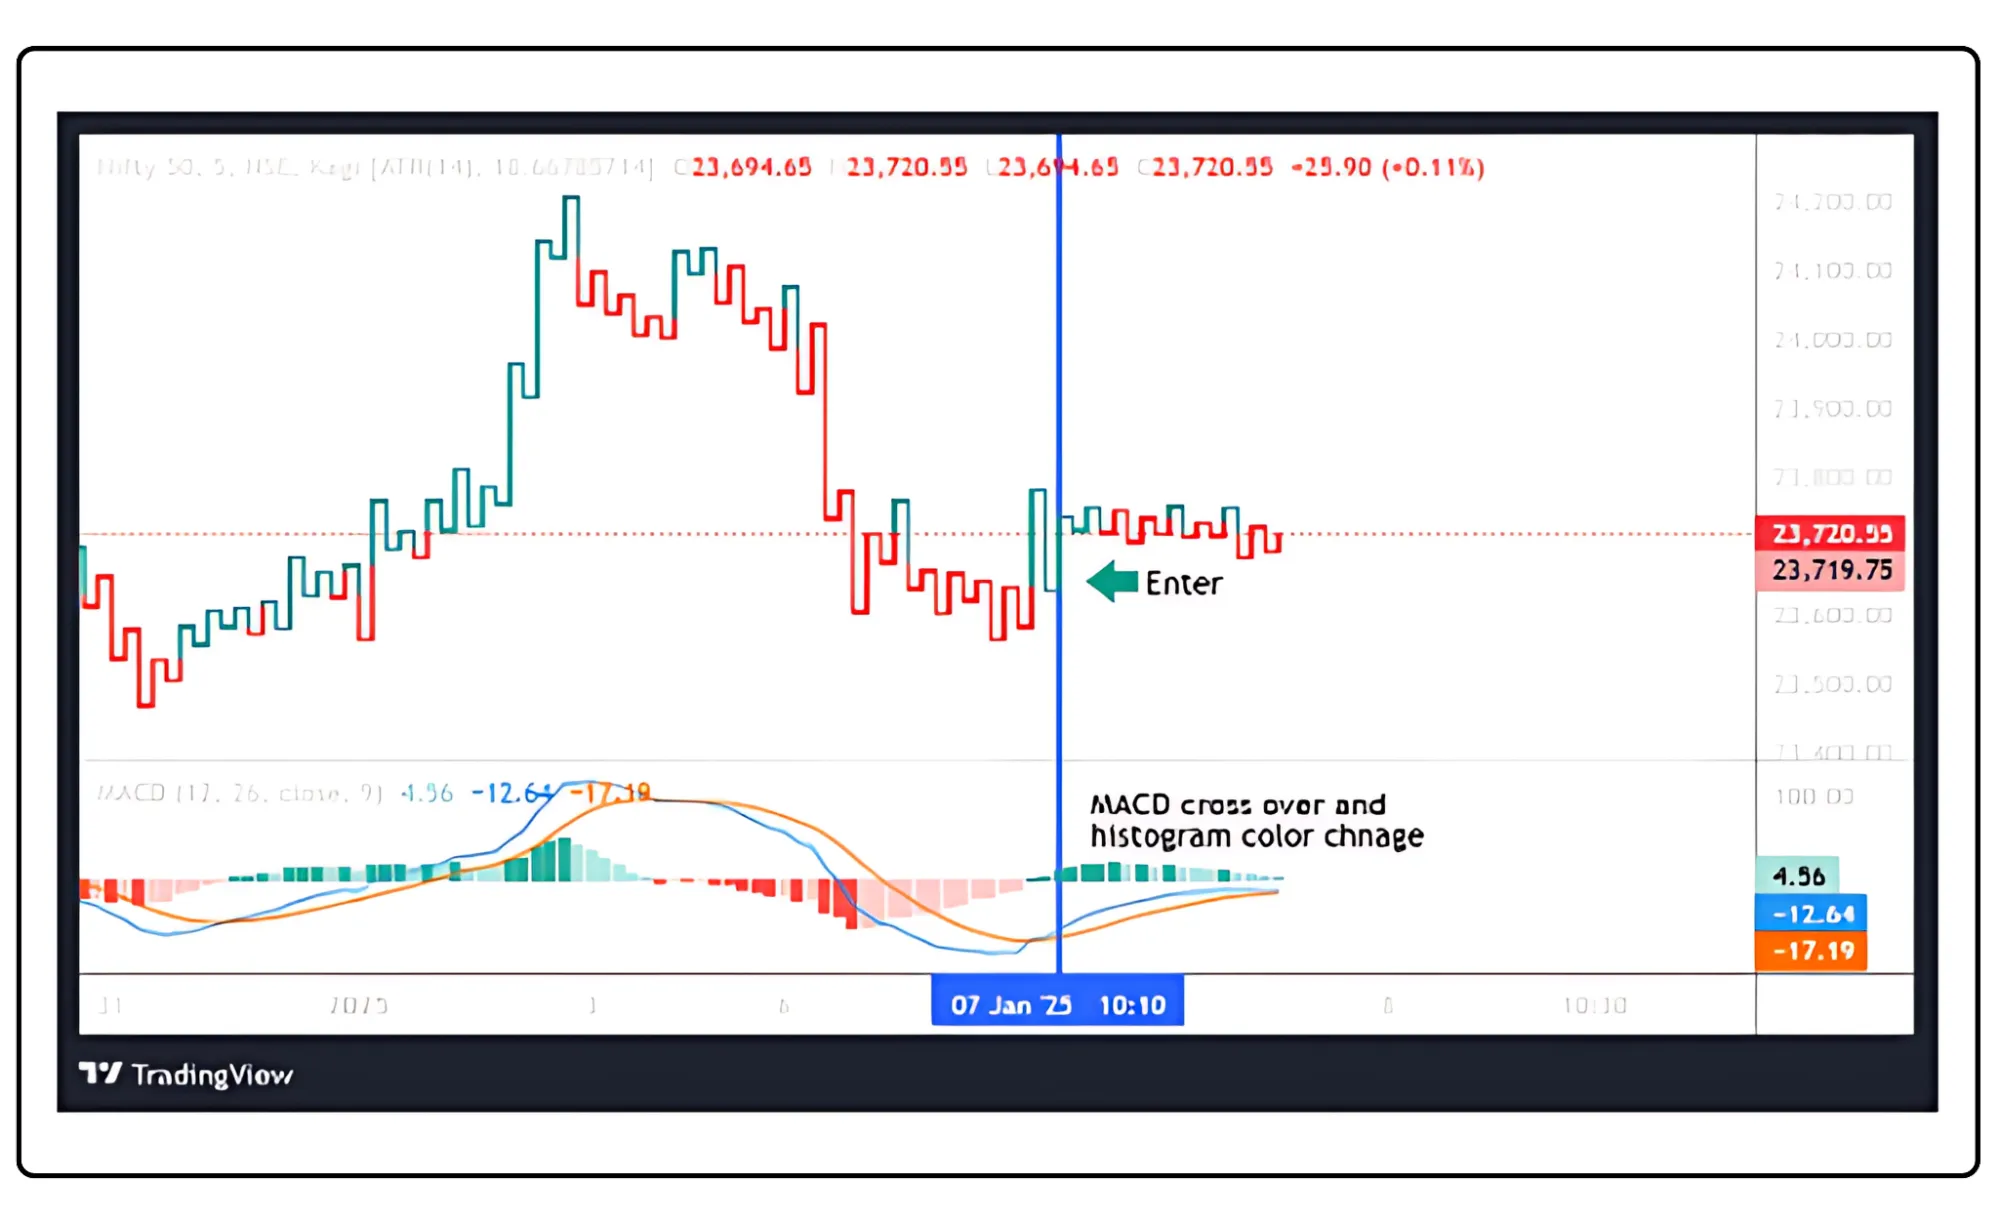
Kagi MACD Entry vs. Candlestick MACD Entry
By relying on this combination of Kagi charts and the EMA 50 and MACD, Maya found that she could navigate through market volatility with greater ease. The stability of the Kagi signals allowed her to avoid many of the pitfalls associated with repainting seen in candlestick charts. This strategic pairing not only improved her confidence but also empowered her to make informed decisions, ultimately leading to more successful trades in her trading journey.
Do and Don'ts of Kagi Chart
To maintain the integrity of Kagi charts and avoid repainting, traders must navigate several pitfalls with a solid foundation in technical analysis. First, it is crucial to avoid dynamic settings that adjust past data; instead, stick to fixed reversal values. Trust in your platform is essential—never assume Kagi chart patterns are non-repainting without thorough testing.
Do not rely solely on Kagi signals; complement them with technical analysis tools like EMA, RSI, or trendlines for stronger confirmation. Additionally, real-time testing is vital—backtesting alone does not guarantee accuracy. Be patient with signals—wait for them to stabilize before acting.
Lastly, ensure you understand the algorithm behind Kagi charts to prevent confusion caused by future price data. Always validate trends using multiple technical analysis methods to avoid false entries and improve decision-making.
From repainting to reliable execution
To solve the repainting issue, Maya combined Kagi charts with reliable indicators like the EMA 50, MACD and RSI. The EMA 50 confirmed trend direction, while the RSI highlighted overbought or oversold conditions, helping her validate Kagi signals. If a bullish Kagi signal appeared but RSI showed overbought, she’d wait for a better entry. This multi-indicator strategy reduced false signals, allowing her to cross-verify data and make informed trades. By blending tools, Maya ensured accuracy, minimized risks, and boosted her trading confidence.
Disclaimer: The information provided in our blogs is for informational purposes only and should not be construed as financial, investment, or trading advice. Trading and investing in the securities market carries risk. Always conduct your own research and consult with a qualified financial advisor before making any investment decisions. Past performance is not indicative of future results. Copyrighted and original content for your trading and investing needs.
©️ 2025 — Tradejini. All Rights Reserved.


