


While many indicators exist, few are as robust and versatile as the Commodity Channel Index. Originally developed by the brilliant Donald Lambert for the Commodities Magazine, this powerful momentum oscillator has become a staple for analyzing price trends across all financial markets, from stocks to forex.
This guide will break down the Commodity Channel Index (CCI) in trading, explaining how it works, how to interpret its signals, and how you can incorporate it into your trading strategy for better-informed decisions.
Commodity Channel Index
At its heart, the Commodity Channel Index is a technical indicator that measures the difference between an asset's current price and its historical average price. Essentially, the CCI measures this price deviation from the statistical mean to identify periods of unusual strength or weakness.
Think of it as a gauge of market momentum. When the asset's price moves far above its average price level, the CCI reading will be high, indicating a strong bullish trend. Conversely, when the price crosses far below its average, the CCI reading will be low, signaling a strong bearish trend. This makes it an excellent tool for identifying potential trend reversals and momentum shifts.
CCI Indicator
The CCI indicator is plotted as a single line that oscillates, typically above and below a zero line, without any specific upside or downside limits. However, its power comes from interpreting key levels on the price chart. The CCI indicator shows when an asset is entering potentially unsustainable price zones.
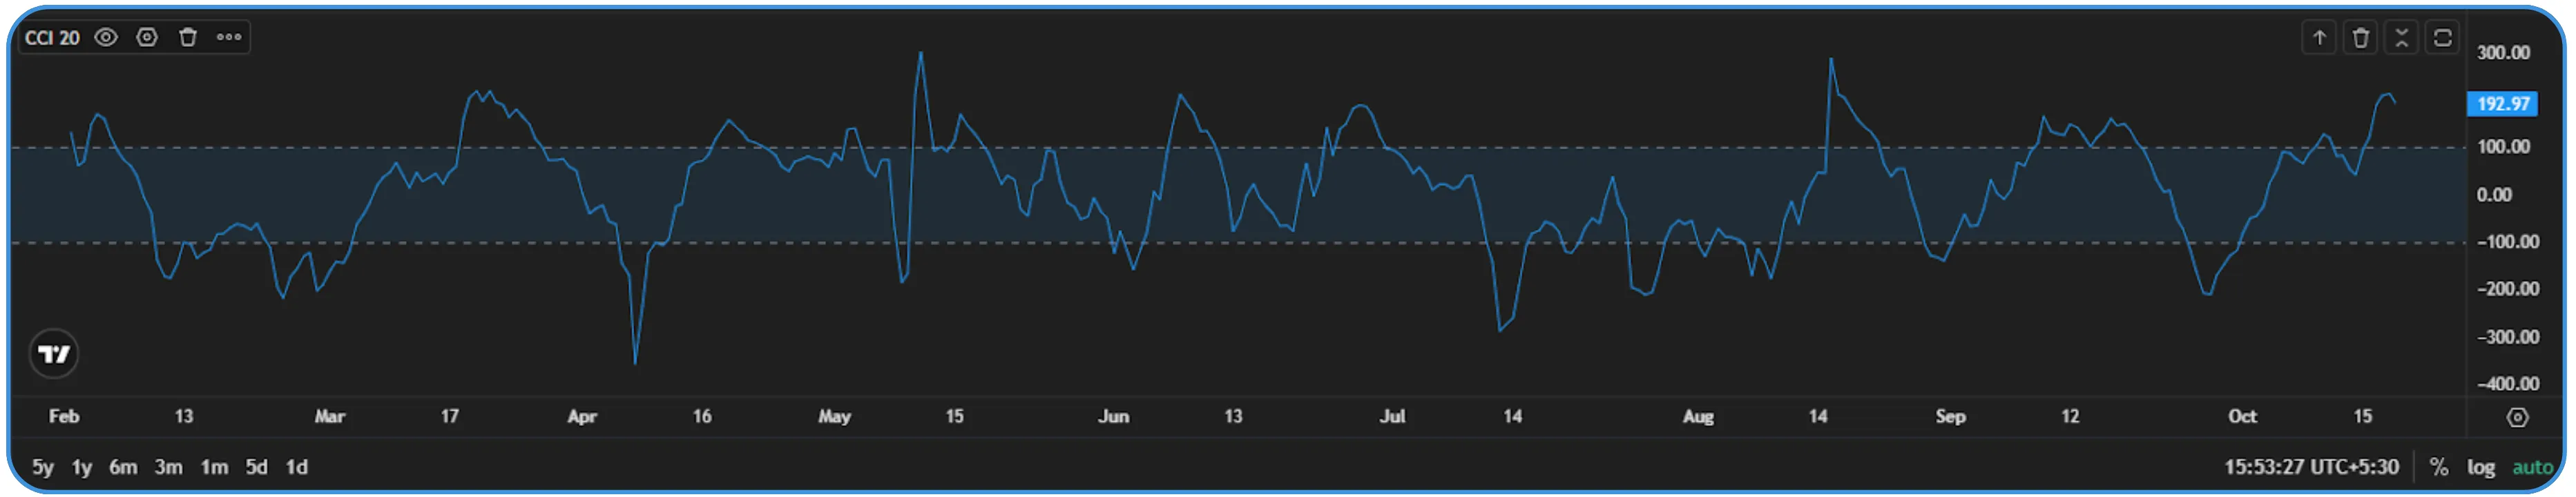
The three most critical levels for any trader to watch are:
The Zero Line: This is the centerline. When the CCI crosses above the zero line, it suggests bullish momentum is taking hold. When CCI values fall below this line, it signals that bearish momentum is in control. Simple zero line crossovers can provide early clues about a shift in market sentiment.
Overbought Levels (+100): When the CCI moves above the +100 level, it signals that the asset is in a strong uptrend and is trading significantly above its mean price. This zone helps to identify overbought conditions.
Oversold Levels (-100): When the CCI falls below the -100 level, it indicates powerful downward momentum and helps identify oversold conditions.
It's crucial to understand that a market can remain in overbought or oversold conditions for a long time period during a strong trend. The signal is not to immediately trade against the trend, but to become alert for a potential exhaustion point.
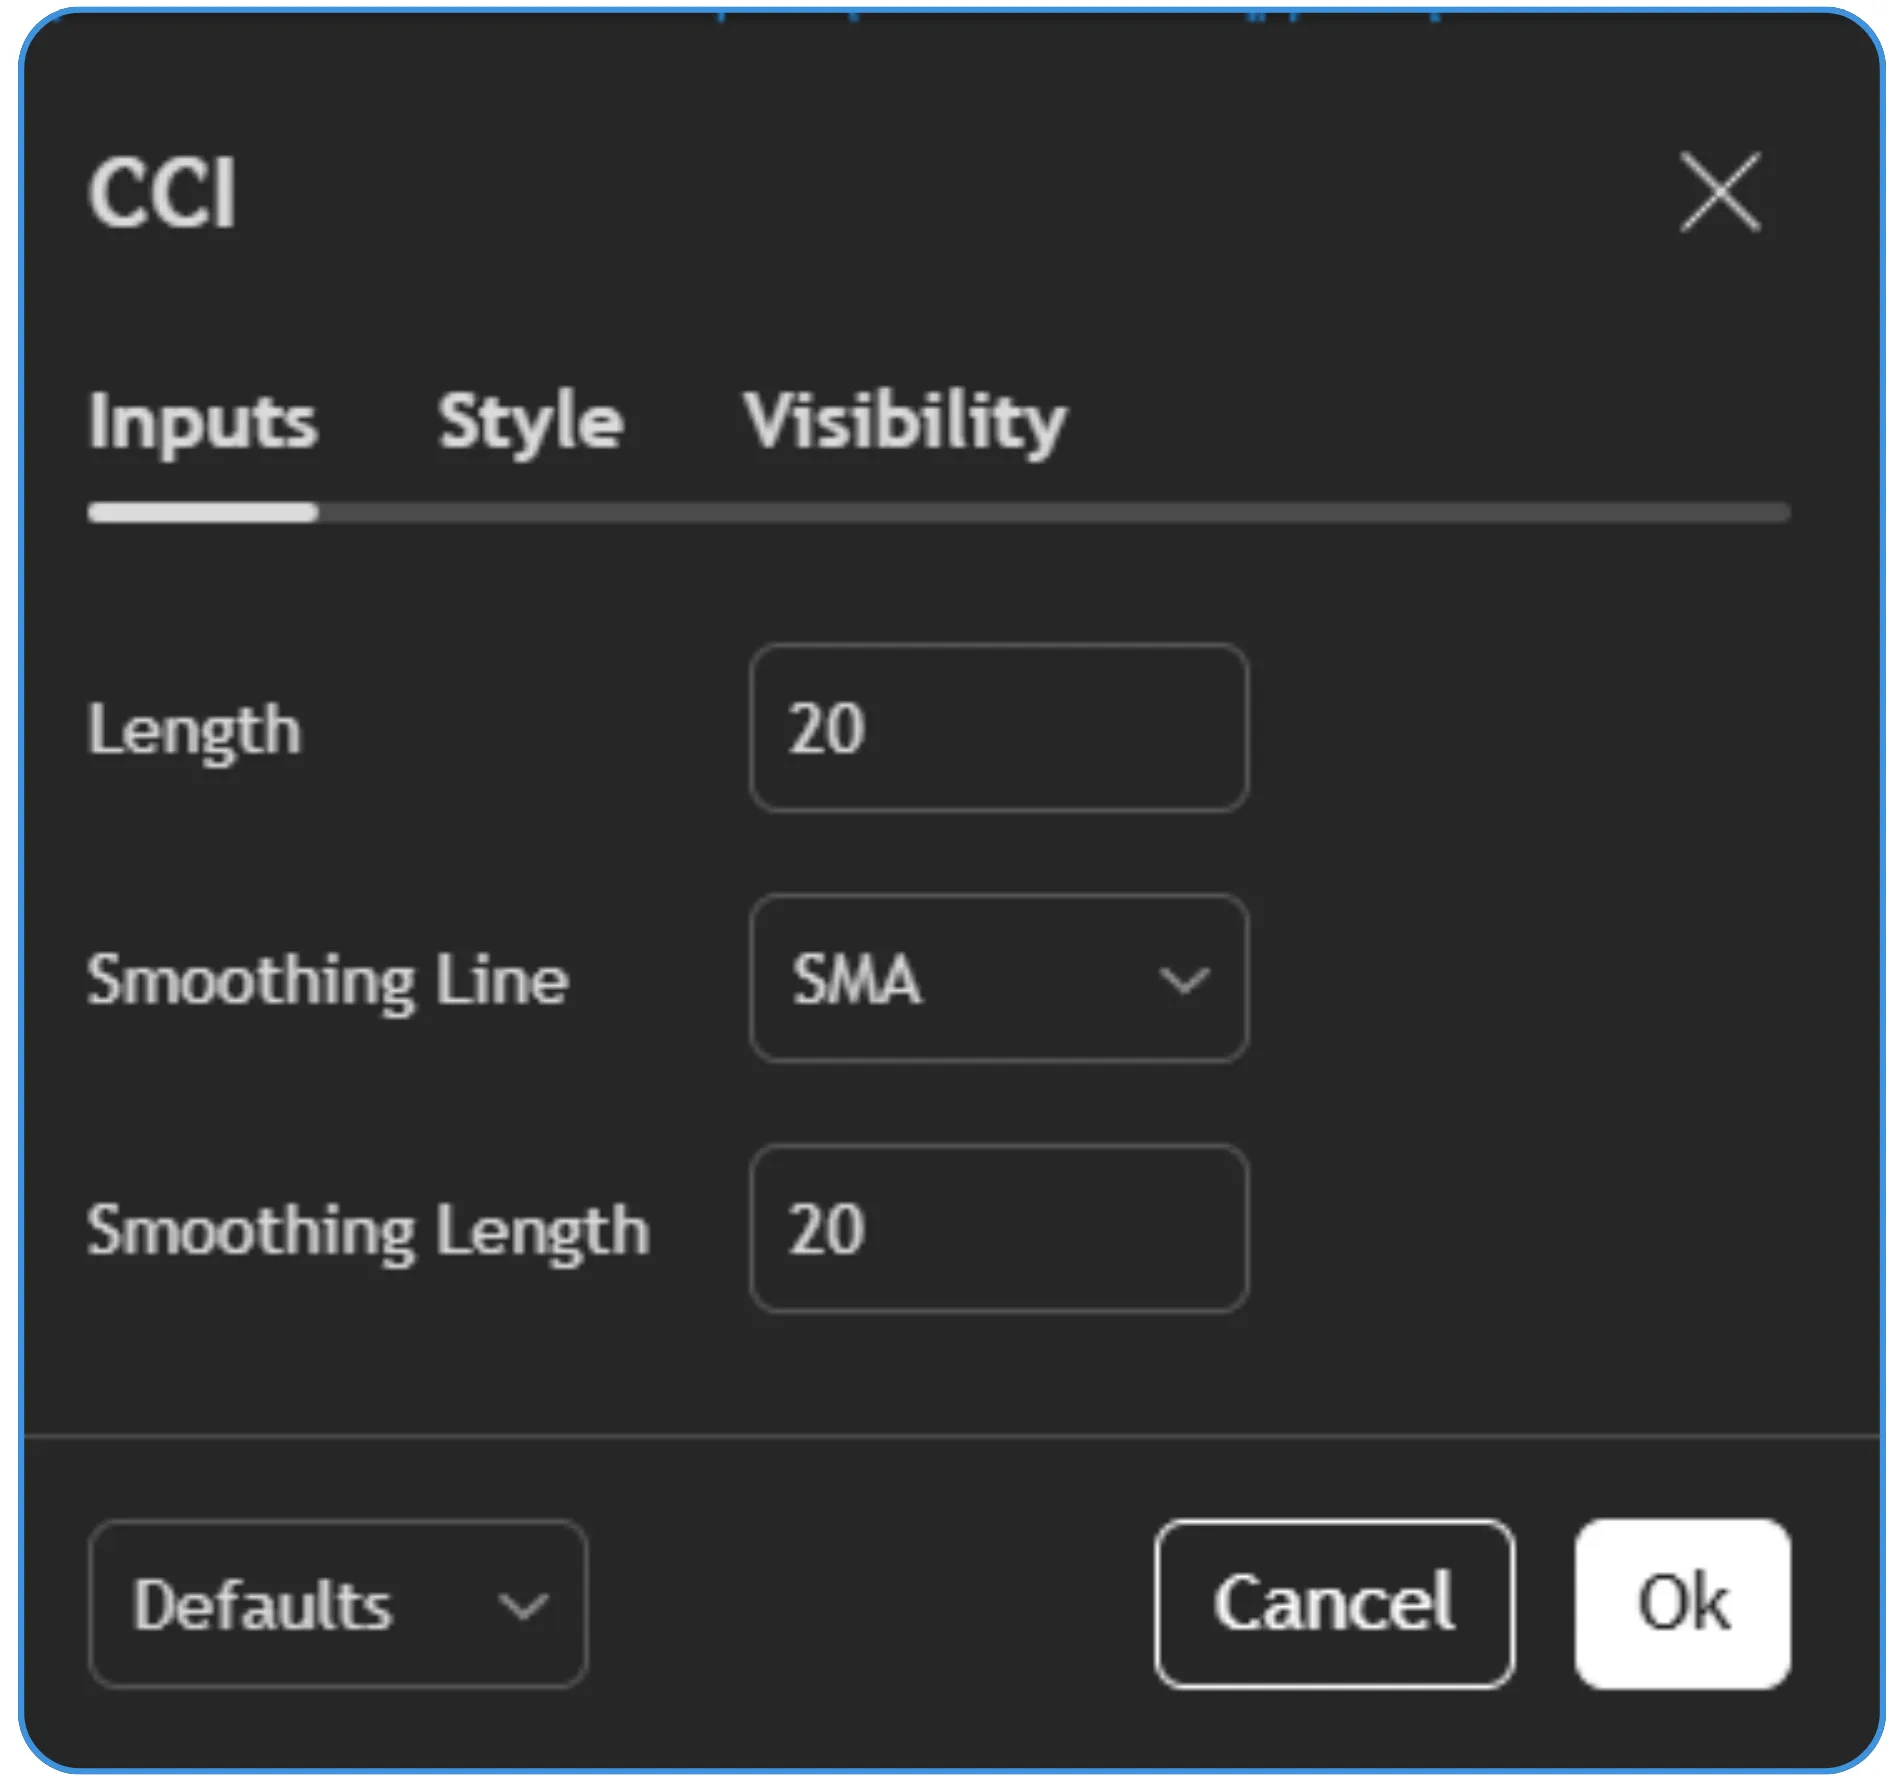
Commodity Channel Index (CCI) Settings
To effectively use the Commodity Channel Index (CCI), understanding its settings and ideal market conditions is key. The standard setting for the daily CCI is a 14-period lookback. Traders looking for more sensitive signals may opt for a shorter CCI (e.g., 9 periods), while long-term investors might use a longer period (e.g., 20 or 50) to smooth out market noise. The core of the CCI calculation involves comparing the typical price (an average of the high, low, and closing price) to its moving average and then normalizing the average difference using the mean deviation.
The Channel Index CCI performs best in trending markets where clear cyclical movements are present. In choppy, sideways markets, it can generate false signals, making risk management paramount.
Bearish Divergence and Bullish Divergence
One of the most powerful applications of the CCI is spotting bullish and bearish divergences. A divergence is a red flag that the momentum of the underlying security does not support the current price analysis, often signaling a price reversal.
Bullish Divergence: This occurs when the price makes a new lower low, but the CCI indicator forms a higher low. This indicates that selling pressure is weakening, and a move to the upside may be imminent. It's a powerful buy signal for traders looking for bottoms
Bearish Divergence: This is the opposite. The asset's price pushes to a new higher high, but the CCI fails to reach a new high. This classic bearish divergence suggests that the momentum behind the rally is fading and a price correction or reversal could be on the horizon
Momentum Indicators
The CCI is one of the most respected momentum indicators available to traders. Unlike other momentum indicators that are often banded between 0 and 100 (like RSI), the CCI is unbounded, which allows it to reflect the absolute values of extreme price trends more accurately. As a leading momentum oscillator, it aims to predict momentum shifts before they are fully reflected in the price. While powerful, it should not be considered in isolation and often works best when compared with other momentum oscillators.
CCI Signals
Interpreting CCI signals correctly is what transforms this tool from a simple line on a chart into a part of a trading strategy. The most reliable signals often come from divergences and when the CCI moves out of overbought and oversold levels.
Here is a practical strategy to trade CCI signals:
The CCI "Re-Entry" Strategy
This strategy focuses on confirmation to filter out market noise and avoid fighting a strong trend.
Buy Signal (Long Entry):
Wait for the CCI values to fall below -100, entering oversold conditions.
Patiently wait for the CCI to cross back above the -100 level.
Enter a buy order on the next candle for confirmation. This signal suggests that the oversold bounce has momentum.
Sell Signals (Short Entry):
Wait for the CCI moves to rise above +100 into overbought levels.
Patiently wait for the CCI falls back below the +100 level.
Enter a sell order on the next candle. This confirms that the overbought momentum is fading.
Beyond the Basics: The Commodity Channel and Other Indicators
The true power of this versatile indicator is unlocked when used as part of a complete system. The commodity channel provides excellent clues, but those clues are stronger with confirmation.
Combining CCI with Other Indicators
Combining CCI with other indicators is a professional approach to filtering out false signals and improving the probability of a trade. Because the CCI is a momentum oscillator, it pairs well with trend-following tools.
CCI + Moving Averages: Use a long-term moving average to define the overall trend. Only take buy signals from the CCI when the price is above the moving average, and only take sell signals when it's below.
CCI + Volume Analysis: A CCI break above +100 on high volume is a much stronger sign of a breakout than one on low volume. Volume can confirm the conviction behind the CCI's signal.
CCI + Candlestick Patterns: Look for classic reversal patterns like dojis or engulfing candles when the CCI is showing a divergence. This combination provides powerful entry points.
CCI + Fibonacci Retracement
Using Fibonacci levels identifies likely support or resistance points, while CCI shows whether momentum confirms these price levels. A CCI breakout above +100 near a Fibonacci retracement level strengthens the breakout reliability.
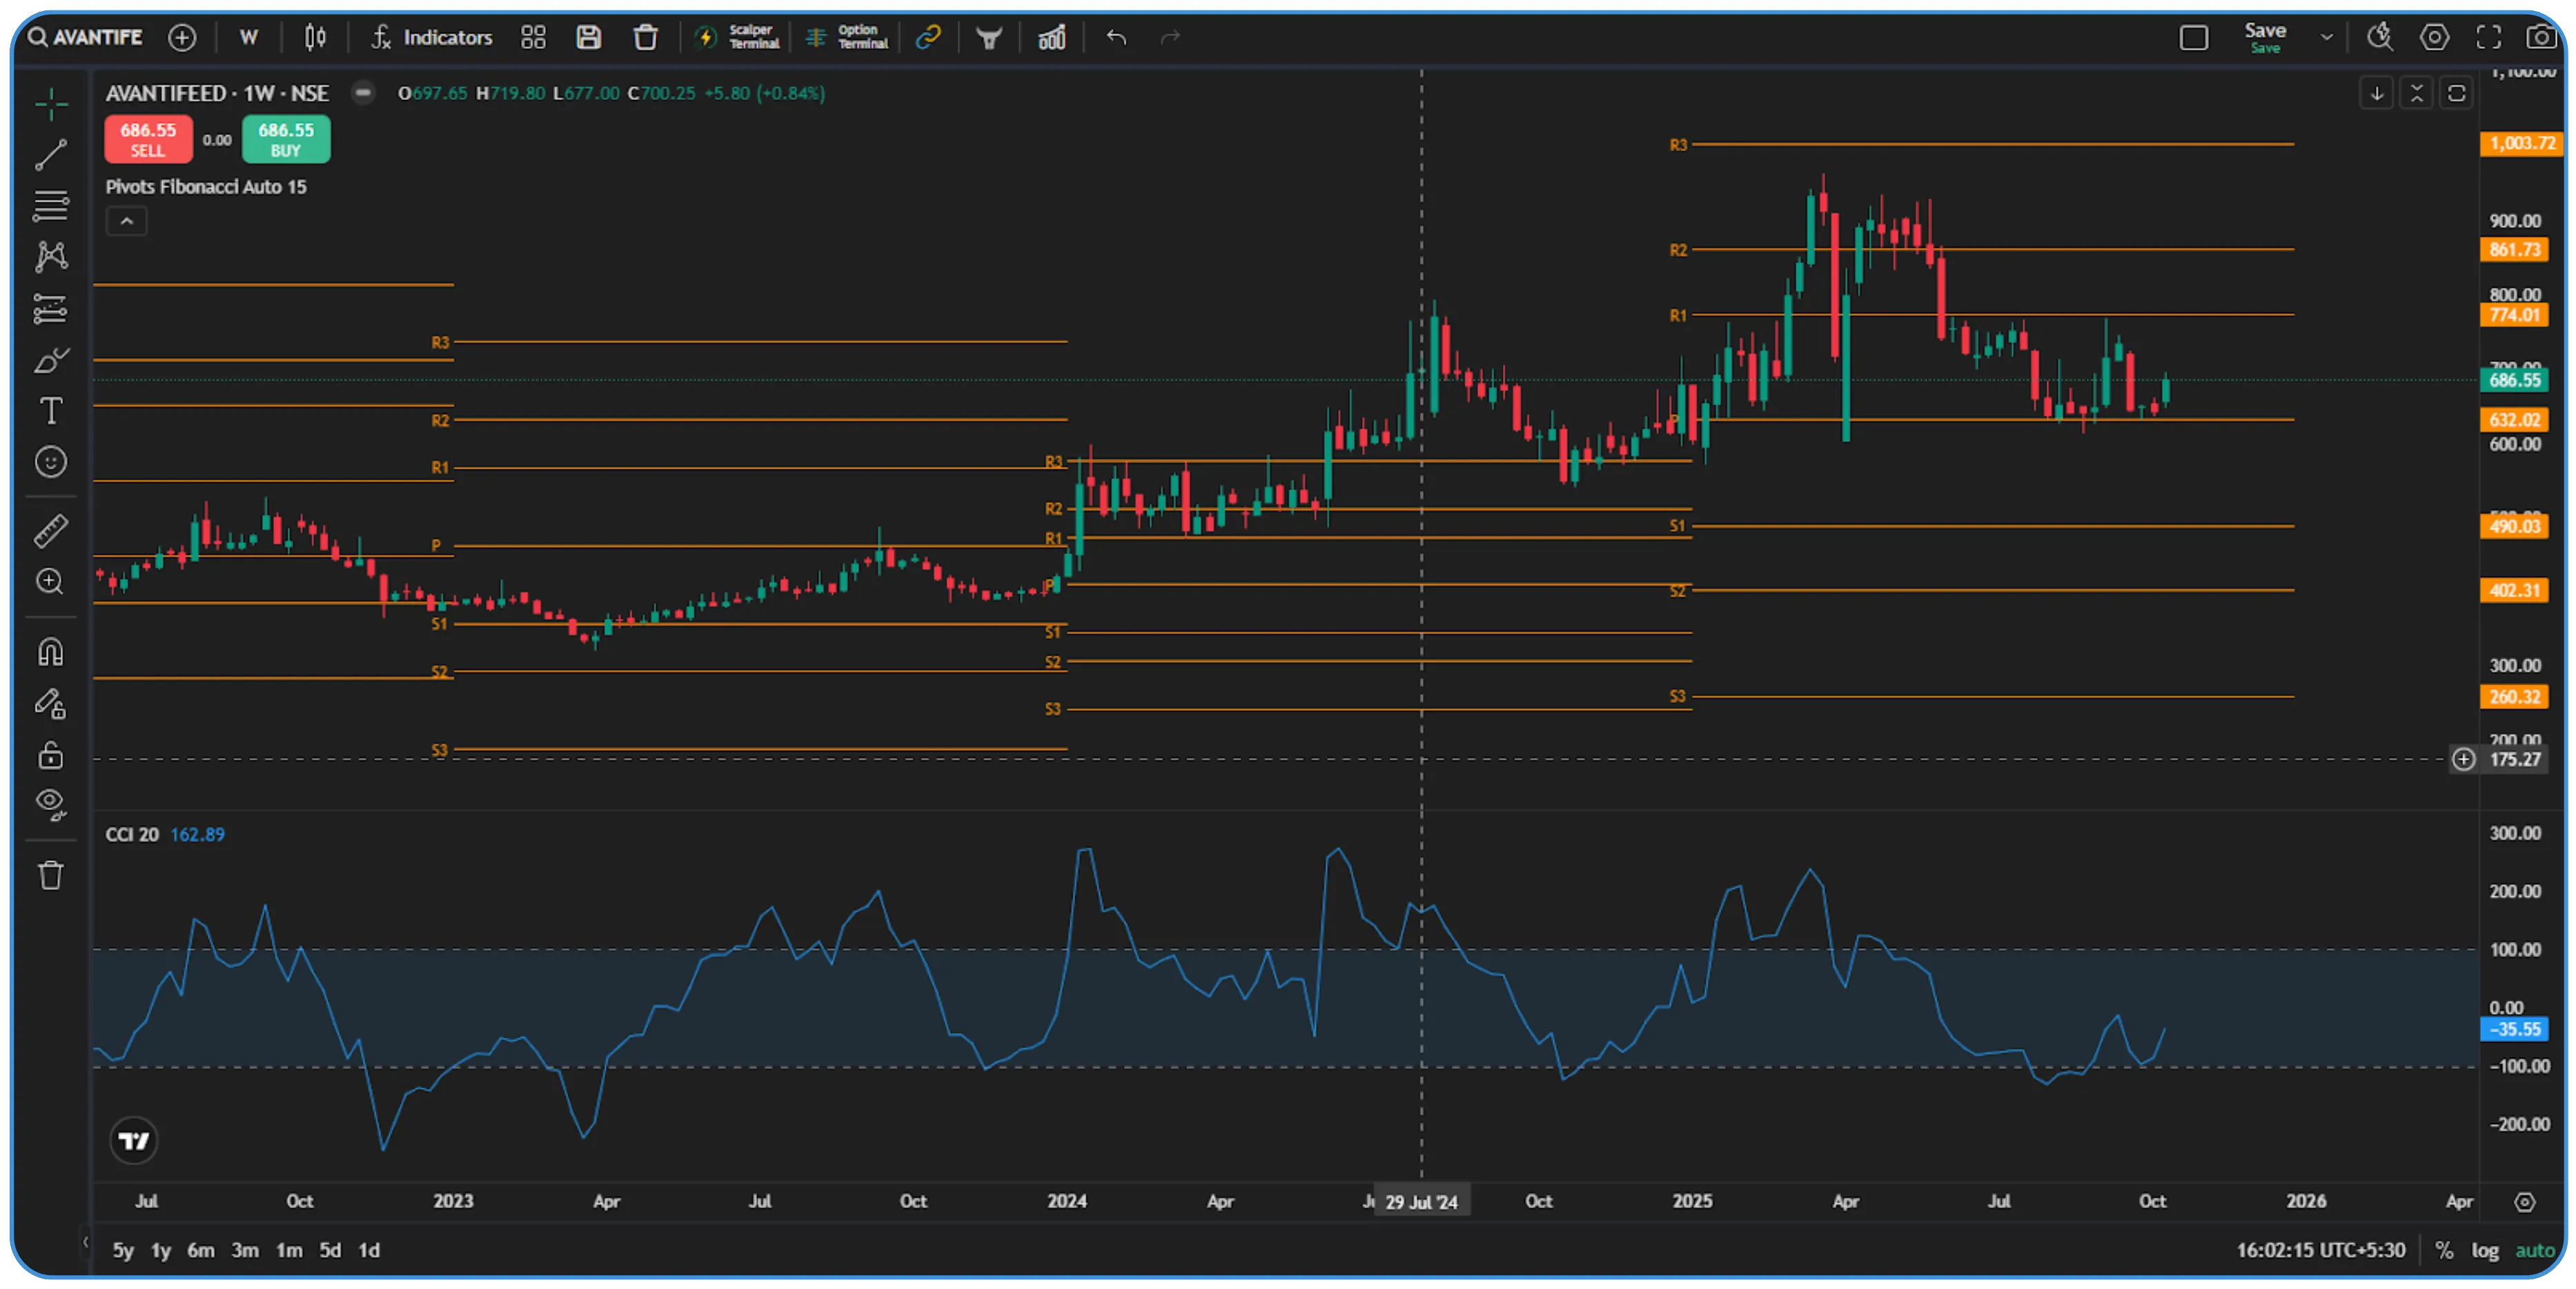
Avanti Feeds demonstrates a recurring cyclical trend, as evidenced by its weekly price chart and the Commodity Channel Index (CCI) indicator. The chart highlights several multi-month cycles consisting of alternating rallies and corrections, with each major reversal closely aligning with extremes on the CCI.
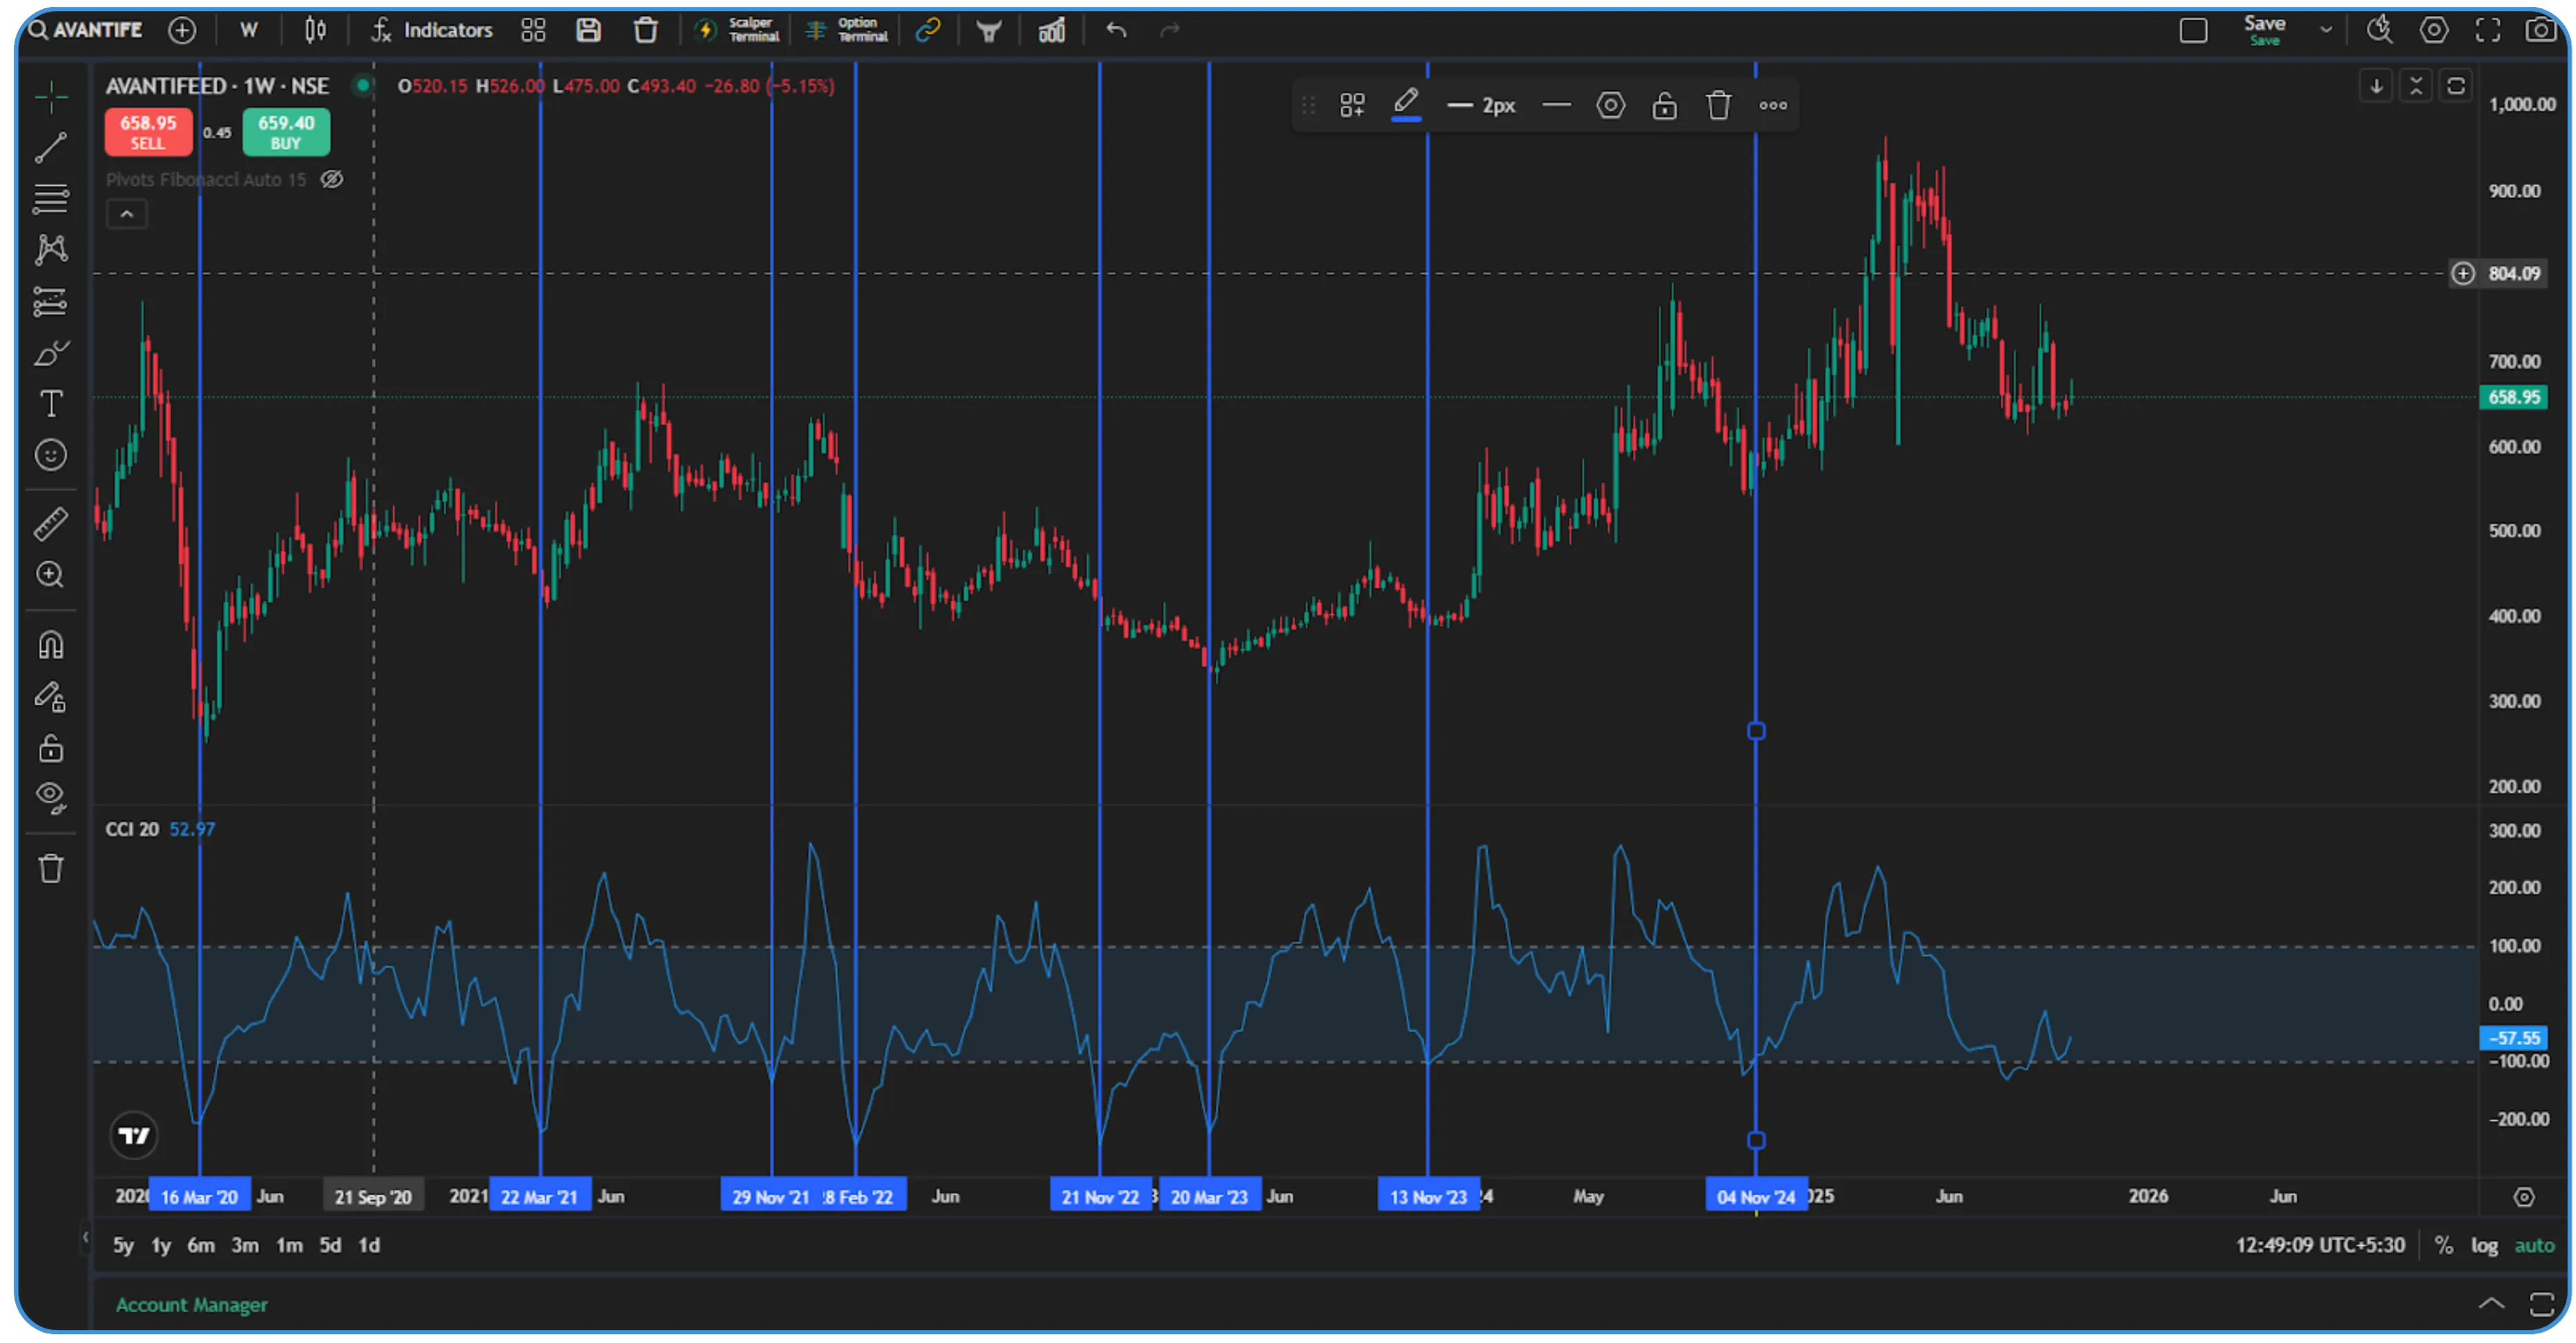
The CCI provides valuable signals by identifying overbought levels above +100 and oversold levels below -100. These thresholds often coincide with important price turning points on the chart, allowing early recognition of the transition between bullish and bearish phases. Such cyclical behaviour may stem from seasonal or business-driven factors, but the CCI effectively filters out noise to pinpoint these regular trend reversals.
Remember, past performance does not guarantee future results, but a well-rounded strategy using the Channel Index can significantly enhance your technical analysis tools. The goal is to use the Channel Index CCI to understand the current price level relative to its recent history and make smarter, more timely trading decisions.
Disclaimer: The information provided in our blogs is for informational purposes only and should not be construed as financial, investment, or trading advice. Trading and investing in the securities market carries risk. Always conduct your own research and consult with a qualified financial advisor before making any investment decisions. Past performance is not indicative of future results. Copyrighted and original content for your trading and investing needs.
© 2025 — Tradejini. All Rights Reserved.