


Charts are nothing but price stories. Every rise, pause, and fall leaves behind a pattern. While no setup guarantees profits, certain stock market chart patterns repeat frequently in Indian markets like NSE and BSE. Here are five powerful patterns every trader should understand.
These patterns appear across multiple timeframes, from intraday charts to long-term weekly charts. However, patterns formed on daily or weekly charts tend to be more reliable because they reflect stronger market participation.
Head and Shoulders
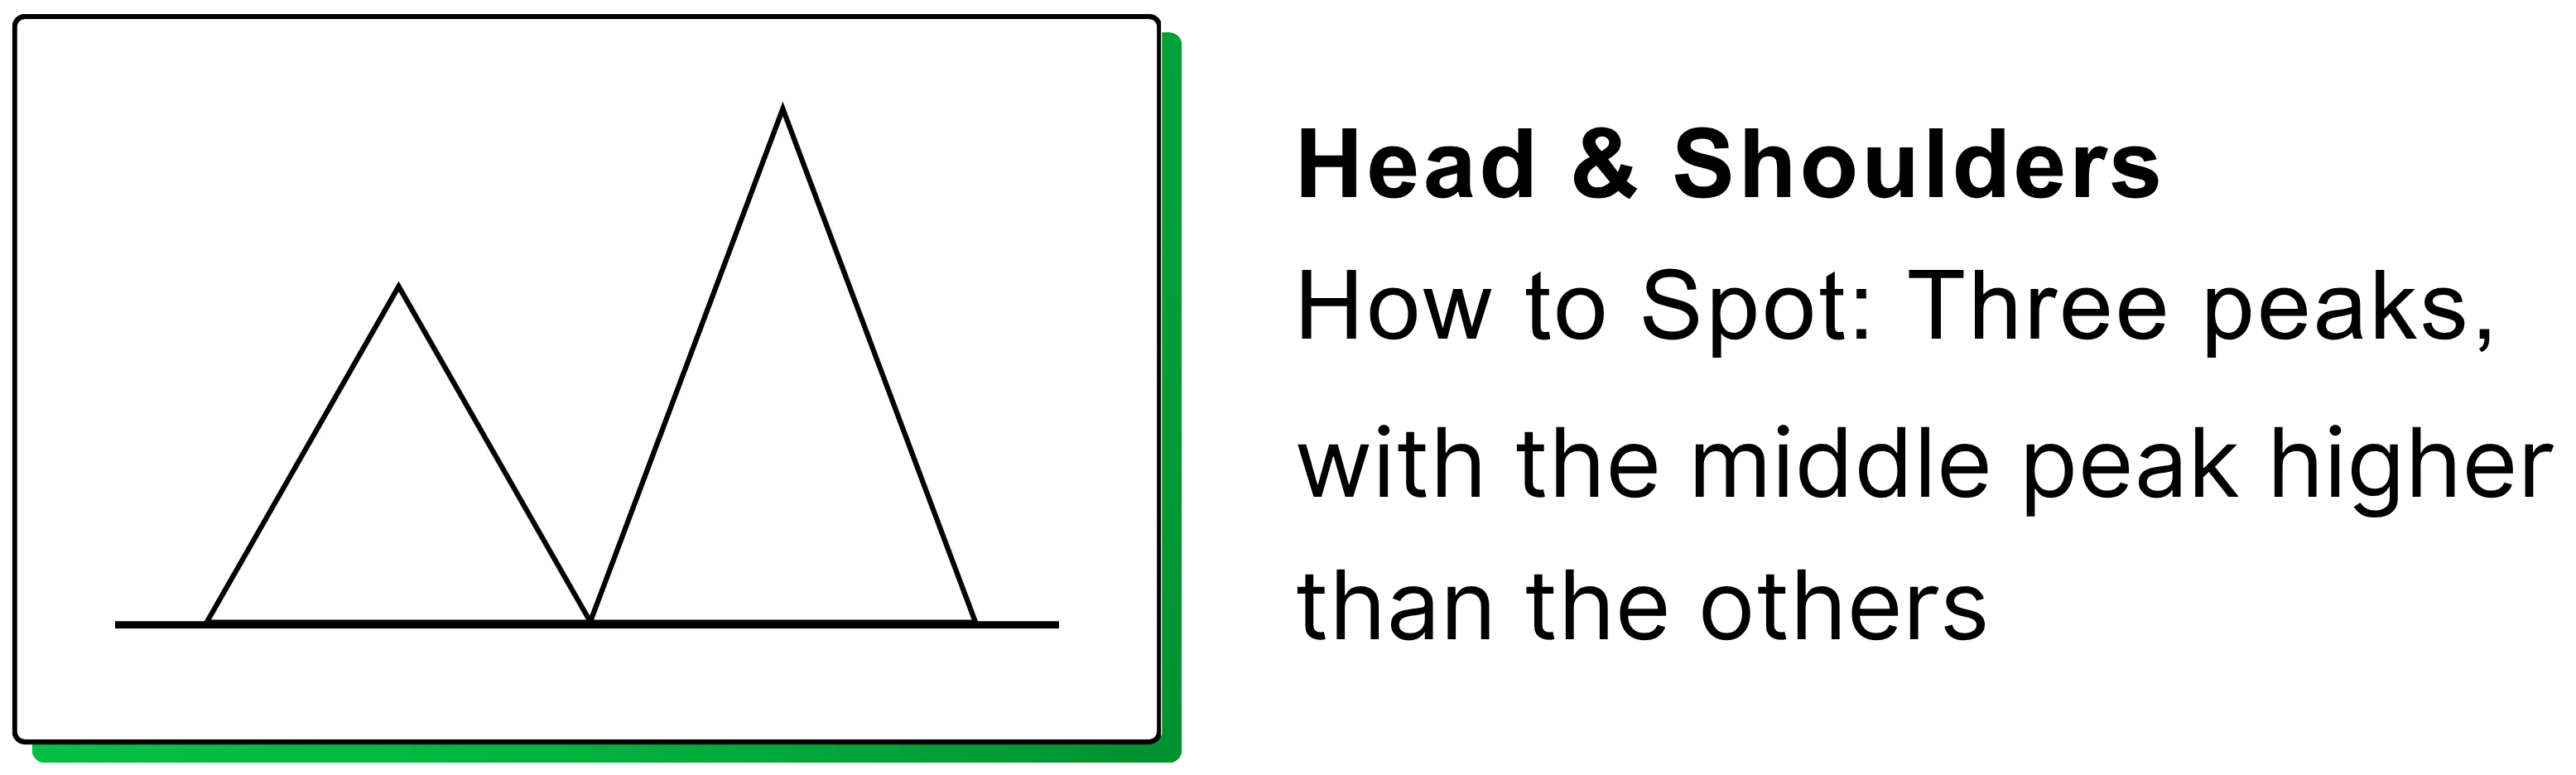
The head and shoulders pattern is one of the most trusted reversal signals in technical analysis. Traders often call it the ‘king’ because of its reliability when properly formed.
What is the Head and Shoulders Pattern?
It consists of three peaks. The middle peak is the highest (the head), and the two smaller peaks on either side are the shoulders. A line connecting the two swing lows forms the neckline.
When price breaks below the neckline with strong volume, it usually signals that the prior uptrend is over and a downtrend may begin.
Market Psychology
The left shoulder forms with strong buying. The head forms as buyers push prices to a new high. But during the right shoulder, buying power weakens. Once the neckline breaks, sellers take control.
Indian Stock Example – Reliance Industries
Around mid-2024, Reliance Industries showed a structure similar to a head and shoulders pattern near ₹2,900. After a break near the ₹2,800 zone, the stock saw short-term weakness toward ₹2,700, illustrating how such patterns can signal potential reversals.
Double Top and Double Bottom
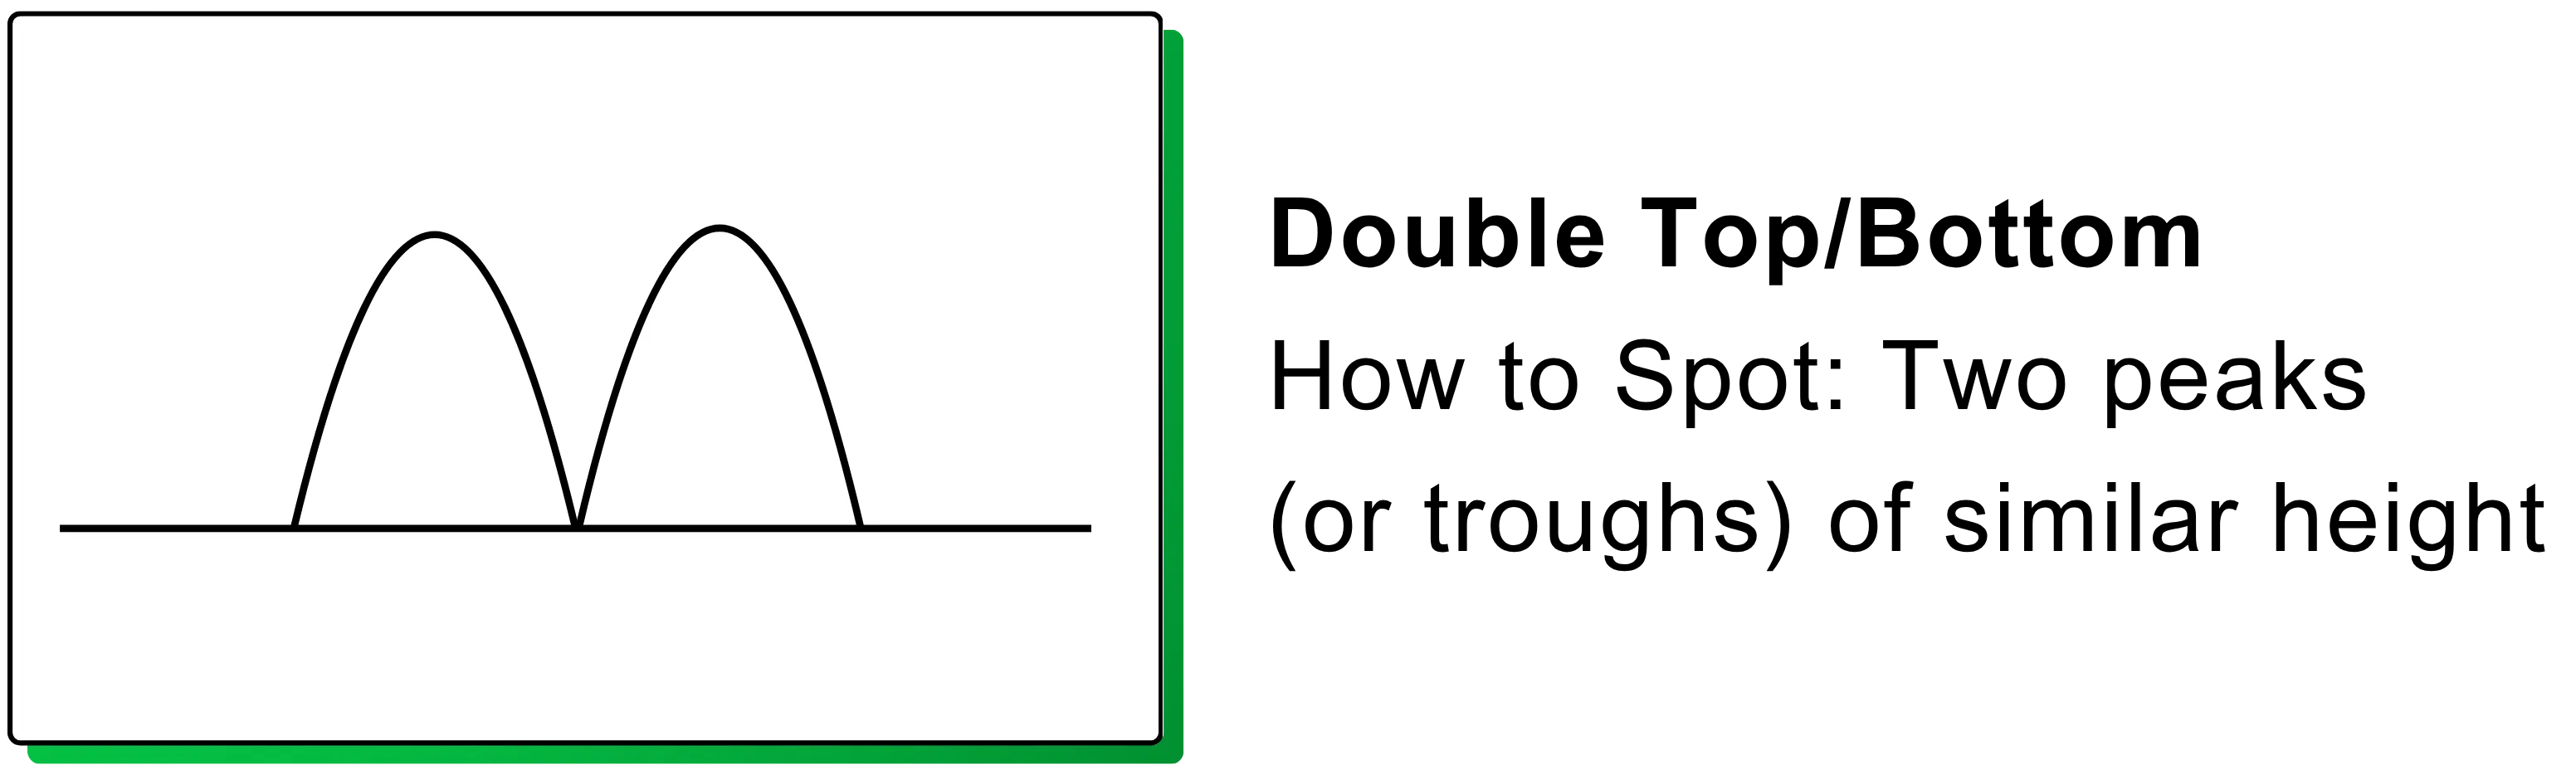
These are among the simplest yet most powerful reversal patterns seen in Indian markets.
Double Top (M-Shaped)
This appears after an uptrend. Price hits resistance twice but fails to break higher. Once it falls below the neckline (support between the two tops), a bearish move often follows.
Double Bottom (W-Shaped)
This forms after a downtrend. Price tests support twice and fails to break lower. A breakout above the neckline signals potential upside.
Example – HDFC Bank
Around 2020, HDFC Bank showed price behaviour resembling a double-top formation before a period of correction, highlighting how repeated resistance levels can sometimes signal a potential reversal.
*Volume often declines on the second top, showing weakening demand. That early clue helps experienced traders prepare for reversal.
Triangle Patterns

Triangle patterns are usually continuation setups. They reflect a period of price consolidation before a breakout.
Ascending Triangle (Bullish Bias)
Flat resistance at the top, rising support below. Buyers keep pushing higher lows. A breakout above resistance often leads to upward continuation.
Descending Triangle (Bearish Bias)
Flat support with falling highs. Sellers are getting aggressive. Breakdown below support can trigger further decline.
Symmetrical Triangle (Neutral)
Both support and resistance converge. Breakout direction decides the next trend.
*Measure the height of the triangle at its widest point and project that distance from the breakout level for a price target. Traders should also watch for false breakouts, where price briefly moves beyond support or resistance but quickly reverses. Many experienced traders wait for confirmation such as strong volume or a candle close beyond the breakout level before entering a trade.
Flag and Pennant

Flags and pennants are short-term continuation patterns. They usually appear after a sharp price move called the flagpole.
Flag Pattern
Looks like a small rectangular consolidation sloping slightly against the main trend. After consolidation, price often resumes in the direction of the original move.
Pennant
A small symmetrical triangle that forms after a sharp rally or fall.
Indian Example – Infosys
In several past rallies, Infosys has shown brief consolidation phases similar to flag patterns before continuing the broader trend..
*Enter on breakout with strong volume. Target equals the length of the flagpole. Keep stop-loss below the consolidation zone.
Cup and Handle ( handle needs to added

The cup and handle is a bullish continuation pattern often seen in growth stocks.
What It Looks Like
First, a rounded bottom forms the ‘cup,’ showing gradual recovery. Then comes a small pullback called the ‘handle.’ A breakout above the handle signals potential continuation.
What It Signals
The cup shows accumulation. The handle shakes out weak hands before the next move higher.
Beginners should avoid trading every pattern they see. Instead, focus on identifying patterns in stocks with strong liquidity and clear trends on exchanges like the National Stock Exchange and the Bombay Stock Exchange. Liquid stocks tend to respect technical levels better and reduce the chances of erratic price movements.
Final Thoughts
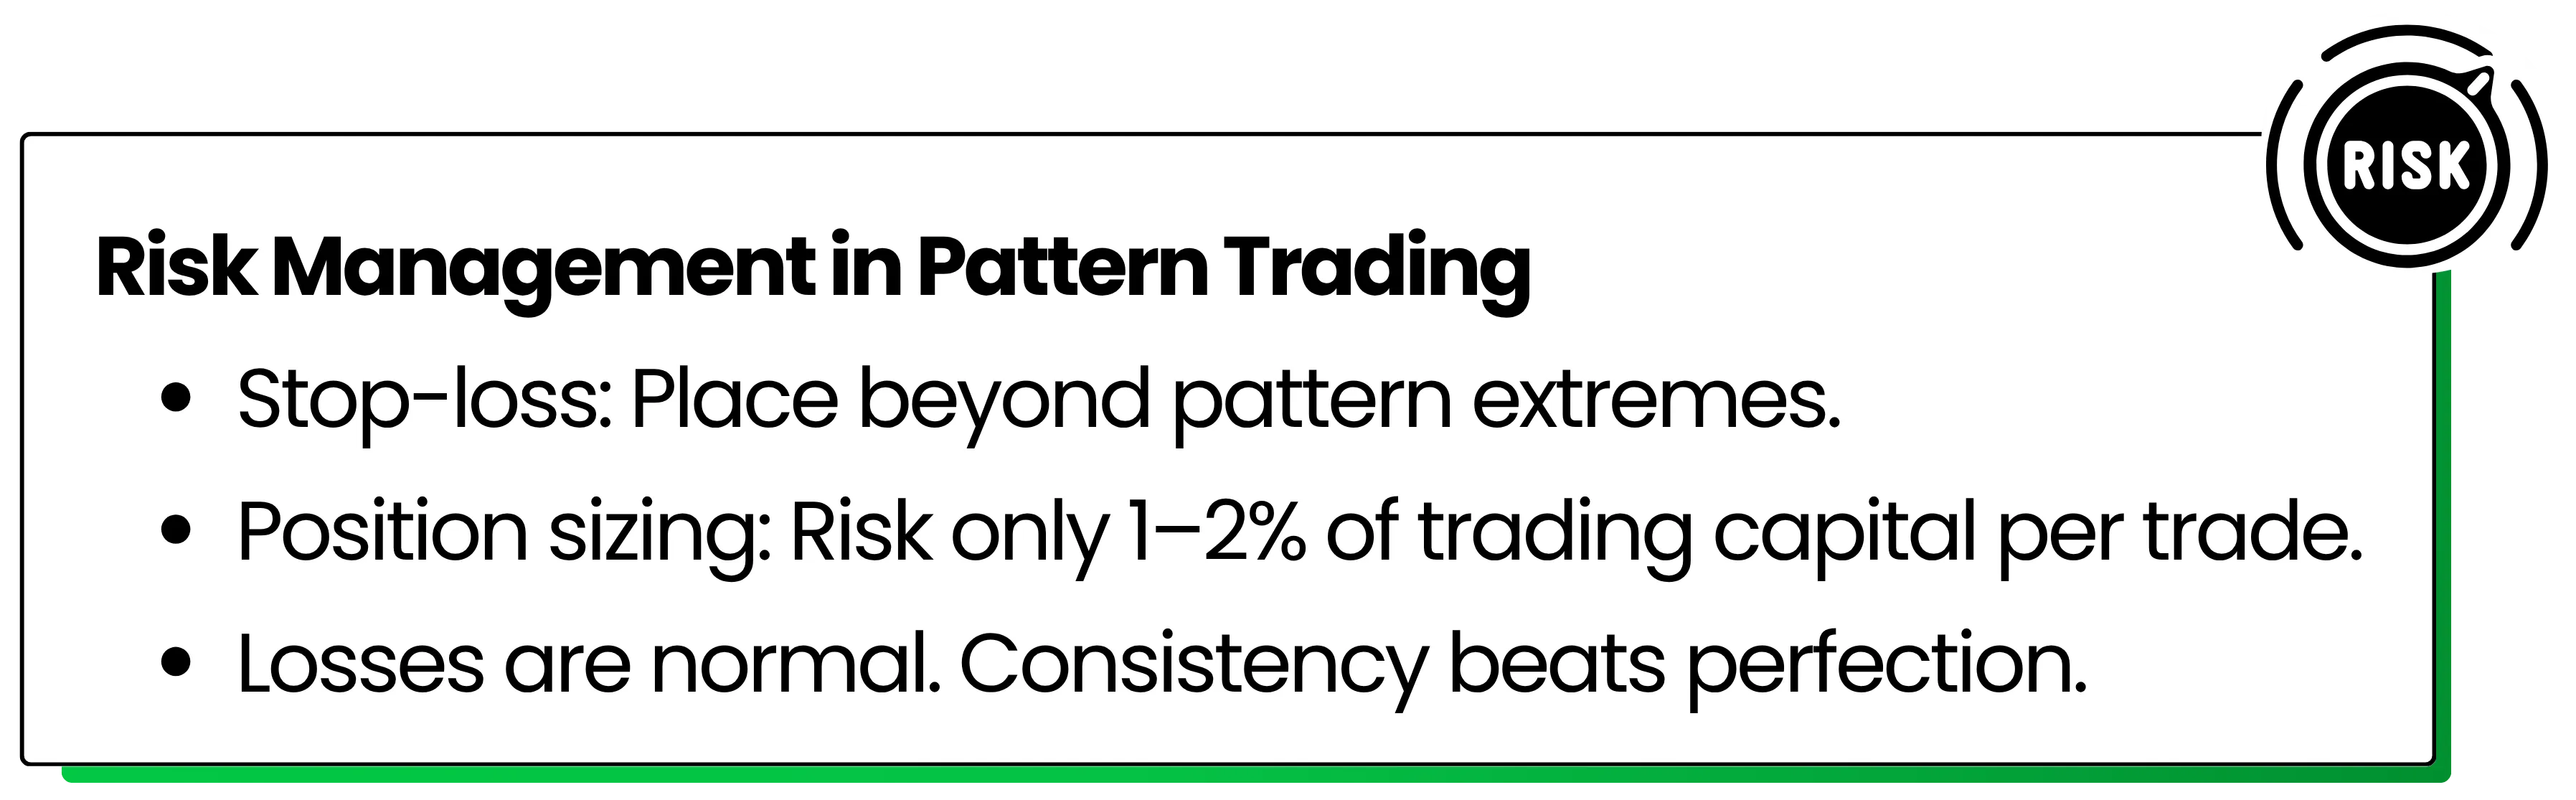
Chart patterns are tools, not guarantees. When combined with volume, broader market context, and proper risk management, they can significantly improve decision-making in Indian markets…
The key is practice. Study charts daily. Track breakouts. Review failures. Over time, patterns stop looking like shapes and start looking like opportunities.
Disclaimer: The information provided in our blogs is for informational purposes only and should not be construed as financial, investment, or trading advice. Trading and investing in the securities market carries risk. Always conduct your own research and consult with a qualified financial advisor before making any investment decisions. Past performance is not indicative of future results. Copyrighted and original content for your trading and investing needs.
© 2026 — Tradejini. All Rights Reserved.


