


Understanding market concepts is important, but applying that knowledge starts with learning how to use a trading terminal. This is the platform where you search for stocks, place buy or sell orders, and monitor price movements in real time. In other words, it's your primary workspace as a trader or investor.
Let me introduce you to the trading terminal and explain how it works and its key features using simple, practical examples, such as buying a share of Apollo or tracking the price of Rategain.
First, What Is a Trading Terminal?
Think of it as your cockpit. The place where you control everything, from placing a trade to tracking market action to checking how much cash you have left.
Whether you're using a broker's website or app, it all boils down to this dashboard. Once you're logged in, it’s where you:
- Add stocks to your watchlist
- Buy or sell
- Check price movement on the chart
- See how your trades are doing
- Manage your funds
You can access this through the Tradejini browser or our mobile app, CubePlus.
Logging In
Trading accounts are sensitive. You’re moving money and assets here, so security is tight, as it should be. Typically, you will enter:
- Your username (UCC) and password
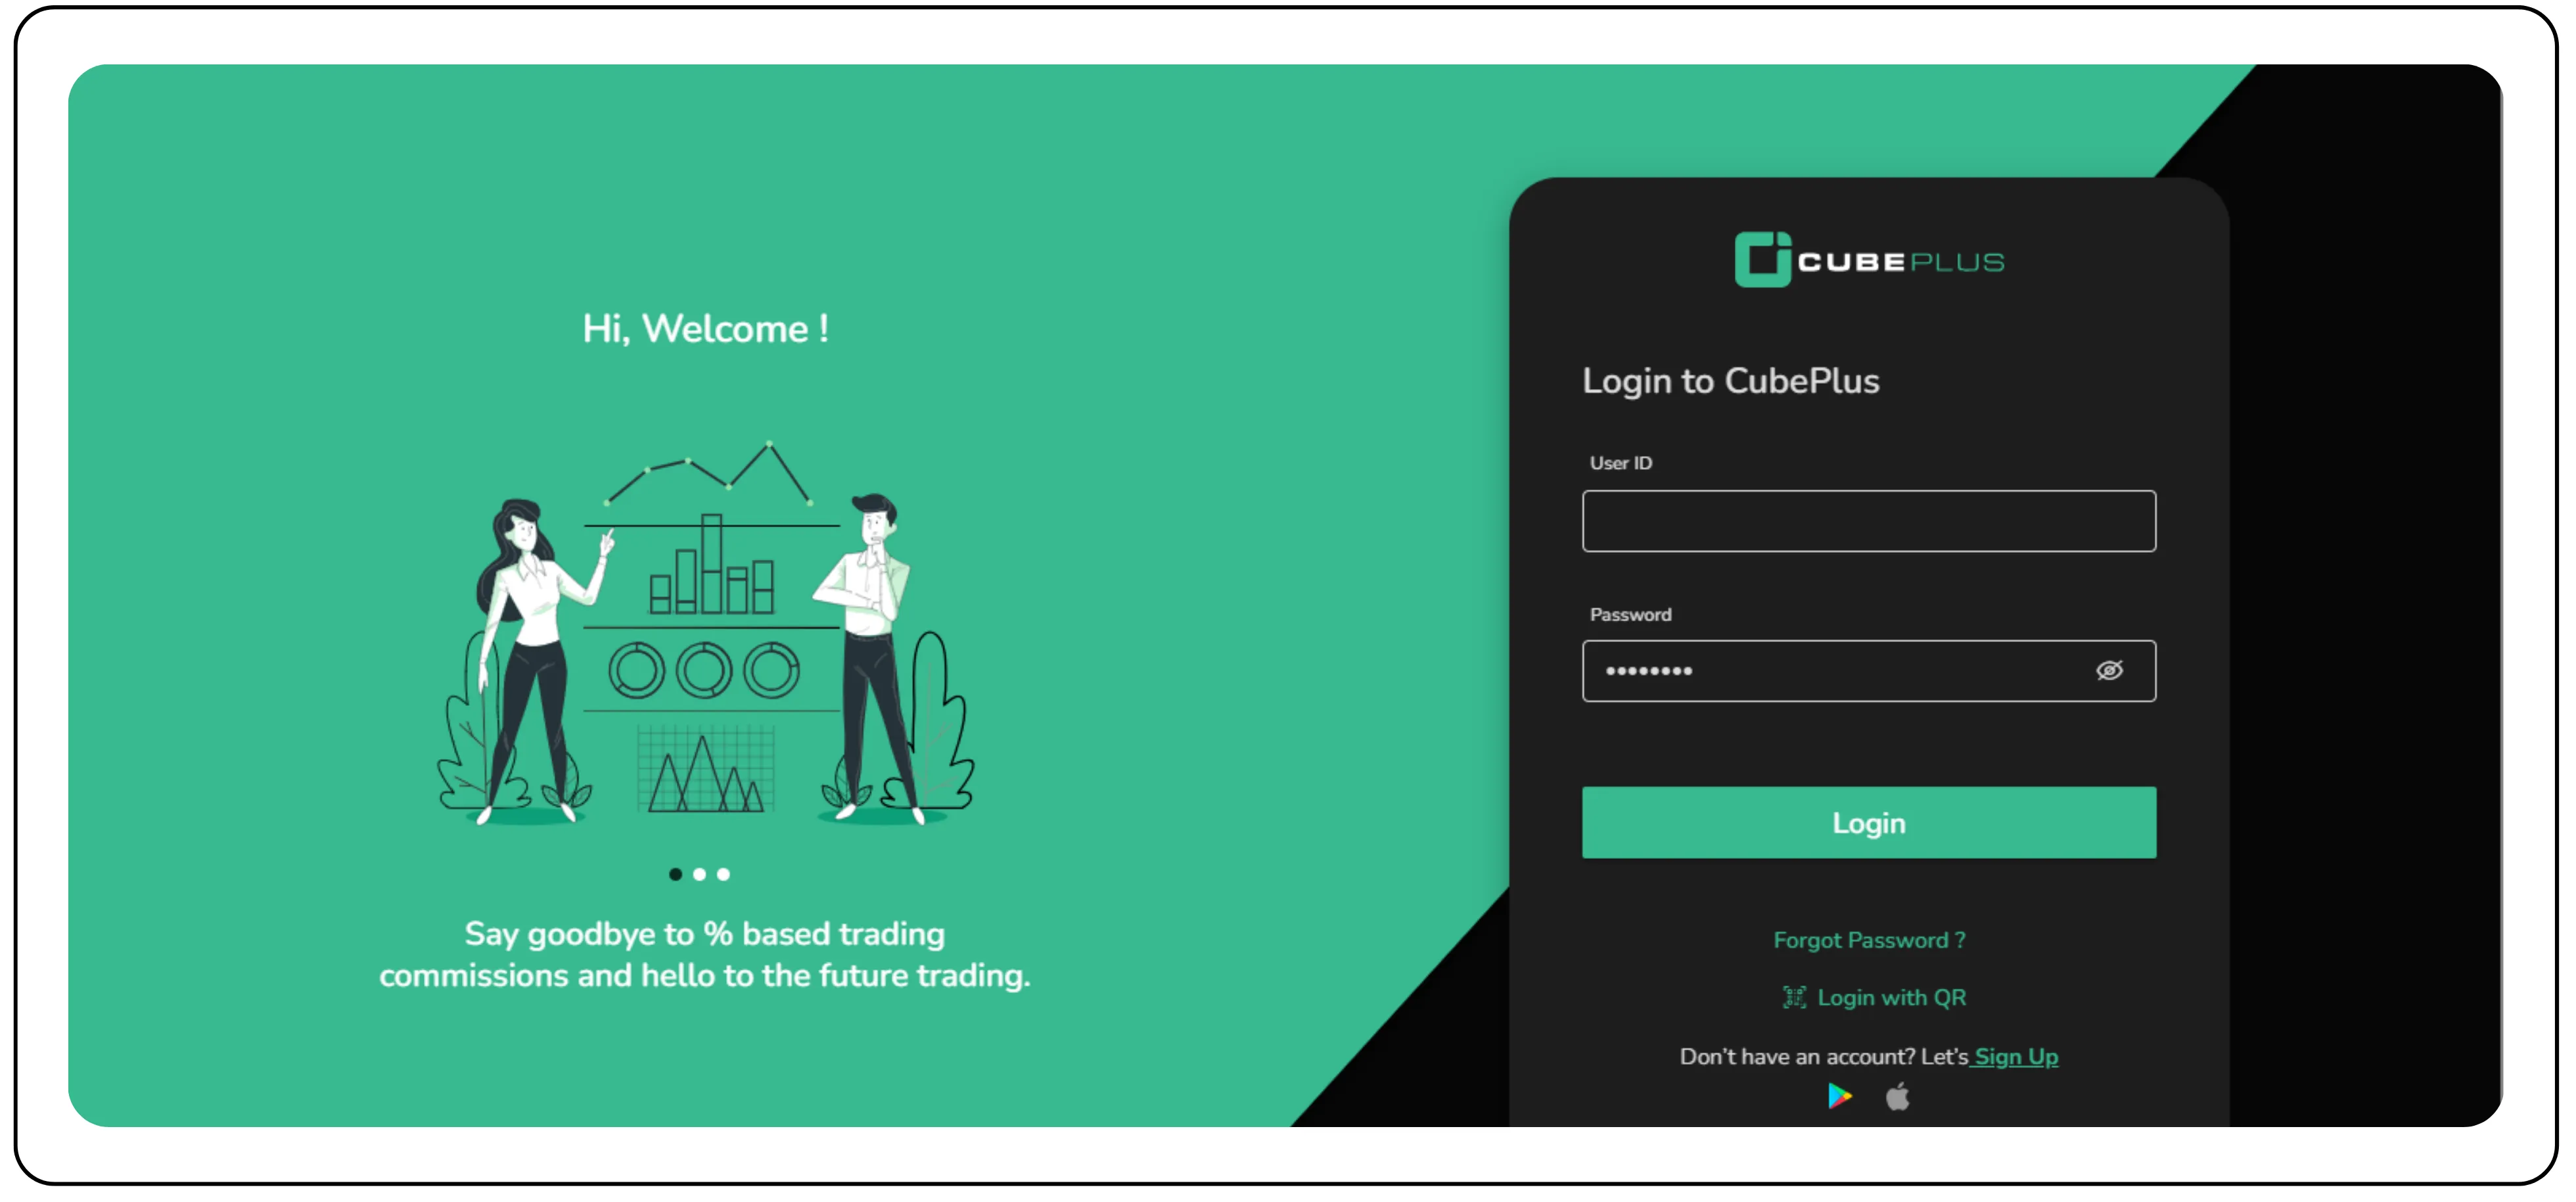
- Then a second step, like a time-based OTP (from an app like Google Authenticator)
Once you are in.
Setting Up Your Workspace
Your watchlist is like your personal radar; it highlights the stocks you care about. Start simple, with one or a handful of familiar names, say 5 to 6.
For example, if you want to track Apollo Hospitals Enterprise Ltd., just search for it and add it to your list. Do the same for Bharti Airtel, Senores, RateGain, and Indus Towers.
In no time, these stocks will start updating live right in front of you.
You’ll be able to see:
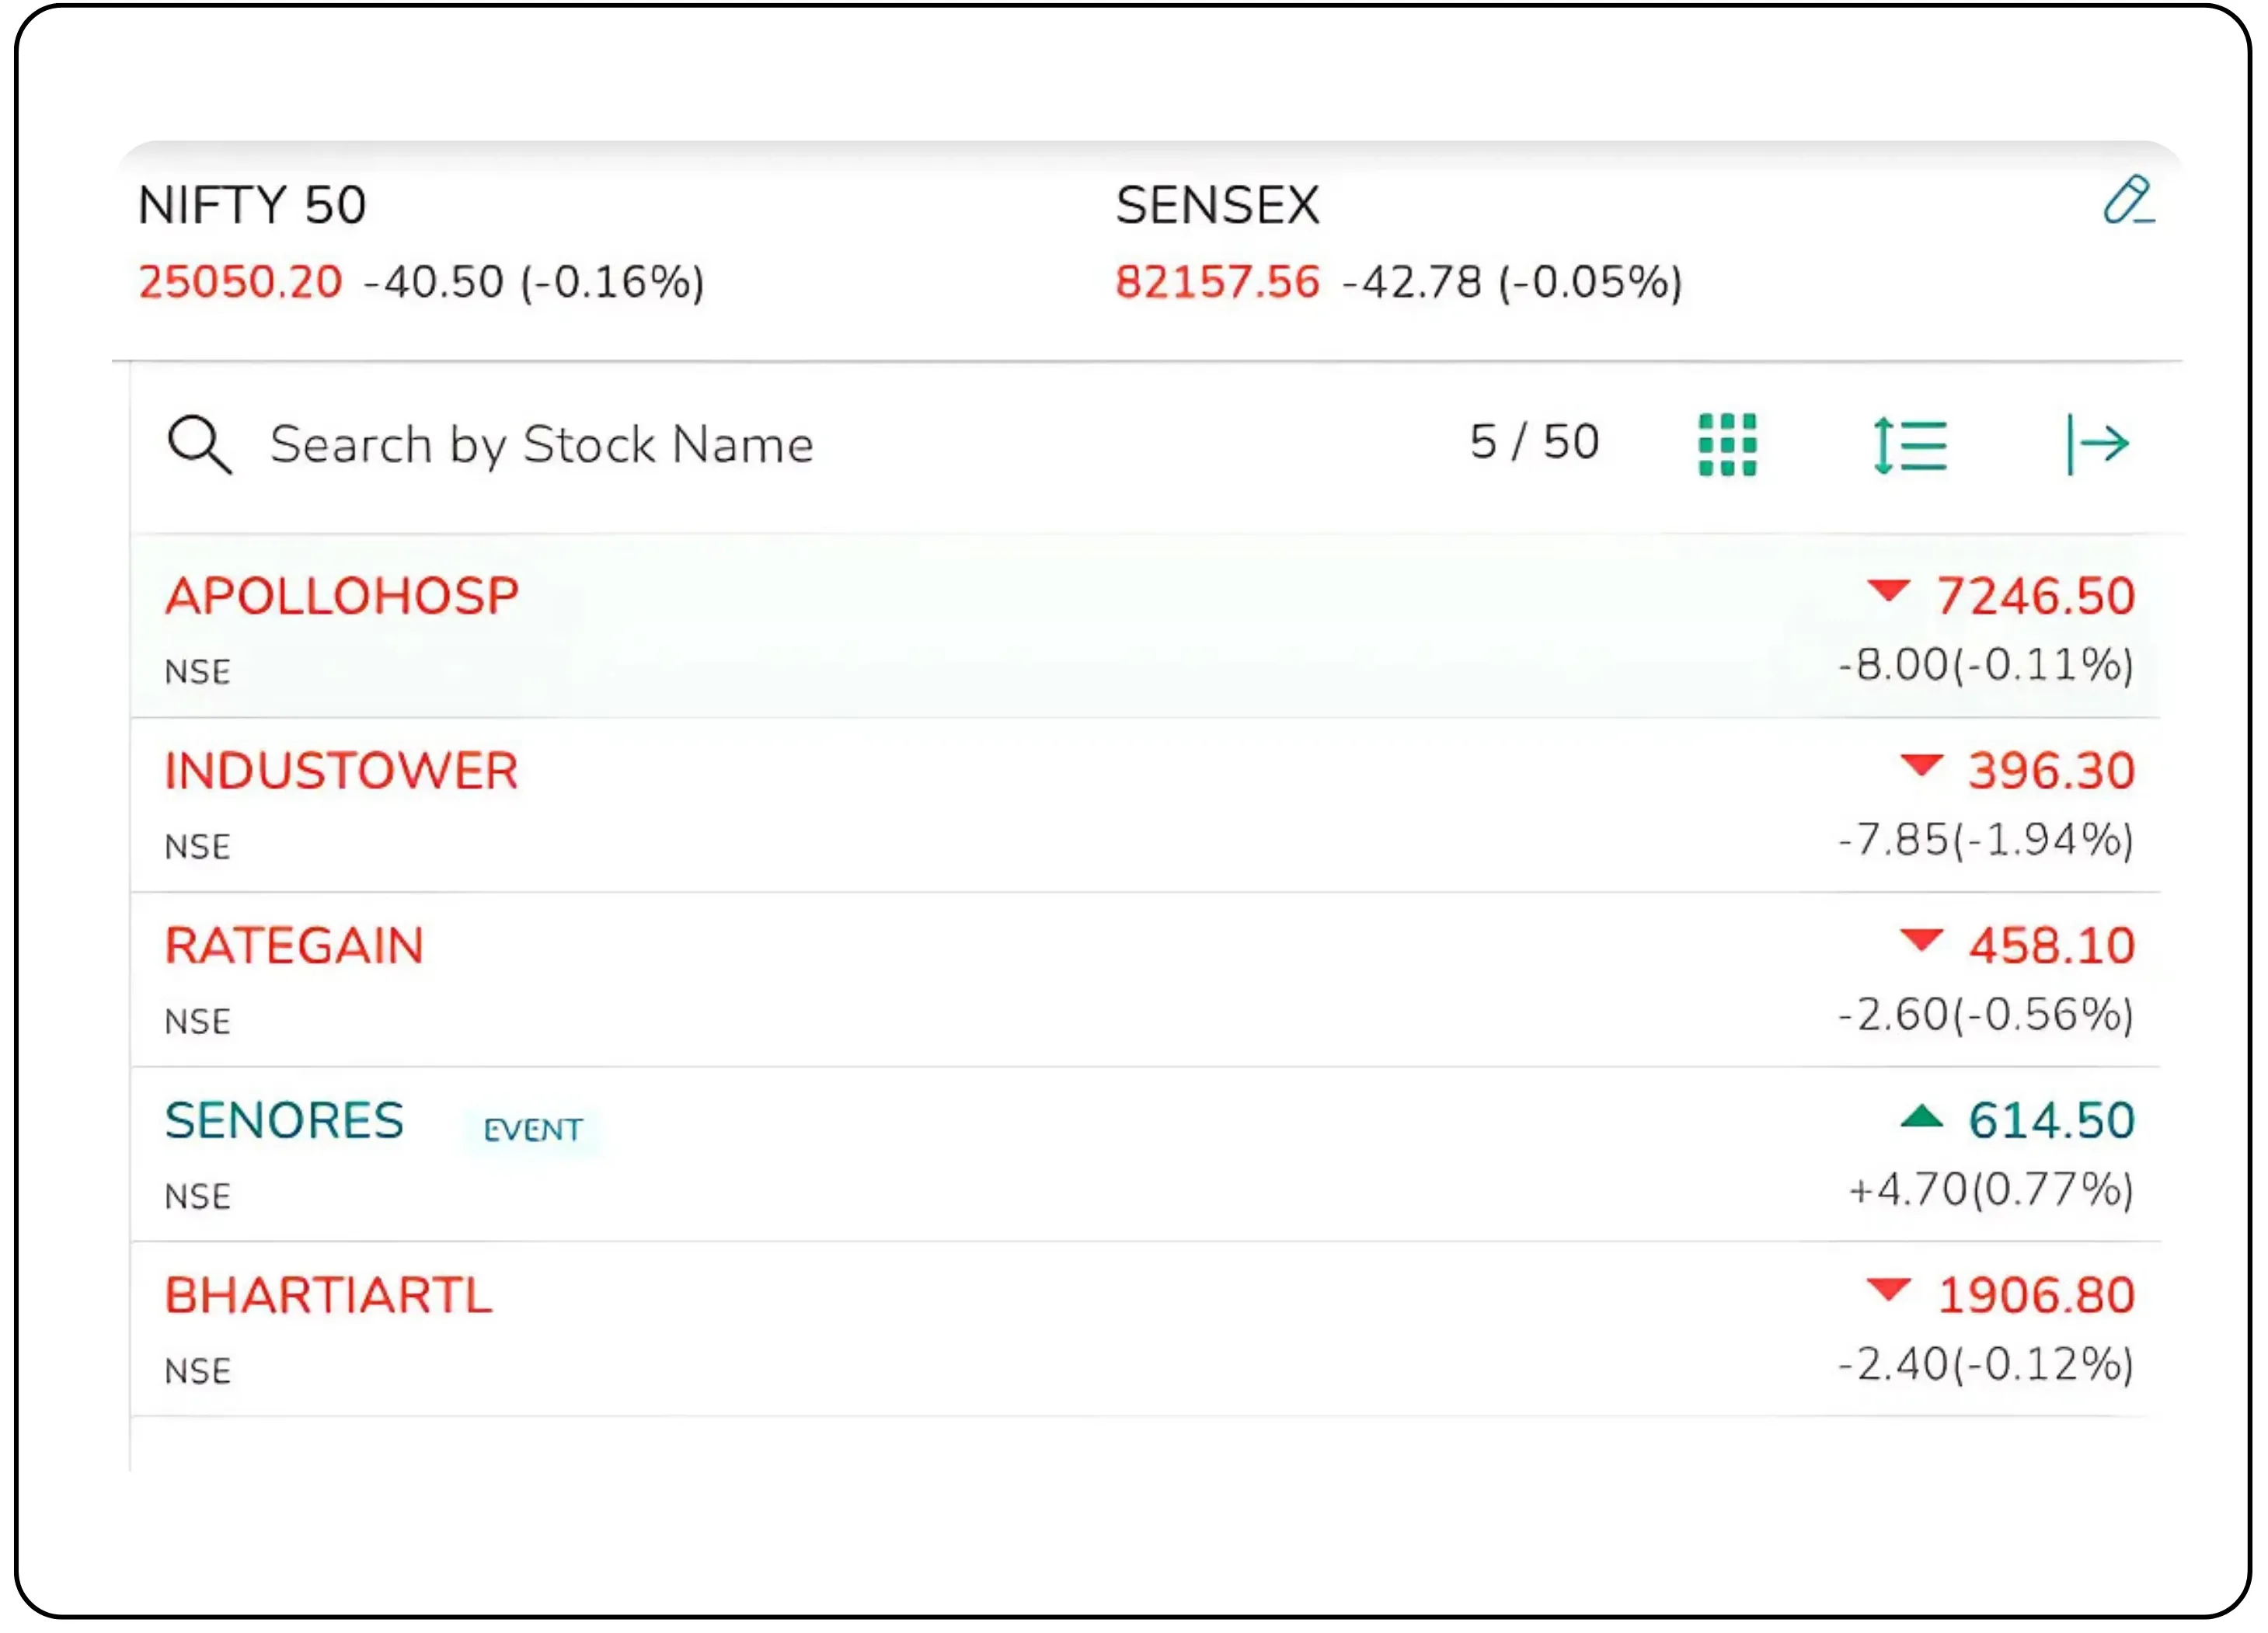
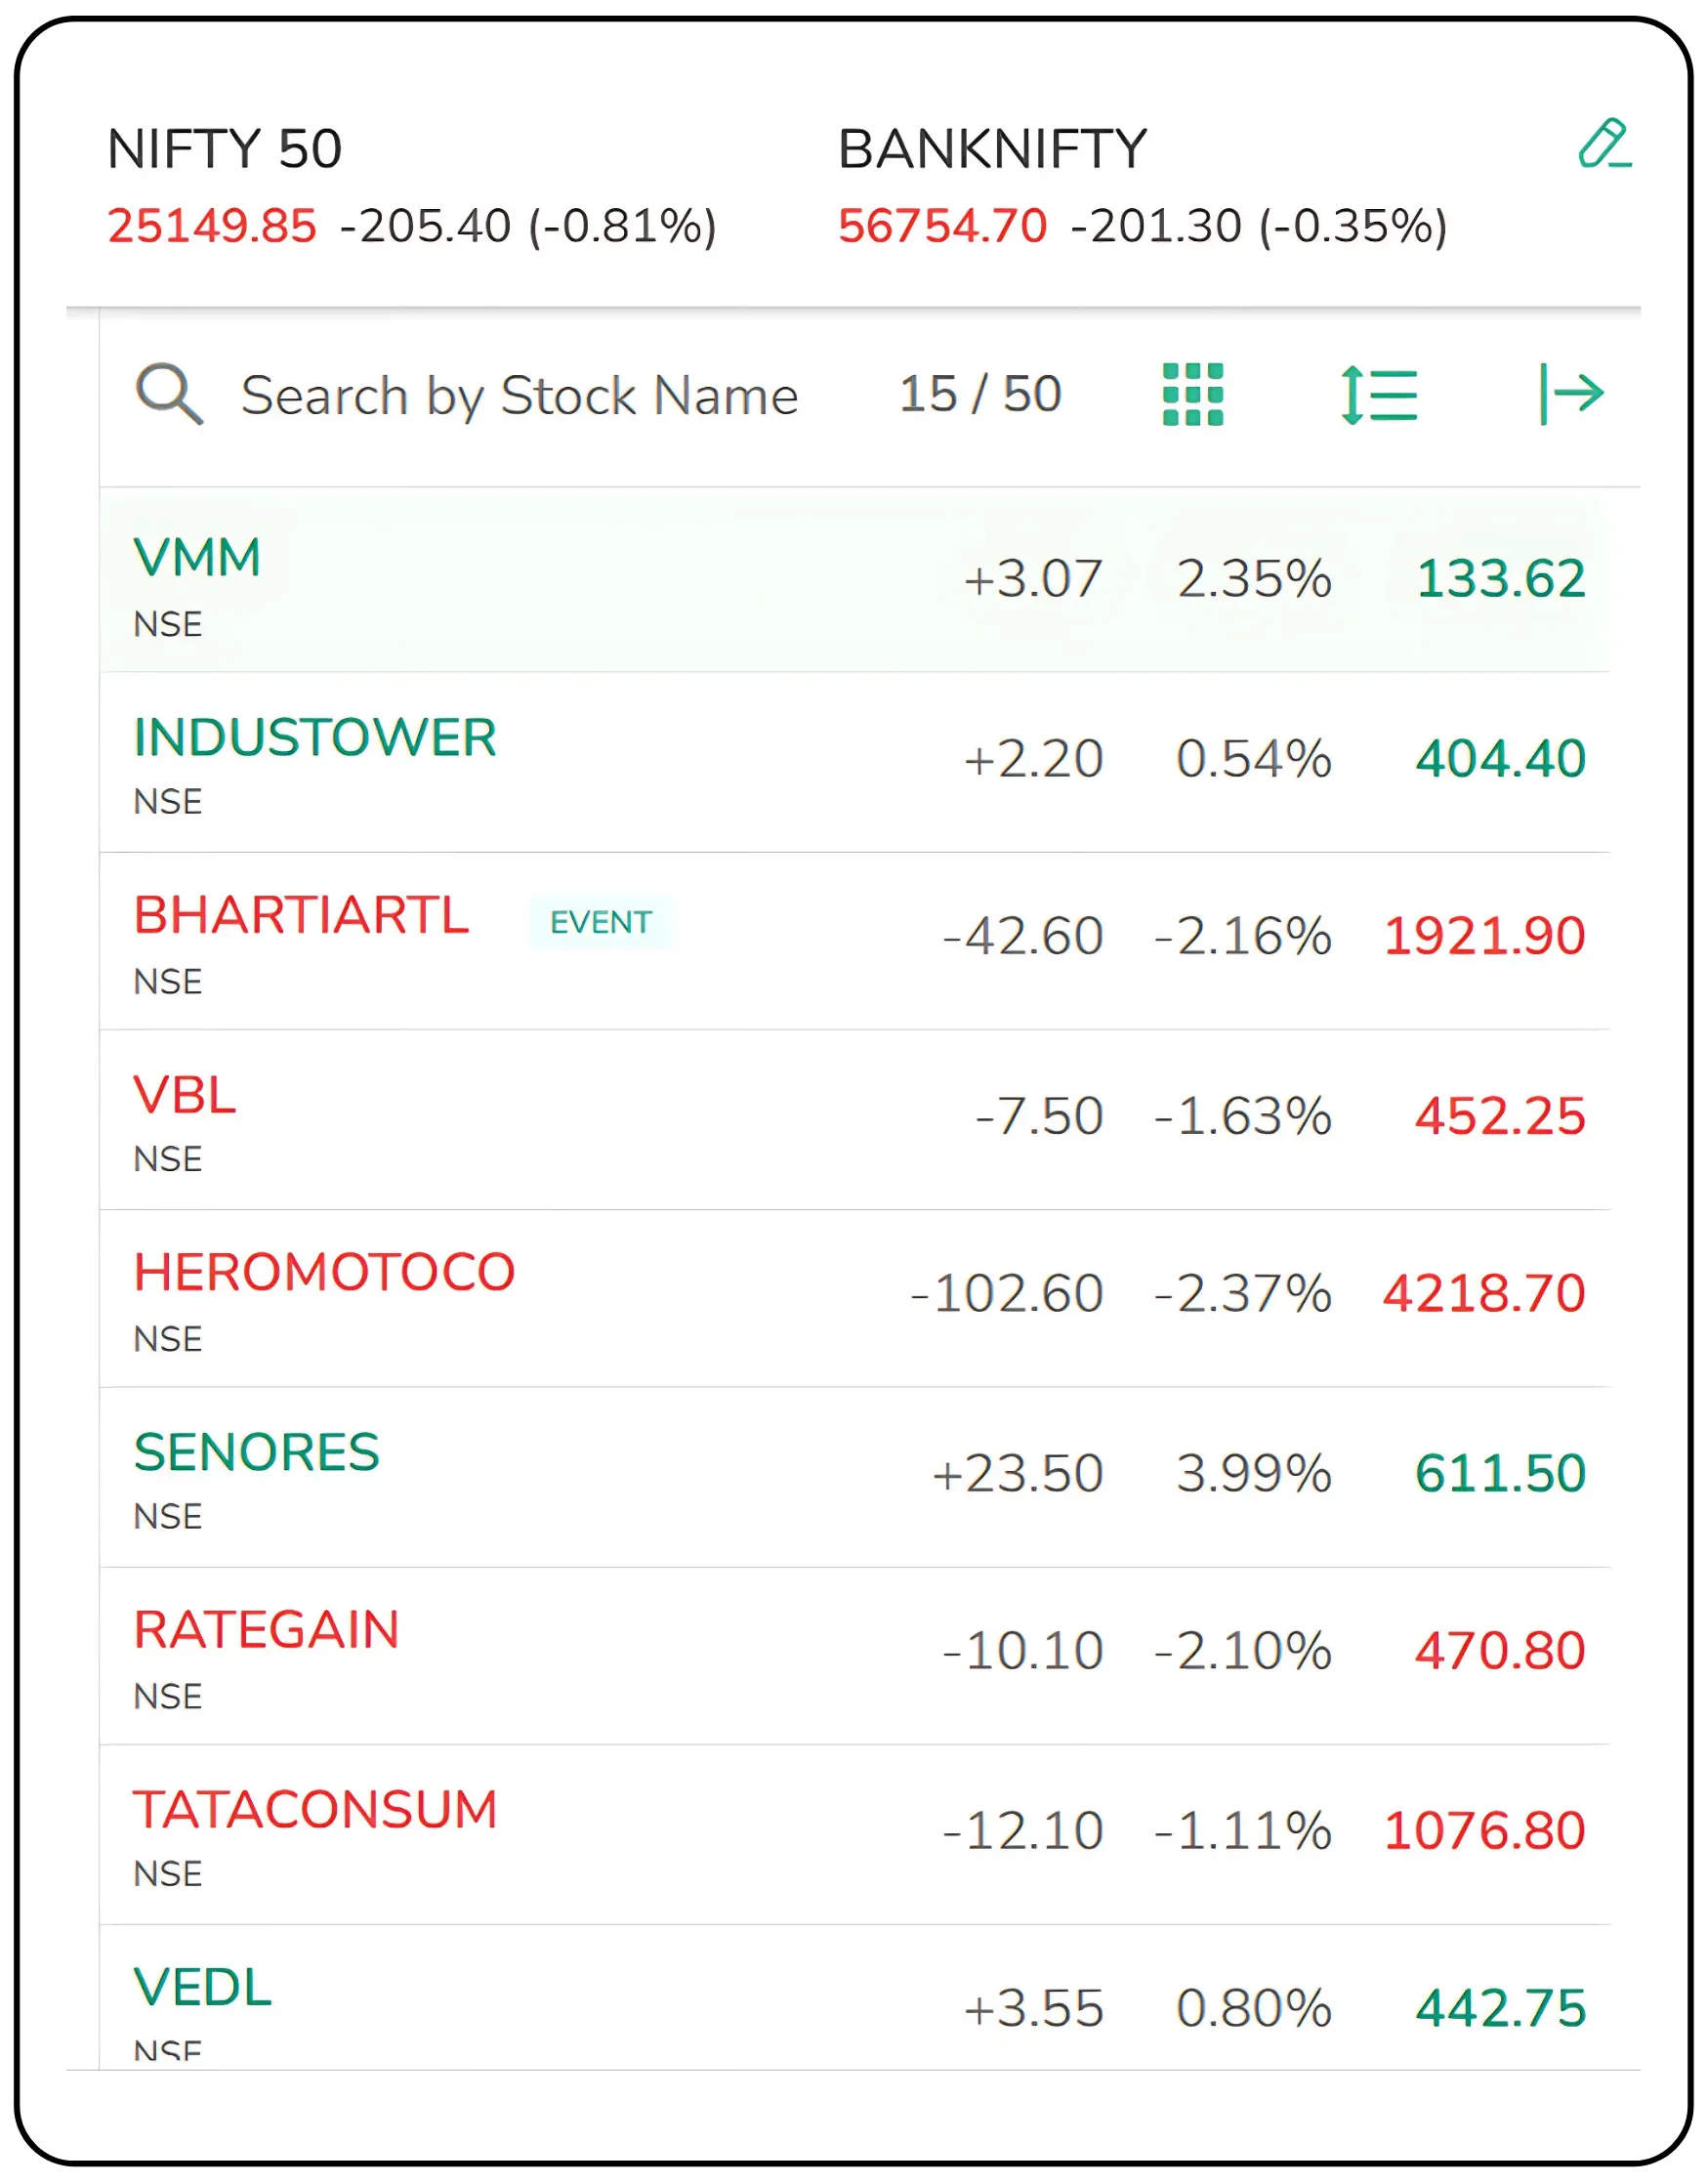
Here is what you see in the watchlist next to the stock name:
Change (₹): This indicates the actual rupee difference between the current price (LTP) and the previous closing price.
% Change: This shows how much the stock's price has moved compared to the previous day’s closing price, expressed as a percentage.
LTP (Last Traded Price): It shows what the stock price is currently trading at in the market.
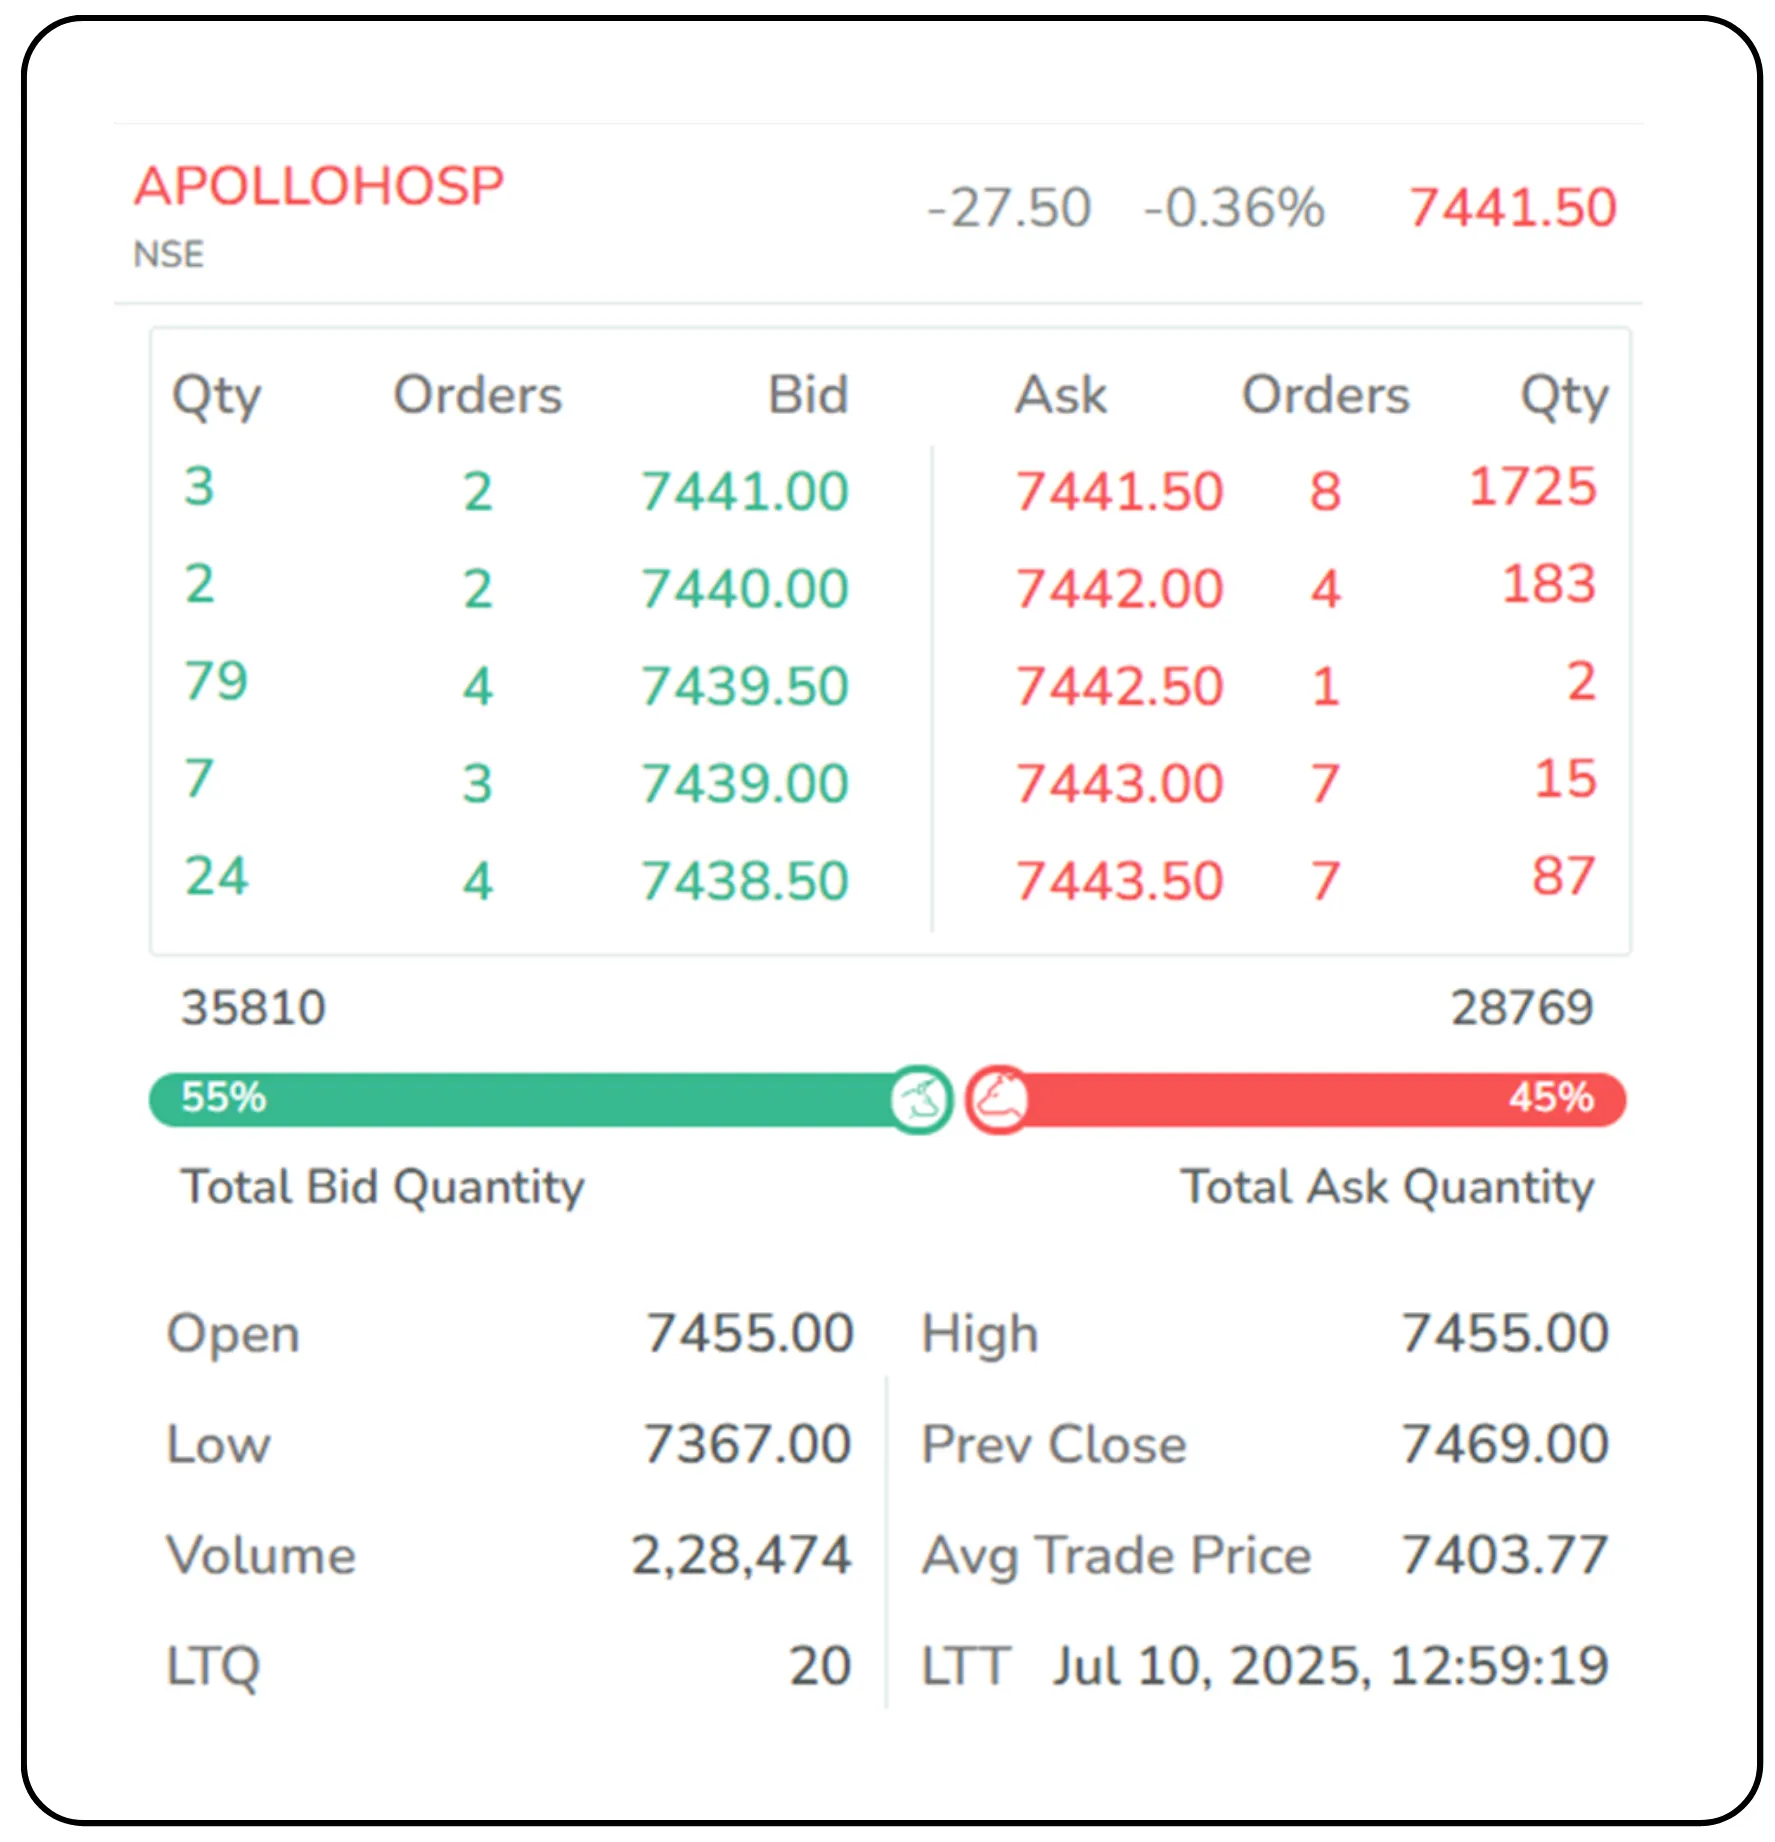
You can view details like Bid and Ask prices, as well as High, Low, Open, and Volume data by clicking on Market Depth, as shown in the image below. These are only visible when you need more in-depth information.
You don’t need to obsess over every stat here, but understanding how price, volume, and change interact gives you a quick pulse of the stock.
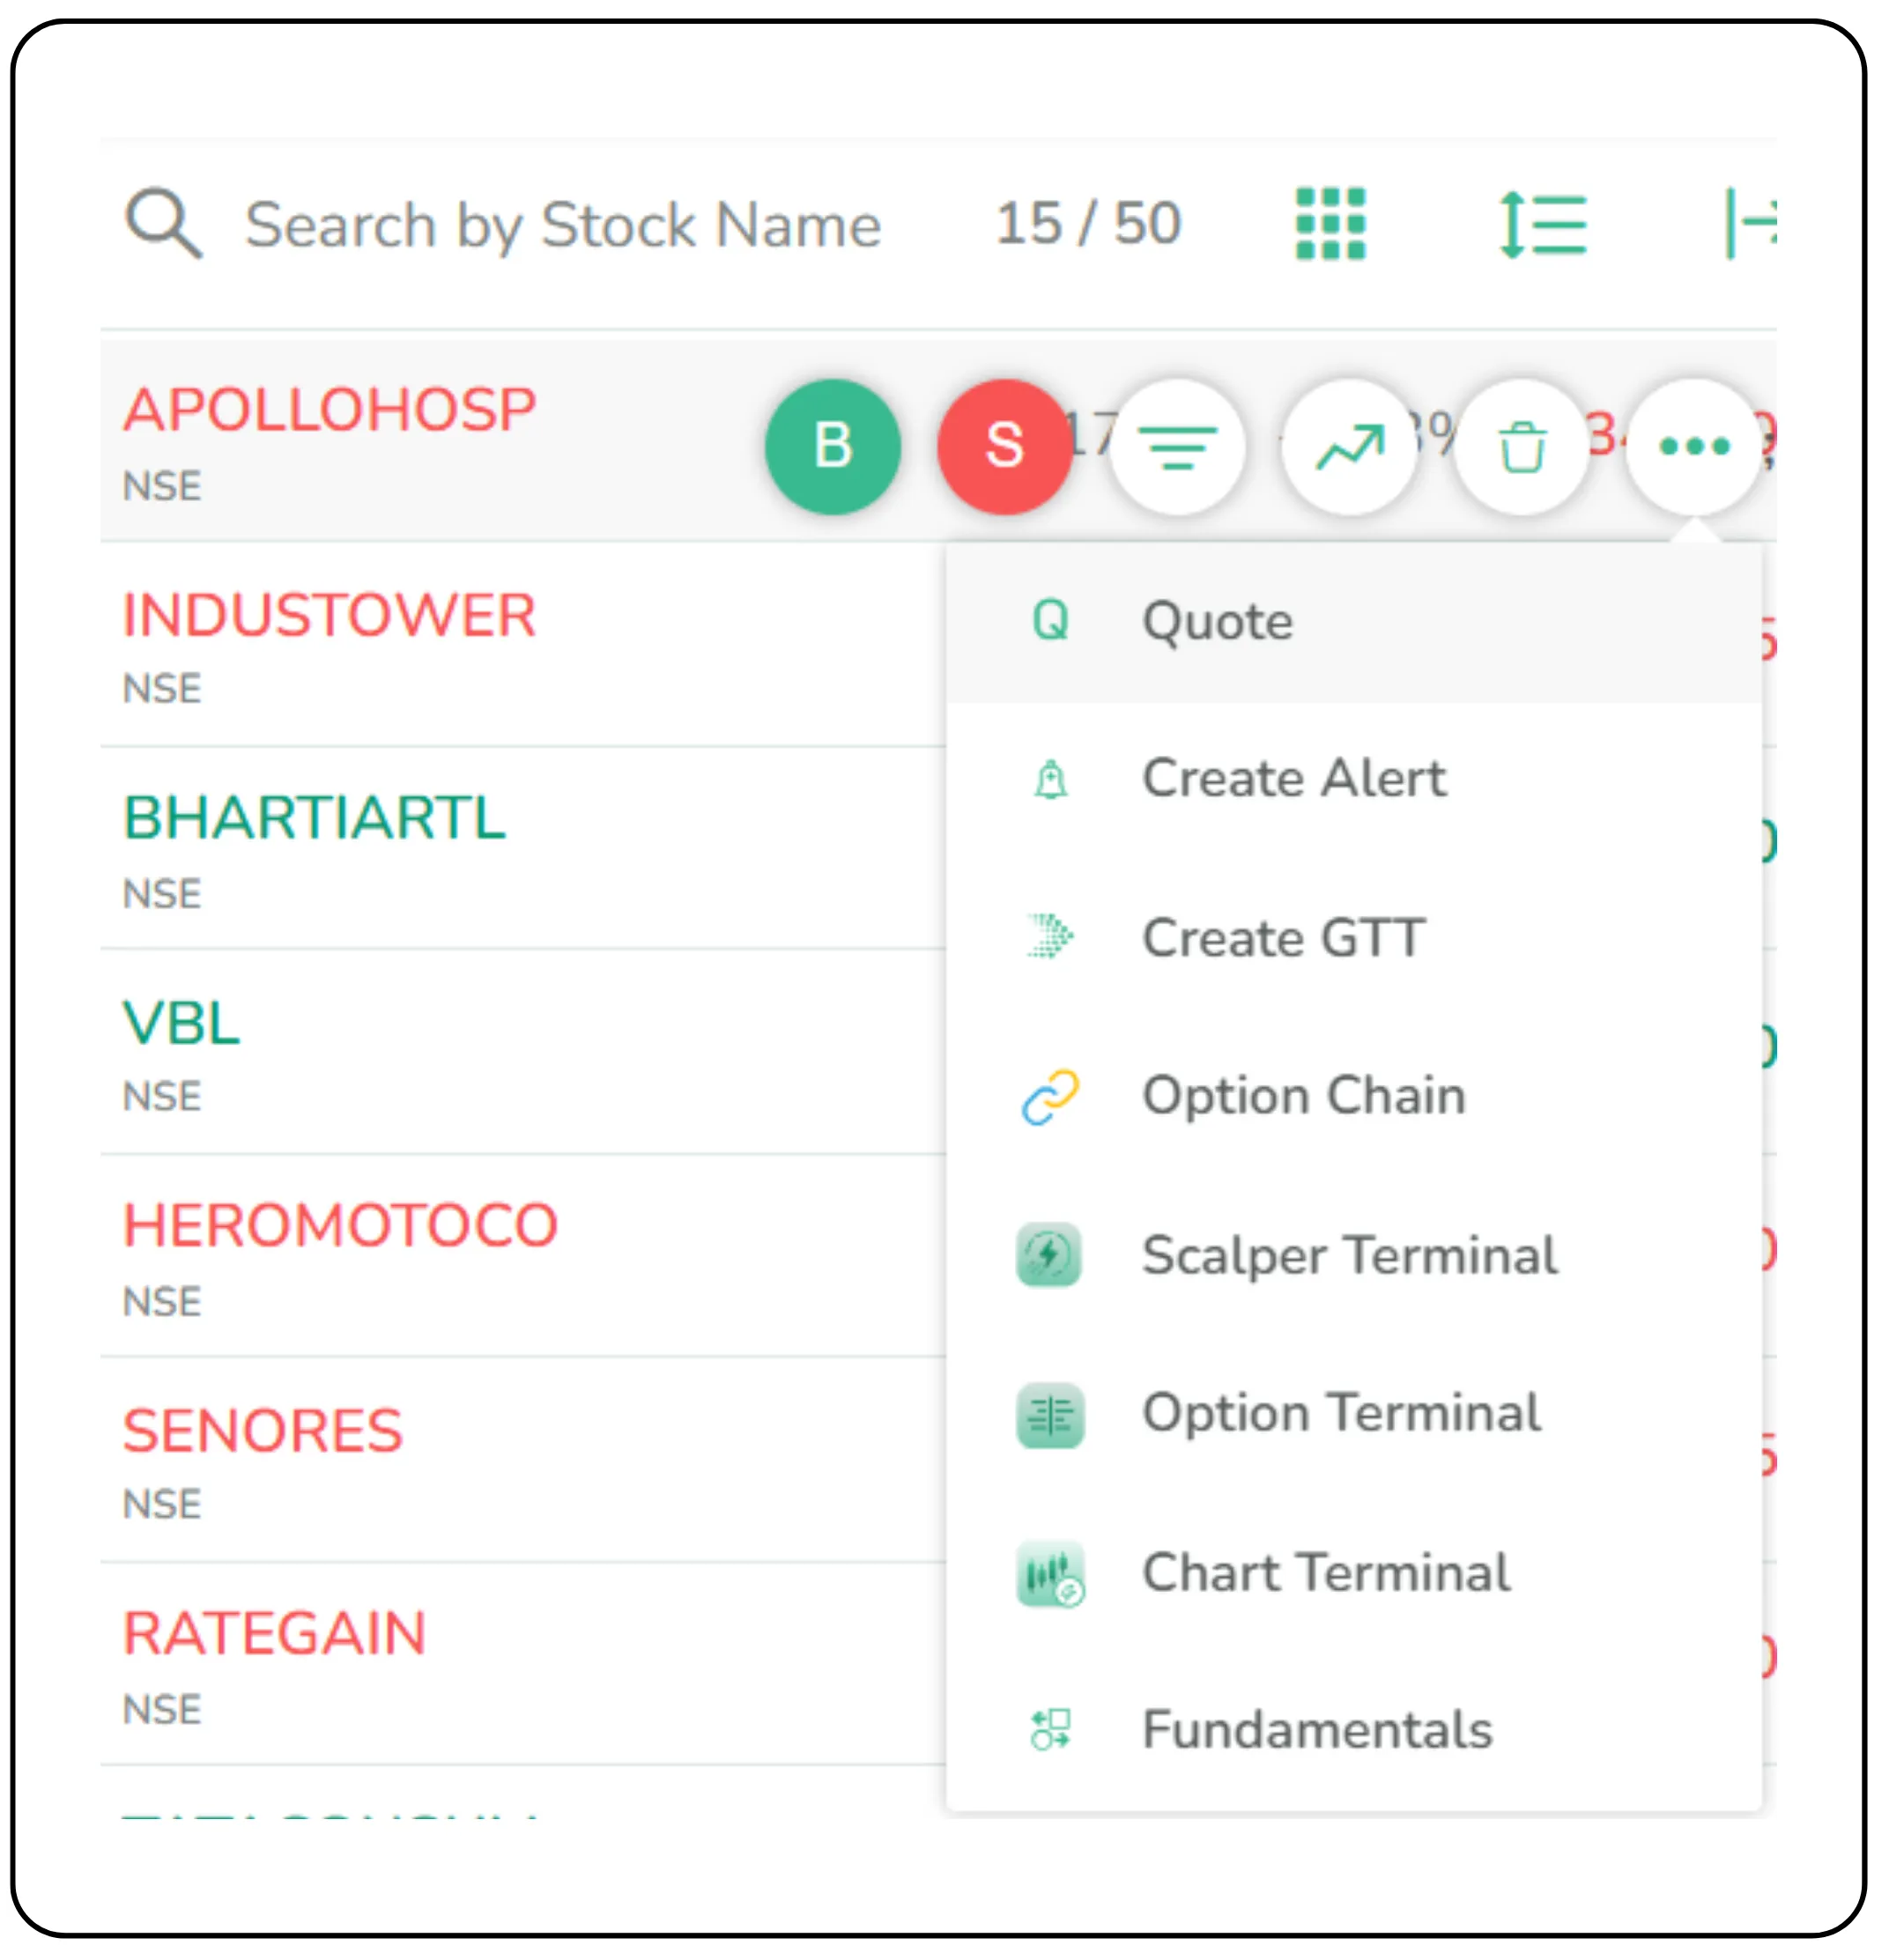
When you click on the three dots next to a stock and select Quote, more detailed information becomes available under the following sections:
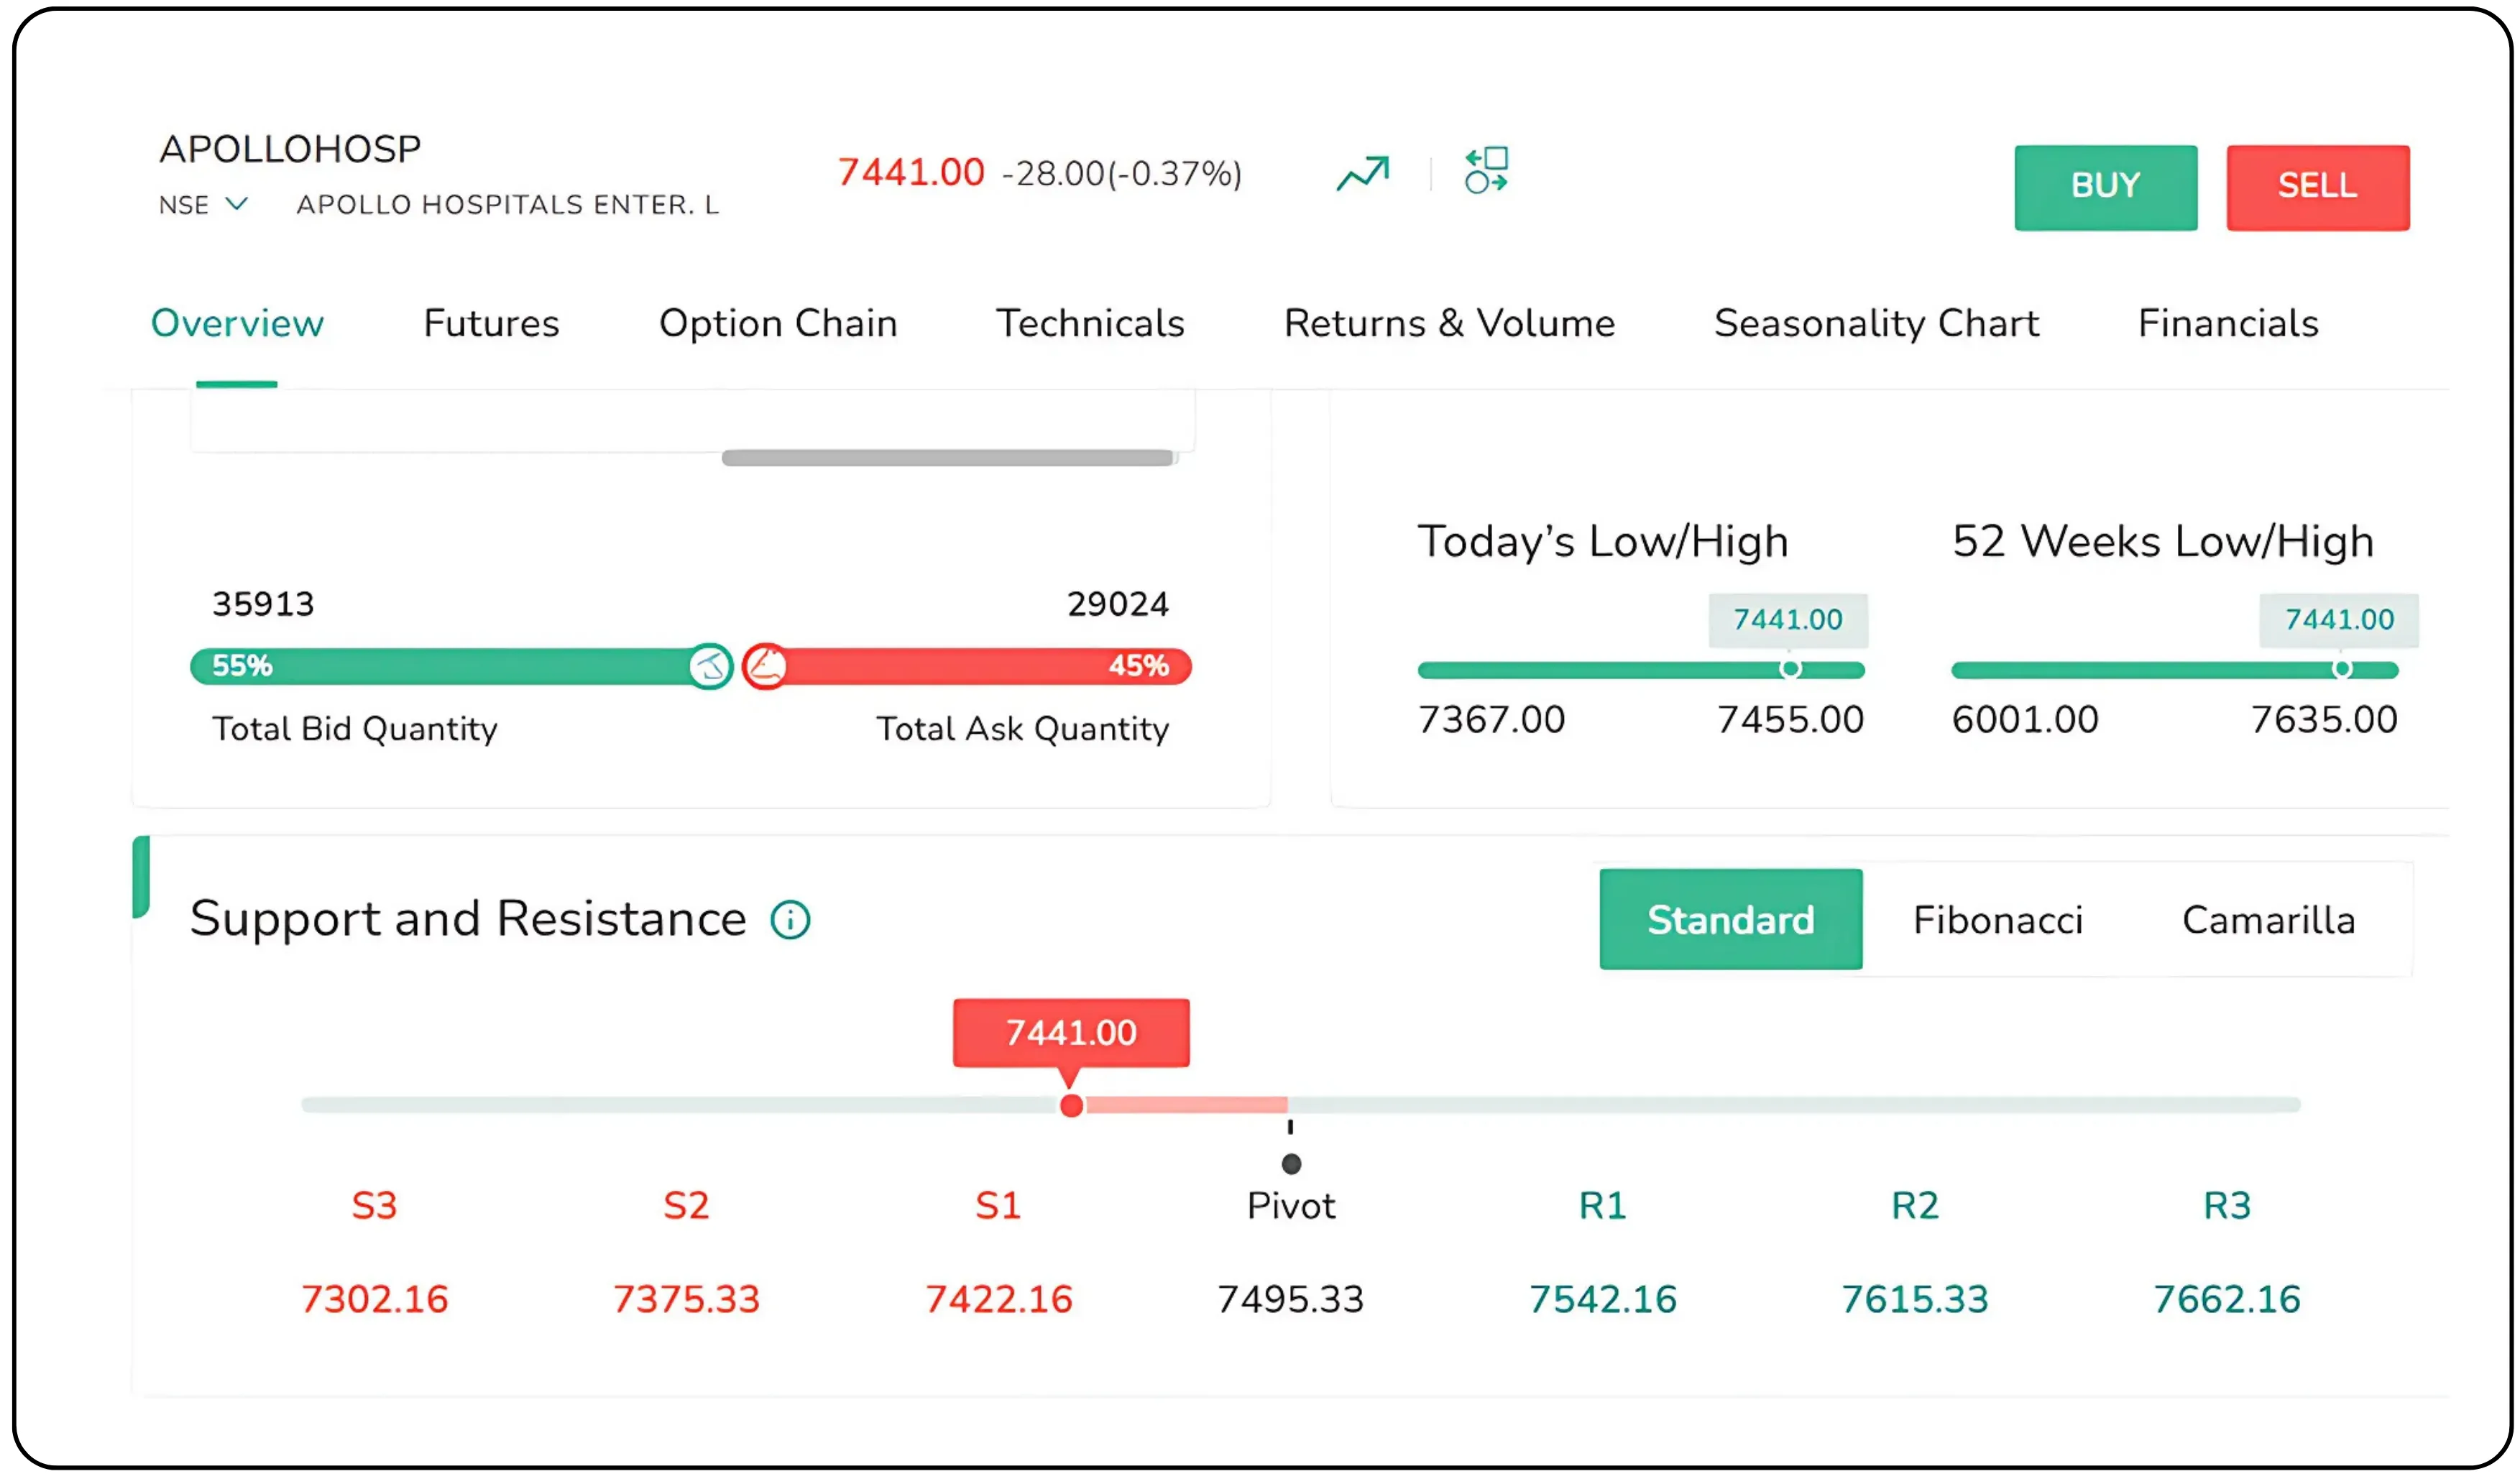
Performance (Open, High, Low, Volume, LTP, Circuits, etc.)
Support and Resistance (Standard, Fibonacci, Camarilla levels)
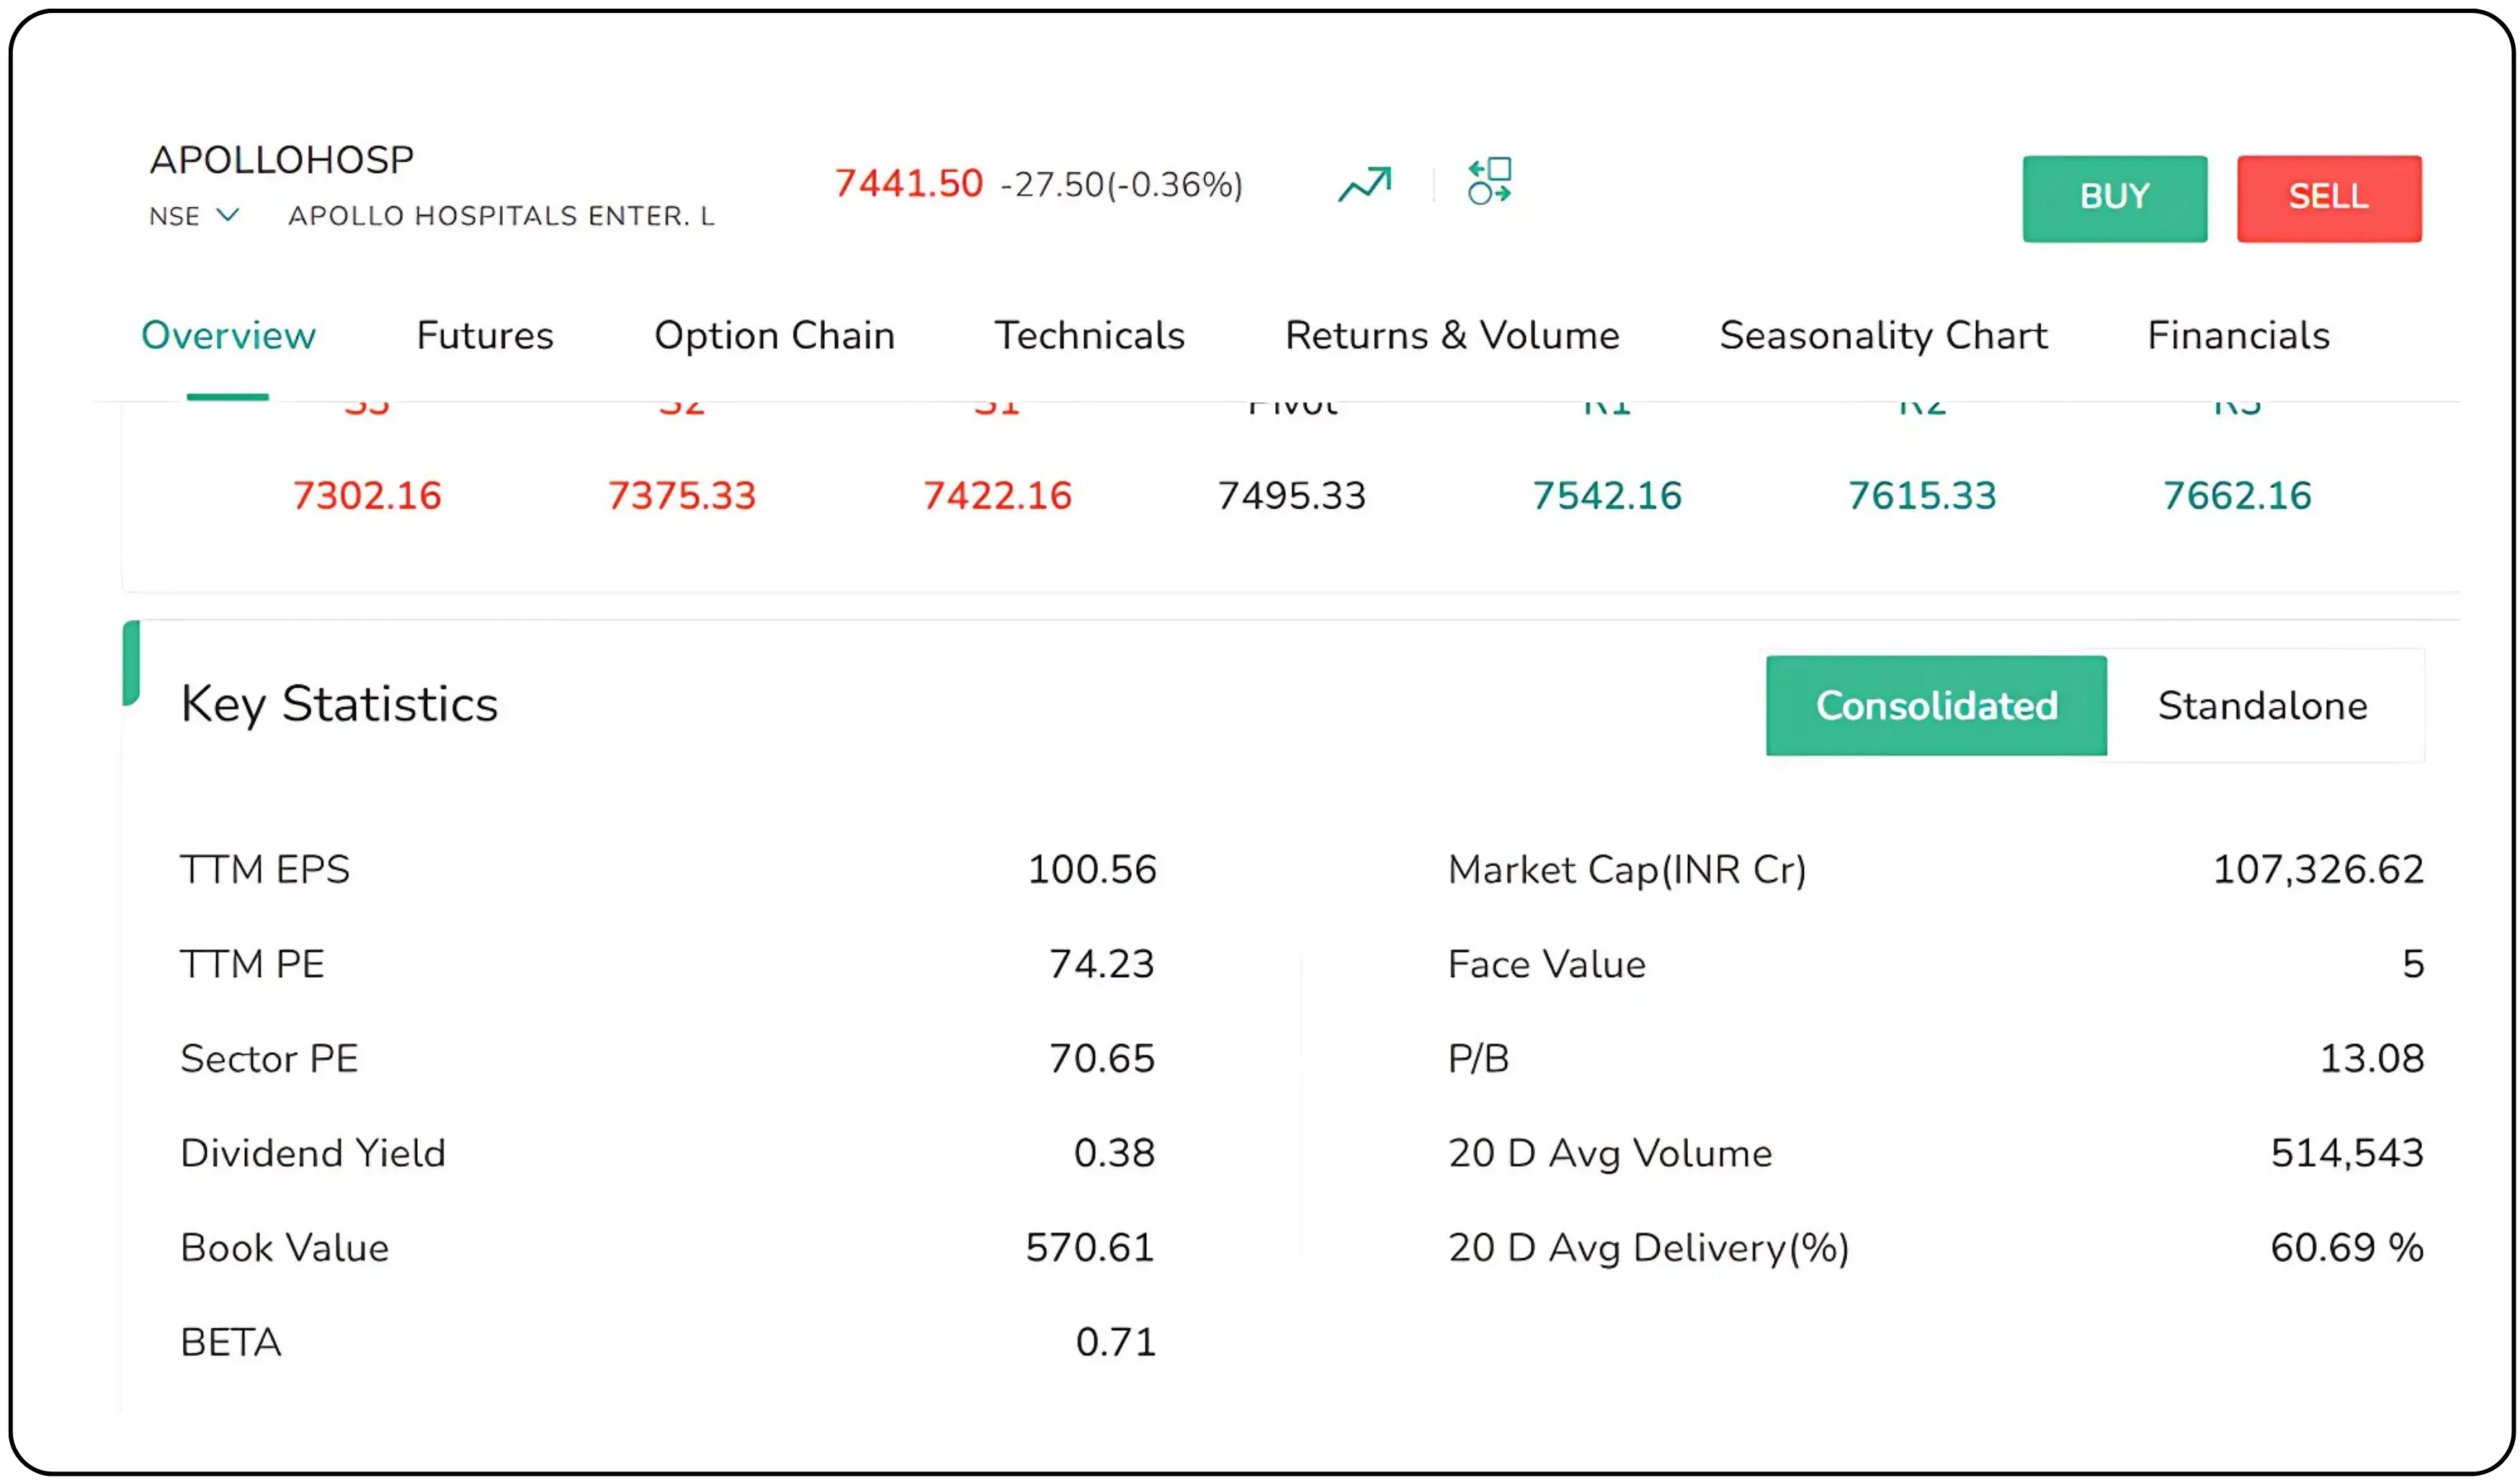
Key Statistics (EPS, PE ratio, Market Cap, P/B, etc.)
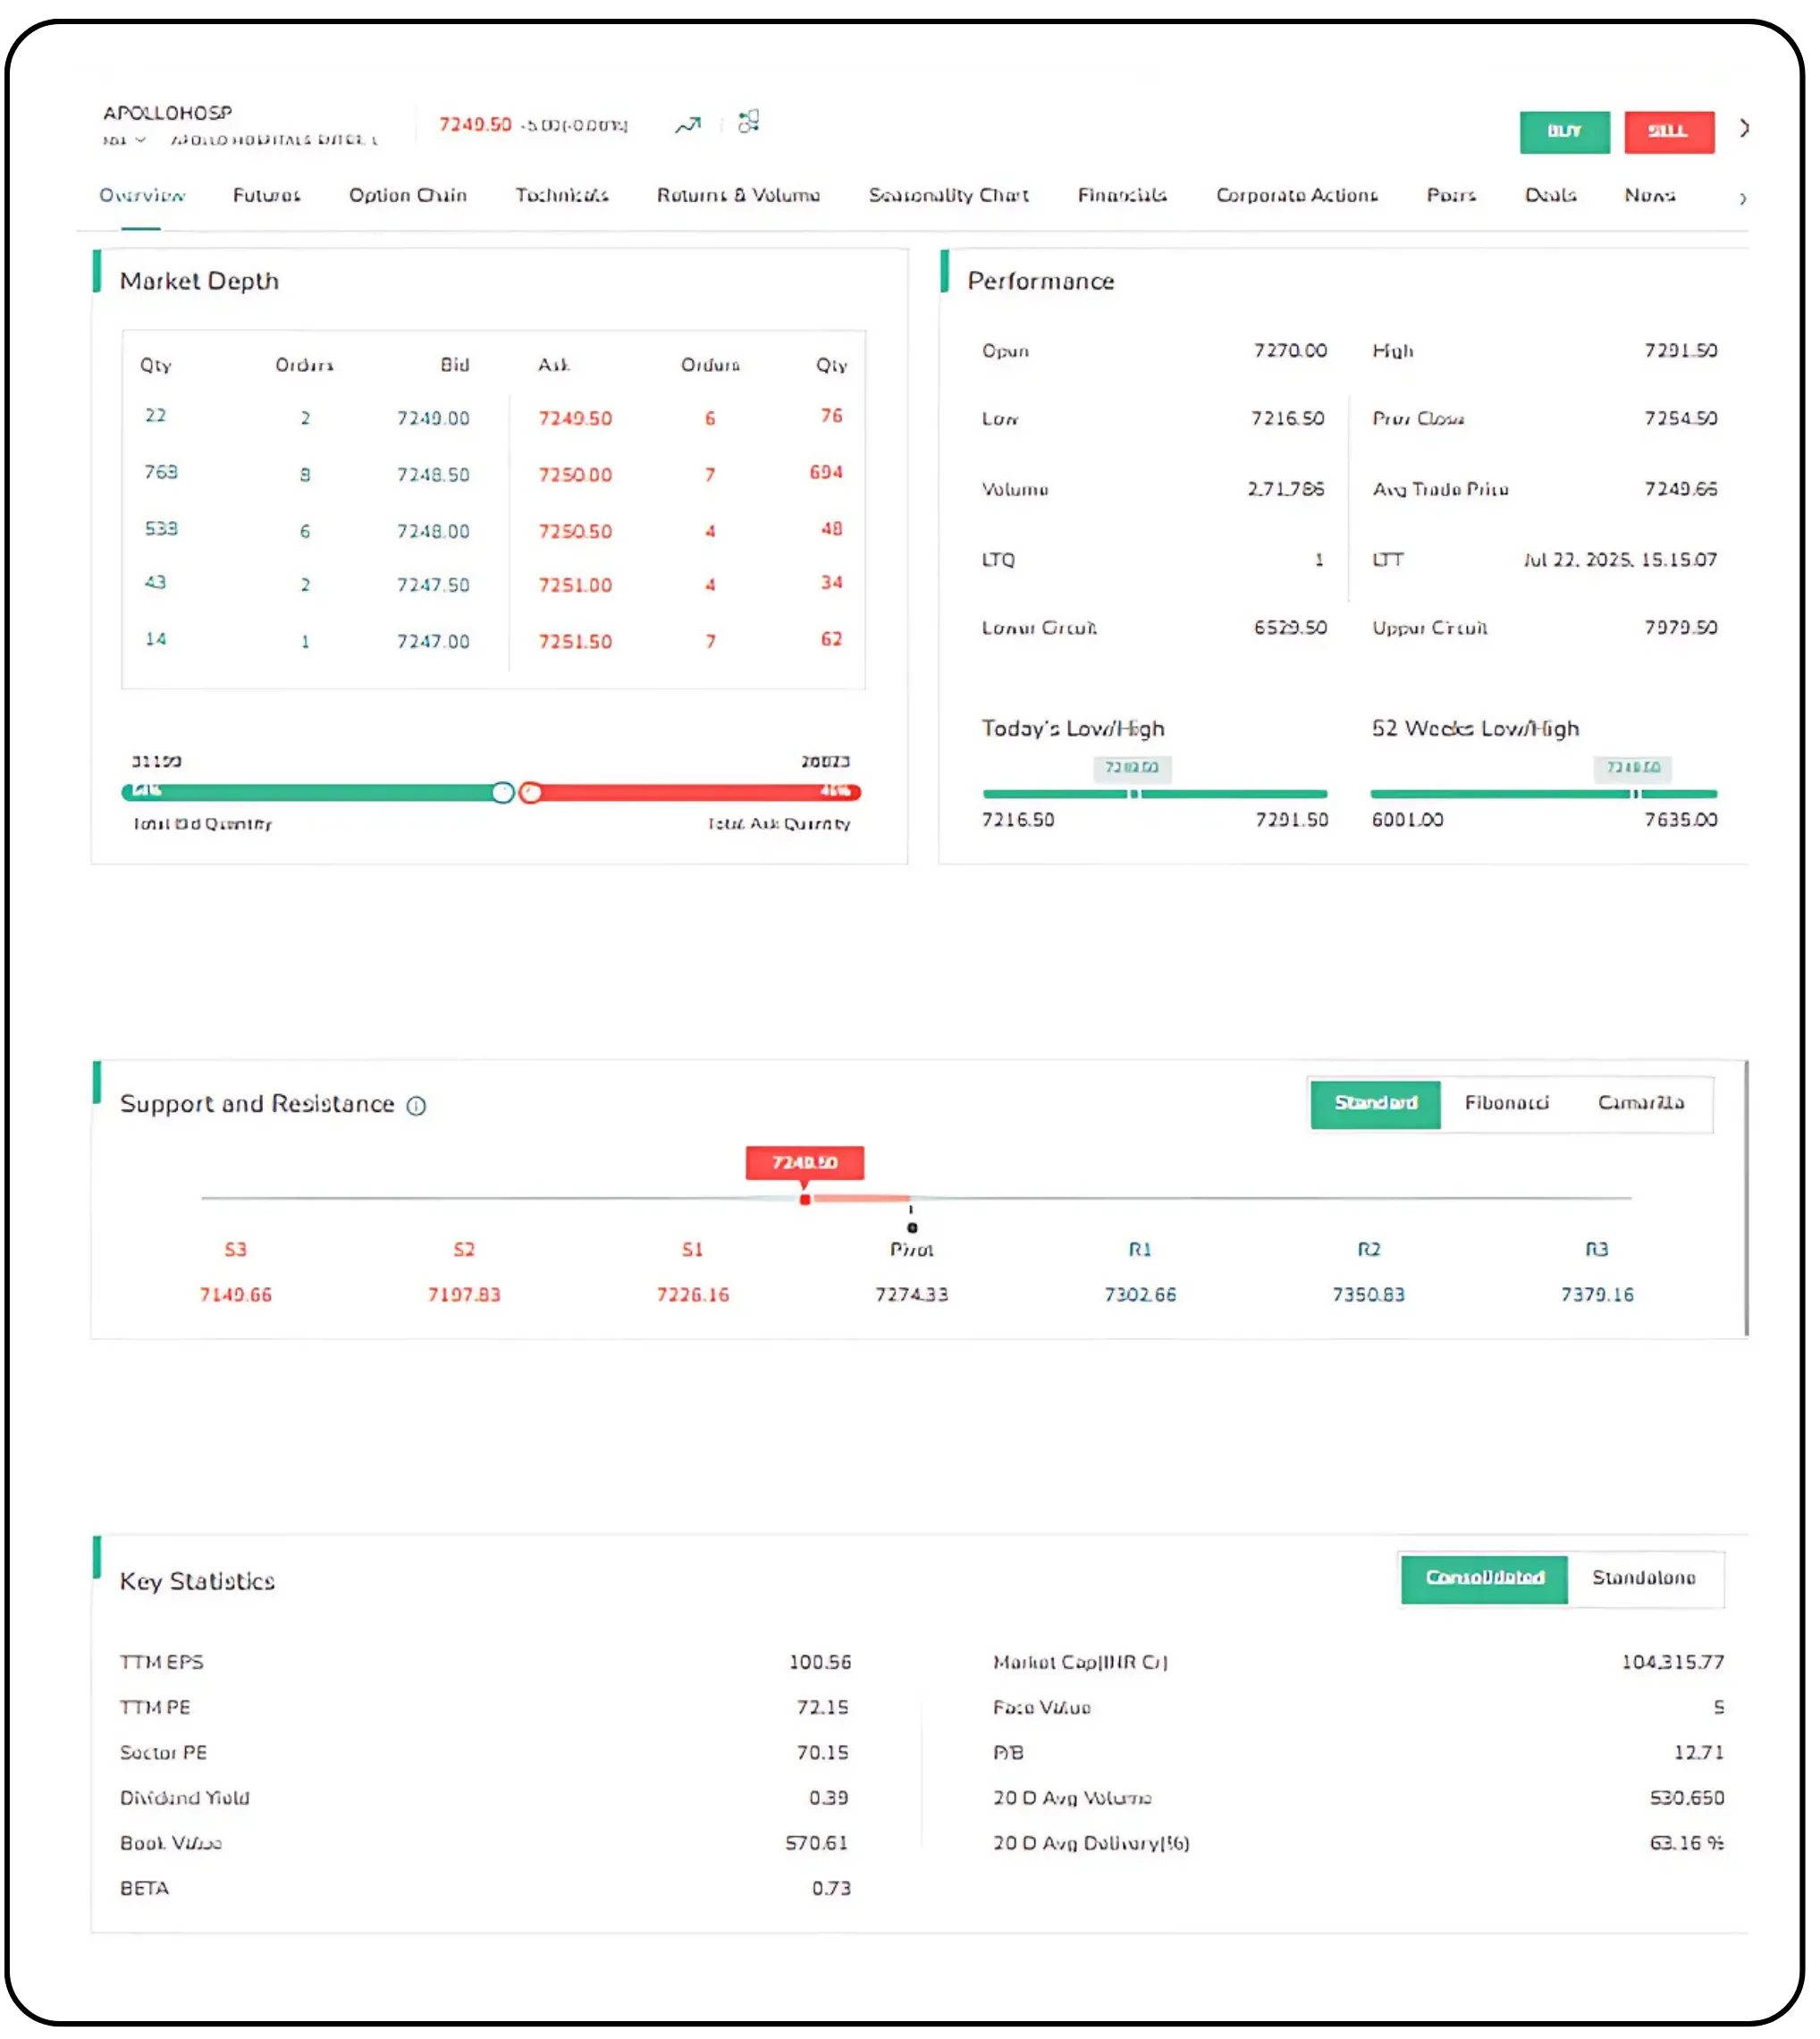
These insights help you analyze price behaviour, trading activity, and valuation metrics at a glance.
Buying Your First Share
Alright, time to take action.
You want to buy 1 share of Apollo.
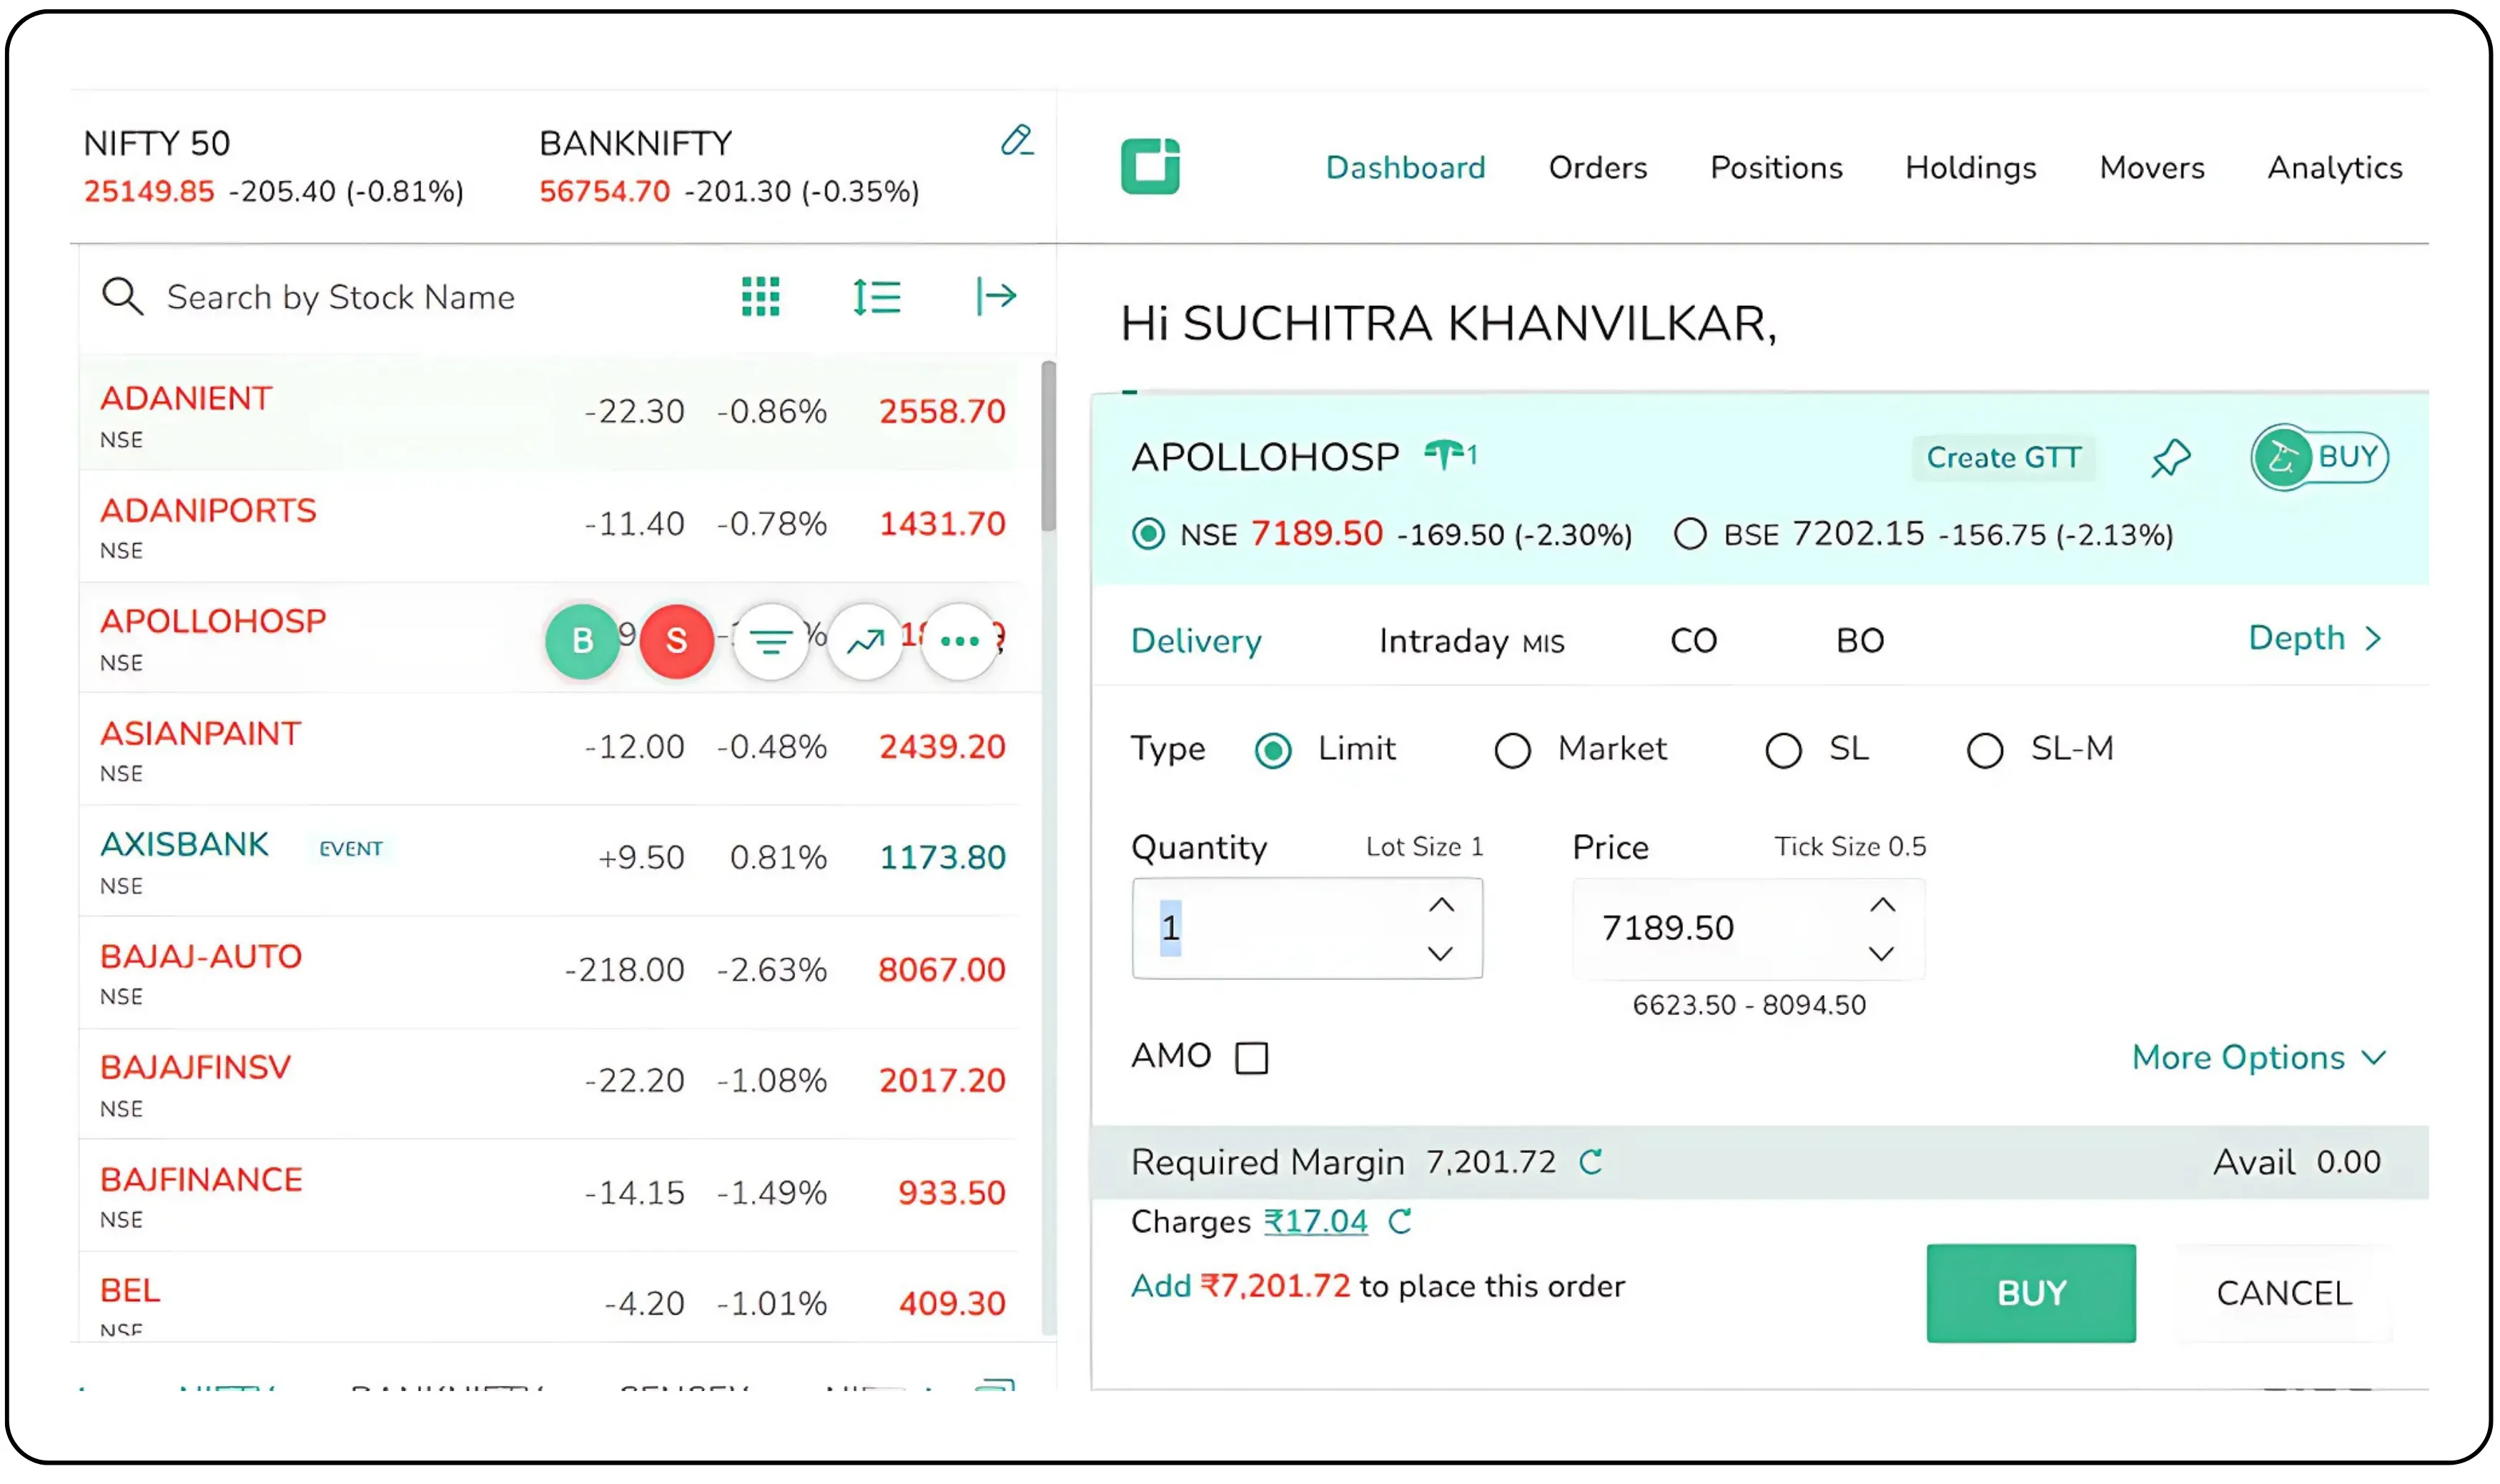
- Click on Apollo in your watchlist, then select ‘Buy’ to proceed.
- Order pad pops up. This is where you fill in the details: how many shares, at what price, and what kind of order.
- Once all required info is filled, click buy.
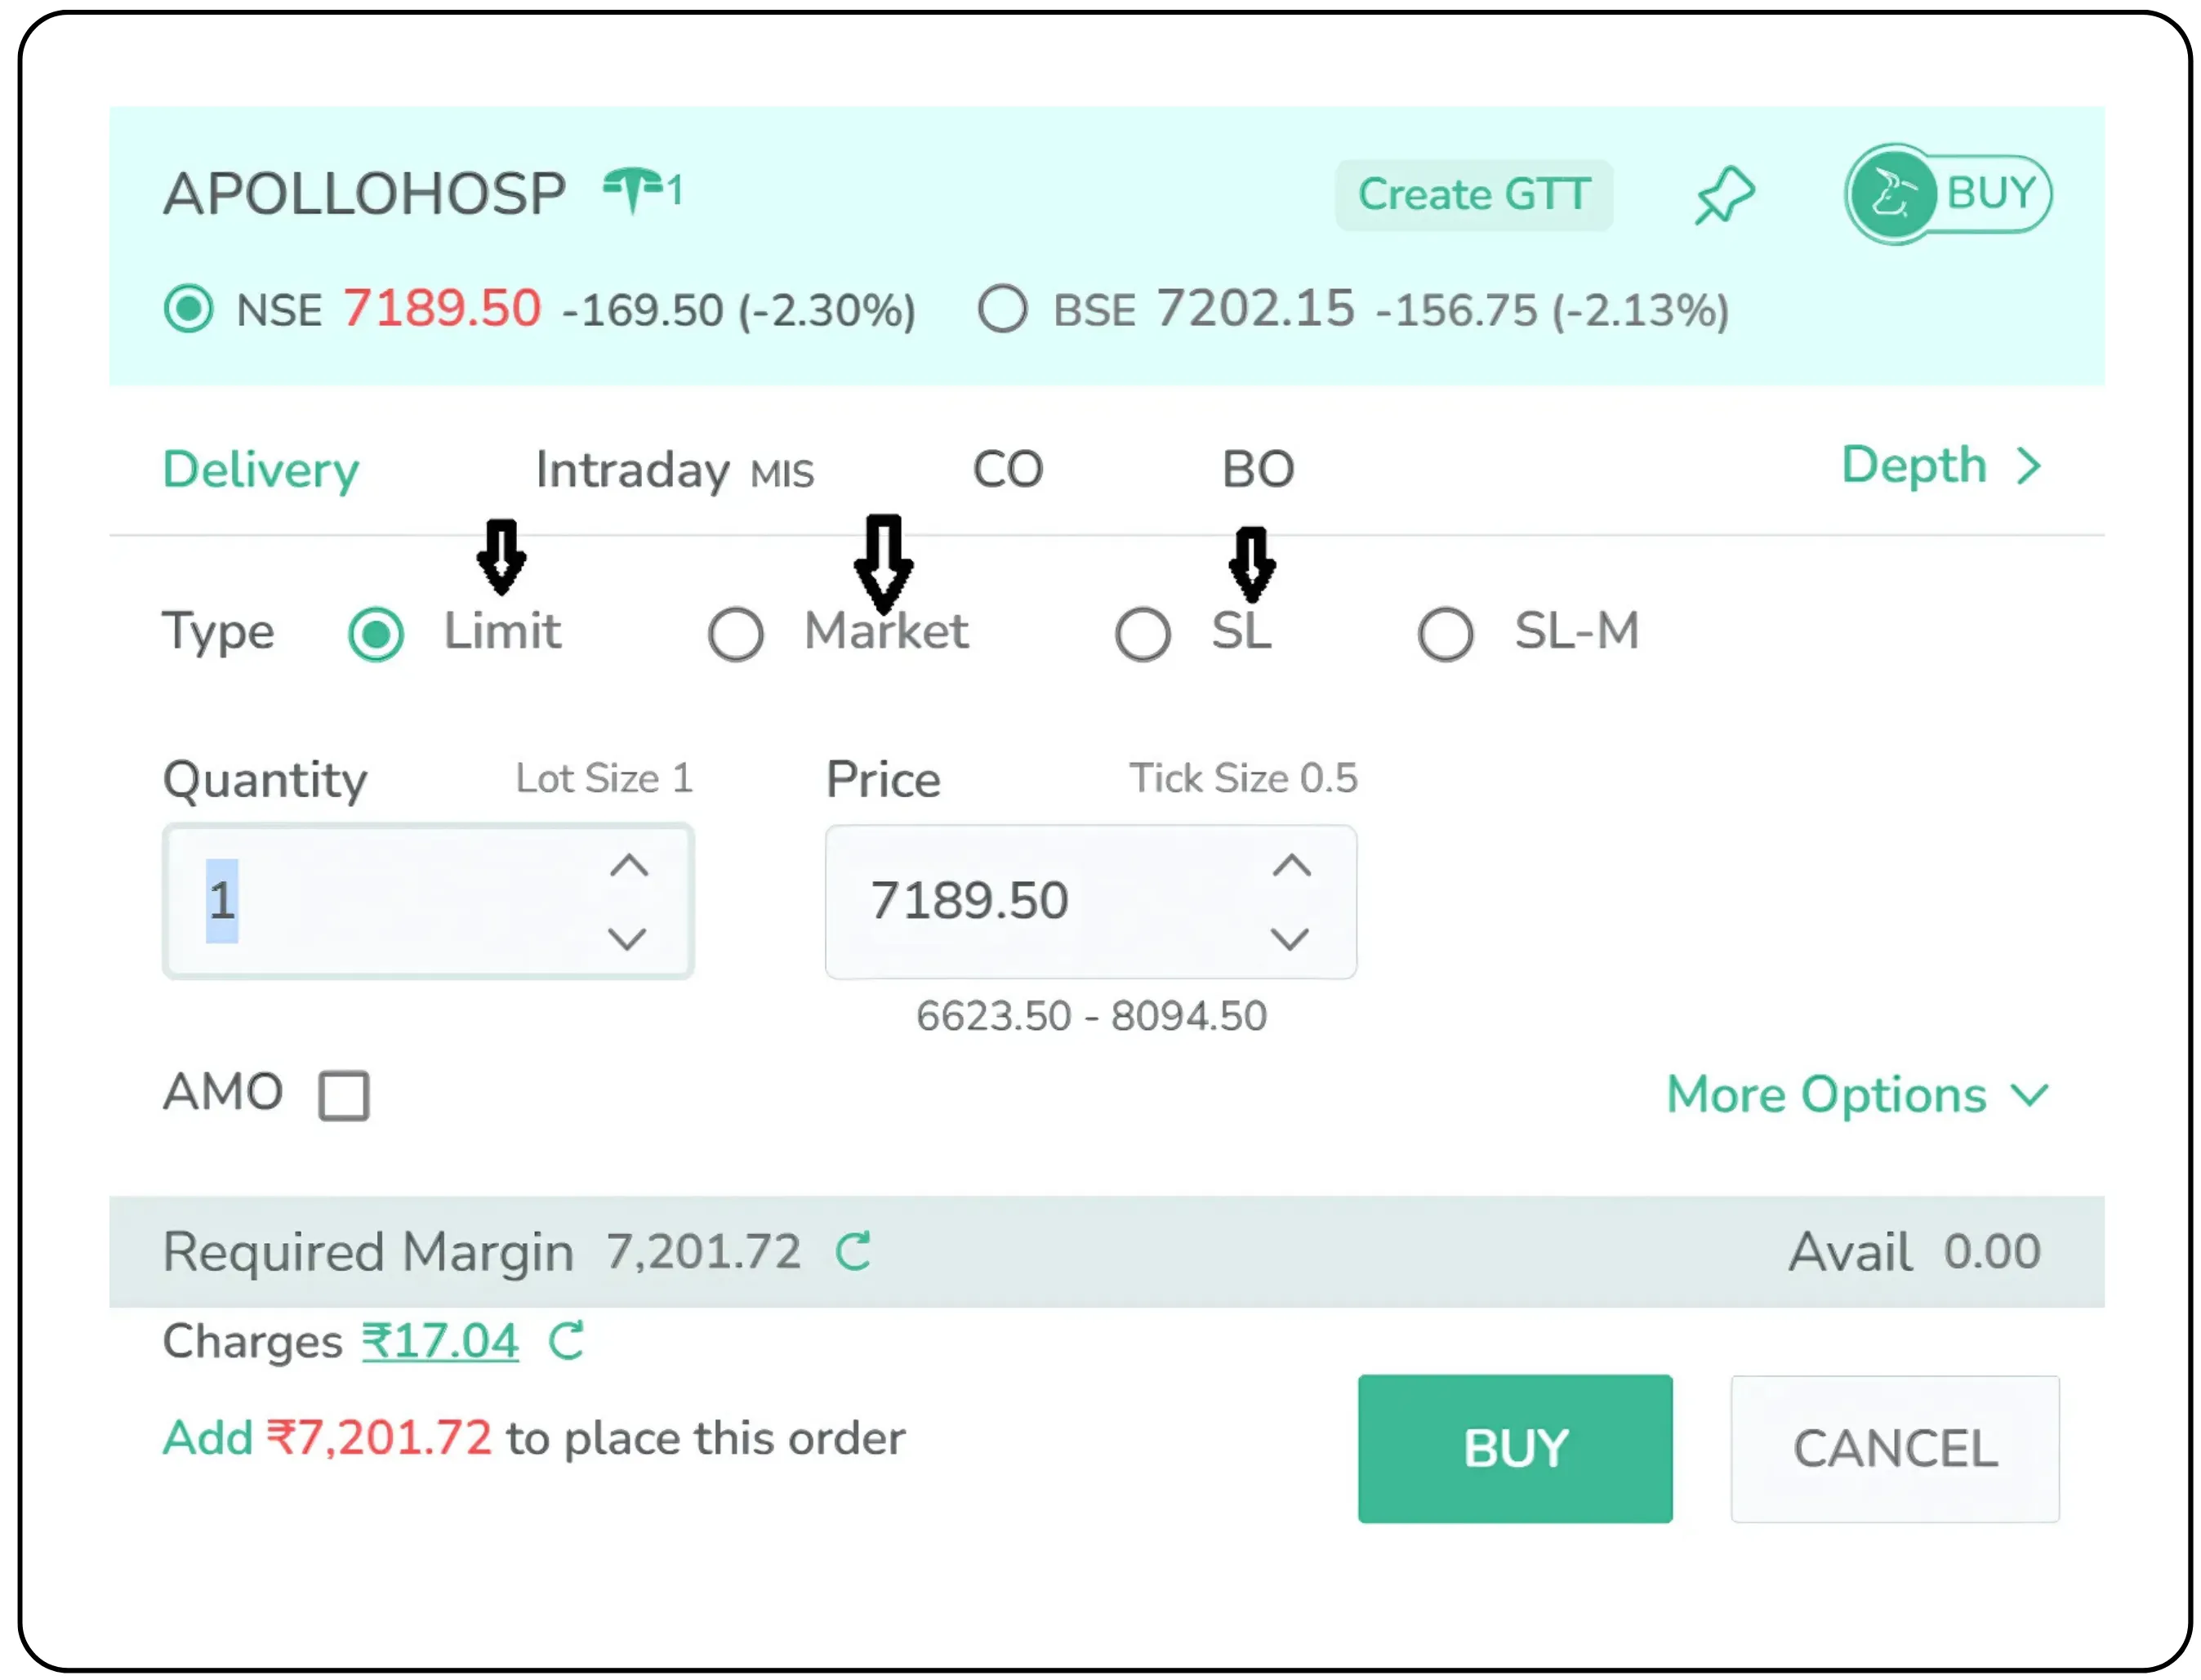
Now, the type of order matters. You’ll usually see options like
- Market Order: You want the stock no matter the price; it just executes instantly at the best available rate.
- Limit Order: You specify a price. If the stock comes down to that level, the order goes through. If not, it waits.
Let us say Apollo Hospitals is trading at ₹7,189. You feel that it is a bit high and prefer to buy it at ₹7,180. You can place a limit order at ₹7,180. If the stock touches that price during the day, your order gets executed. If it does not, nothing happens. Your order will either remain open or expire depending on the time validity you selected.
- Stop Loss: Helps you cap your downside by triggering a sell if the price drops too far.
Want to be sure you get the stock at the best price? Go with a market order, and it’ll buy at the best available price right away.
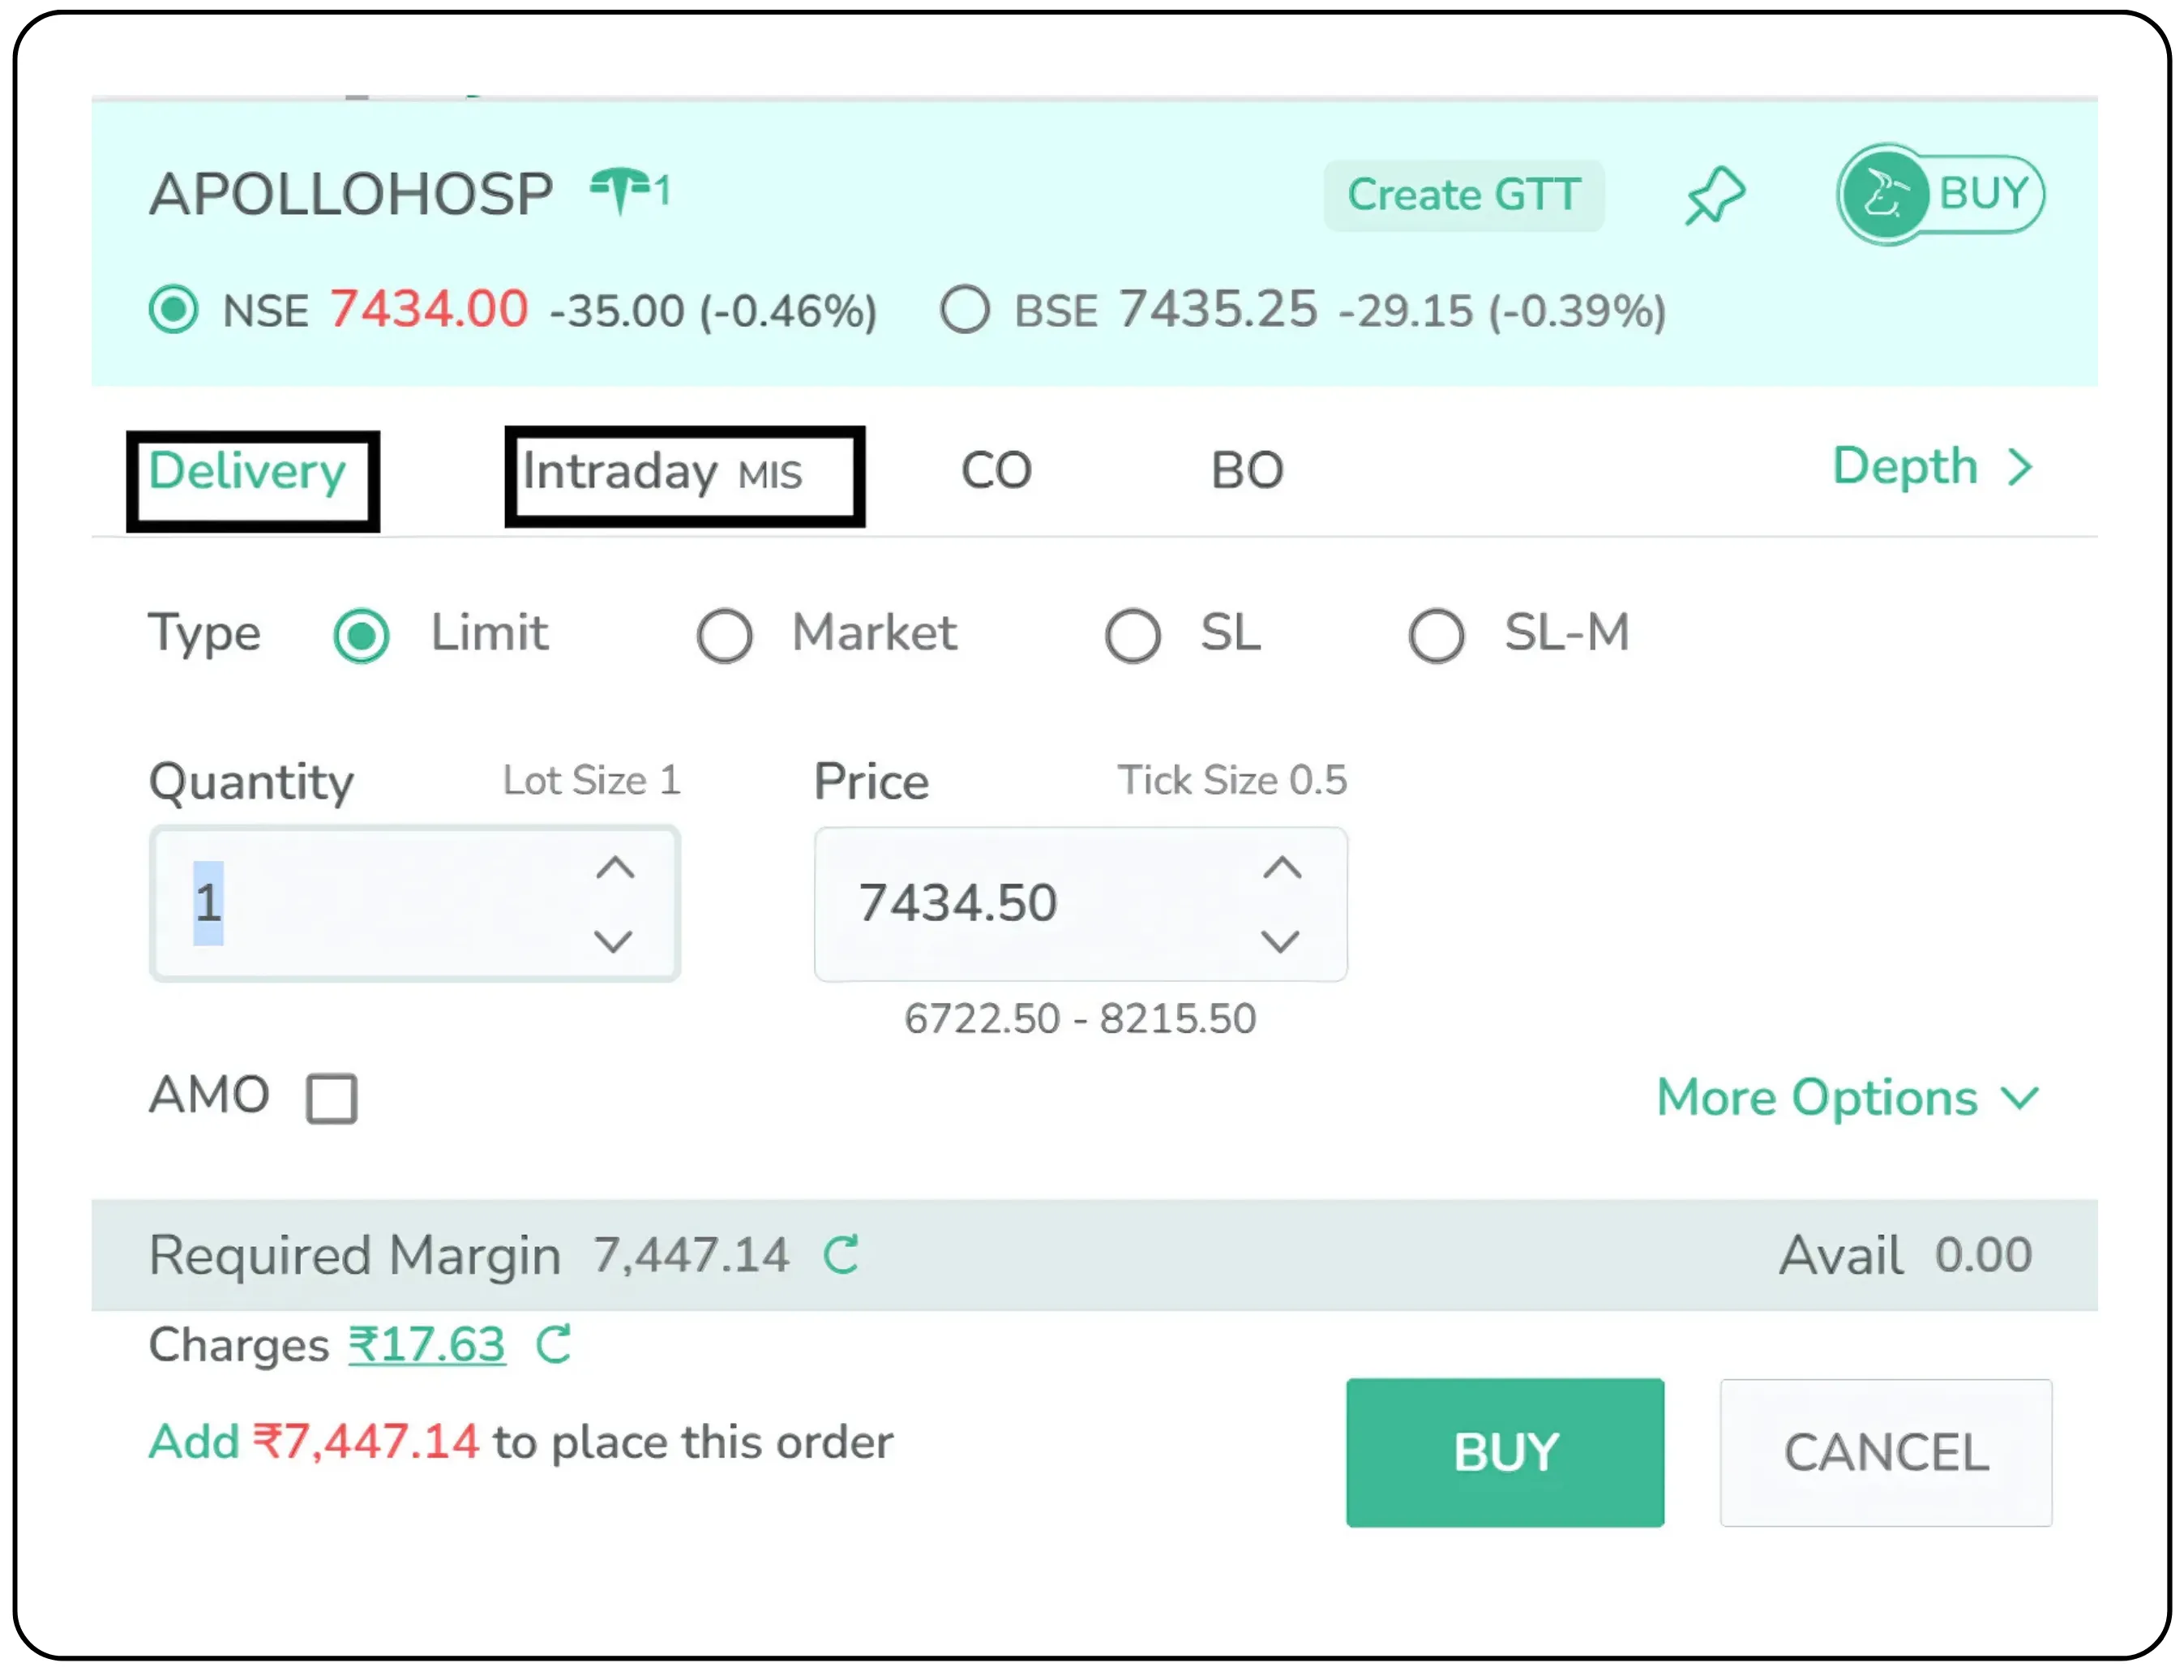
Next, choose the product type:
- CNC (Cash and Carry): You are buying the stock to hold it for days, weeks, months, or whatever. It is also known as delivery.
- MIS (Margin Intraday Square-off): You are trading for the day, in and out before the closing bell.
Click ‘Buy.’ That’s it. The order goes to the exchange. If it matches, it executes, and now you officially own a slice of Apollo.
The Order Book & Trade Book
Two tools, one purpose. Tracking your trades.
- The Order Book shows all your placed orders, whether they went through or not.
- Trade Book confirms what got executed.
Think of the order book as a waiting room and the trade book as the final record. You can cancel or edit orders in the order book if they are still pending. Once it moves to the trade book, the deal is done.
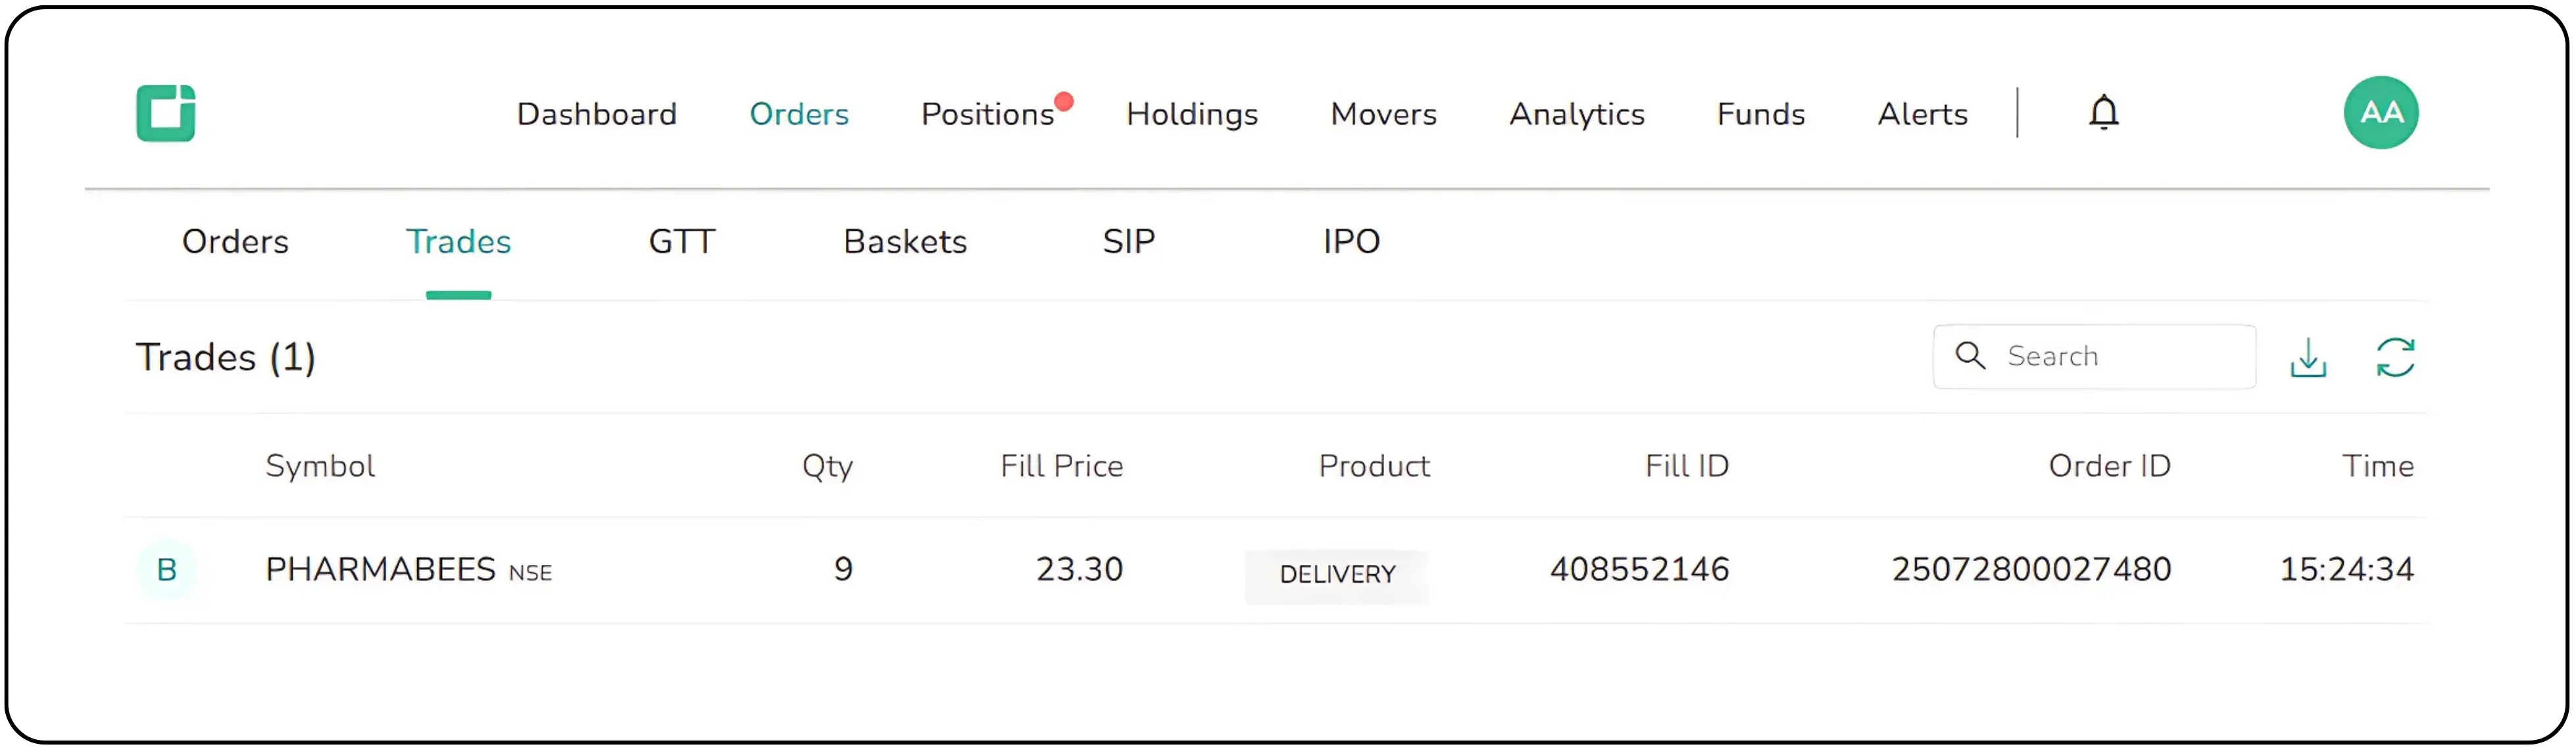
Trade Book
Keeping an Eye on Stocks
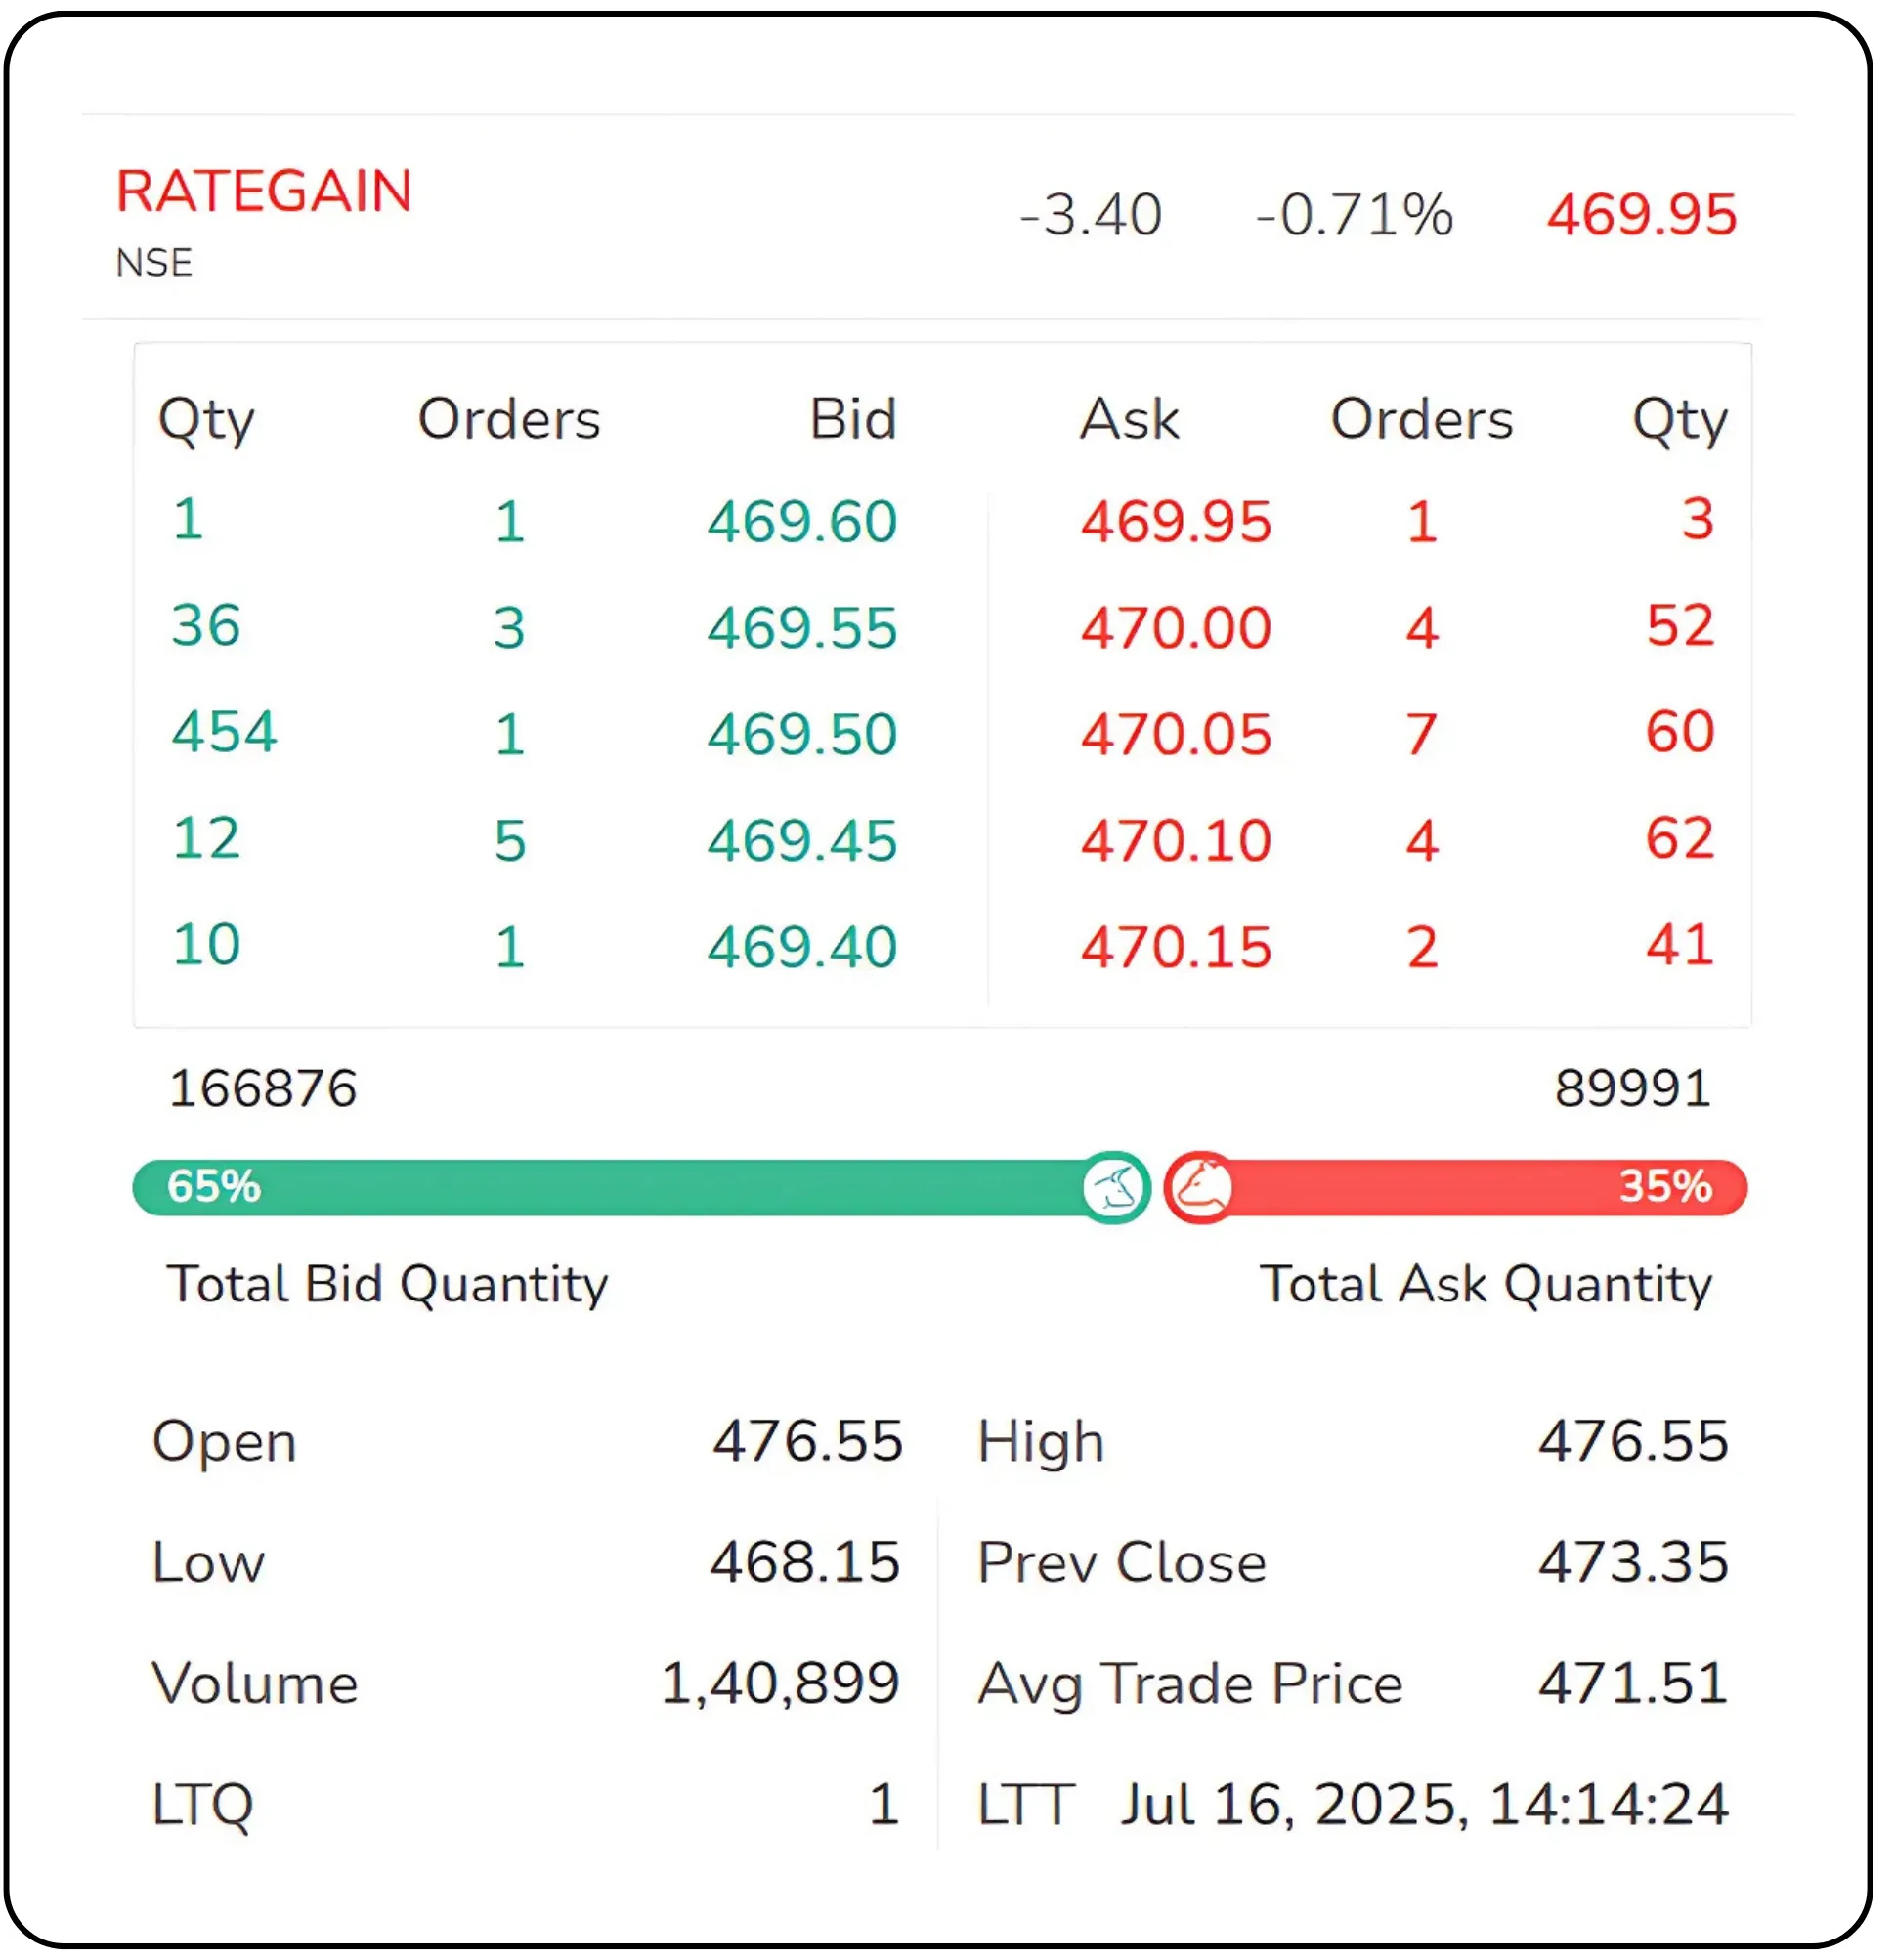
Let’s go back to other wishlist stock, like Rategain. You have added it to your watchlist, and you see it’s trading at ₹470.
Now, here's the cool part. The terminal gives you a running feed of how that price is moving at the open, the day’s high and low, and real-time changes in volume.
Colours help too, green if the stock’s up, red if it’s down.
And if you want to go deeper, there’s Market Depth, a live window into buyer and seller interest.
Understanding Bids and Offers
This is where the market gets real.
- Bid = what buyers are willing to pay
- Offer = what sellers are asking
Let’s say you want to buy 10 shares, and here’s what the sellers are offering:
- 2 shares at ₹469.95
- 4 shares at ₹470
- 4 shares at ₹470.10
Place a market order for 10 shares? You’ll buy across all three price levels, and your average buy price will be somewhere in between.
The same logic applies when you sell, the system will match your shares with the best available buyer prices.
You don’t need to memorize these ladders, but knowing how this supply-demand dance works helps you avoid overpaying or underselling.
Bottom Line
A trading terminal isn’t some complex beast. It is just your control panel for the markets. And once you get familiar with it, everything becomes faster, smoother, and far more intentional. Everything else, from advanced charts to options trading, is built on this.
Ready to trade smarter? Explore the CubePlus trading terminal and place your first order today on Tradejini.
Disclaimer: The information provided in our blogs is for informational purposes only and should not be construed as financial, investment, or trading advice. Trading and investing in the securities market carries risk. Always conduct your own research and consult with a qualified financial advisor before making any investment decisions. Past performance is not indicative of future results. Copyrighted and original content for your trading and investing needs.
© 2025 — Tradejini. All Rights Reserved.