


Markets move in cycles — not just by the day or quarter, but also by month. Certain months repeatedly show trends driven by investor psychology, fiscal activity, and liquidity flows. These recurring seasonal trends, often referred to as seasonality trading strategies, help traders identify predictable patterns in stock prices using historical data.
That’s exactly what Seasonalitics on CubePlus by Tradejini offers. This seasonality trading approach helps investors and traders make informed decisions by studying past performance and recurring patterns in the financial markets.
As we move through November 2025, the Seasonalitics dashboard provides a valuable mid-month perspective:
Are current trends repeating history, or diverging from it?
Using the latest data from Nifty 50, Nifty Next 50, Nifty Midcap 100, and Nifty Smallcap 100, we compare this month’s real-time heatmaps against their historical seasonality patterns — revealing which sectors are aligned with past tendencies, and which are breaking away.
Nifty 50 Seasonal Patterns: Consumer, E-commerce, and Healthcare Lead
Then: Historical Seasonality
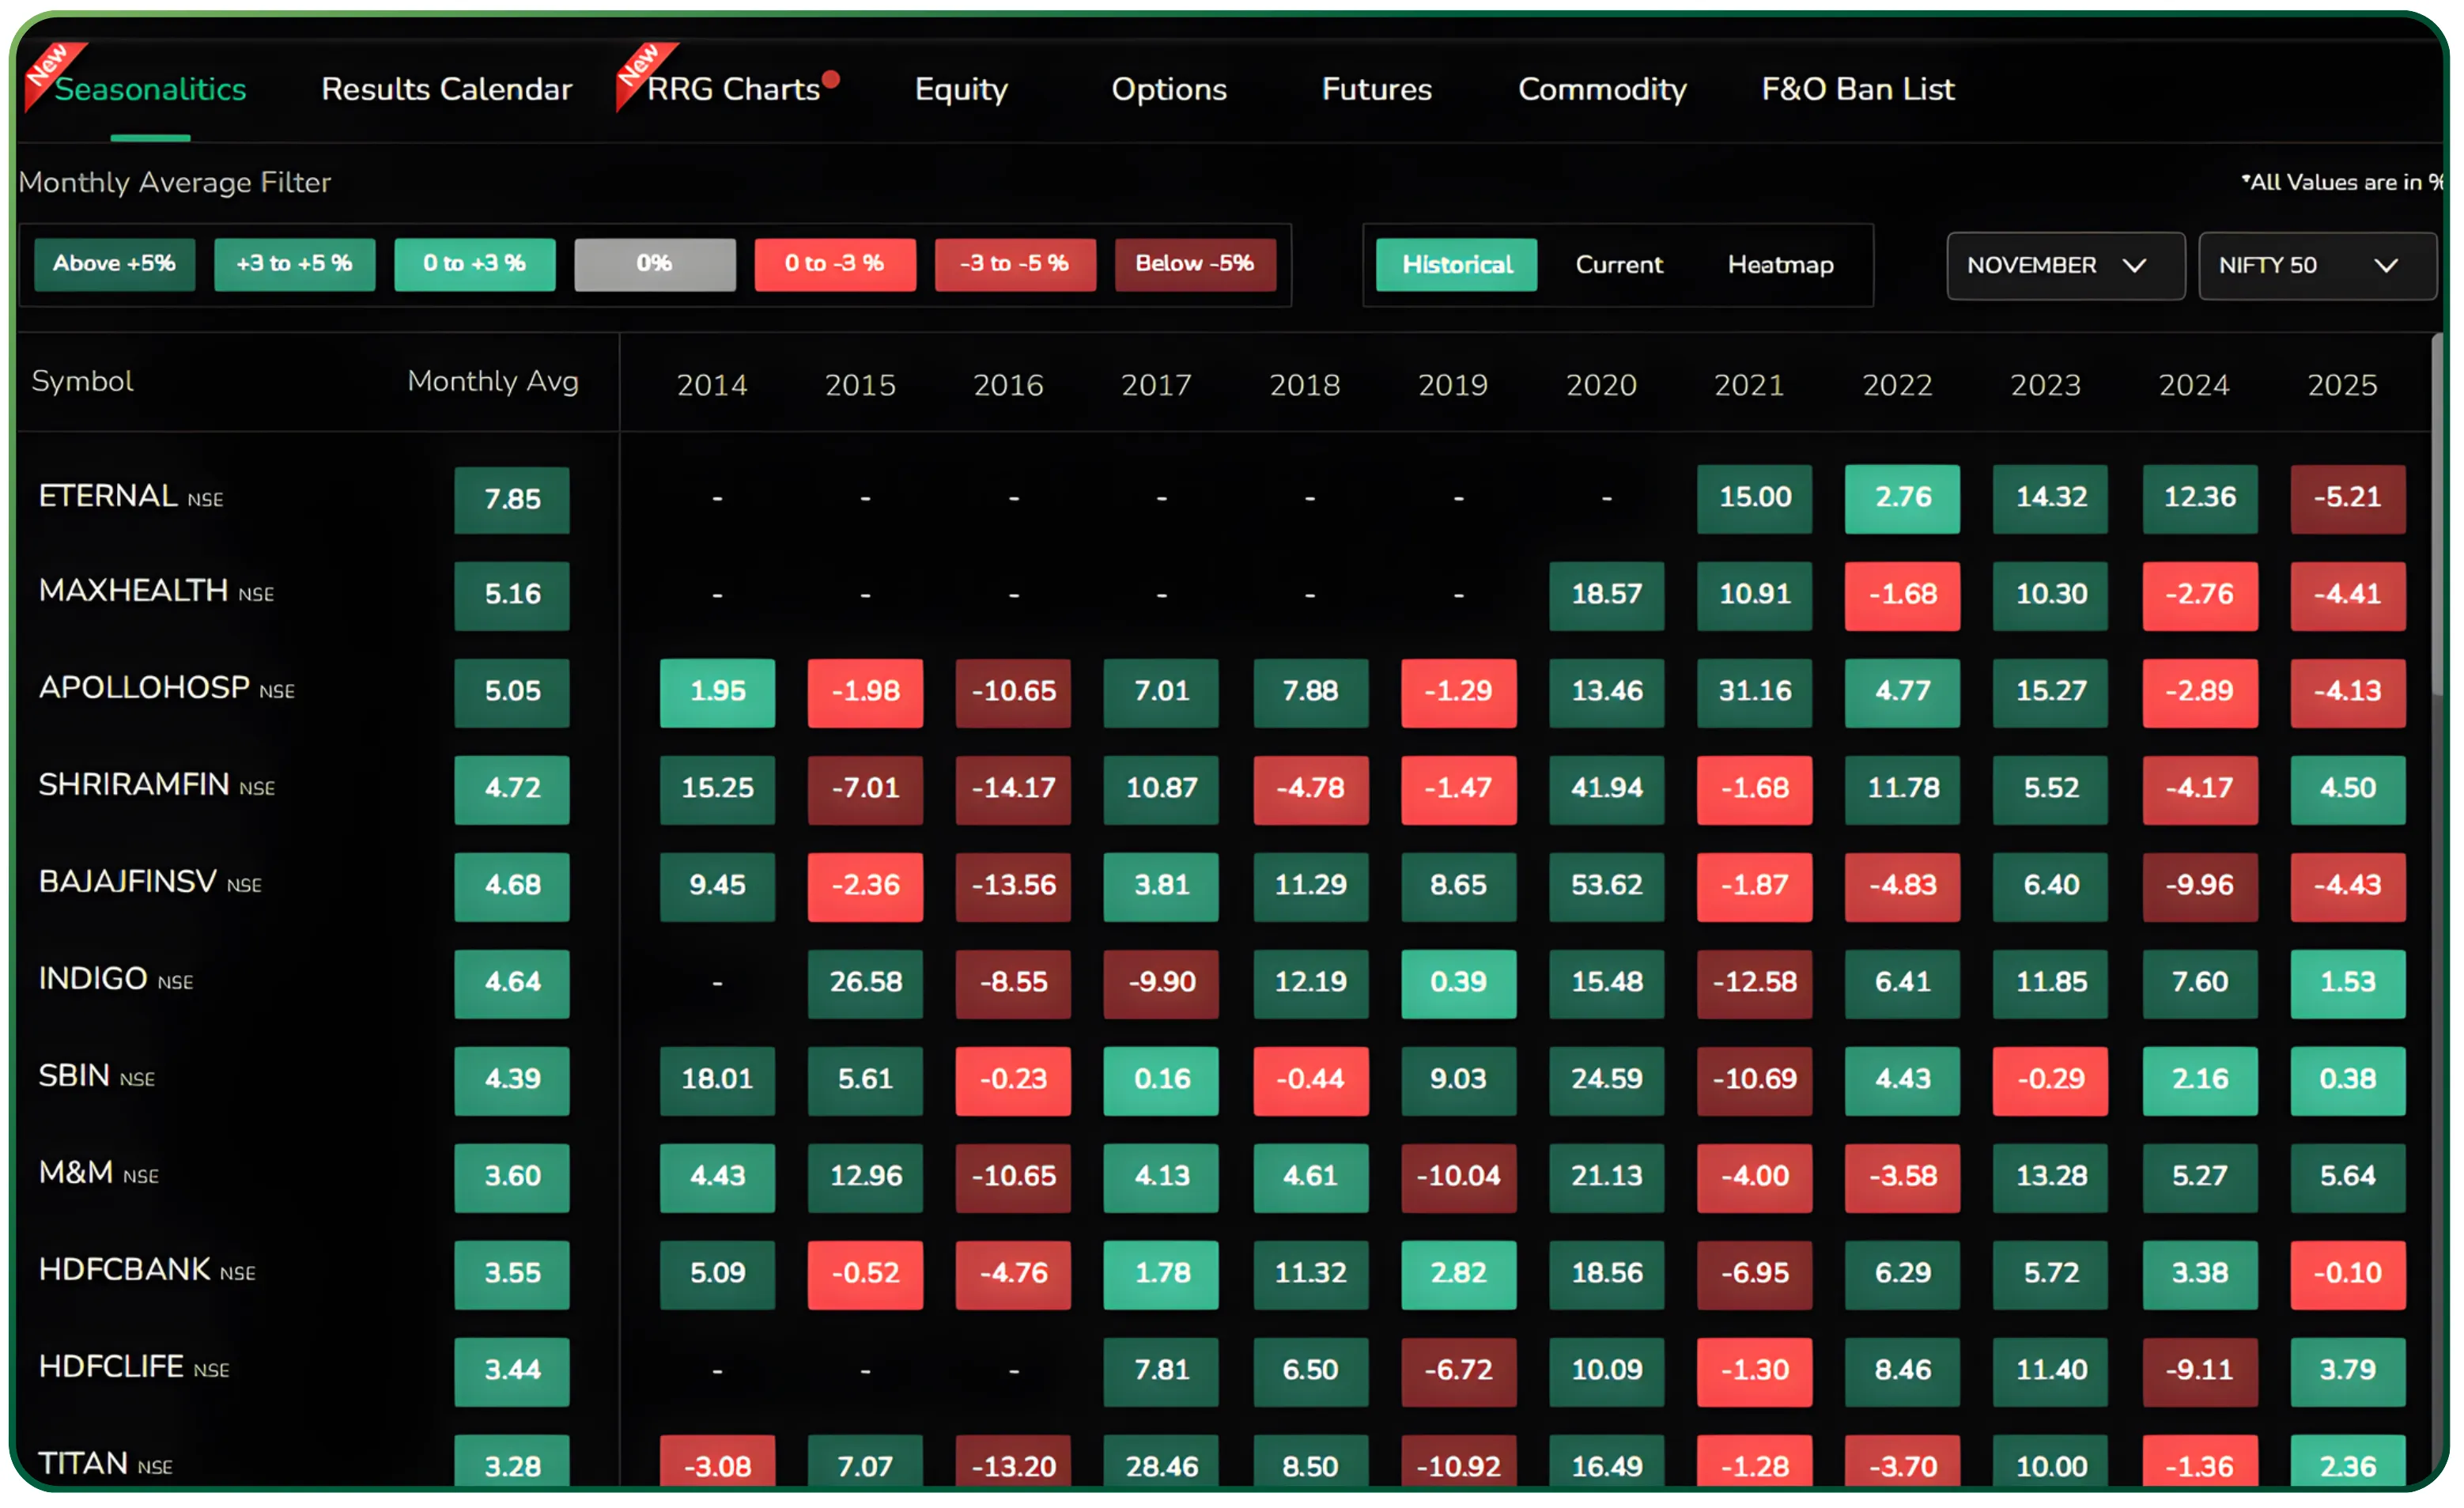
Historically, November has been a steady month for the Nifty 50, with gains typically led by banking, healthcare, and consumption-oriented sectors. The historical Seasonalitics chart highlights consistent November strength in HDFC Bank, Kotak Bank, Titan, HDFC Life, and Apollo Hospitals, suggesting that defensive and large-cap consumption stocks often dominate this period.
Over the years, cyclical and commodity-linked stocks such as ONGC, Coal India, and NTPC have shown a relatively mixed or negative trend — implying that November tends to favor stable earnings plays over global commodity exposure.
Now: November 2025
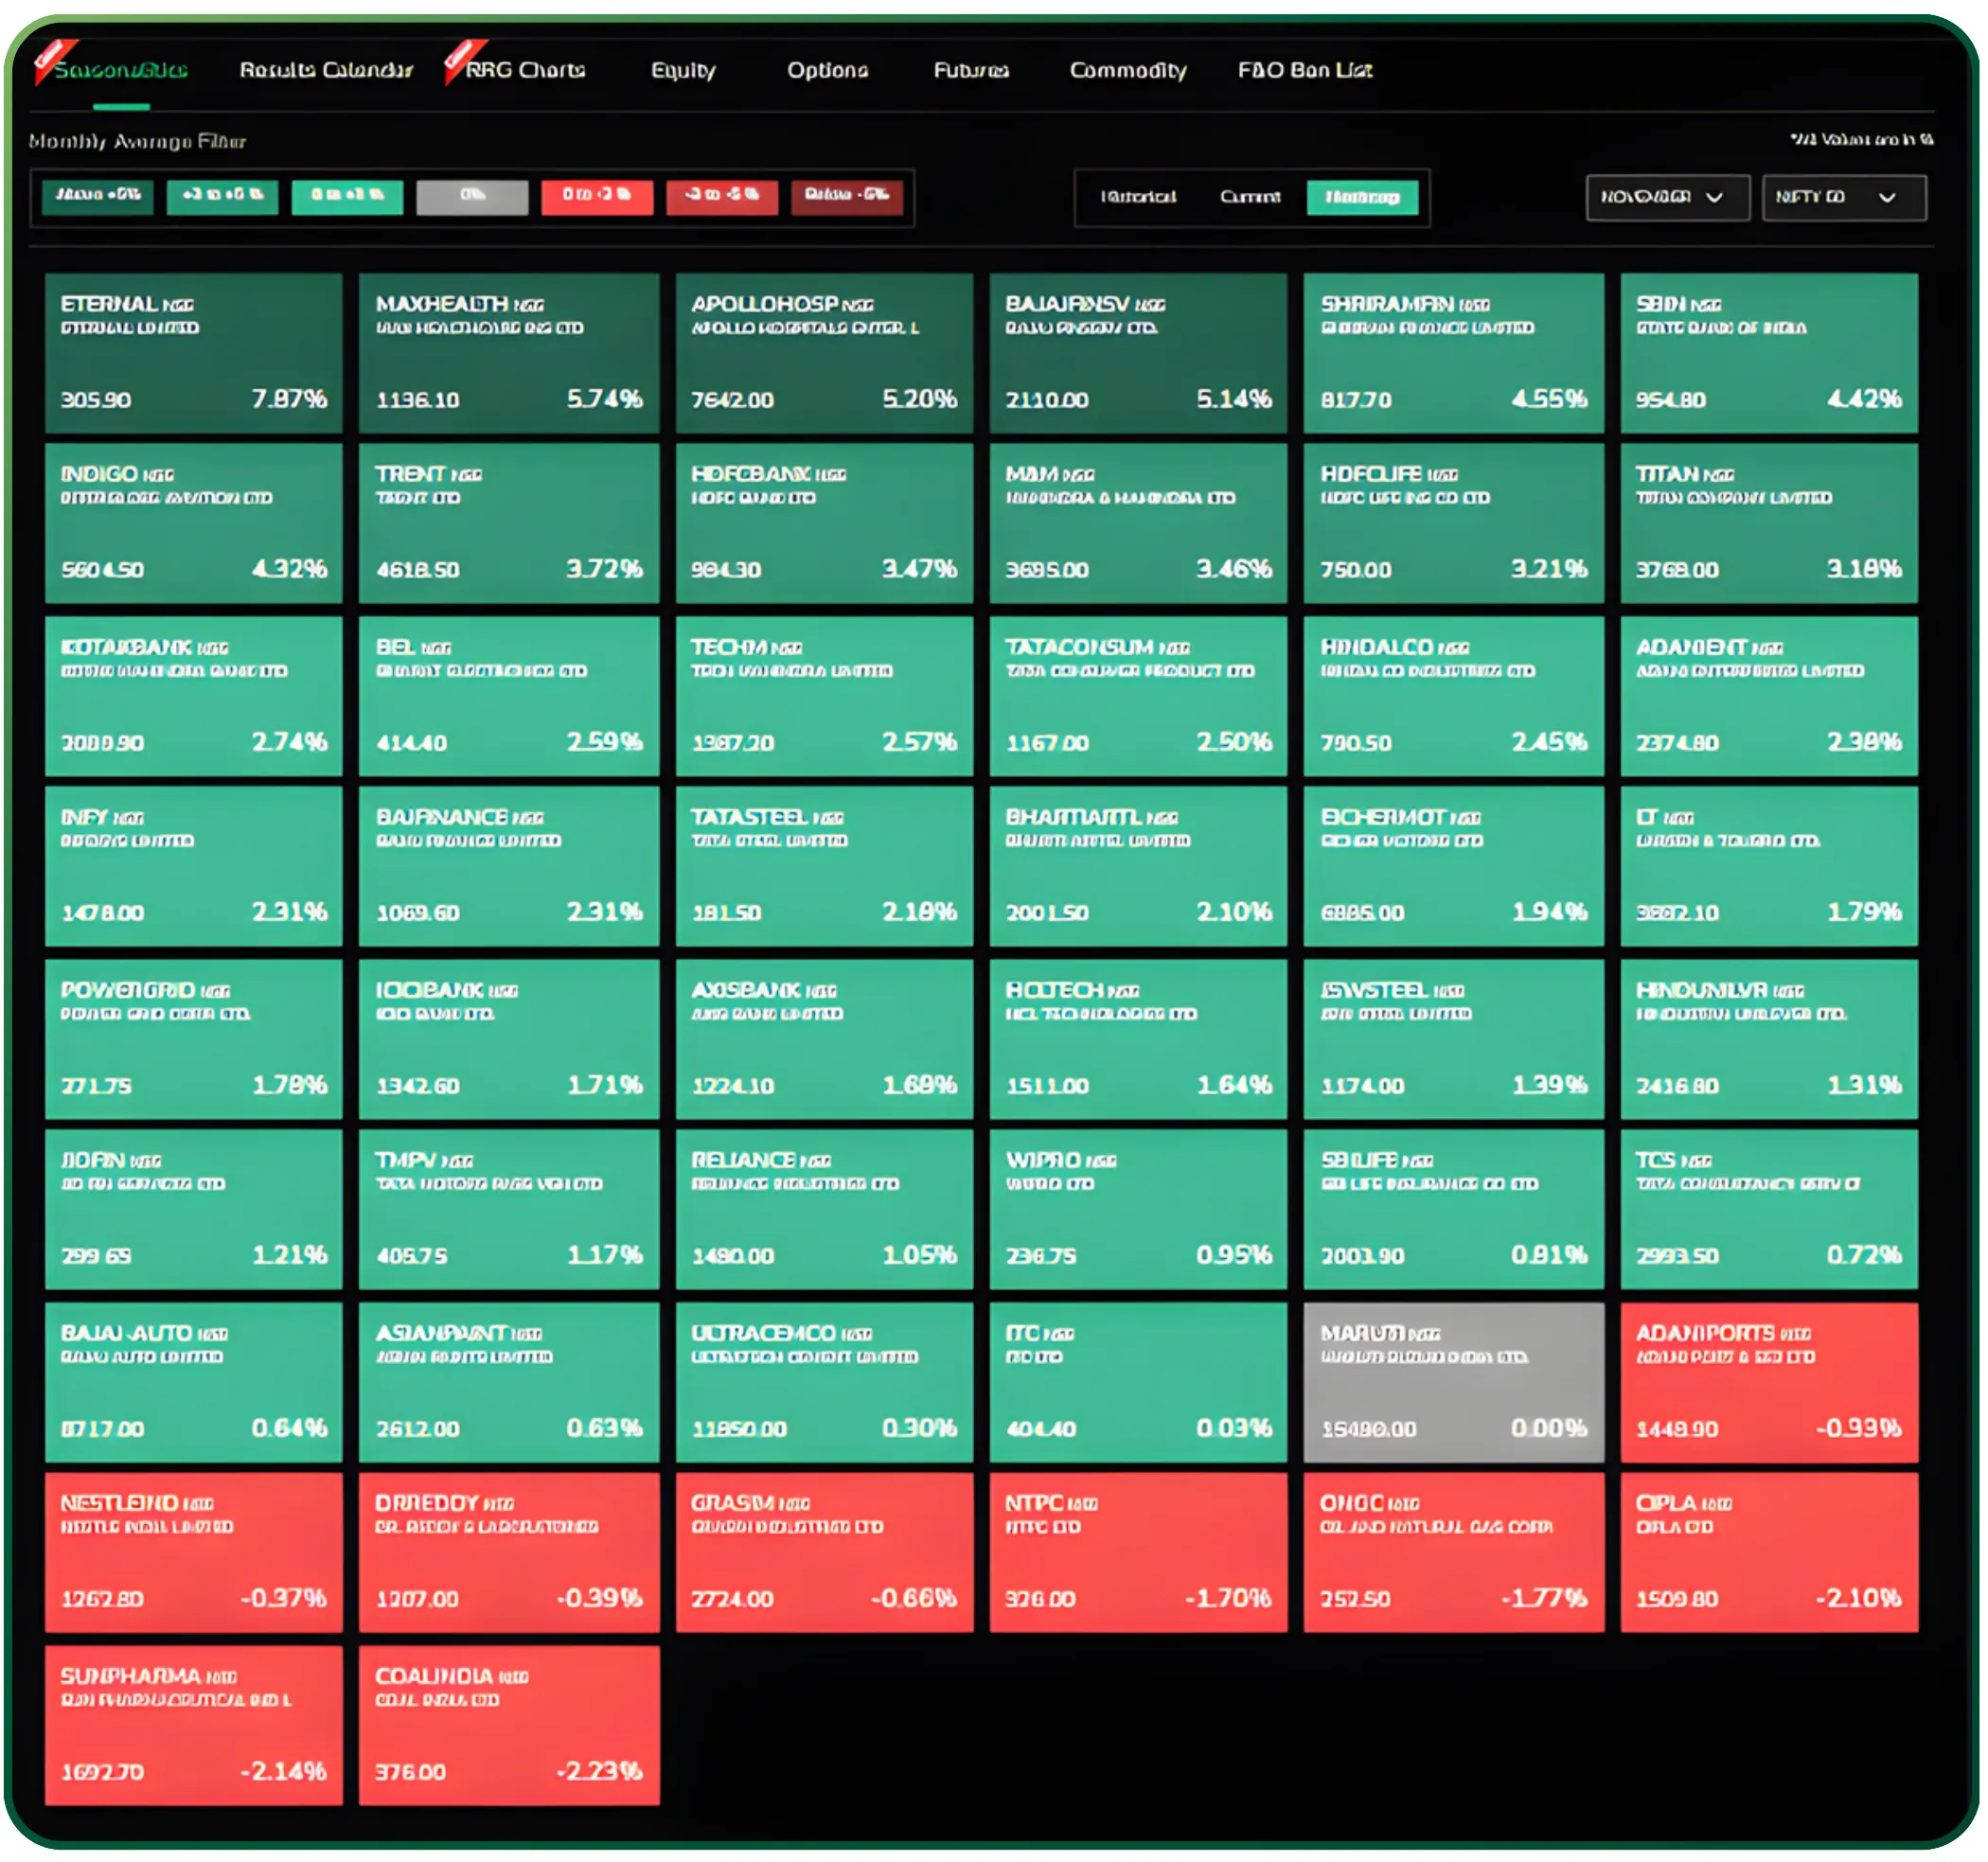
This alignment between historical patterns and current market conditions reinforces how seasonality trading can help traders anticipate recurring patterns across stock indices. Eternal Ltd, Zomato’s parent company, has emerged as one of the stronger performers, reflecting strength in the digital and e-commerce segment. Max Healthcare and Apollo Hospitals continue to show steady gains, reinforcing the healthcare sector’s seasonal reliability.
Meanwhile, HDFC Bank, ICICI Bank, and Titan remain stable contributors from the banking and consumption clusters. On the downside, ONGC, Coal India, and NTPC are once again lagging — a continuation of their historically weaker November patterns.
This consistency between past averages and current trends shows that Nifty 50’s seasonal bias toward defensives and consumer-linked names remains intact.
Nifty Next 50: Seasonality Favors PSU and Infrastructure Stocks
Then: Historical Seasonality
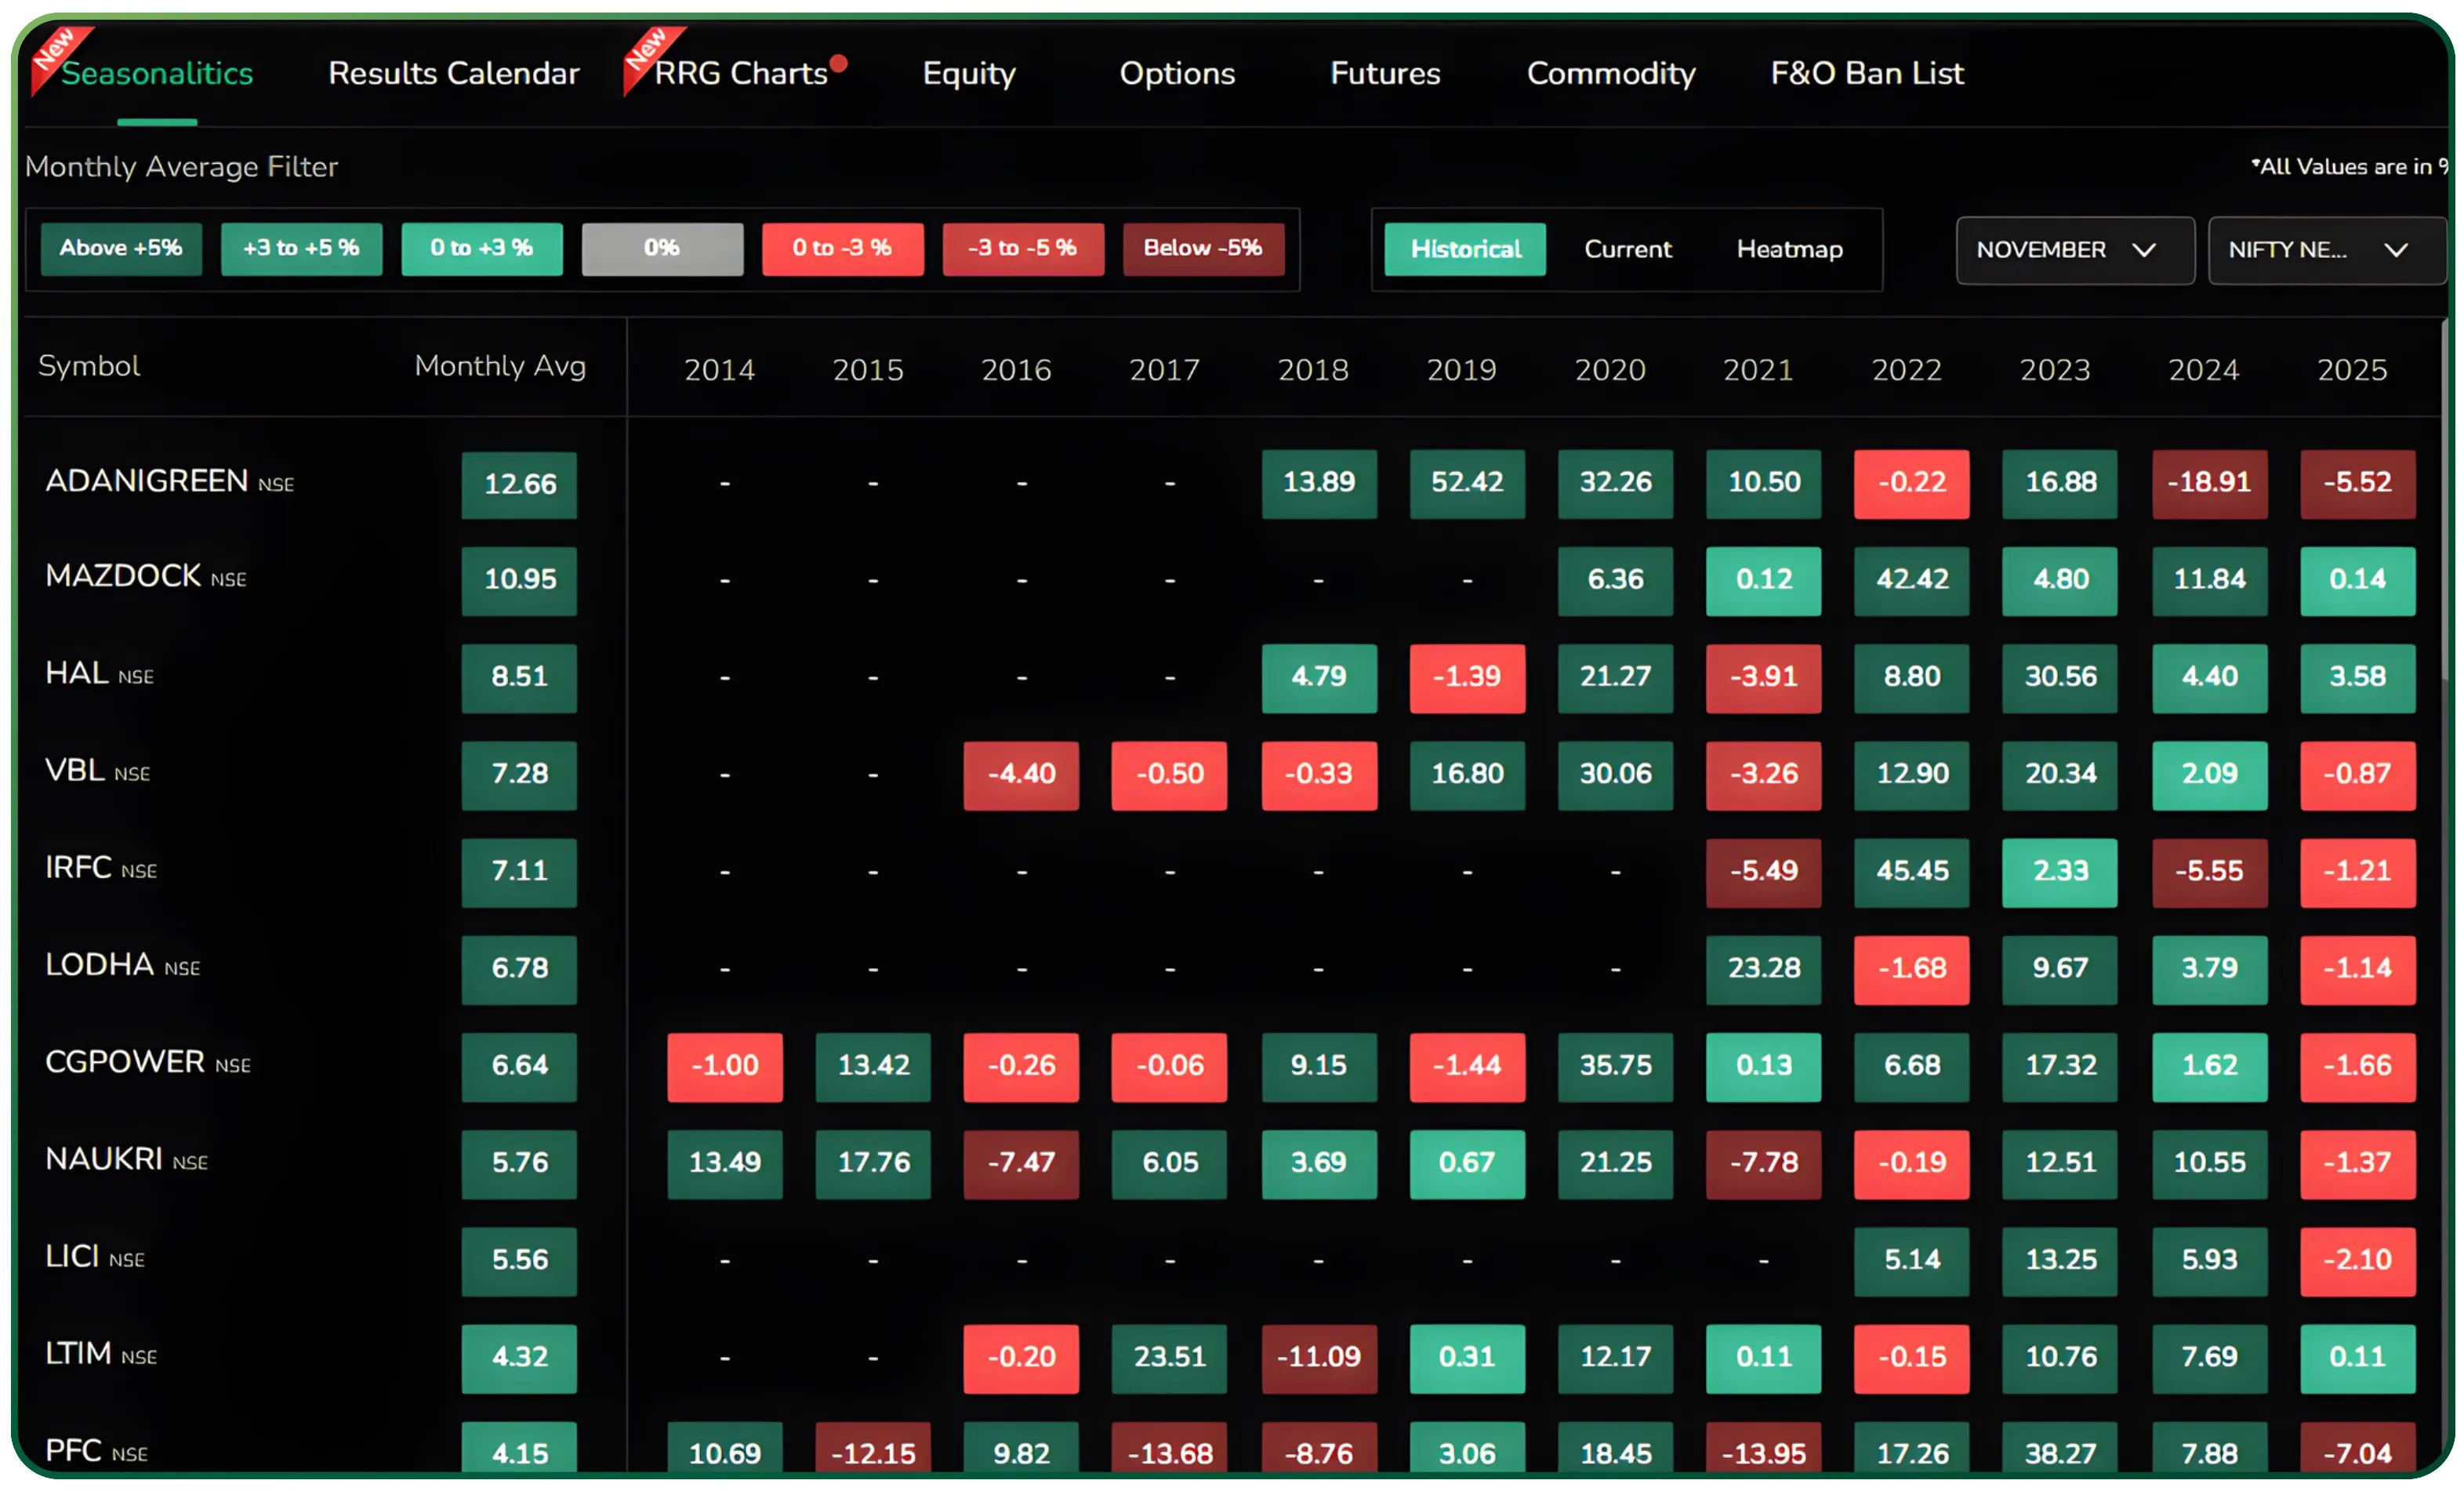
The Nifty Next 50 index has historically shown robust November performance driven by industrial, PSU, and manufacturing sectors. The historical chart repeatedly highlights names like HAL, Mazagon Dock, IRFC, PFC, and VBL delivering green patches across multiple years.
In contrast, select private-sector and consumer names such as Bajaj Finance and Adani Enterprises have exhibited flatter or slightly negative averages — often cooling off after prior rallies.
Now: November 2025
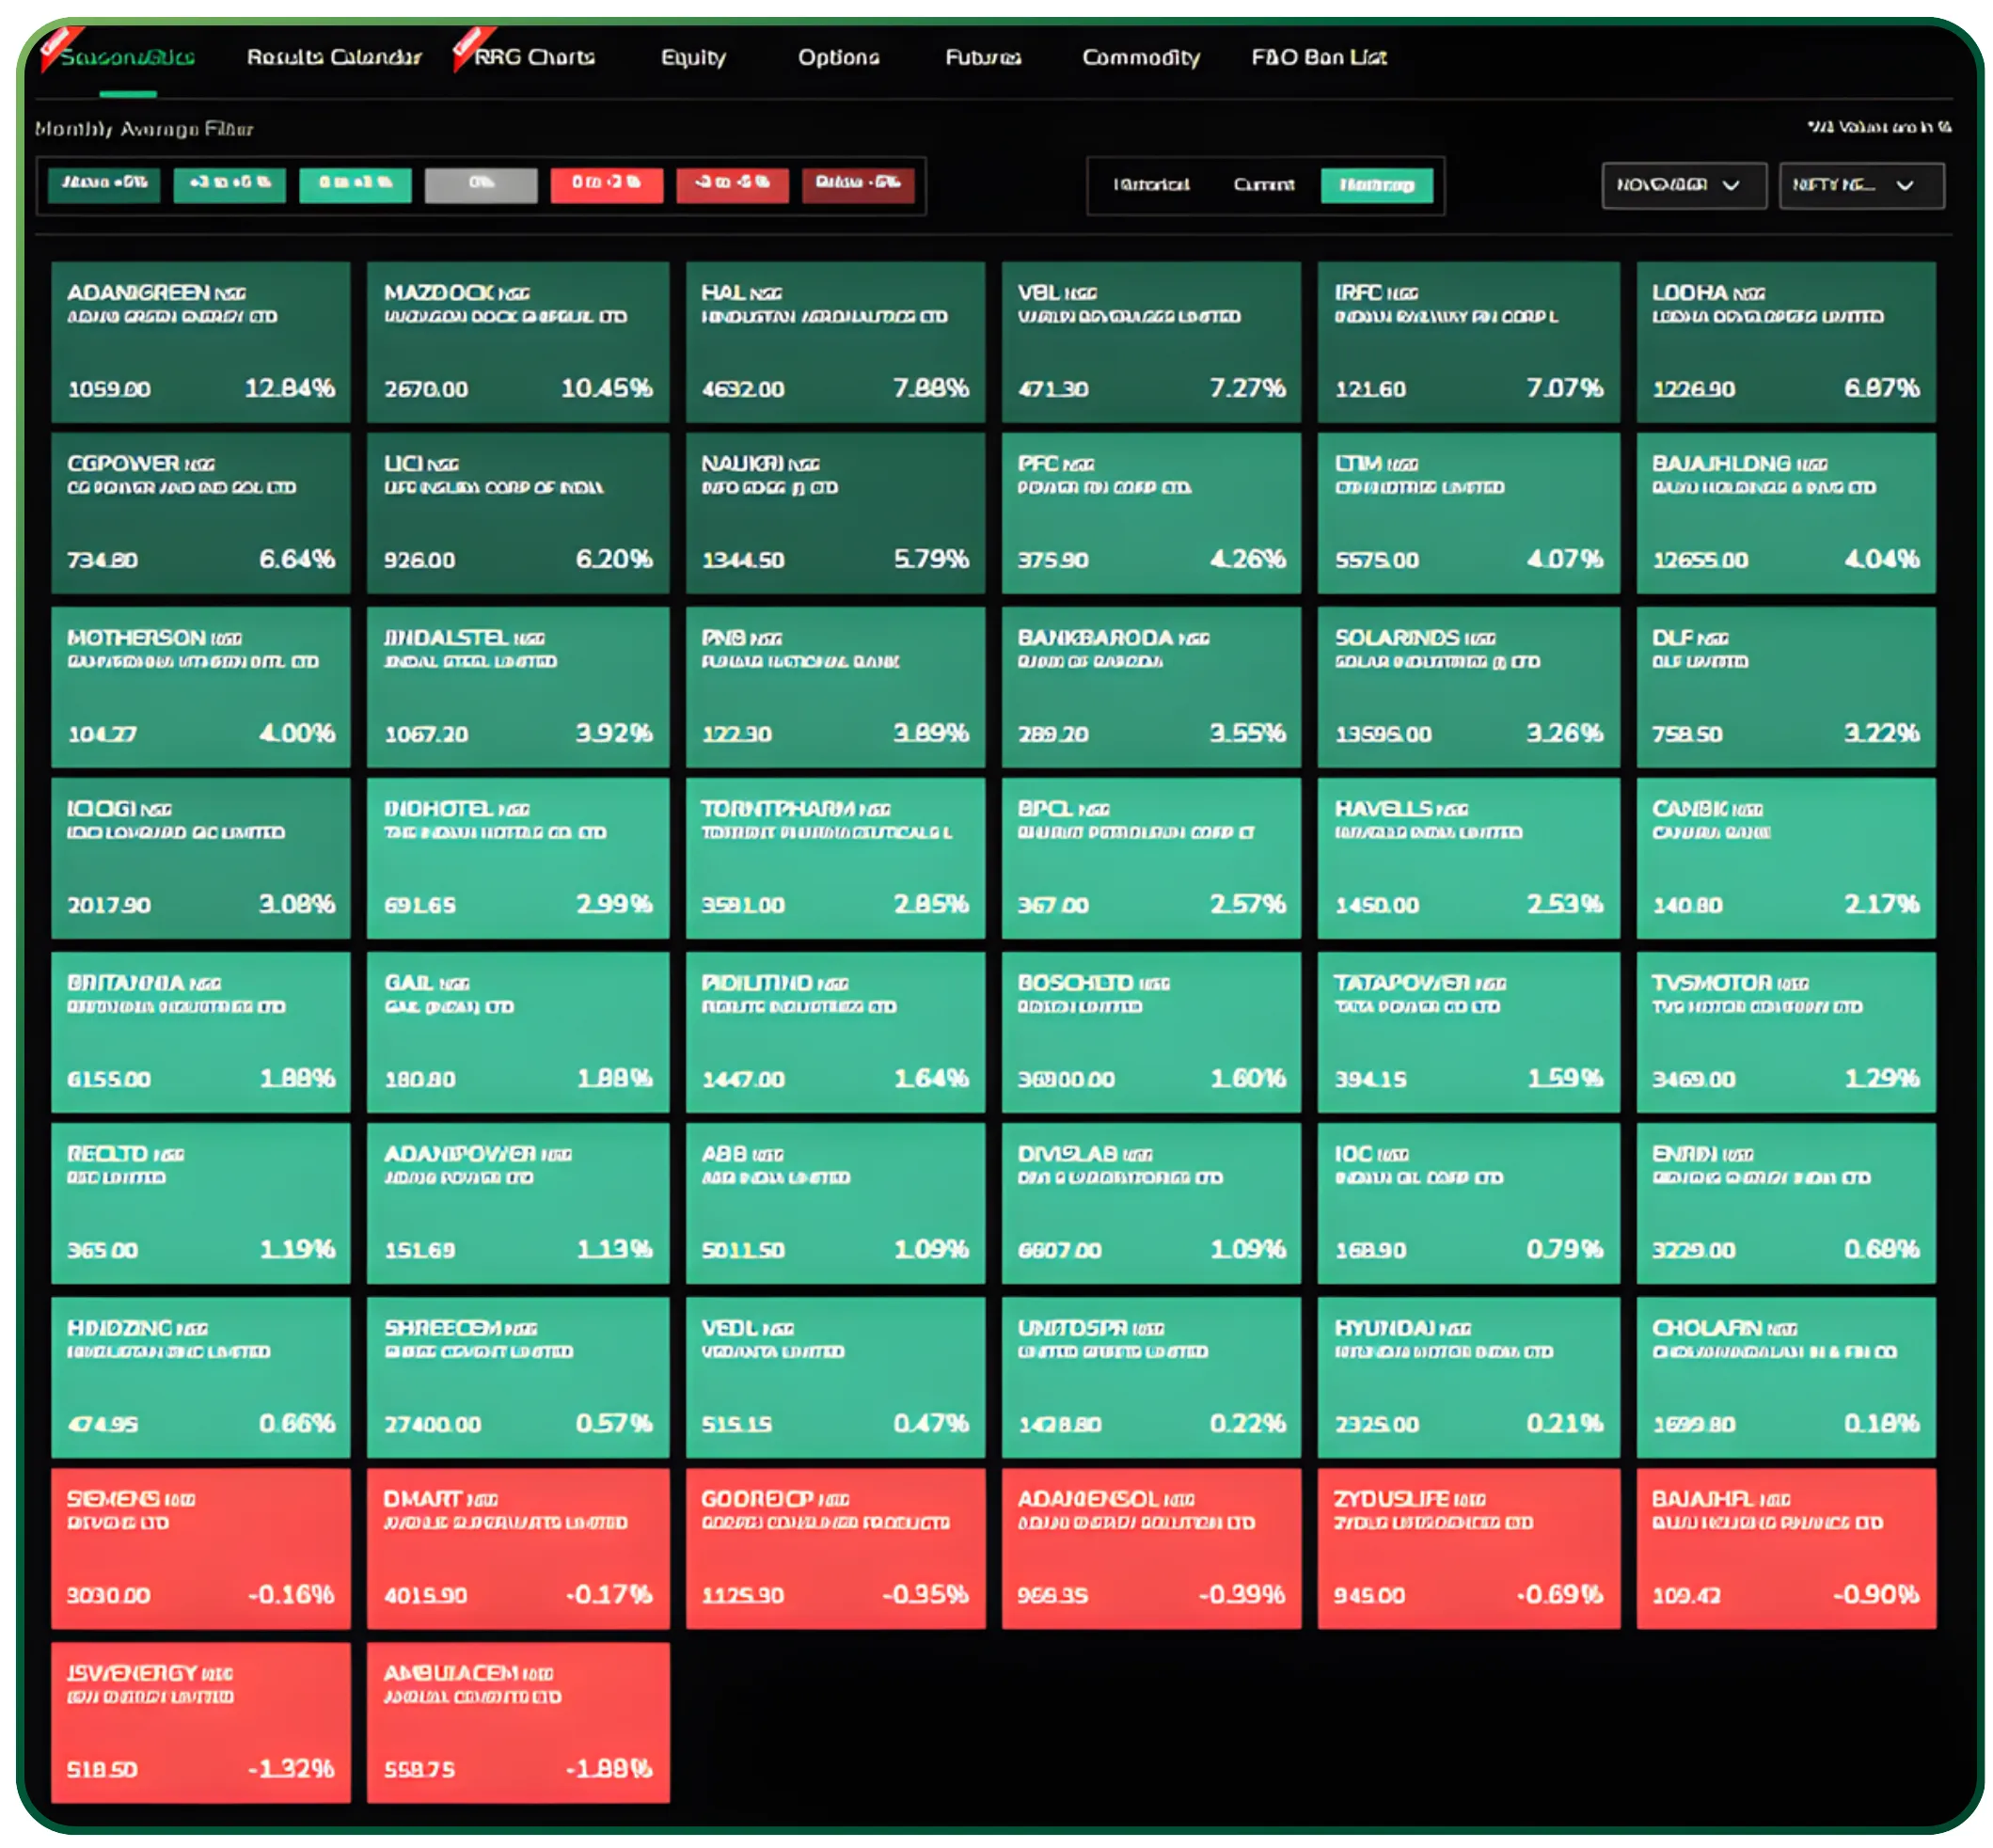
This year’s data continues that pattern almost perfectly. HAL, Mazagon Dock, and Varun Beverages are all posting strong gains of 7–10%, while IRFC and PFC have added solid mid-single-digit returns. PNB and Bank of Baroda are also contributing positively, underlining how PSU and financials remain a November mainstay.
At the same time, Adani Enterprises and Bajaj Finance have seen mild pullbacks — consistent with their historical November behavior. The takeaway is clear: the Nifty Next 50 continues to reward infrastructure and PSU-linked names, sustaining its long-standing seasonal momentum. For investors applying seasonality trading strategies, this illustrates the power of studying historical data and identifying seasonal trends that tend to repeat across certain periods.
Nifty Midcap 100 Seasonal Trends: Manufacturing and Capital Goods Rally
Then: Historical Seasonality
The Midcap 100 index has historically displayed strong November performance in manufacturing, capital goods, and financial services. Stocks like Adani Total Gas, KPR Tech, RVNL, HUDCO, and AB Capital frequently appear in the green zone on the historical chart, often posting gains between 7–15% during this period.
This strength is typically associated with India’s capex cycle, post-festive infrastructure momentum, and increased mid-year disbursements for government projects — all of which tend to boost midcaps ahead of the fiscal close.
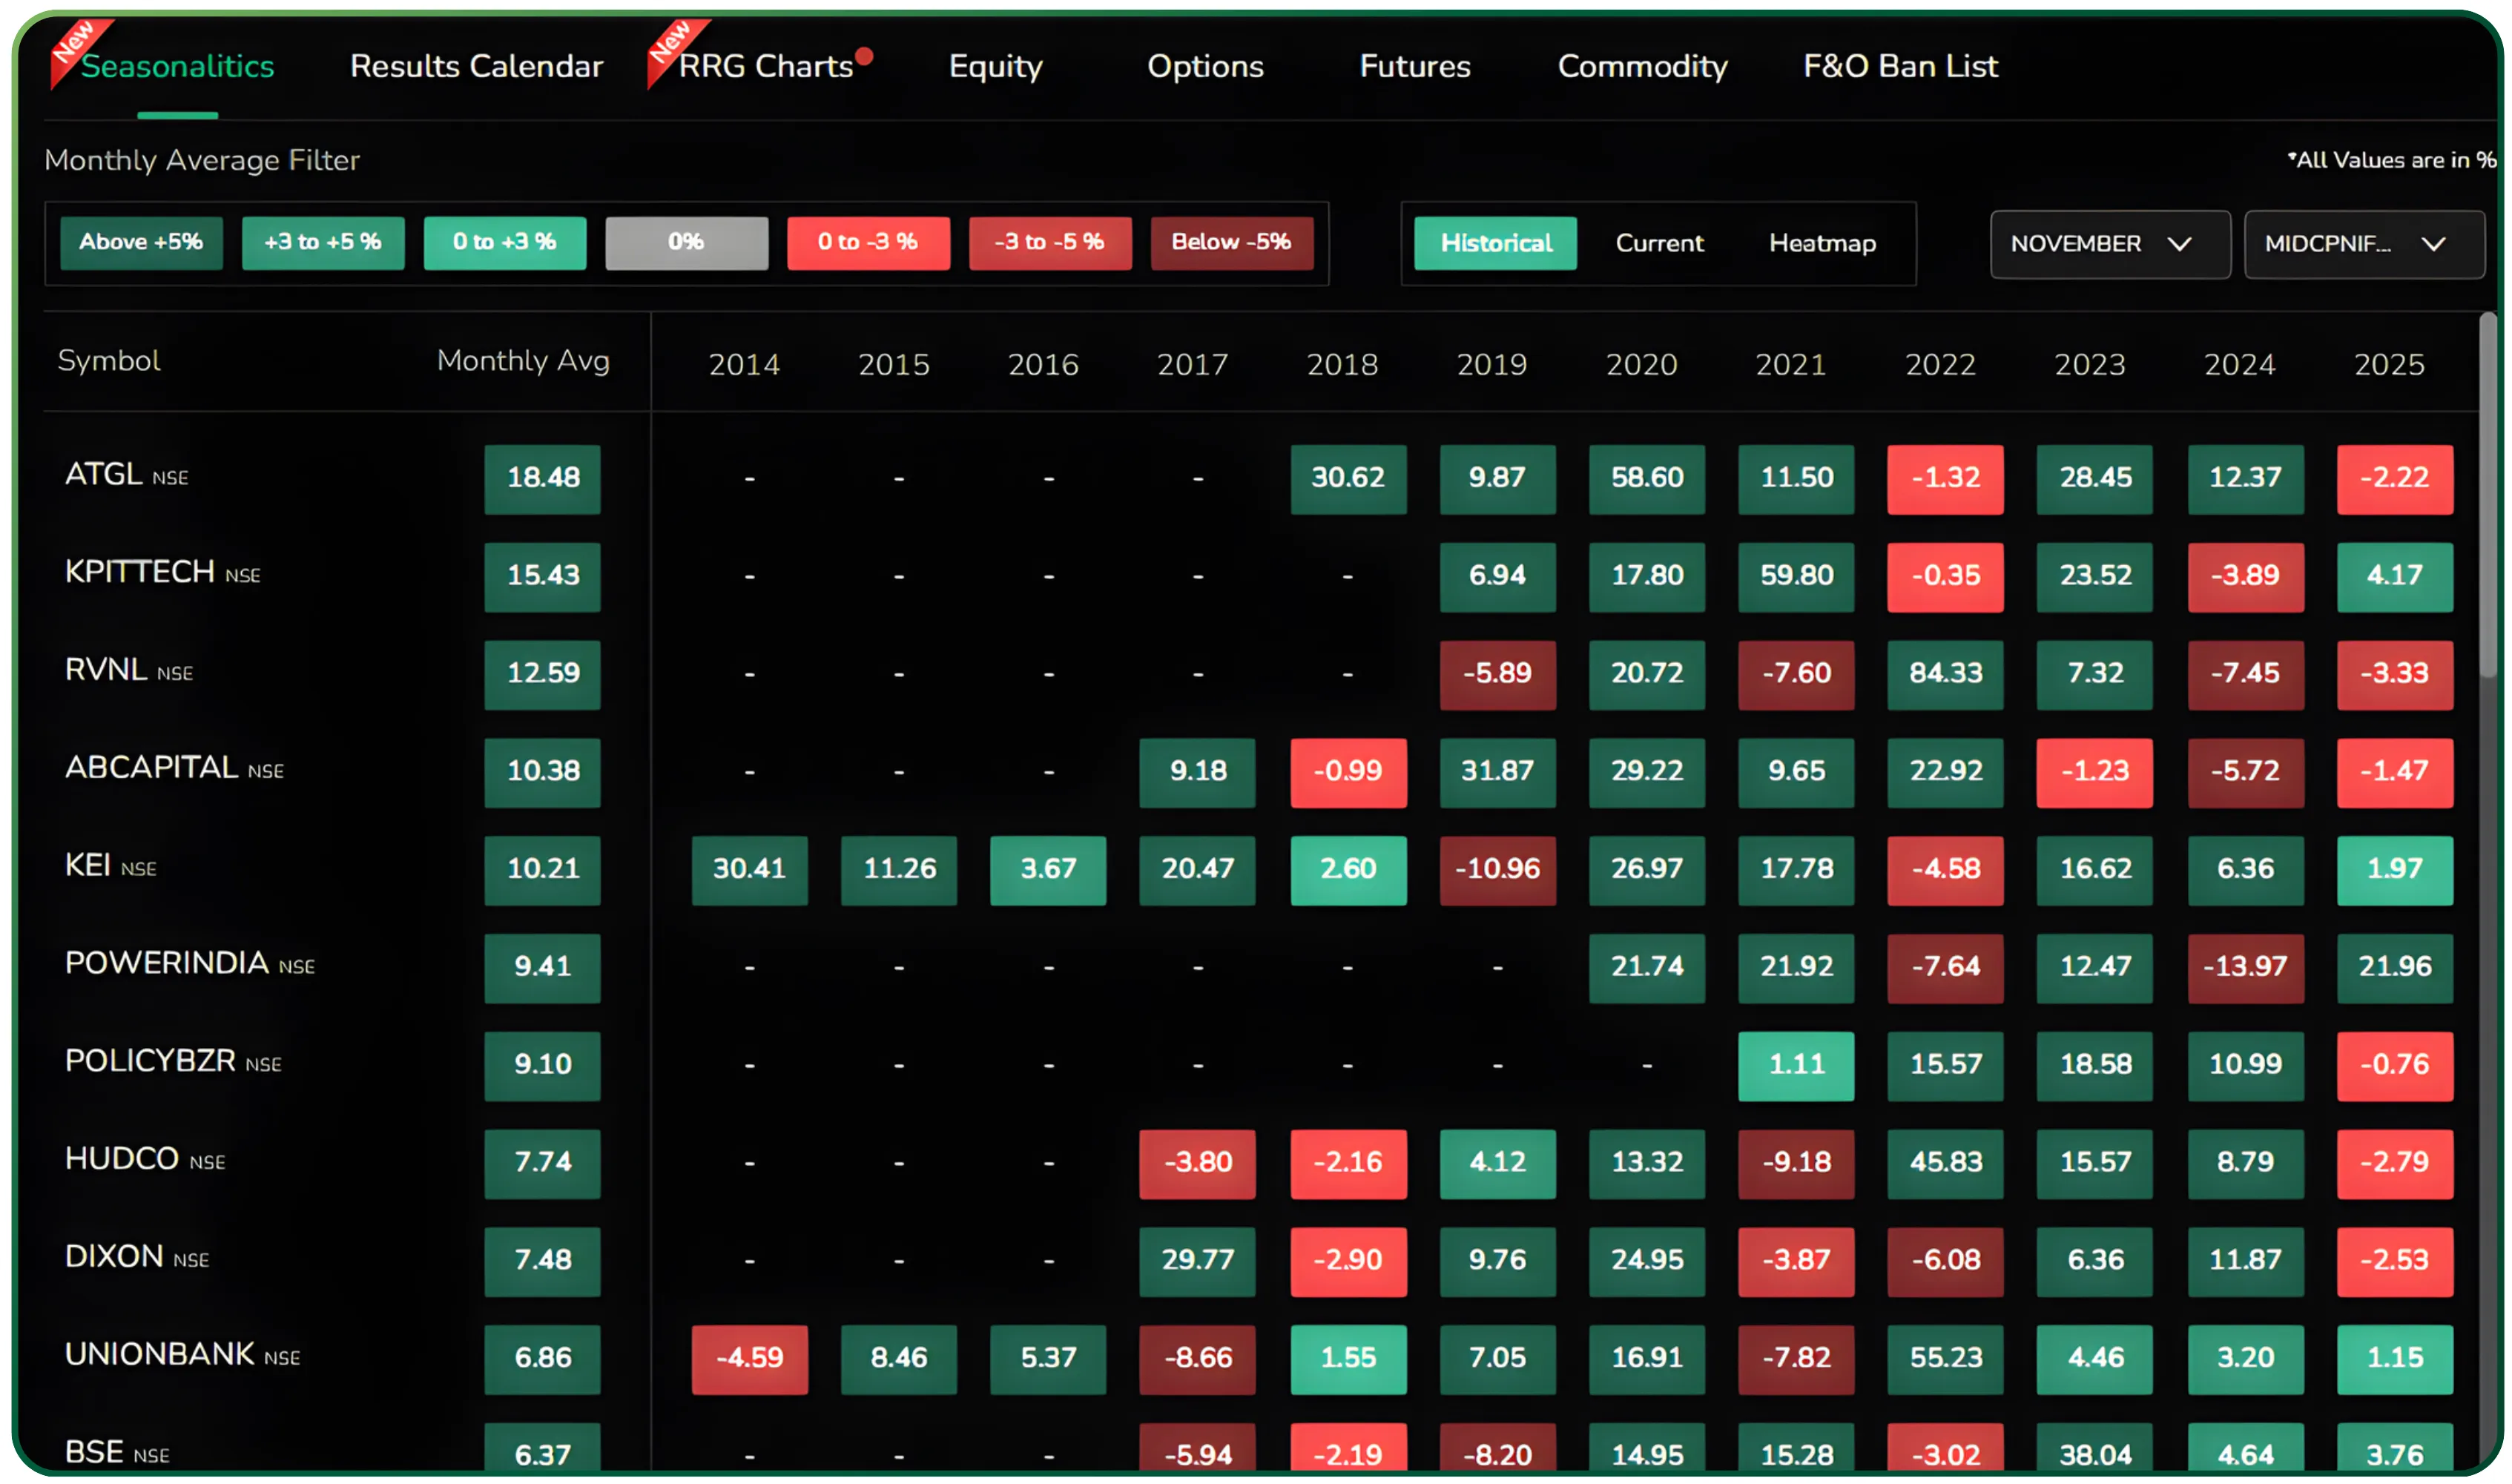
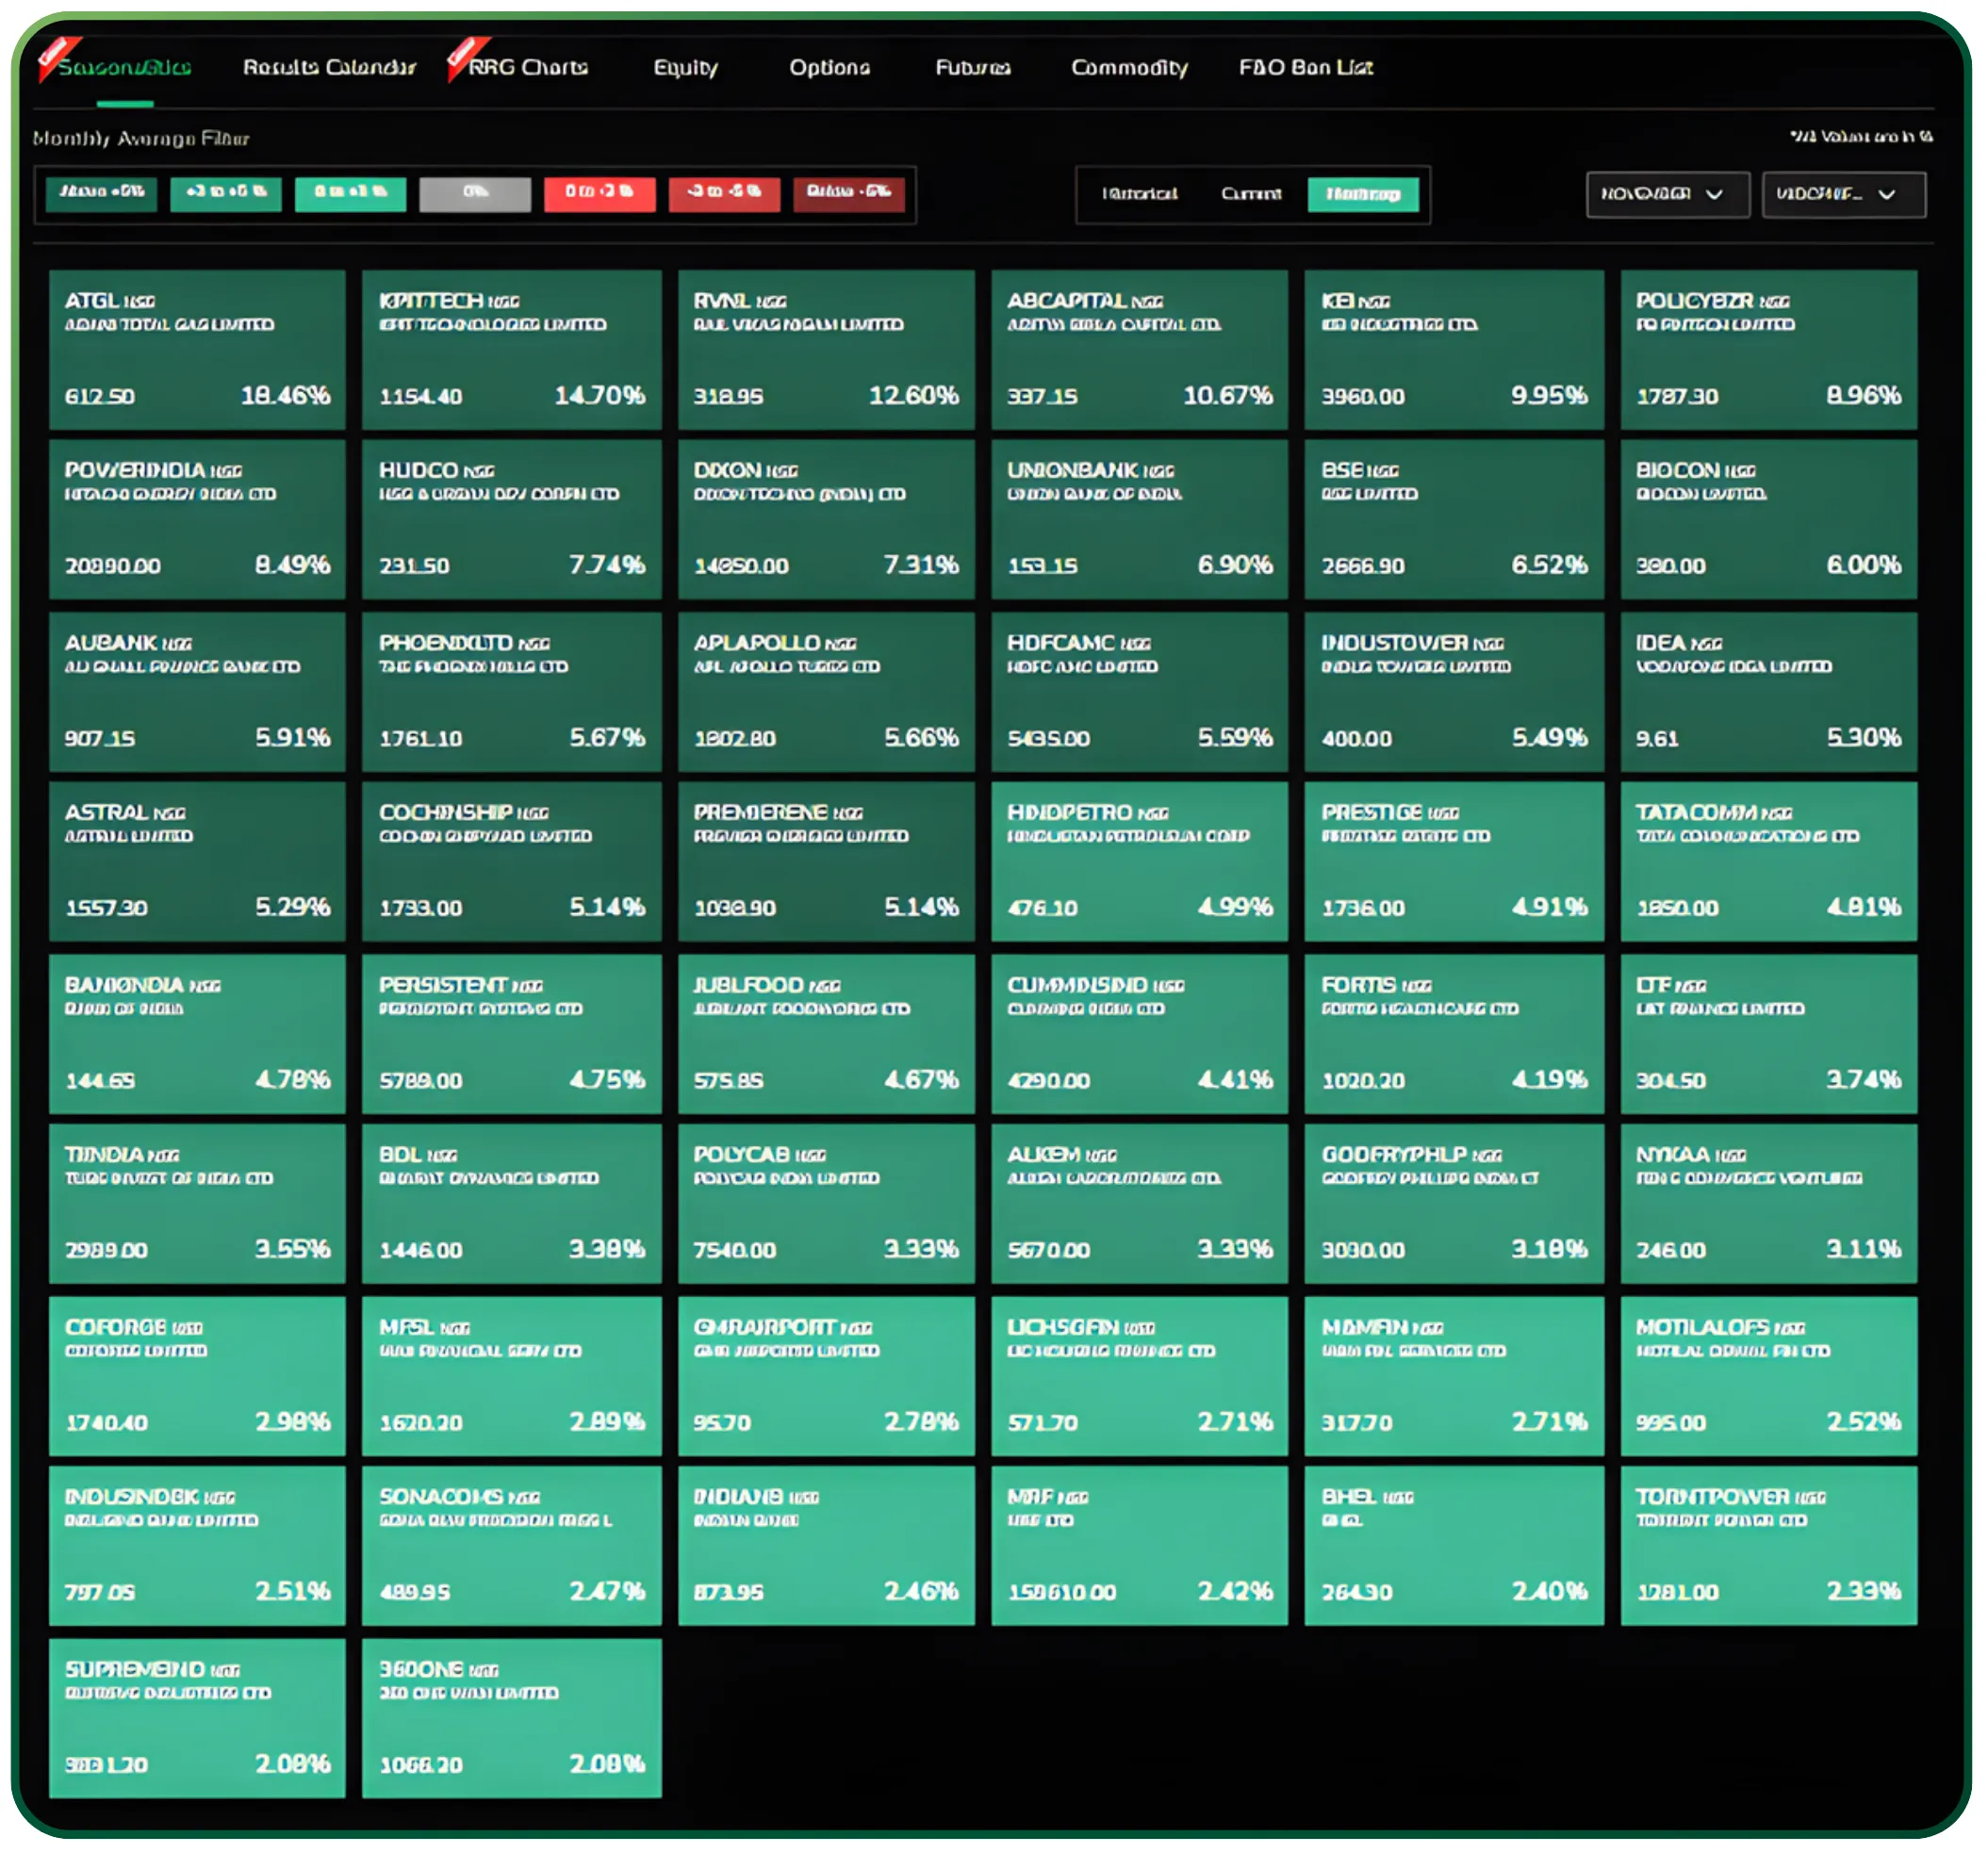
Now: November 2025
This year’s data supports that historical bias perfectly. Adani Total Gas leads the pack with gains exceeding 18%, followed by KPR Tech (≈14%) and RVNL (≈12%). HUDCO and AB Capital continue to show their seasonal strength, both up by around 7–8%.
Additionally, HDFC AMC, Apollo Pipes, and Prestige Estates have posted healthy returns, reflecting investor preference for mid-sized companies with earnings visibility. The midcap segment’s strong alignment with historical seasonality reinforces its role as a key driver of November performance.
Traders often use this historical tendency to build trading strategies around high-probability periods such as November, when market stocks show predictable patterns of strength.
Nifty Smallcap 100: Seasonal Trading Patterns Continue to Outperform
Then: Historical Seasonality
No index captures the November seasonality effect better than the Nifty Smallcap 100. Over the past decade, this index has shown the highest frequency of positive Novembers, with widespread green zones visible across most years.
Historically, Sagility, KFin Technologies, Wockhardt, WilCorp, and Aegis Logistics have been strong November performers. The trend often correlates with renewed retail inflows, improving liquidity, and optimism around mid-year growth.
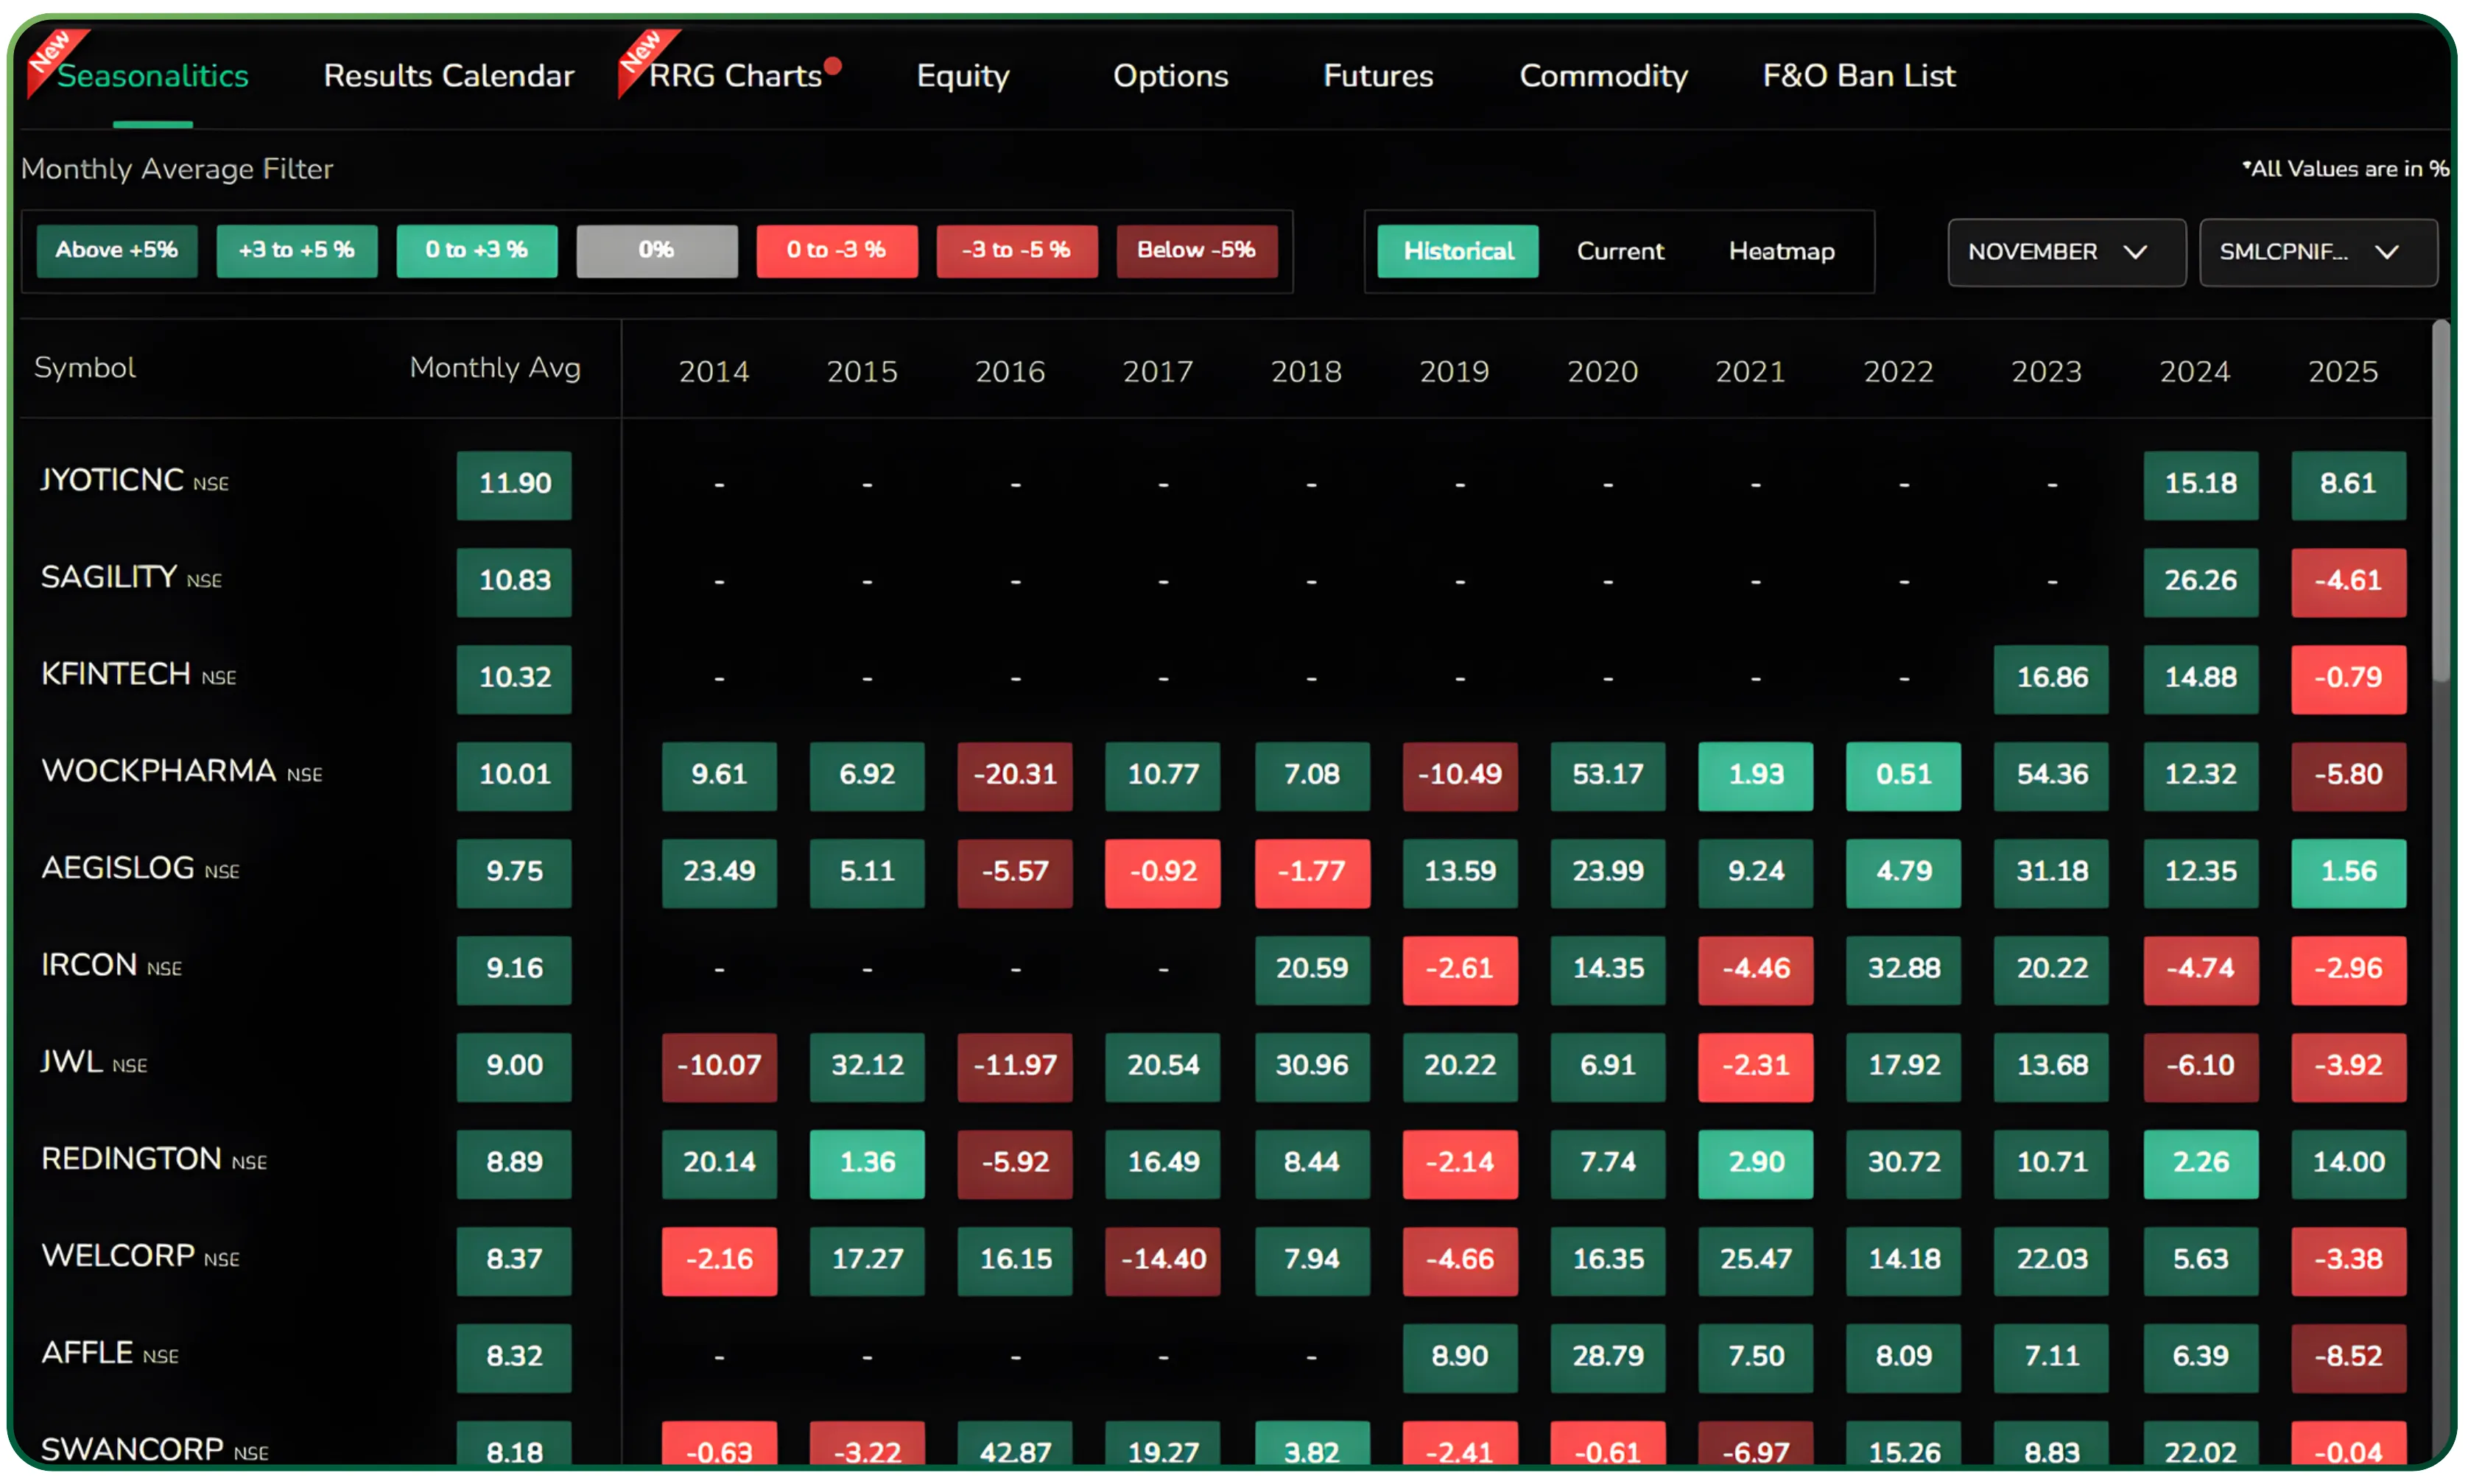
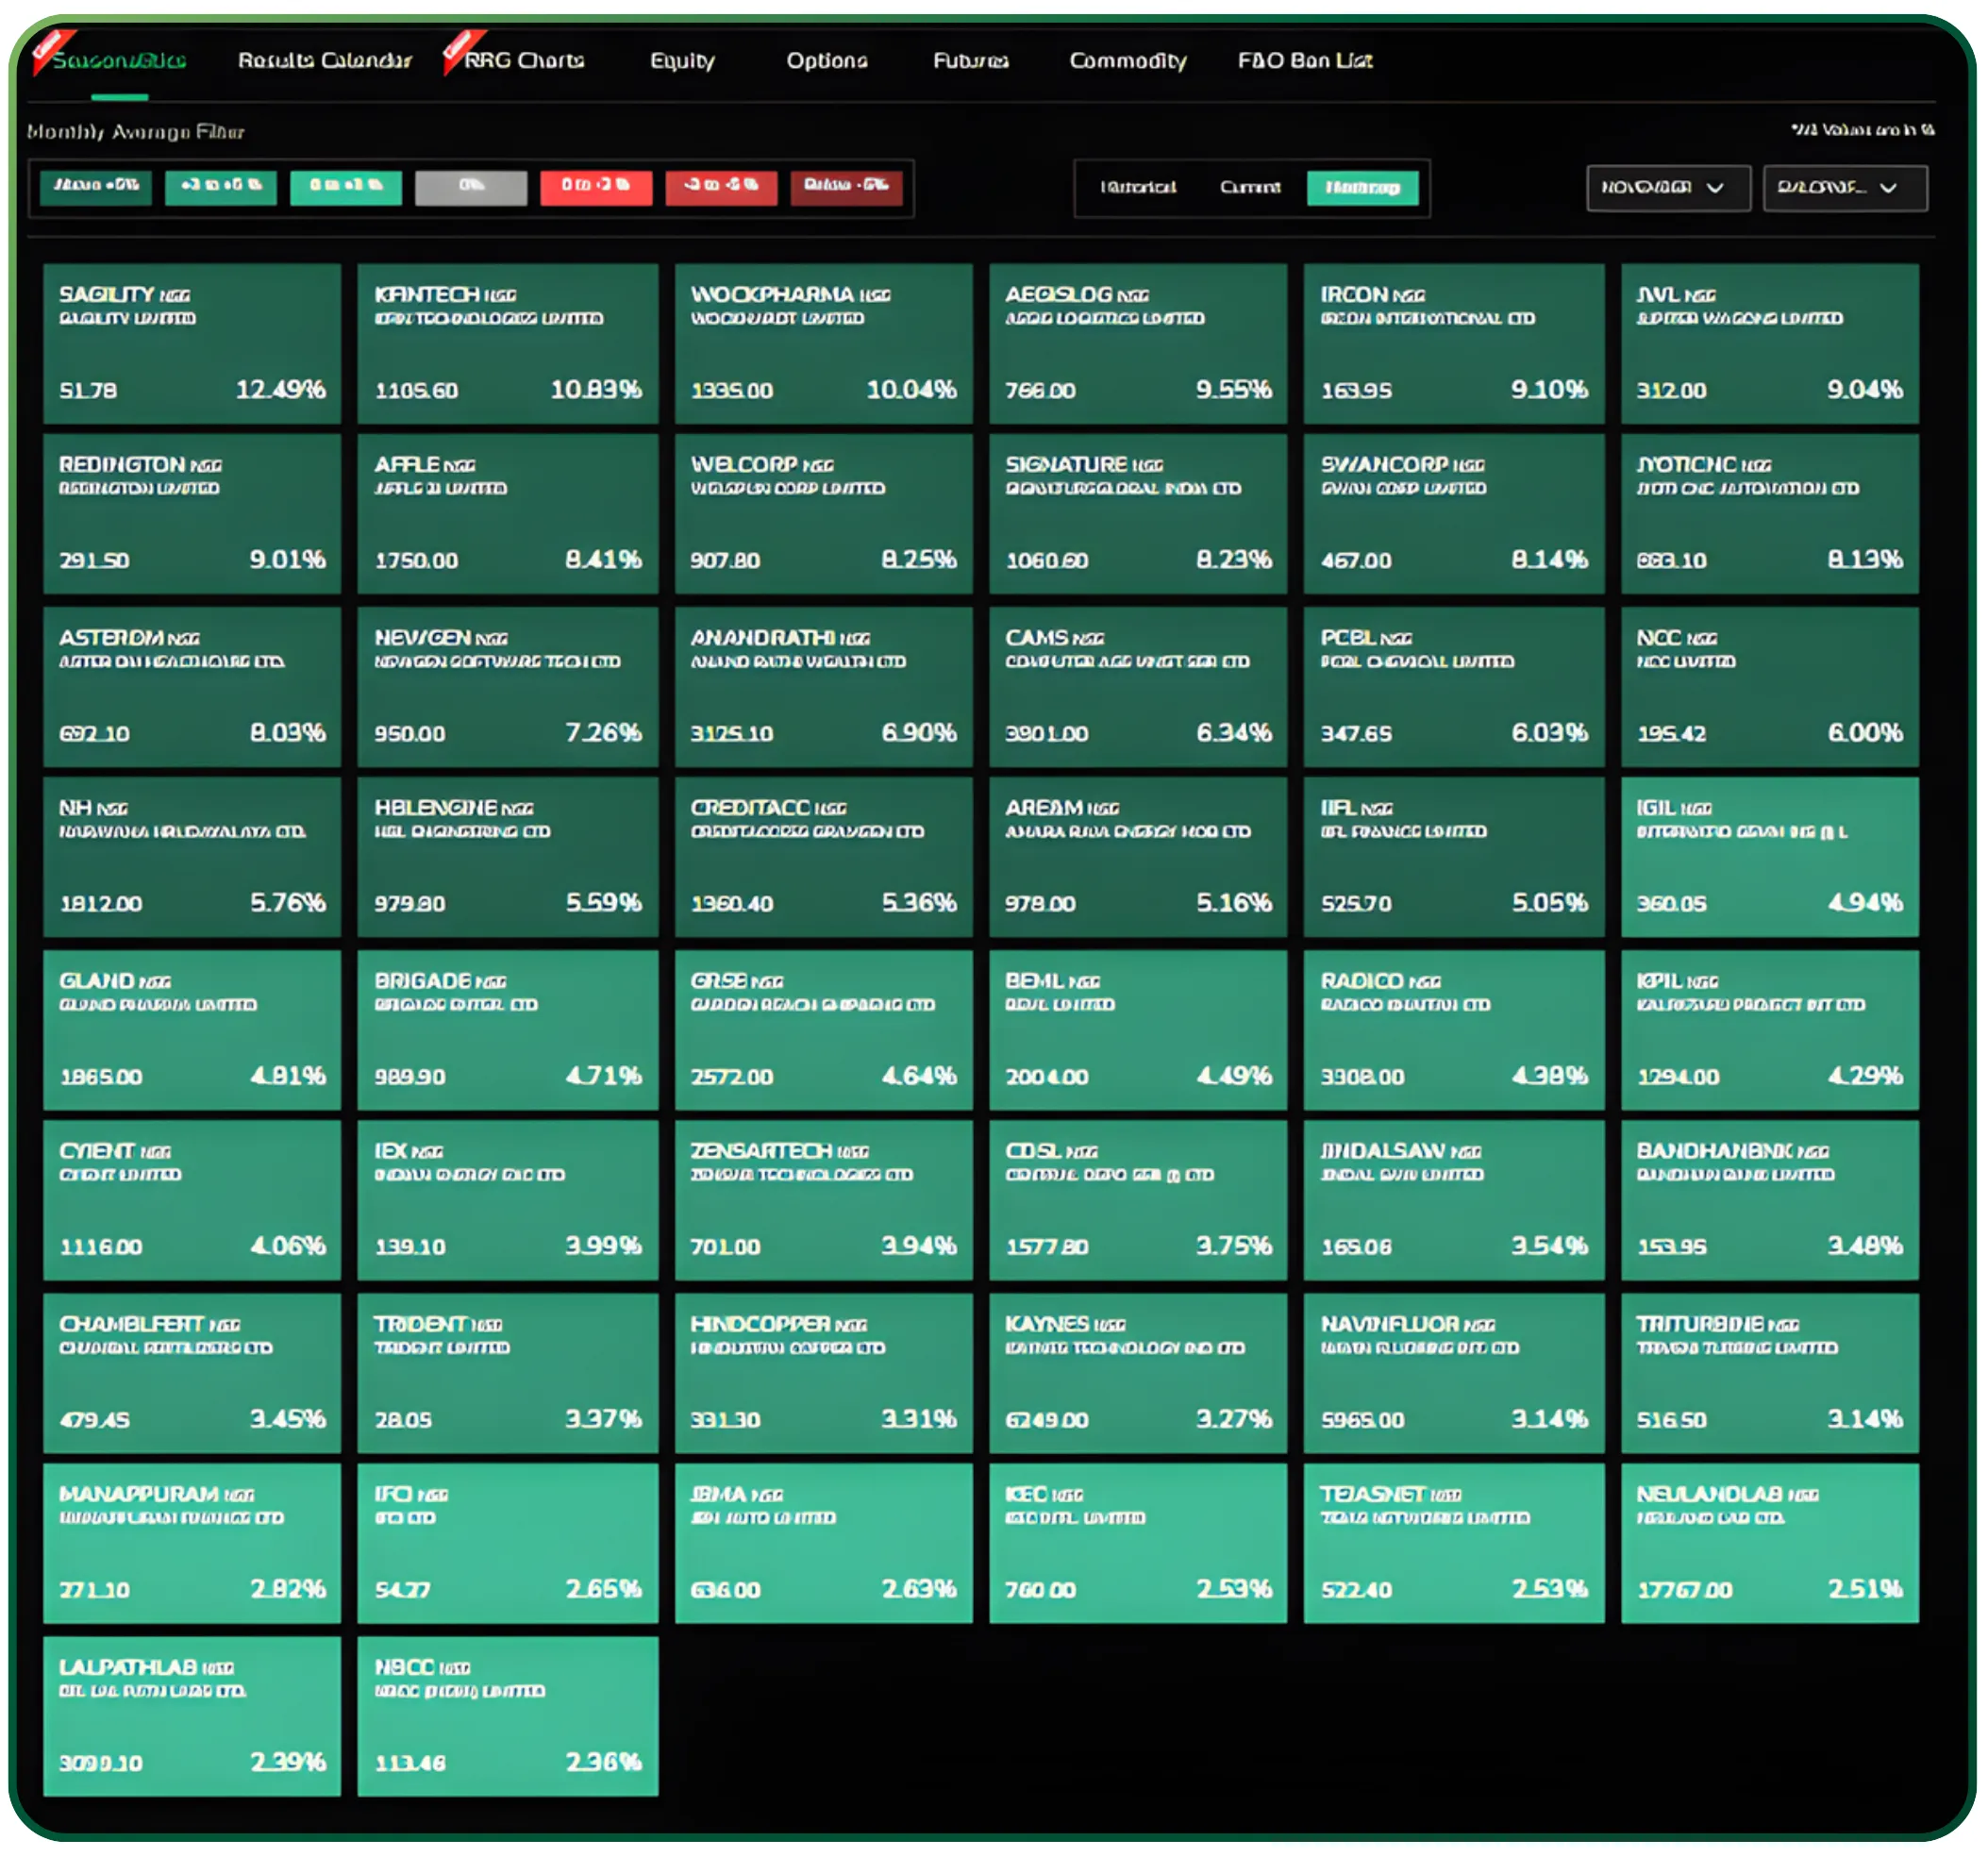
Now: November 2025
The current November data mirrors those historical patterns remarkably well. Sagility leads with approximately 12% average gains, followed closely by KFin Technologies, Wockhardt, and Aegis Logistics, each up 8–10%. Jyothi Labs, Swan Energy, and PCBL also remain firmly positive, contributing to the broad-based smallcap rally.
This breadth of green across the Smallcap 100 suggests that investor risk appetite remains elevated, in line with the segment’s long-term seasonal bias. Historically and presently, smallcaps tend to outperform when confidence returns — and November 2025 is no exception.
This also reflects the Santa Claus rally and pre-holiday effect, where retail stocks and individual stocks tend to perform better in the holiday season due to optimism and year-end bonuses.
Seasonality Trading Insights: What Historical Patterns Reveal
With November halfway through, the comparative Seasonalitics data paints a clear picture — history is repeating itself:
- Healthcare, e-commerce, and PSU sectors are driving gains, consistent with their historical averages.
- Commodity-linked names continue to underperform, maintaining their November weakness.
- Midcaps and Smallcaps once again lead the market in relative strength, supported by liquidity and domestic inflows.
This consistency between historical and real-time data reinforces a key insight: seasonality reflects investor behavior, not coincidence. Each November, similar flows, fiscal cycles, and sentiment patterns reappear — shaping outcomes that look strikingly familiar on the charts.
History Doesn’t Repeat, But It Rhymes
As we move through November 2025, the evidence from CubePlus Seasonalitics suggests that the market is closely tracking its historical playbook. From PSU strength in the Nifty Next 50 to midcap and smallcap rallies, the recurring themes are hard to miss.
For traders and investors, this alignment underscores the value of data-backed observation over speculation. Seasonalitics doesn’t predict — it prepares. By revealing how markets have behaved in the past, it gives today’s participants a contextual edge to navigate the present.
If the patterns hold, November could once again end as a constructive month for Indian equities — led by defensives, e-commerce, and capital goods — with smallcaps adding the spark that history has often promised.
In short, the seasonality trading framework offers traders a powerful tool to understand market cycles, manage risk, and position long positions during historically favorable months like November. Whether you’re exploring the January effect, summer months, or the Sell in May pattern, understanding stock seasonality helps investors spot recurring opportunities and make more informed decisions throughout the year.
Disclaimer: The information provided in our blogs is for informational purposes only and should not be construed as financial, investment, or trading advice. Trading and investing in the securities market carries risk. Always conduct your own research and consult with a qualified financial advisor before making any investment decisions. Past performance is not indicative of future results. Copyrighted and original content for your trading and investing needs.
© 2025 — Tradejini. All Rights Reserved.