


Charts often reflect market sentiment before anything else. Among the many price formations traders rely on, the Double Top and Double Bottom are two of the most recognizable patterns that hint at a possible reversal in trend. These setups typically appear when a strong move—either up or down—begins to lose momentum, suggesting that a change in direction could be around the corner.
Learning to recognize these patterns can give you an edge, especially when determining the best time to enter or exit a position. In this article, we'll explore how these patterns form, what they indicate, and how you can apply them to make smarter trading decisions.
What Is a Double Top?
A Double Top is a bearish reversal pattern that typically forms after a sustained uptrend. It signals that the ongoing bullish momentum is fading and that a potential downtrend could be on the horizon.
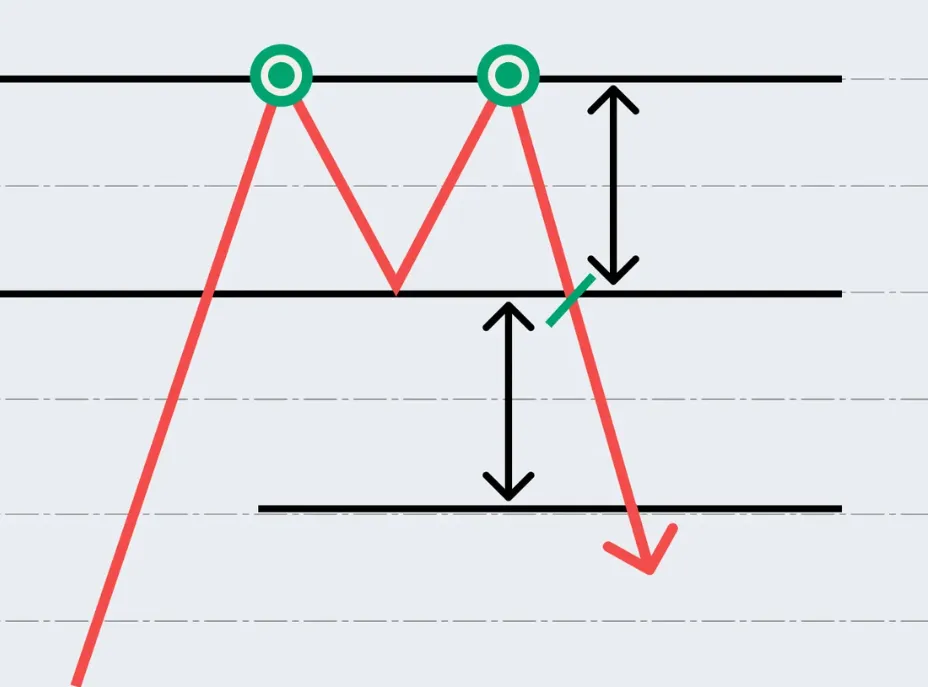
Imagine: the price rises steadily and reaches a high point, then pulls back slightly. It attempts to rally again, but fails to surpass the prior high, creating two distinct peaks at approximately the same level- forming an “M’’ shape on the chart. When the price eventually drops below the low point between the two peaks— the neckline or valley—the pattern is confirmed.
This breakdown signals that buyers are losing control and sellers may be stepping in with more strength.
How to Identify a Double Top
To spot a valid double top, a few key characteristics should be present:
The pattern should form a clear sustained uptrend- without it, the reversal signal is less meaningful.
The two peaks should reach approximately the same price level—ideally within 3% of each other.
Between the peaks, there should be a noticeable valley or dip, often around 10% or more lower than the peaks. This helps define the structure of the pattern.
Volume matters: Higher volume during the first peak and lower volume during the second often indicate weakening buying pressure.
Most importantly, the pattern is only confirmed when the price breaks below the valley. Until then, it could just be a temporary sideways move or consolidation.
The Psychology Behind the Double Top Pattern
At the heart of the double top is a battle between buyers and sellers. During the first rally, buyers are in control, pushing the price to a new high. As some traders take profits, the price pulls back. Then comes a second attempt—buyers try once more to drive prices higher but fail to surpass the previous peak.
This hesitation starts to raise red flags. Sellers gain confidence, seeing that buyers are struggling. When the price eventually breaks below the valley between the two peaks, it confirms a shift in momentum. What was once a bullish market now starts to tilt toward bearishness, as the control moves from buyers to sellers.
How to trade double top
Double Top Trade Setup on SHOPPERSTOP Chart (6th Sep 2024 – 1st Oct 2024)
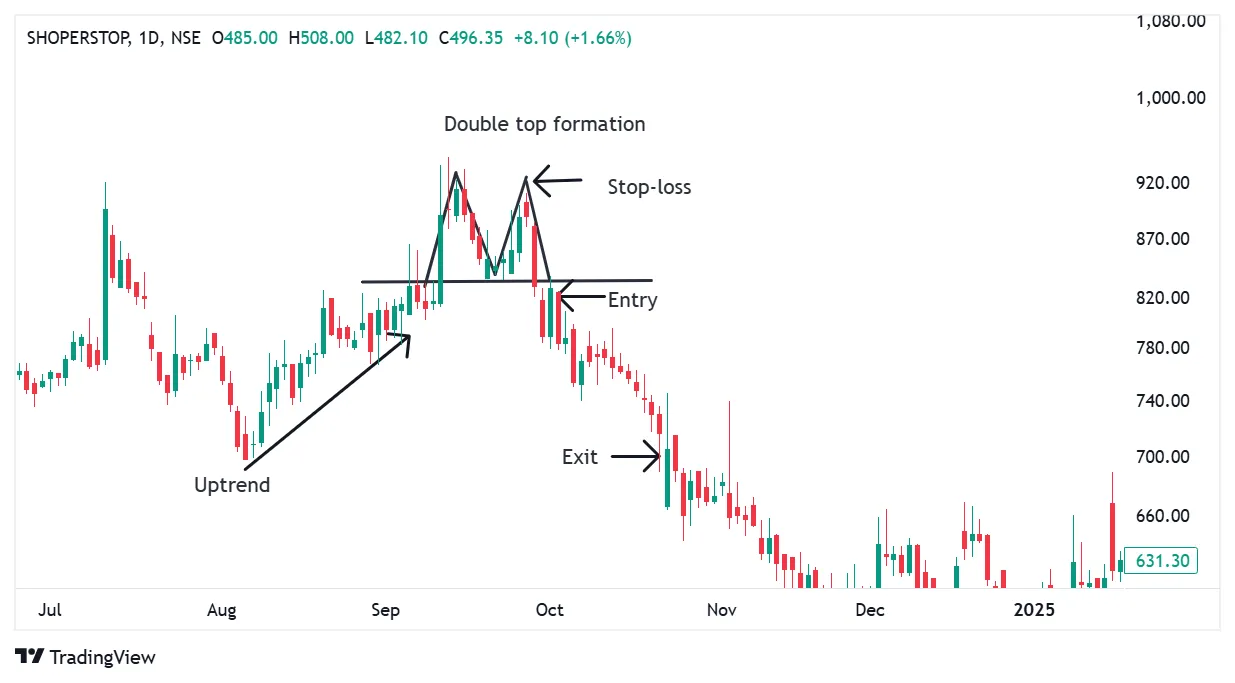
Entry (Sell Position)
Enter a sell position when the price breaks below the neckline after forming the second top.
Entry level: ₹824
Target (Exit Point)
Option 1: Exit around ₹698, where prior swing support was observed
Option 2: Measure the height from the neckline to the peak (Adam top), and project the same distance downward from the neckline for the target
Stop-loss
Place the stop-loss above the high of the second peak (Adam right V)
Stop-loss level: ₹924
What Is a Double Bottom?
A Double Bottom is a bullish reversal pattern that typically forms after a sustained downtrend. It suggests that selling pressure is weakening and that buyers may be preparing to take control. This pattern is the mirror image of the Double Top and often marks the early stages of a potential uptrend.
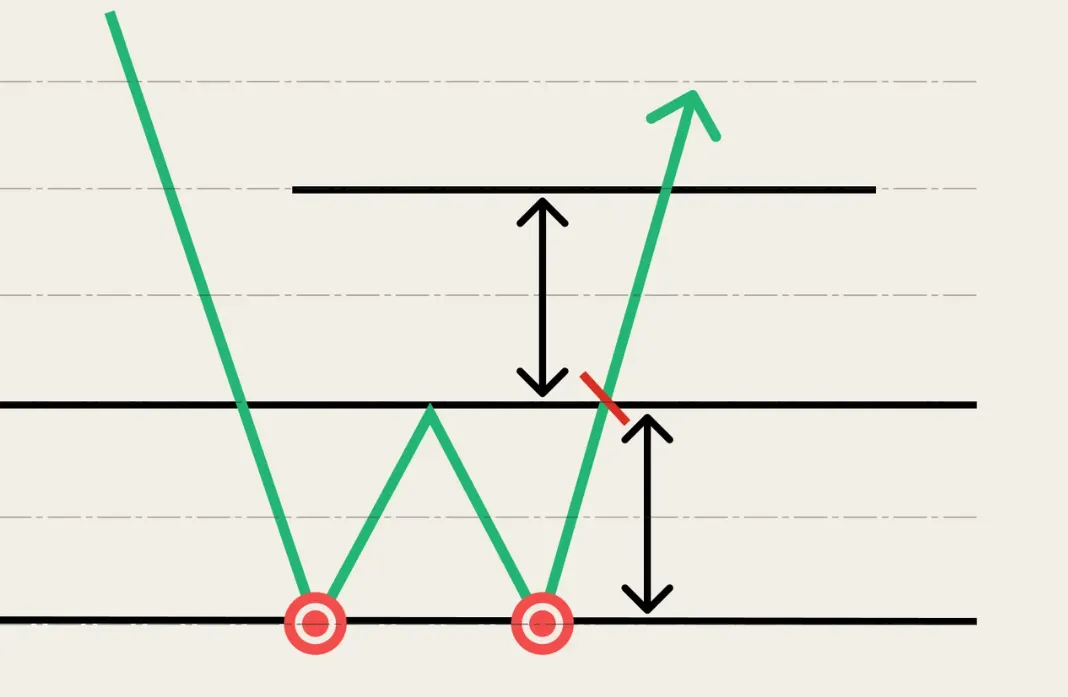
Visually, it resembles the letter “W.” The price falls and hits a low, then rebounds briefly before falling again to retest that same low. When the price fails to break below the previous lows, the pattern is confirmed. This breakout indicates a shift in sentiment—from bearish to bullish.
How to Identify a Double Bottom
Key Criteria for a Valid Double Bottom:
The pattern must begin with a clear downtrend. This sets the stage for a potential reversal.
The two lows should be near the same price level, ideally within 5% of each other. This shows that support is holding firm.
The peak between the two lows acts as a resistance zone. A breakout above this level signals confirmation of the pattern.
Often, volume is higher during the first bottom and tapers off by the second, indicating that selling pressure is losing strength.
The pattern is confirmed only when the price breaks above the peak between the two bottoms. Until that happens, the move could simply be a sideways consolidation.
What The Psychology Behind the Double Bottom Pattern Reveals?
The double bottom reflects a shift in market sentiment. Initially, sellers dominate, pushing the price down. At the first low, buyers step in, causing a brief bounce. However, the rebound is not strong enough, and the price falls again—testing the previous low.
This second dip is critical. When the price does not break below the first low, it signals that sellers are losing control. Buyers begin to regain confidence and step in more aggressively. Once the price climbs above the resistance level formed between the two lows, it confirms that the trend may be reversing.
In essence, a double bottom is a sign that the worst may be over—and a potential rally could be on the way.
How to trade double bottom
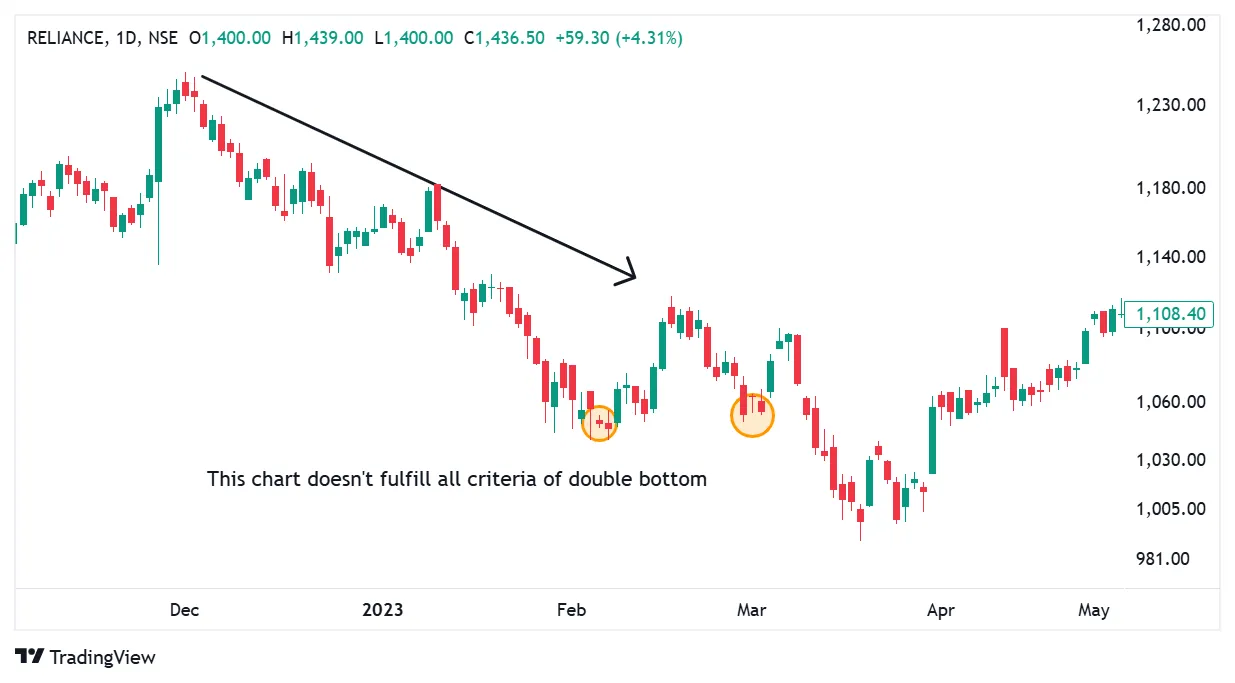
Double Bottom Trade Setup on RELIANCE Chart (May 2024 – June 2024)
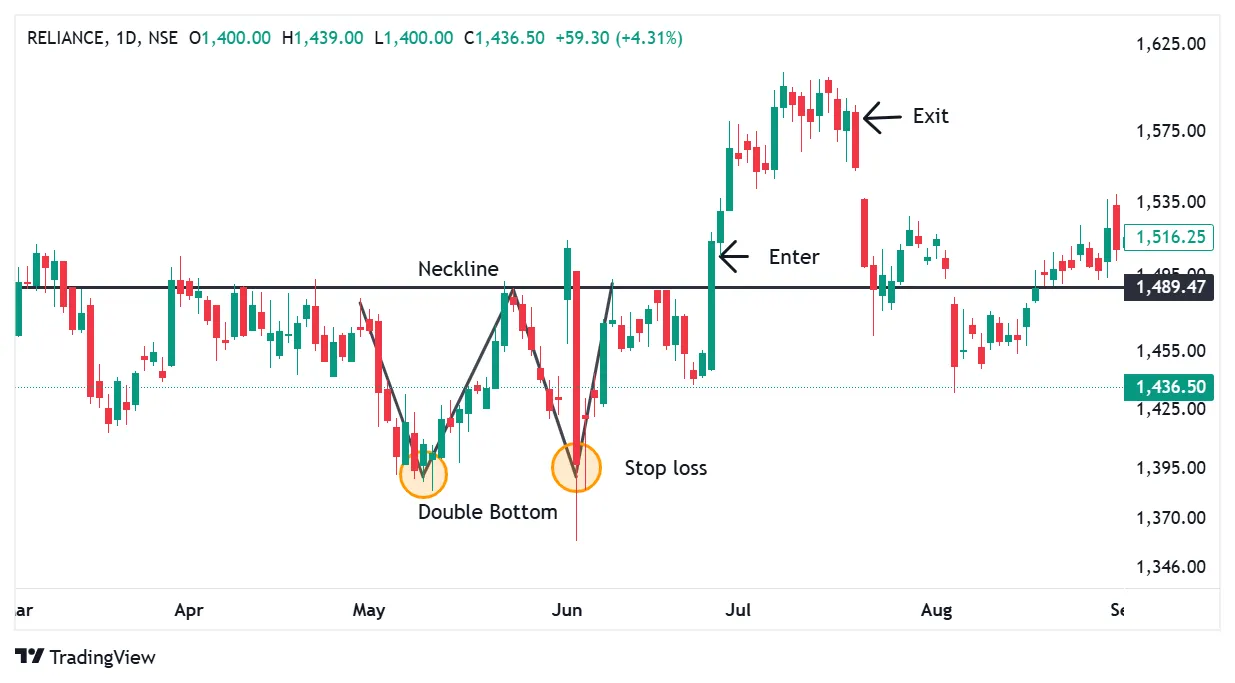
Entry (Buy Position)
Enter a buy position when the price breaks above the neckline following the formation of the second bottom.
Entry level: ₹1505
Target (Exit Point)
Exit around ₹1585, where the upward move showed signs of resistance and price consolidation.
Stop-loss
Place the stop-loss below the pattern’s low, beneath the second bottom.
Stop-loss level: ₹1390
Variations of the Double Top and Double Bottom
The shape of the peaks can vary. There are generally four types
Adam & Adam—both peaks/valleys are sharp and narrow.
Eve & Eve—both are rounded and wide.
Adam & Eve—first peak is sharp, second is rounded.
Eve & Adam—first peak is rounded, second is sharp.
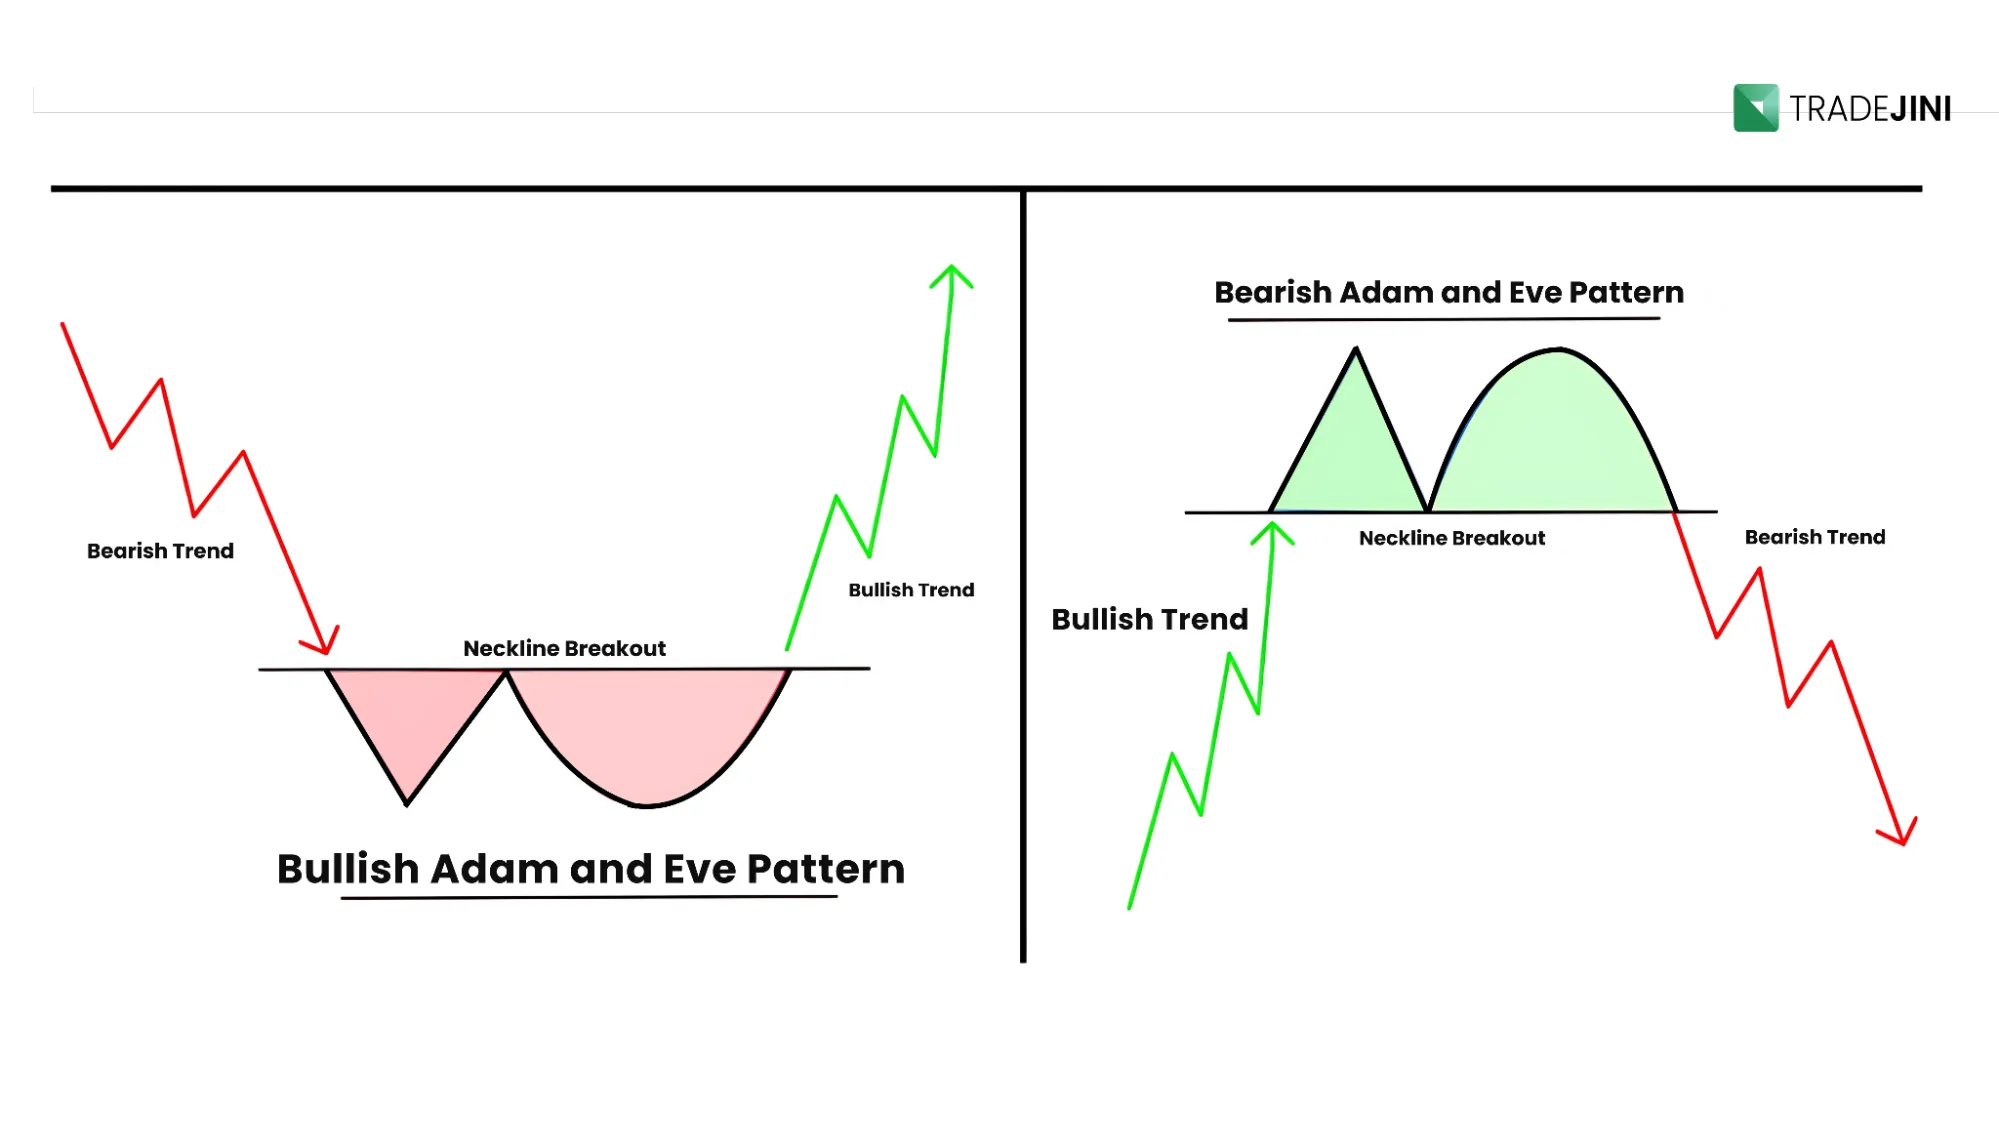
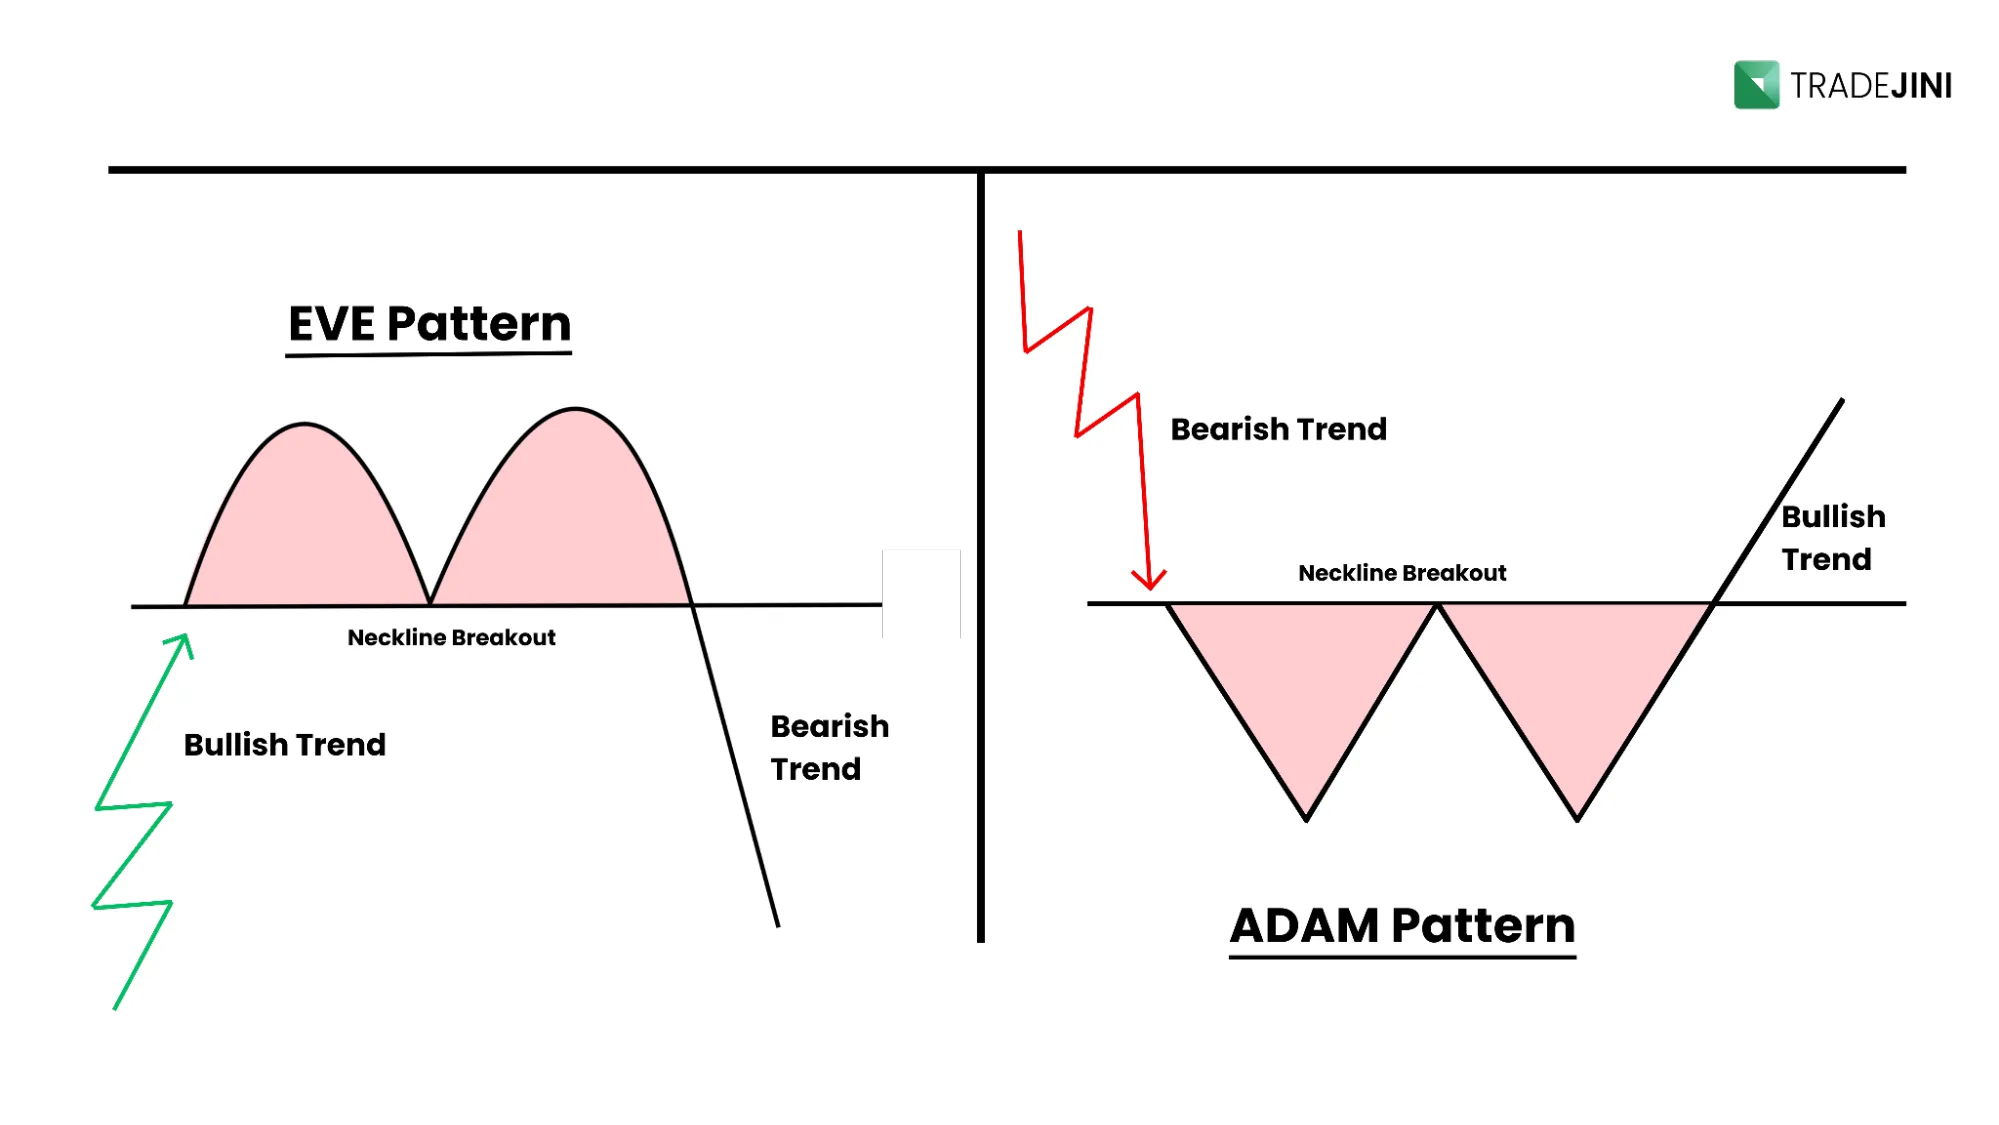
These variations can affect the pattern's performance. For example, Adam & Adam patterns may be more reliable in strong market conditions, while others can have higher failure rates.
Common Mistakes in Double Top and Double Bottom Patterns
There are a few common mistakes traders often make when using these patterns
Ignoring the trend that came before the pattern. A double top must follow an uptrend, and a double bottom must follow a downtrend. Without this, the pattern is not a reversal
Entering too early without confirmation. Waiting for a breakout below the valley or above the peak is essential
Expecting perfect symmetry. Patterns in real markets are not always exact. Focus on the structure and confirmation instead of perfection
Relying on short-term charts. These patterns work best on daily or weekly timeframes. Too much noise on shorter charts can lead to false signals
Not paying attention to volume. While not always necessary, volume gives useful hints about whether the pattern is gaining strength or weakening
What These Patterns Reveal About Market Sentiment
Double top and double bottom patterns are more than just shapes on a chart. They represent shifts in momentum and trader psychology. While they may look simple, identifying and trading them correctly requires discipline and patience.
Always wait for confirmation before acting. Use higher timeframes for clarity and remember that no pattern is perfect — context matters. When used wisely, these patterns can become a valuable part of your trading toolkit.
Disclaimer: The information provided in our blogs is for informational purposes only and should not be construed as financial, investment, or trading advice. Trading and investing in the securities market carries risk. Always conduct your own research and consult with a qualified financial advisor before making any investment decisions. Past performance is not indicative of future results. Copyrighted and original content for your trading and investing needs.
© 2025 — Tradejini. All Rights Reserved.