


The Gartley pattern is the foundation of harmonic patterns, first introduced by the early technical trader called H.M. Gartley in his 1935 classic Profits in the Stock Market on page 222 - earning it the nickname “Gartley 222.” This reversal pattern combines geometric structures, Fibonacci ratios, and price movements to identify high-probability potential reversal zones (PRZ) on stock charts, making it a favorite among practitioners of advanced technical analysis.
What sets the Gartley apart is its convergence of multiple chart patterns - primarily the ABCD pattern, specific Fibonacci retracements, and the entry zone near point D, where all these legs align with Fibonacci ratios. While Gartley visualized the structure, Scott Carney later defined precise ratios such as 0.618 at point B and 0.786 at point D, confirming the Gartley pattern example on stock charts.
The defining characteristic is the 0.786 retracement of the primary XA leg, creating a powerful yet balanced potential reversal zone. This distinguishes it from deeper bearish patterns like the Bat pattern or Crab pattern, making the bullish Gartley pattern ideal for spotting reversals in a prevailing trend within the stock market.
Component Breakdown of the Gartley Pattern
| Component | Ratio Requirement | Description |
|---|---|---|
| XA Leg | The primary XA leg represents the initial trend. |
The largest price movement in the pattern; forms a geometric structure on charts. |
| AB Retracement | Must be 0.618 of XA. |
Defines point B, a significant high or low, forming part of the ABCD pattern consisting of four consecutive price moves. |
| BC Projection | Retraces 0.382–0.886 of AB (typically 0.618). |
Sets up the AB resumes at BC move and aligns with Fibonacci ratios. |
| CD Leg | 0.382–0.886 retracement of AB (commonly 0.618). |
The signature element defining the potential reversal zone. |
| AB=CD Pattern | Equal or 1.27 extension. |
Provides internal harmonic confluence confirming the pattern completes correctly. |
| BC Projection to D | 1.27 or 1.618 extension. |
Adds additional Fibonacci ratio of XA alignment at point D (PRZ). |
Key Validation Rules for the Gartley Pattern
B point must be 0.618 of XA – this rule is non-negotiable.
D point completes at a 0.786 retracement of XA (the entry zone).
AB=CD pattern must converge with BC projection within the PRZ.
Price should not exceed point X; this maintains structural validity.
These rules combine scientific and statistical methods with geometry, ensuring the pattern remains precise and testable - a true pattern based on Fibonacci ratios.
Types of Gartley Patterns
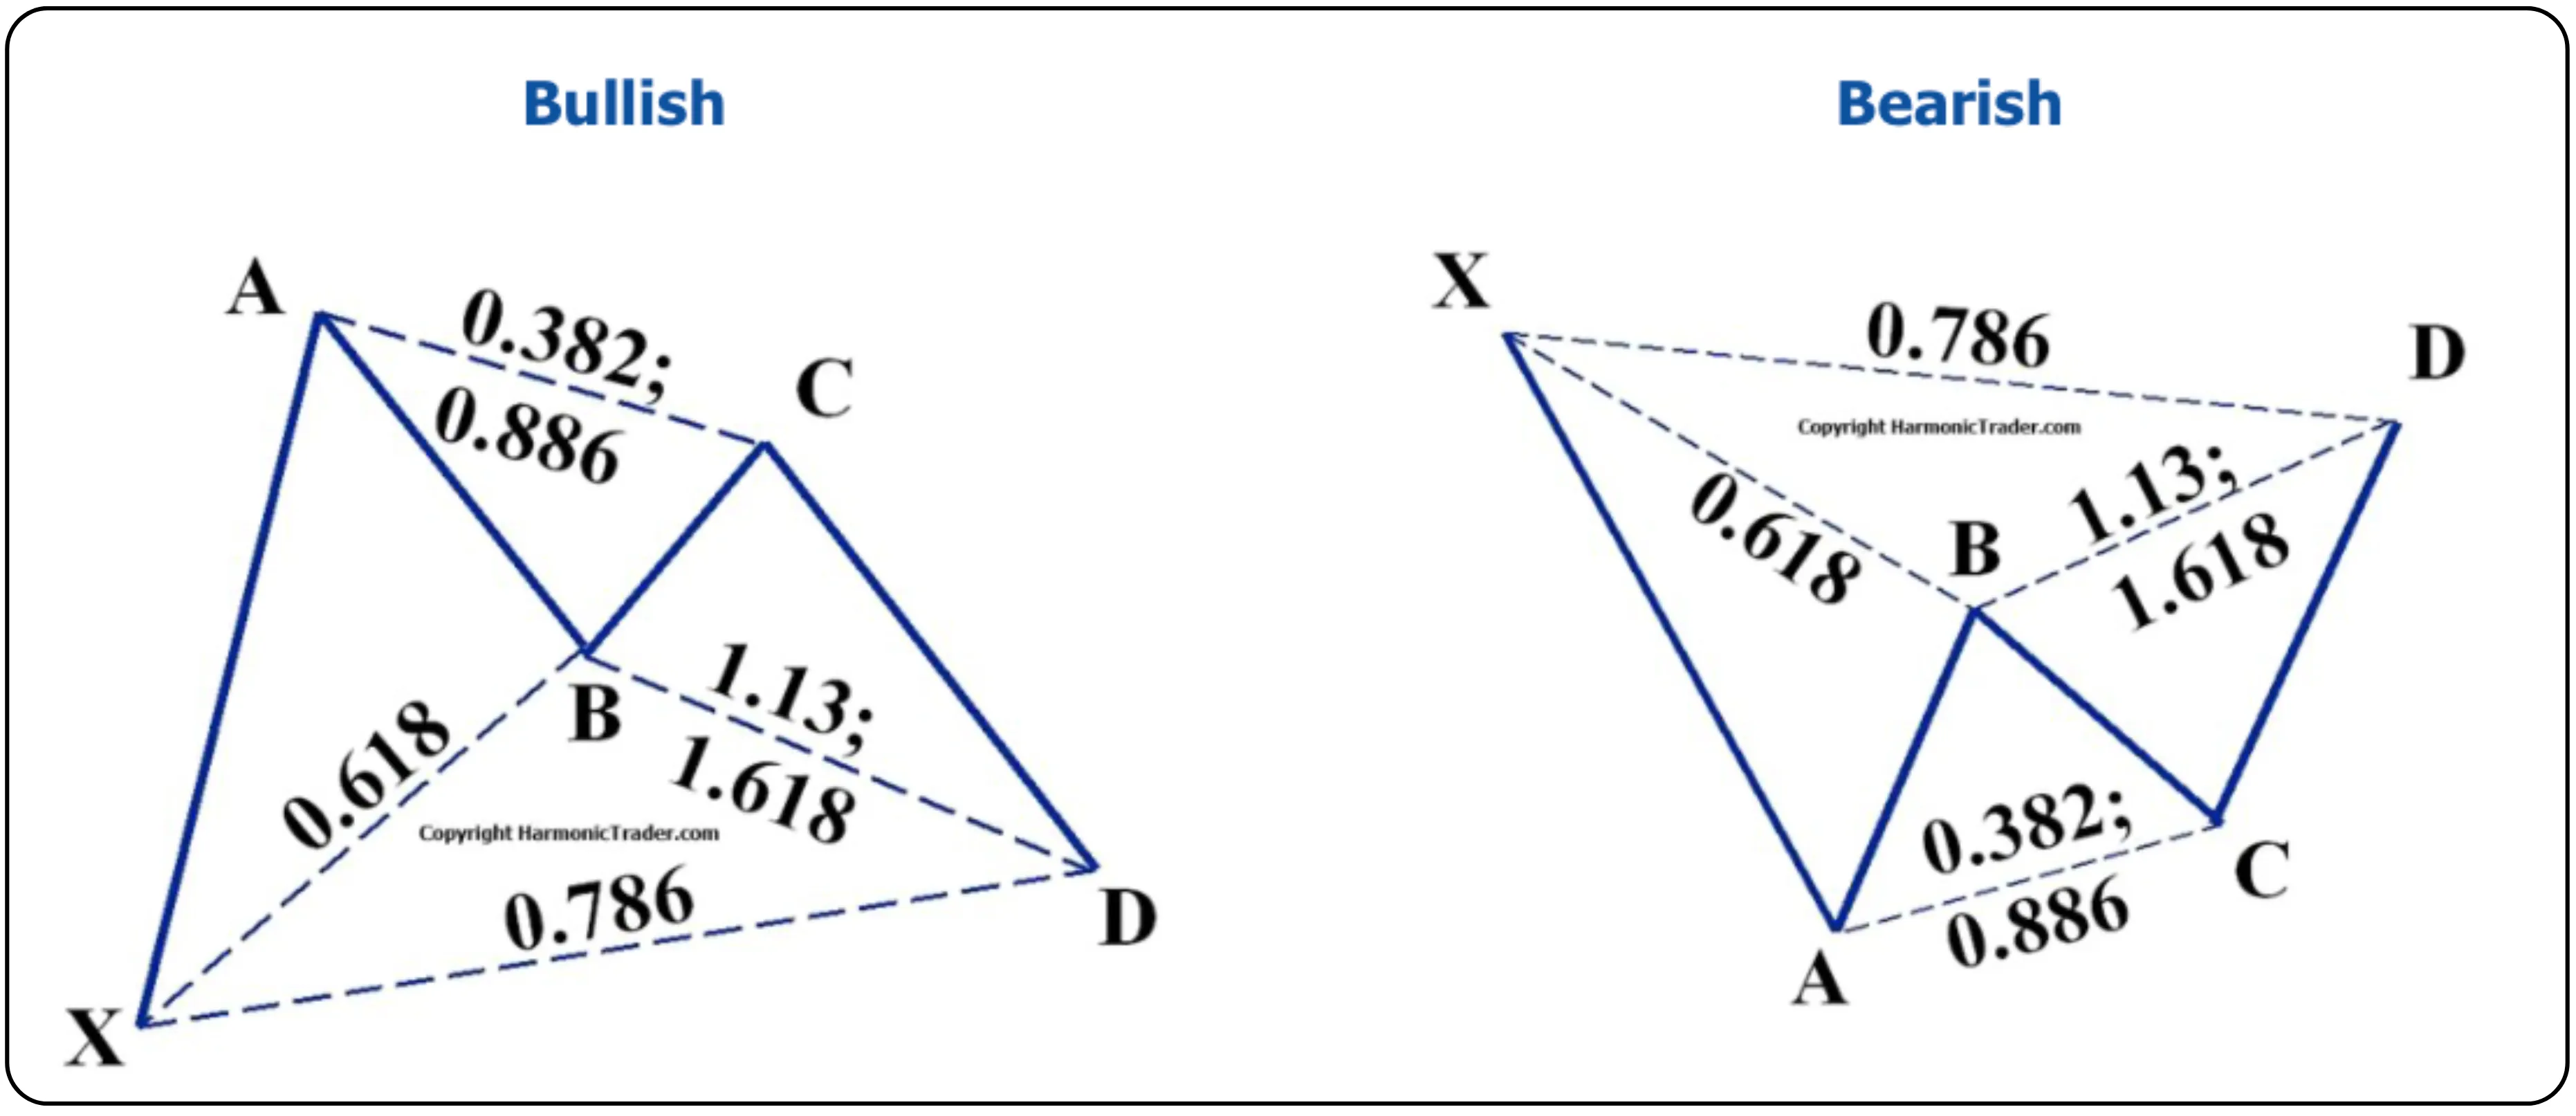
Bullish Gartley Pattern
This pattern is a bullish reversal pattern, forming at the end of a downtrend. Price reverses at point D, near the 0.786 retracement of XA, signaling exhaustion of selling momentum. Traders often look for reversal confirmation here before entering long positions aligned with the original trend.
Bearish Gartley Pattern
A bearish or bullish Gartley differs by trend direction. The bearish Gartley pattern forms after an uptrend and signals a downward reversal pattern at point D. Price retraces to the 0.786 level, marking the end of buying pressure.
How to Identify a Valid Gartley Pattern
| Characteristic | Requirement | Validation Check |
|---|---|---|
| XA impulse | Strong, clear directional move forming the primary XA leg. |
The largest leg in the pattern; must be obvious. |
| B point | 0.618 of XA (mandatory) |
The defining feature — not negotiable. |
| BC retracement | 0.382–0.886 of AB, where AB resumes at BC. |
Sets up the final move to D. |
| D point (PRZ) | 0.786 retracement of XA (point D) for the entry zone. |
Must not exceed point X. |
| AB=CD confluence | Equivalent (1.0) or extended (1.27) |
Adds reliability when it aligns at D. |
| BC projection | 1.27 or 1.618 extension to D. |
Creates multiple Fibonacci confluence. |
These ratios are based on Fibonacci retracements, making the pattern both visual and mathematical a key factor of harmonic patterns.
Smart Tips for Spotting the Gartley Pattern
- Identify the XA Impulse First: It’s the most obvious swing forming the pattern’s base
- Check the 0.618 B Point: It’s what defines the Gartley from other chart patterns
- Watch BC Retracement Carefully: It typically ranges between 0.382 and 0.886, forming the ideal setup
- Wait for Completion at 0.786: The pattern completes only at this level
- Confirm with Confluence: Align AB=CD, BC projection, and 0.786 XA together
- Never Exceed Point X: If price breaks above point X, the pattern is invalidated
The Psychology Behind the Gartley Pattern
The Gartley pattern captures the emotional and mechanical rhythm of the stock market. The XA leg represents the initial trend that retraces at AB, where early profit-taking begins. At point B, traders find equilibrium - a tug of war between bulls and bears.
The BC leg, which retraces between 0.382 and 0.886 of AB, lures in late entrants expecting trend continuation. The final CD leg leads to exhaustion, where price reverses at point D, from the potential reversal zone.
The 0.786 retracement acts as a psychological exhaustion zone - deep enough to shake out weak positions but shallow enough to maintain the original trend. When pattern completes, smart traders use entry rules like confirmation candles or RSI divergence for precision.
Gartley vs Bat Pattern vs Crab Pattern
| Feature | Gartley Pattern | Bat Pattern | Crab Pattern |
|---|---|---|---|
| B Point | 0.618 of XA | 0.382–0.50 of XA | 0.382–0.618 of XA |
| D Point (PRZ) | 0.786 of XA | 0.886 of XA | 1.618 extension of XA |
| BC Projection | 1.27–1.618 | 1.618–2.618 | 2.618+ |
| Depth | Moderate | Deep | Very Deep |
| Stop Loss | Beyond X | Near D | Wider due to extension |
| Nature | Reversal Pattern | Reversal | Extreme Reversal |
Quick identifier:
B point at 0.618 + D point at 0.786 = Gartley.
B point near 0.50 + D point at 0.886 = Bat.
Harmonic Patterns and ABCD Pattern Relationship
The ABCD pattern is the structural heart of all harmonic patterns. It consists of four consecutive price moves and provides the mathematical backbone of the Gartley pattern. The AB leg and CD leg should mirror each other in length and timing - this is known as both the timing and price symmetry.
The bullish or bearish ABCD pattern identifies insight of potential upcoming reversals within a prevailing trend. In the Gartley pattern, when the AB=CD pattern aligns with the 0.786 retracement of XA, traders get an early sign that a prevailing trend is about to reverse.
Bearish Gartley Pattern Example
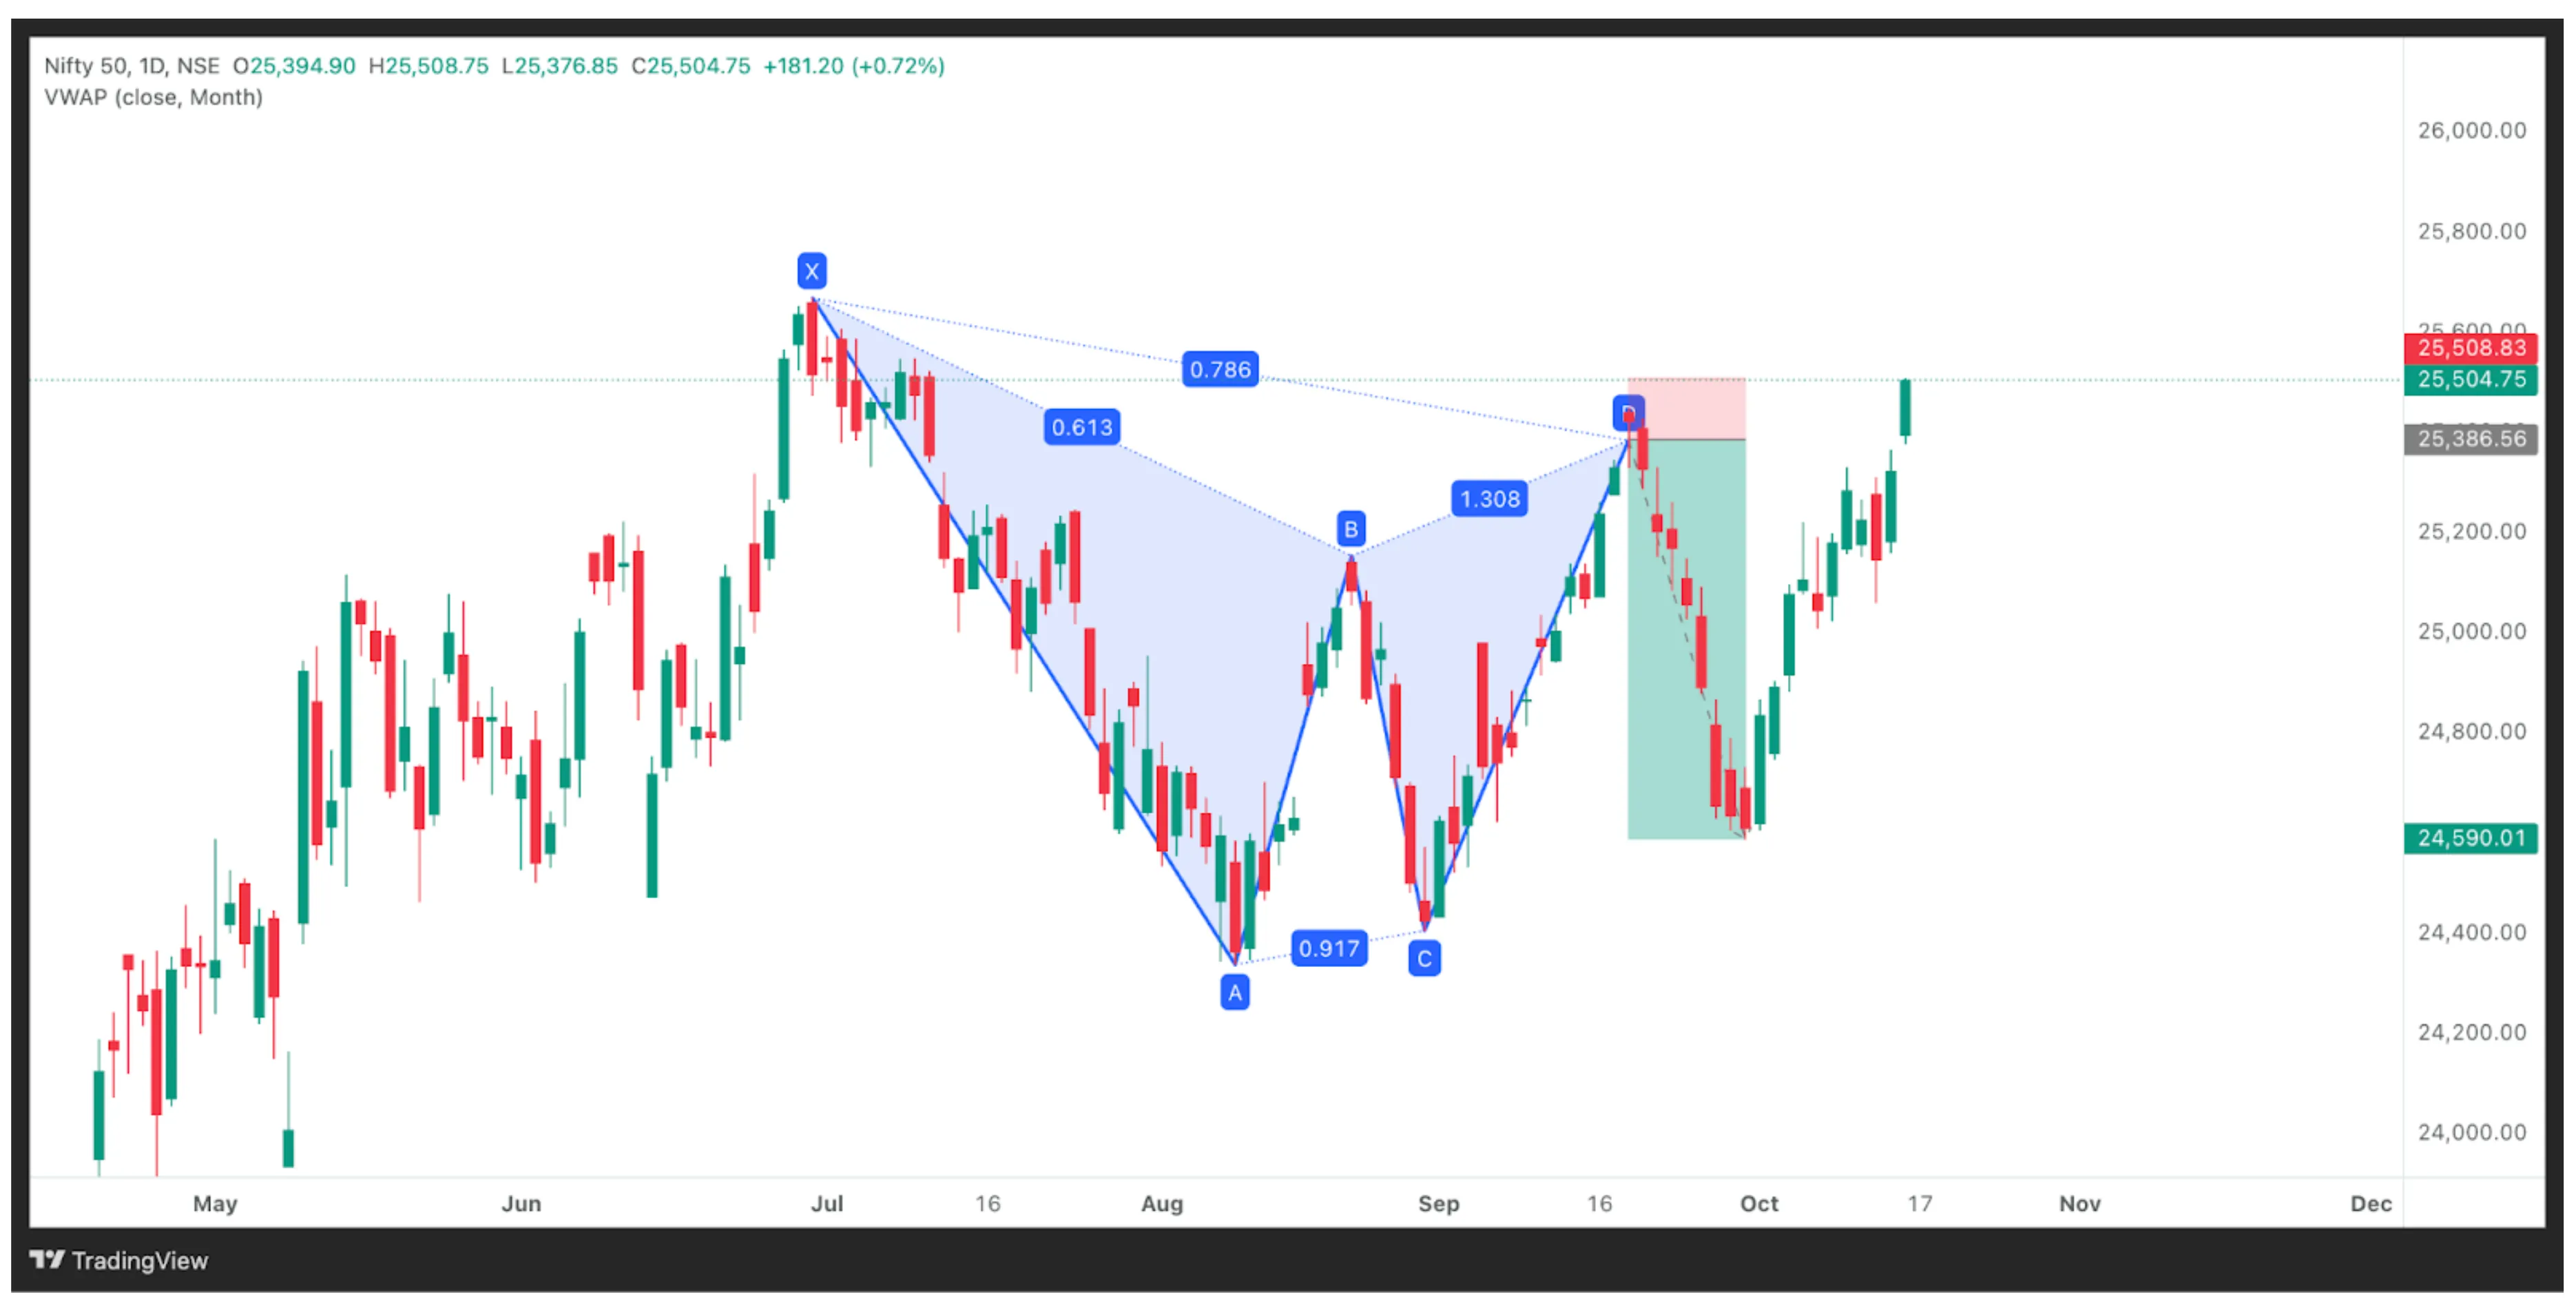
Pattern Explanation: A bearish Gartley has completed with XA representing a strong uptrend. Point B retraced to 0.618 of XA, followed by BC retracing approximately 0.618 of AB. The CD leg extended to the 0.786 retracement of XA, creating a PRZ near key resistance. The AB=CD pattern and 1.27 BC projection converged at the same level, signaling a high-probability reversal zone.
Entry Point: Short entry is valid near point D (~PRZ level) after bearish confirmation:
- Bearish reversal patterns (shooting star, bearish engulfing, evening star)
- RSI bearish divergence
- Rejection wicks at the PRZ level
- High volume on the reversal candle
Stop Loss: Place stops just above point X, which serves as the pattern's invalidation level. This provides a tight, defined-risk setup while allowing for minor overshoots of the 0.786 level.
Targets:
- Target 1: 0.382 retracement of AD-first profit-taking level
- Target 2: 0.618 retracement of AD-primary target zone
- Target 3: 0.786 retracement of AD-extended target
- Target 4: Point C level and beyond if strong momentum continues
Risk-Reward: Gartley's structure allows for 1:2 to 1:3 risk-reward ratios consistently, making it attractive for risk-conscious traders.
Confirmation: Look for multiple timeframe alignment. If the hourly Gartley completes within a daily resistance zone, the probability of reversal increases significantly.
Bullish Gartley Pattern Example
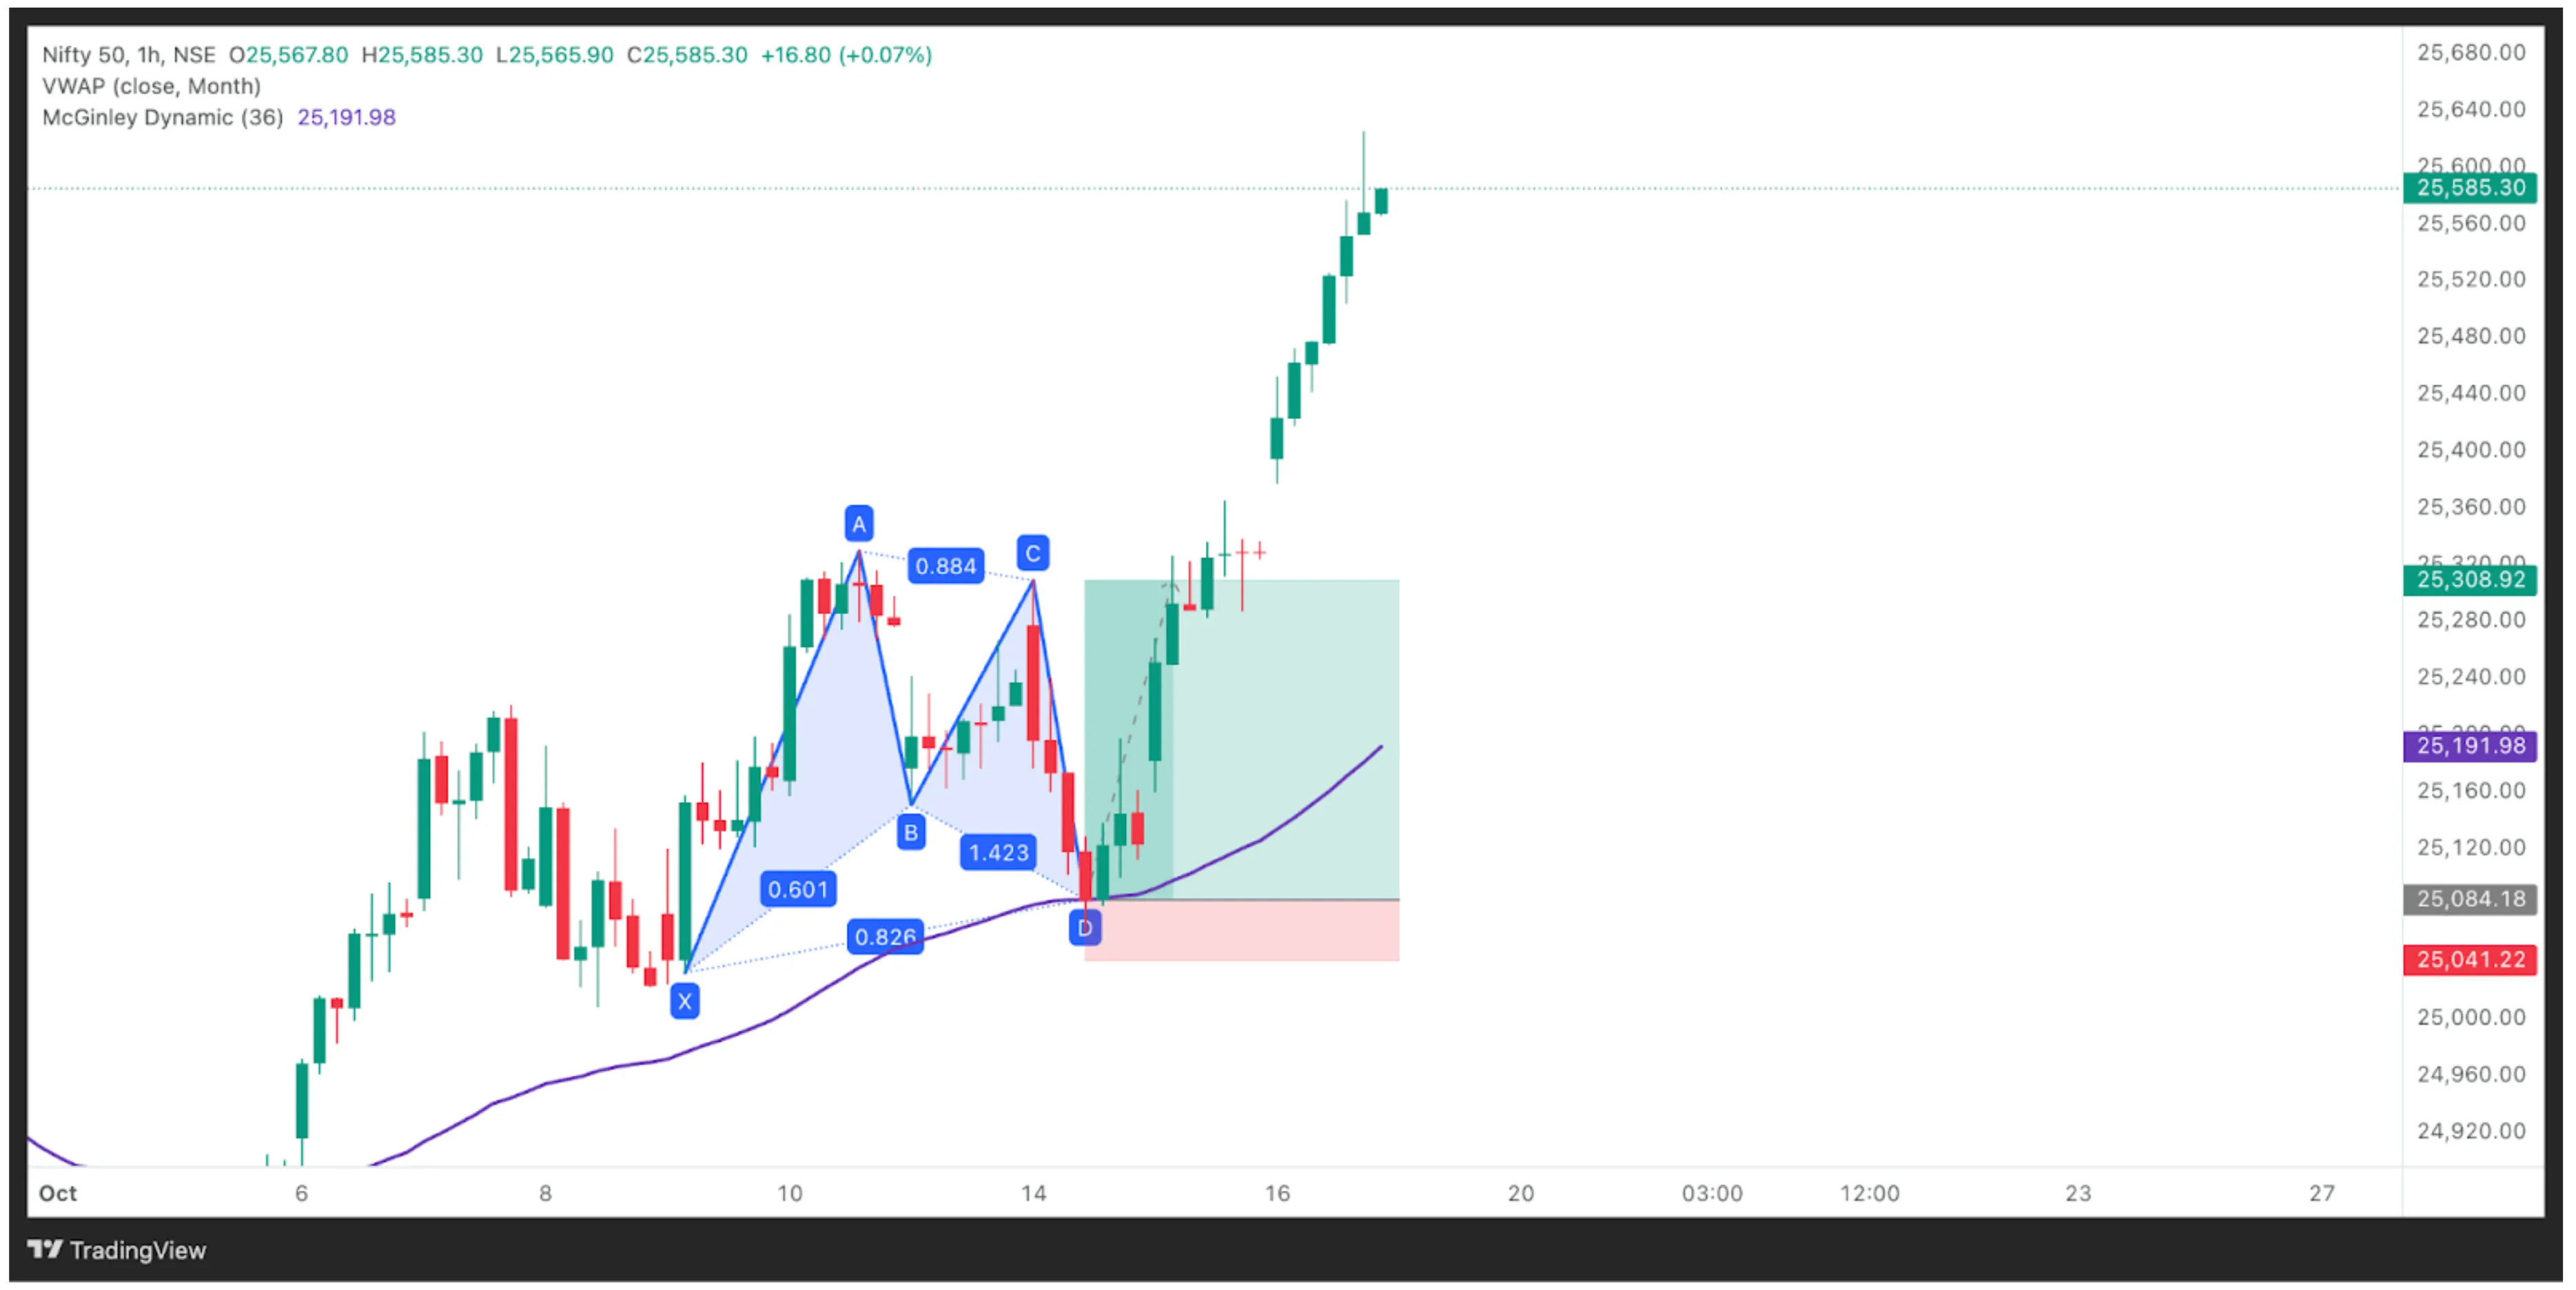
Pattern Explanation: A bullish Gartley pattern ahs formed on Nifty’s 1-hour timeframe. The initial XA leg represents a strong bullish move, followed by a B retracement near 0.60 of XA, fitting the Gartley structure. The BC leg extends around 1.423 of AB, and the final CD leg terminates close to 0.786-0.826 retracement of XA, forming the Potential Reversal Zone (PRZ) around 25,050 - 25,100. This created a high-probability reversal zone, which was confirmed by a sharp bullish reversal candle as price rebounded off D.
Entry Point: Long entry is triggered near point D (PRZ) after bullish confirmation. Look for:
- Bullish reversal candlesticks (hammer, bullish engulfing, morning star)
- RSI bullish divergence at point D
- Volume expansion on the reversal candle
- Price reclaiming short-term resistance
Stop Loss: Place a protective stop just below or at point X (the pattern's starting point) 24,950 level. This typically represents a 3-5% risk from entry, depending on the timeframe. The stop should account for volatility but remain beyond the structural invalidation point.
Targets:
- Target 1: 0.382 retracement of AD (~25,300) quick profit target, book partial position
- Target 2: 0.618 retracement of AD (~24,420) primary profit target
- Target 3: 0.786 to 1.0 retracement of AD (~25,500 - 25,580) full retracement of the move
- Target 4: Point C level or beyond (~25,600+) for remaining position if momentum is strong
Risk-Reward: Typically 1:2 or better, with the potential for 1:3 if targeting higher Fibonacci levels.
Confirmation: The stronger the confluence at the PRZ (0.786 XA + AB=CD + BC projection + horizontal support), the more reliable the reversal. Combine with momentum indicators for best results. Here the PRZ overlap with the Moving Average support gave the conviction to enter this trade before the formation of a bullish candle.
The Strategic Edge of the Gartley Pattern
Among all harmonic patterns, the Gartley stands out for its scientific and statistical methods applied to Fibonacci ratios. It merges the ABCD pattern, geometric structures, and price movements into a precise, repeatable setup that can appear on all stock charts and across timeframes.
The pattern completes the market psychology of exhaustion and reversal: weak hands exit at point D, while professionals enter in the entry zone anticipating reversal. This makes it one of the most powerful chart patterns for timing reversal or continuation pattern setups.
When confirmed by technical confluence - RSI, volume spikes, or candlestick patterns - Gartley patterns and Fibonacci ratios together form a structured trading approach that eliminates emotion and guesswork from trading decisions.
Disclaimer: The information provided in our blogs is for informational purposes only and should not be construed as financial, investment, or trading advice. Trading and investing in the securities market carries risk. Always conduct your own research and consult with a qualified financial advisor before making any investment decisions. Past performance is not indicative of future results. Copyrighted and original content for your trading and investing needs.
© 2025 — Tradejini. All Rights Reserved.