


Volume does more than show how actively a market is trading. It helps reveal who is influencing the move. The Positive Volume Index and Negative Volume Index, when used together, offer a clear framework for separating broad, crowd-driven swings from shifts that tend to reflect more informed participation.
Positive Volume Index (PVI)
The PVI moves only on days when trading volume rises compared to the previous session. It highlights periods of heightened participation and is often viewed as a reflection of retail or crowd-driven behaviour. A rising PVI signals that high-volume days are accompanied by price gains, suggesting broad-based buying. A falling PVI points to selling pressure during active sessions, typically associated with crowd pessimism or capitulation. In essence, the PVI acts as a barometer of market sentiment when activity intensifies, a key insight in technical analysis using positive volume signals.
Negative Volume Index (NVI)
The NVI updates only on days when trading volume falls relative to the previous session. Low-volume environments are typically shaped by more deliberate, informed participants who prefer to transact without drawing attention. A rising NVI signals accumulation on quieter days, suggesting a constructive outlook among these investors. A declining NVI points to distribution, indicating a more cautious or bearish stance. Because it reflects the behaviour of participants who tend to act ahead of major shifts, the NVI is often viewed as a more dependable early volume index indicator of emerging trends.
Using PVI and NVI Together
Used together, PVI and NVI offer a more complete view of how a trend is developing.
1. Trend confirmation A rising NVI above its moving average points to institutional support behind the prevailing direction. When PVI also advances, it shows the broader market is participating, which tends to strengthen the durability of the trend.
2. Early reversal signals If NVI turns higher while PVI remains muted, it often suggests informed investors are accumulating ahead of a potential bottom. When NVI weakens before PVI, it typically foreshadows broader market softness.
3. Assessing breakout quality Breakouts backed by both PVI and NVI are generally more dependable. Moves supported only by PVI tend to be driven by crowd behaviour and may struggle to hold. Breakouts led primarily by NVI are less obvious but usually carry greater reliability.
Interpretation for Dr. Reddy’s
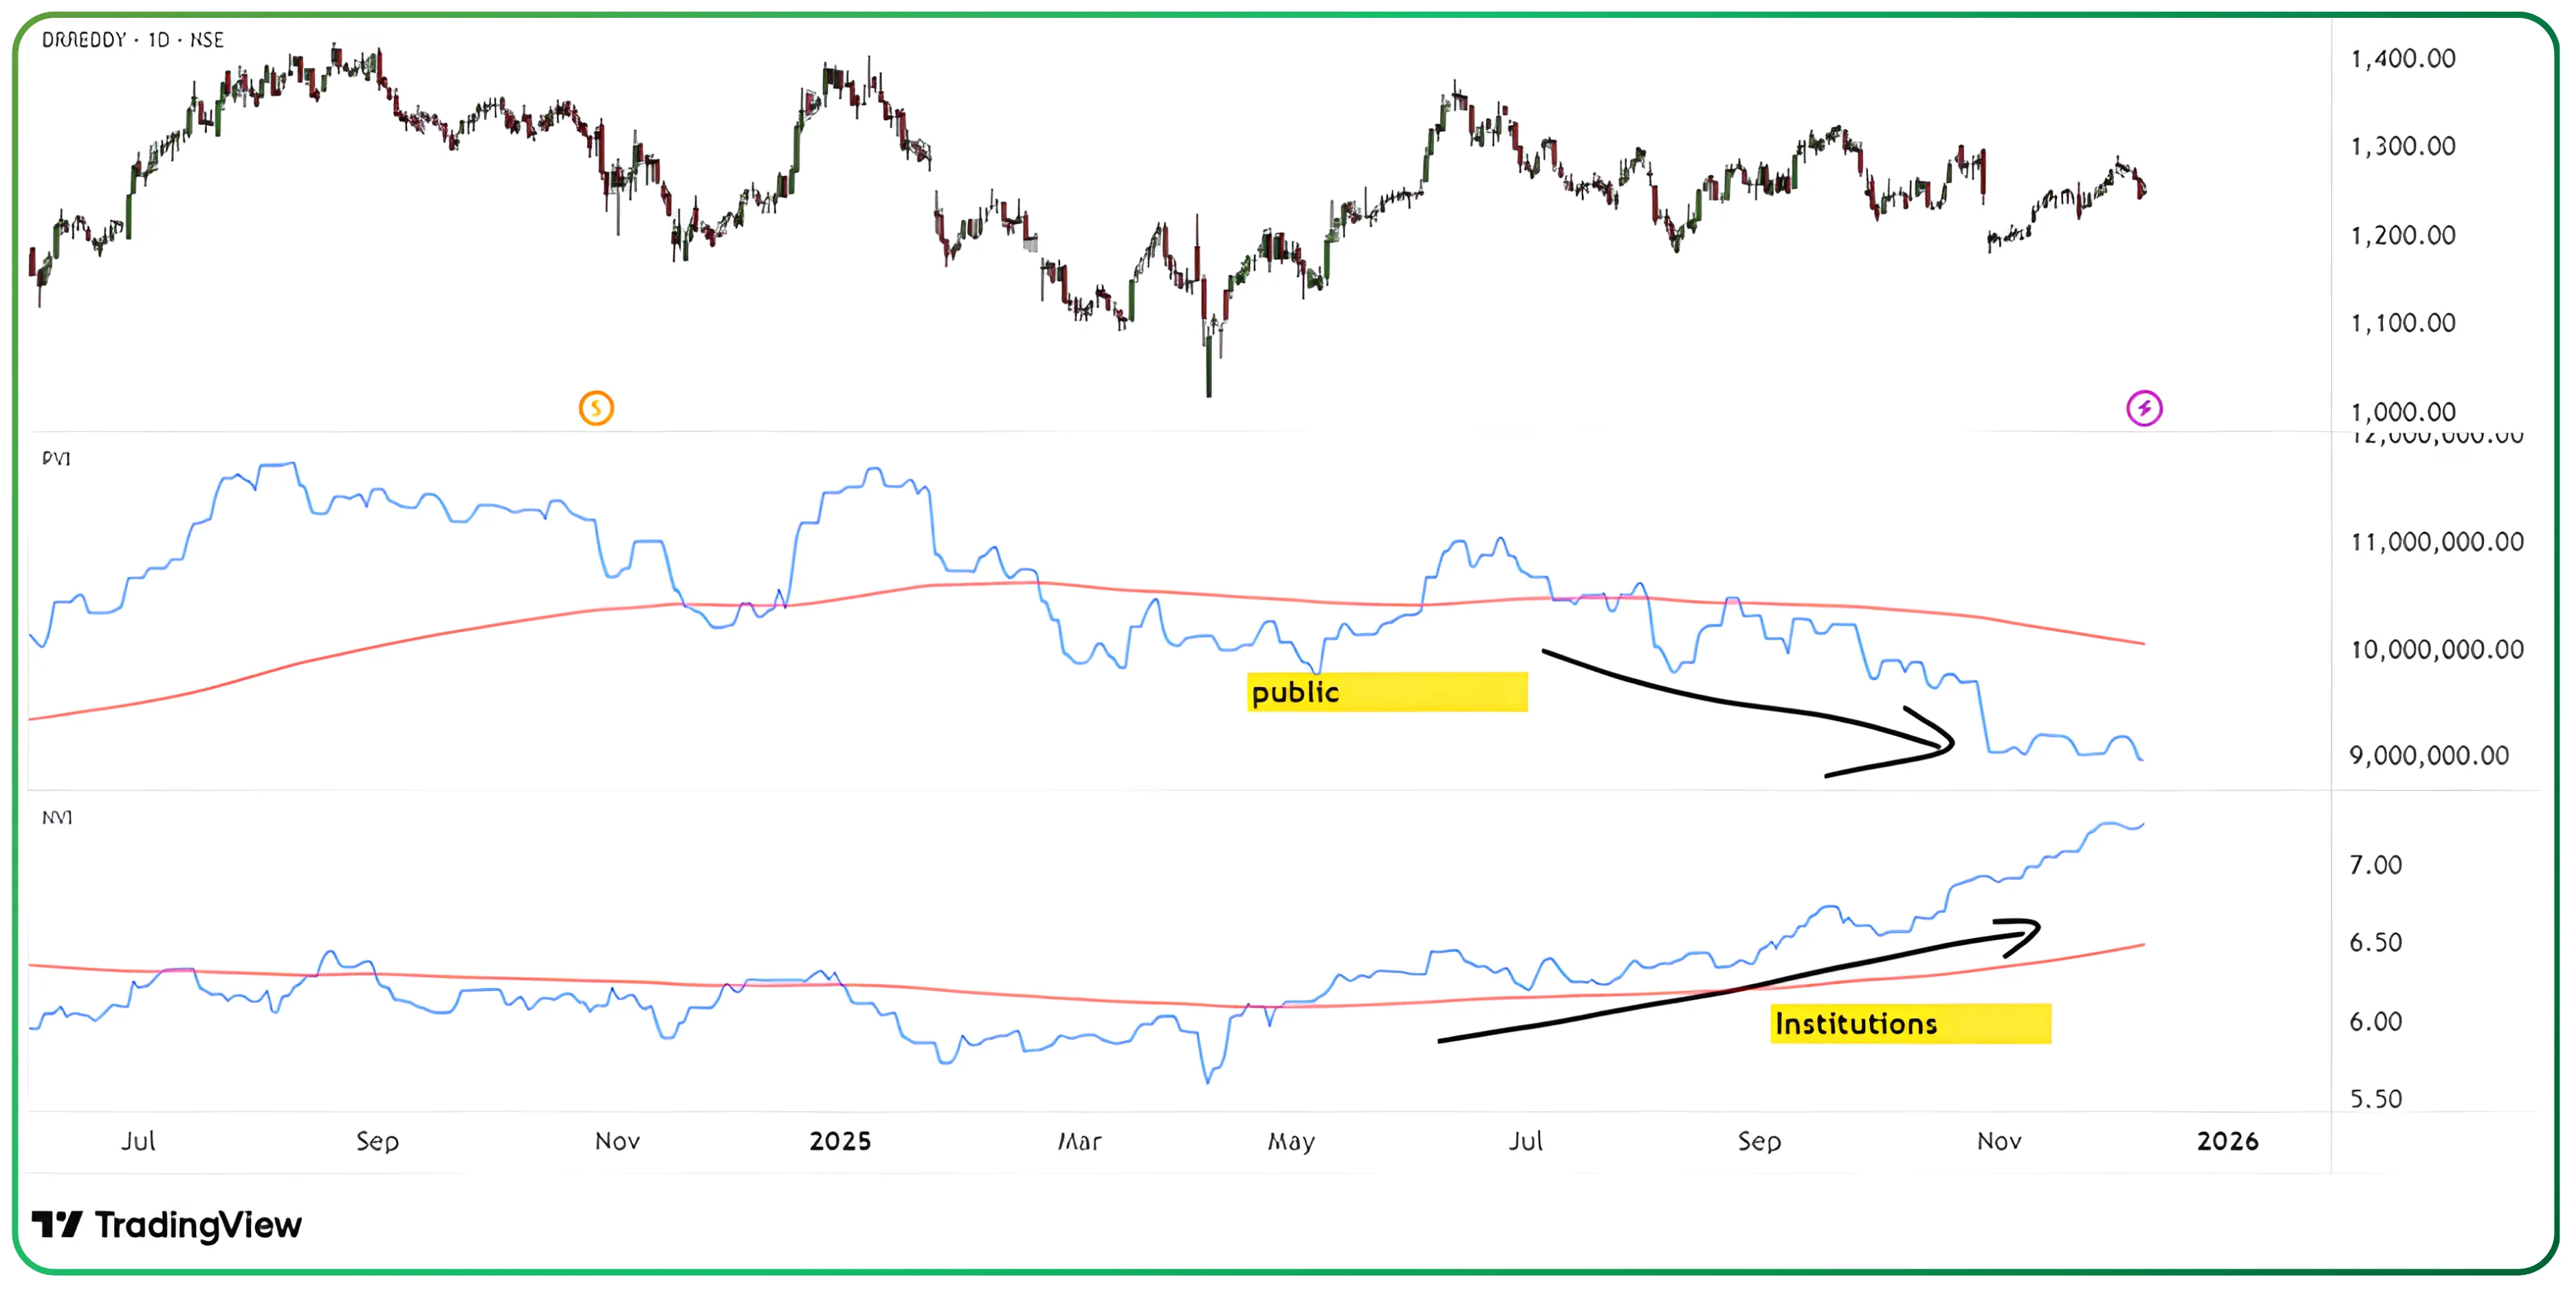
PVI is trending lower, indicating that high-volume sessions are still dominated by selling, which aligns with persistent crowd pessimism in a falling market. NVI, however, is moving higher, pointing to gradual accumulation by informed participants on quieter, low-volume days. This type of divergence often emerges in the later stages of a downtrend, when institutional investors start building positions. Even so, clearer confirmation would require signs of price stabilisation and a corresponding improvement in PVI.
Also, explore our guide: What Should You Really Expect from Technical Analysis? A practical look at how charts help, where they fail, and how traders should actually use them.
PVI and NVI Summarised
PVI and NVI, when examined together, provide a well-rounded perspective on market behaviour. PVI highlights crowd-driven sentiment during high-volume, high-volatility sessions, while NVI reflects the more deliberate actions of informed investors operating during quieter periods. When both indicators move in the same direction, the underlying trend gains credibility. When they diverge, it often points to an upcoming shift that merits closer attention.
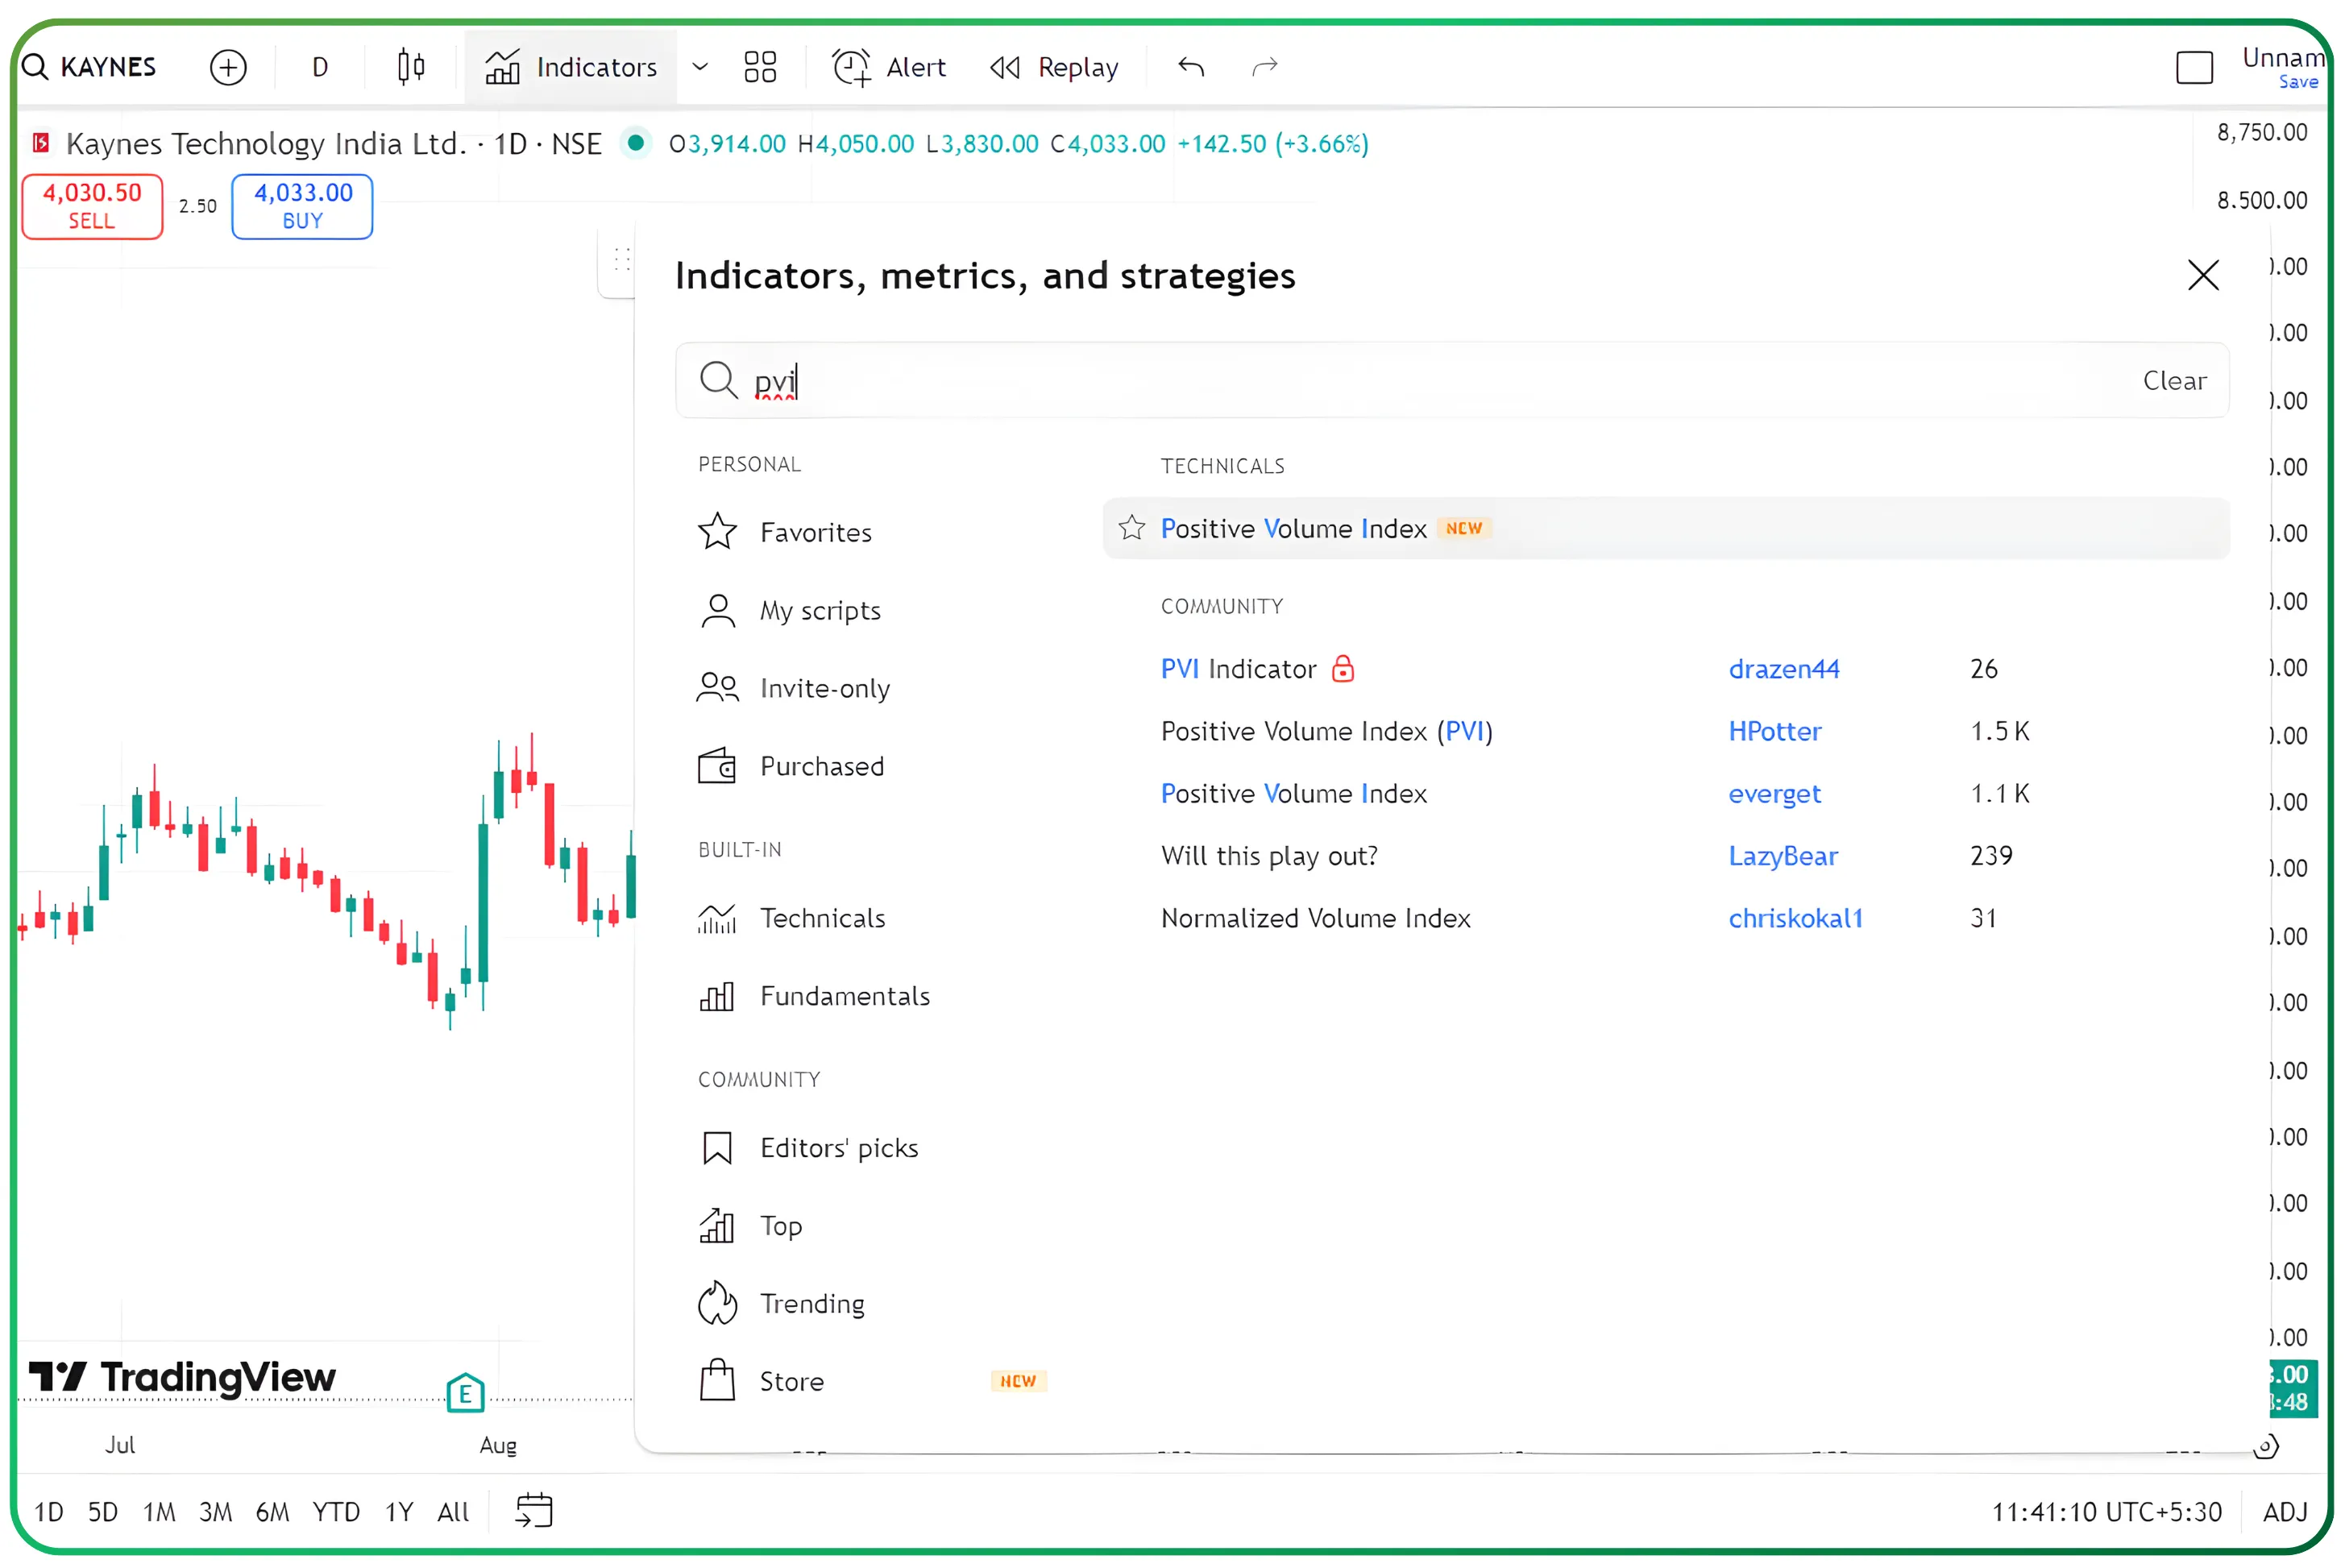
How to Add and View PVI and NVI on TradingView
Adding PVI and NVI to your TradingView chart is straightforward. Open the Indicators panel and use the search bar to locate each indicator. Typing PVI brings up the built-in Positive Volume Index, which you can add with a single click.
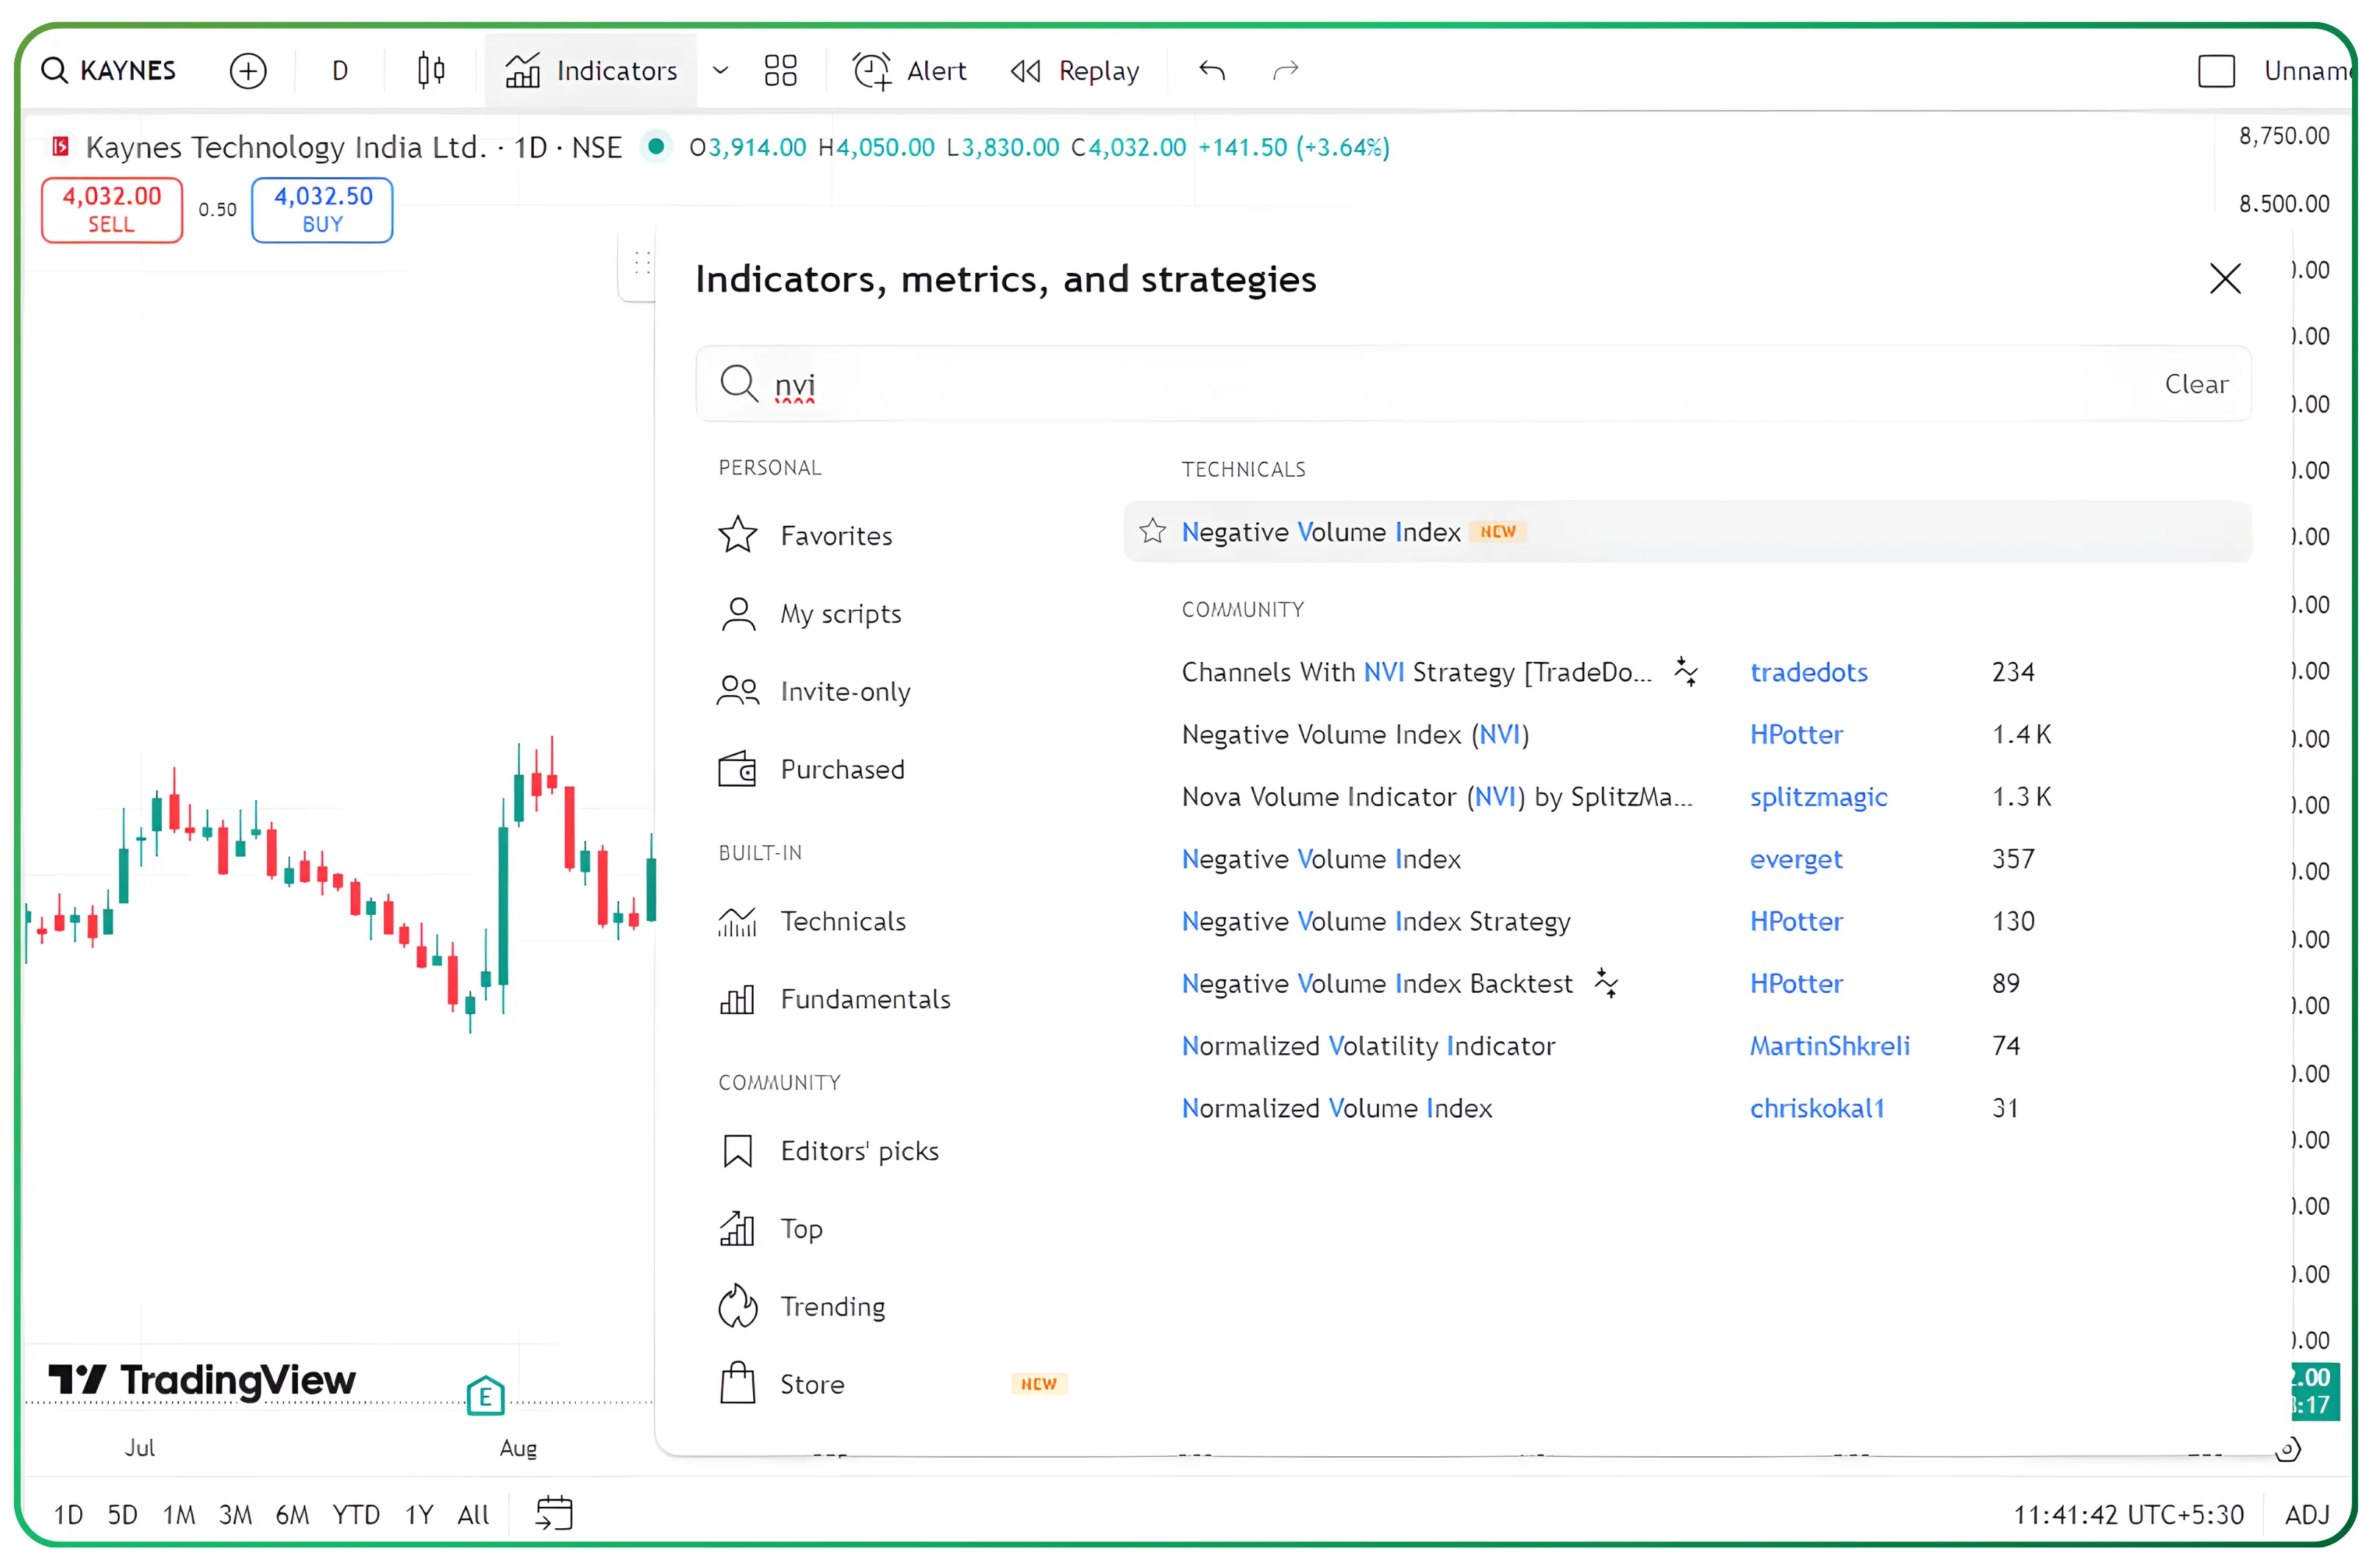
Repeat the process with NVI to load the built-in Negative Volume Index. Both indicators immediately appear as separate panels below the price chart.
With PVI and NVI displayed, you can track their behaviour alongside price action.
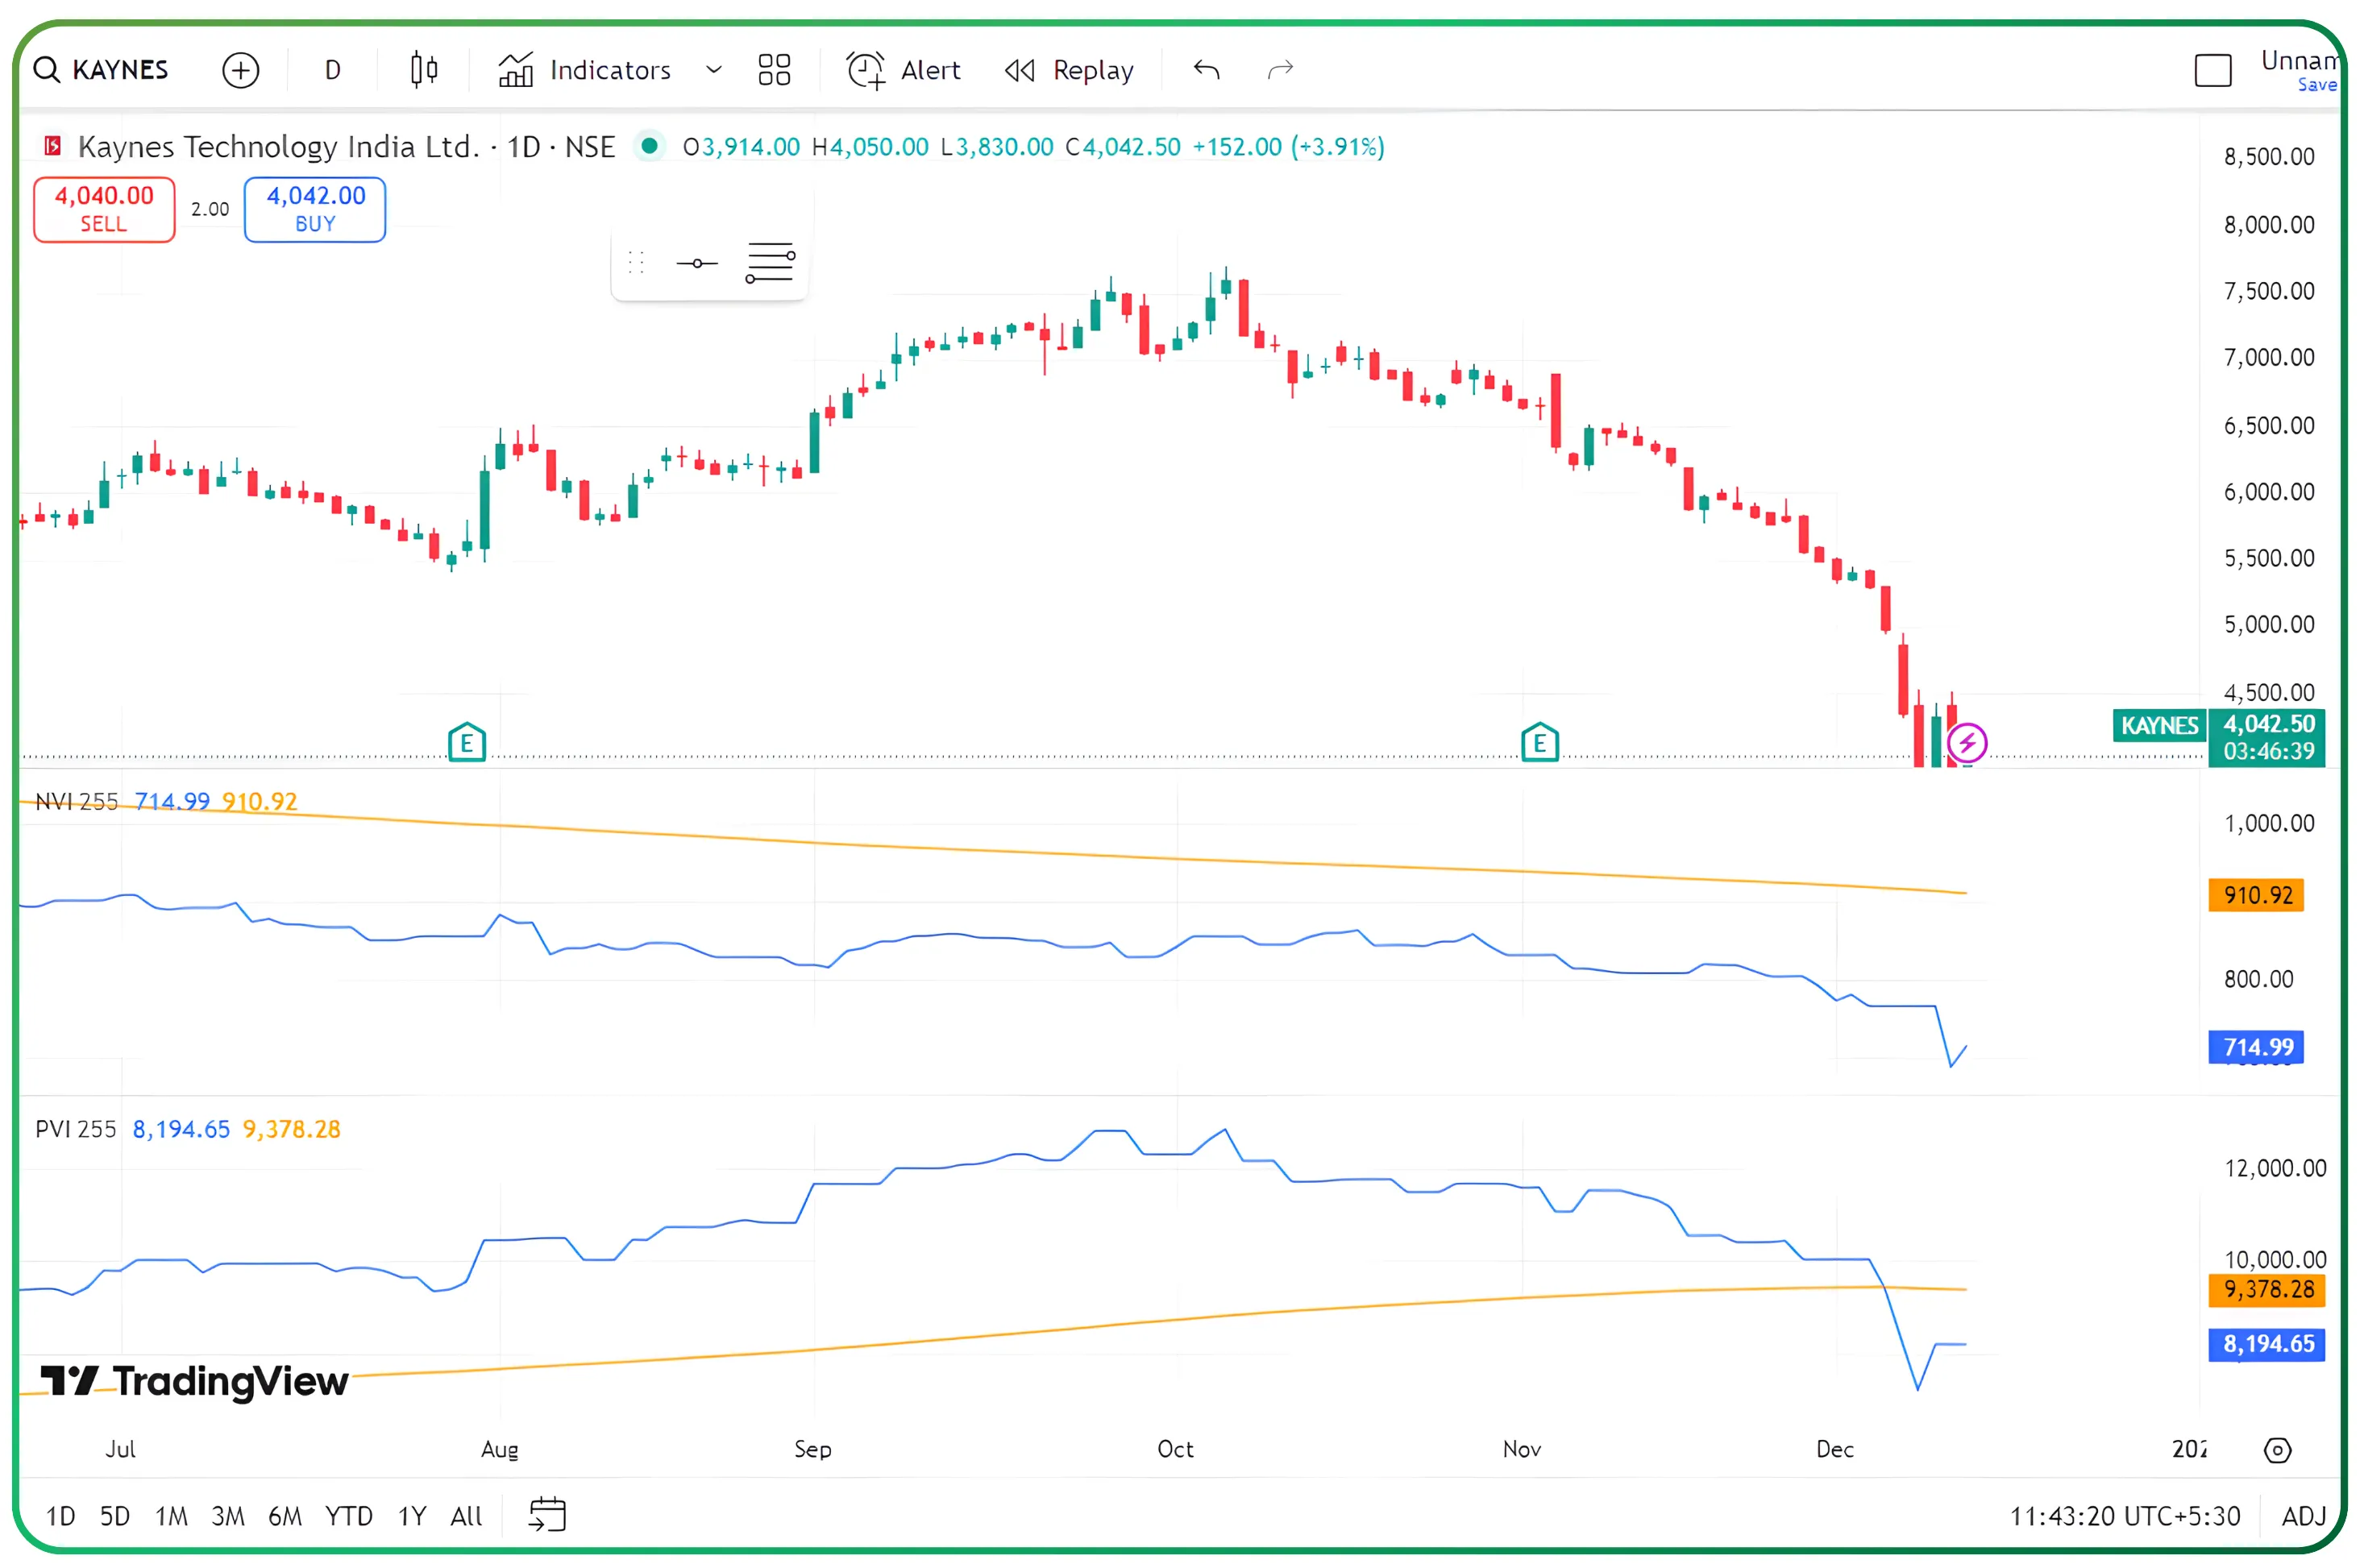
The split-panel view makes it easy to study how PVI reacts on high-volume days and how NVI evolves during quieter, low-volume periods. This setup allows you to evaluate trend confirmation, identify early divergences, and judge the quality of breakouts as they develop.
Disclaimer: The information provided in our blogs is for informational purposes only and should not be construed as financial, investment, or trading advice. Trading and investing in the securities market carries risk. Always conduct your own research and consult with a qualified financial advisor before making any investment decisions. Past performance is not indicative of future results. Copyrighted and original content for your trading and investing needs.
© 2025 — Tradejini. All Rights Reserved.