Most retail traders look at an option chain the way they look at a scoreboard: spot price, a column of OI, a column of LTP, done. But a table like NxtOption's OI Snapshot view (strike-wise OI, OI change, LTP, LTP change, IV, and PCR, each with an inline intraday chart) is really a live feed of who is positioning where, and how hard.
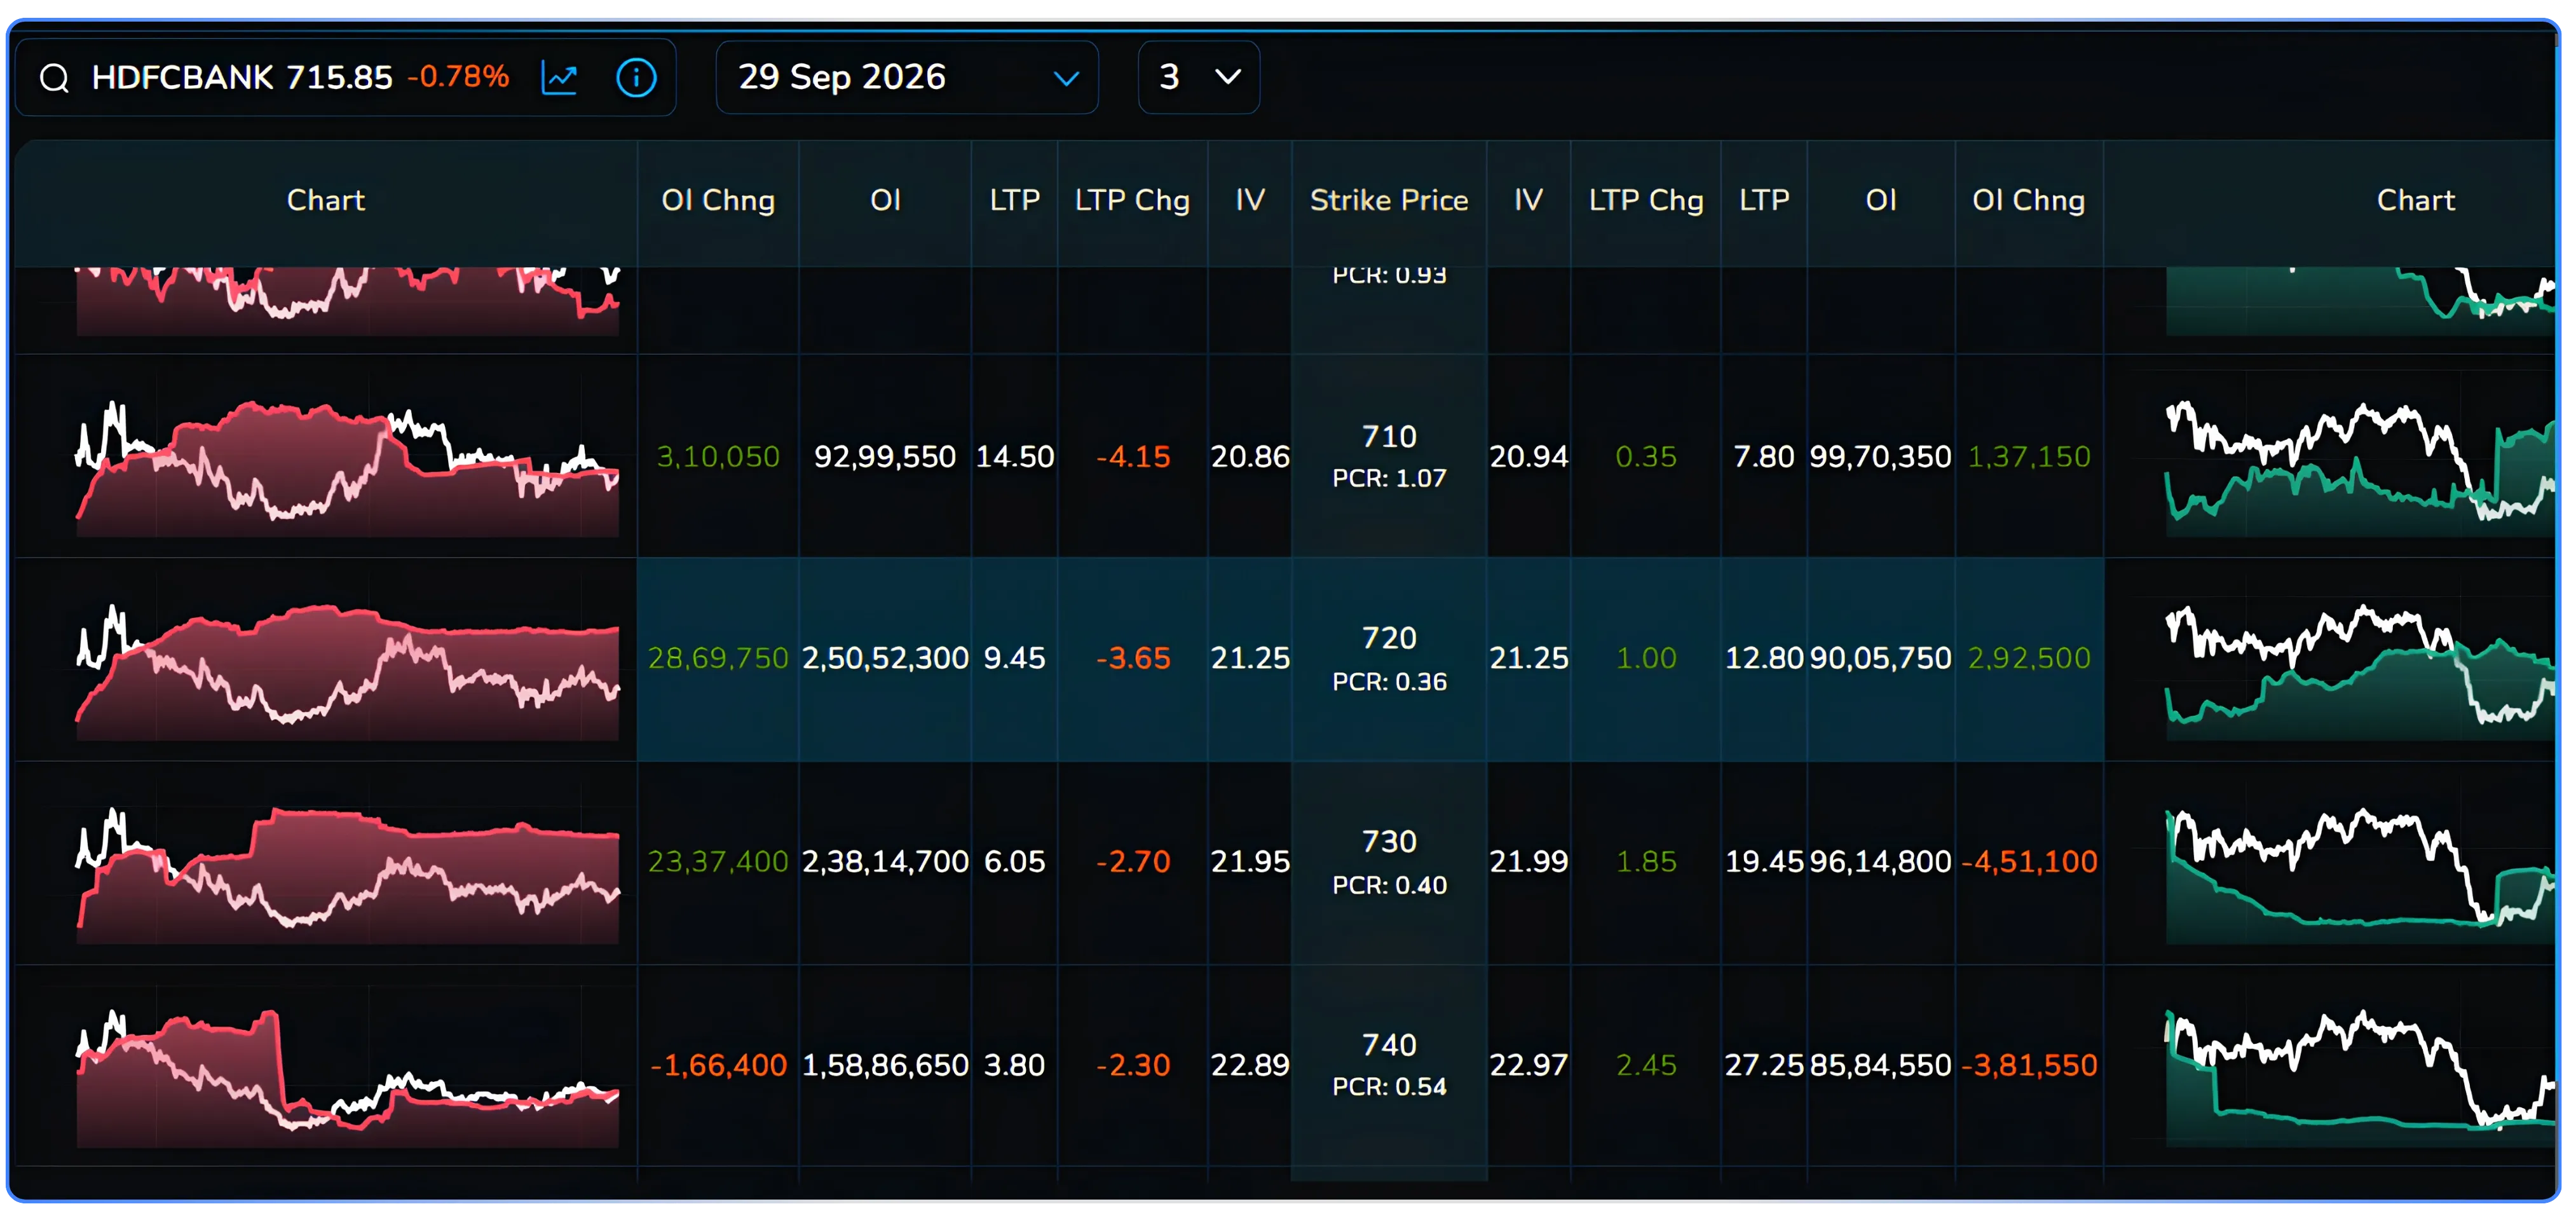
Read correctly, it tells you less about “what happened” and more about “what the option writers now believe”; which is exactly the information you want fifteen minutes before the close, when you're deciding whether to carry a BTST (Buy Today, Sell Tomorrow) or STBT (Sell Today, Buy Tomorrow) position overnight.
This article walks through the use case: how to read strike-wise OI/premium, strike-wise PCR, strike-wise IV together, and how a specific end-of-day pattern (unwinding on one side of the chain paired with build-up on the other) becomes an actionable overnight signal.
1. Strike-wise OI and premium charts: reading conviction, not just direction
Each row in the snapshot carries a mini OI chart and a mini premium (LTP) chart for that strike. The point of having both side by side, rather than just the day's net change, is that OI and premium can move together or diverge, and the divergence is the signal.
• OI up + premium up → fresh money is writing/buying and pushing price at the same time. This is a buildup; long buildup if it's happening on the buy side, short buildup if sellers are aggressively writing more contracts at rising premiums (unusual, but happens on breakout days).
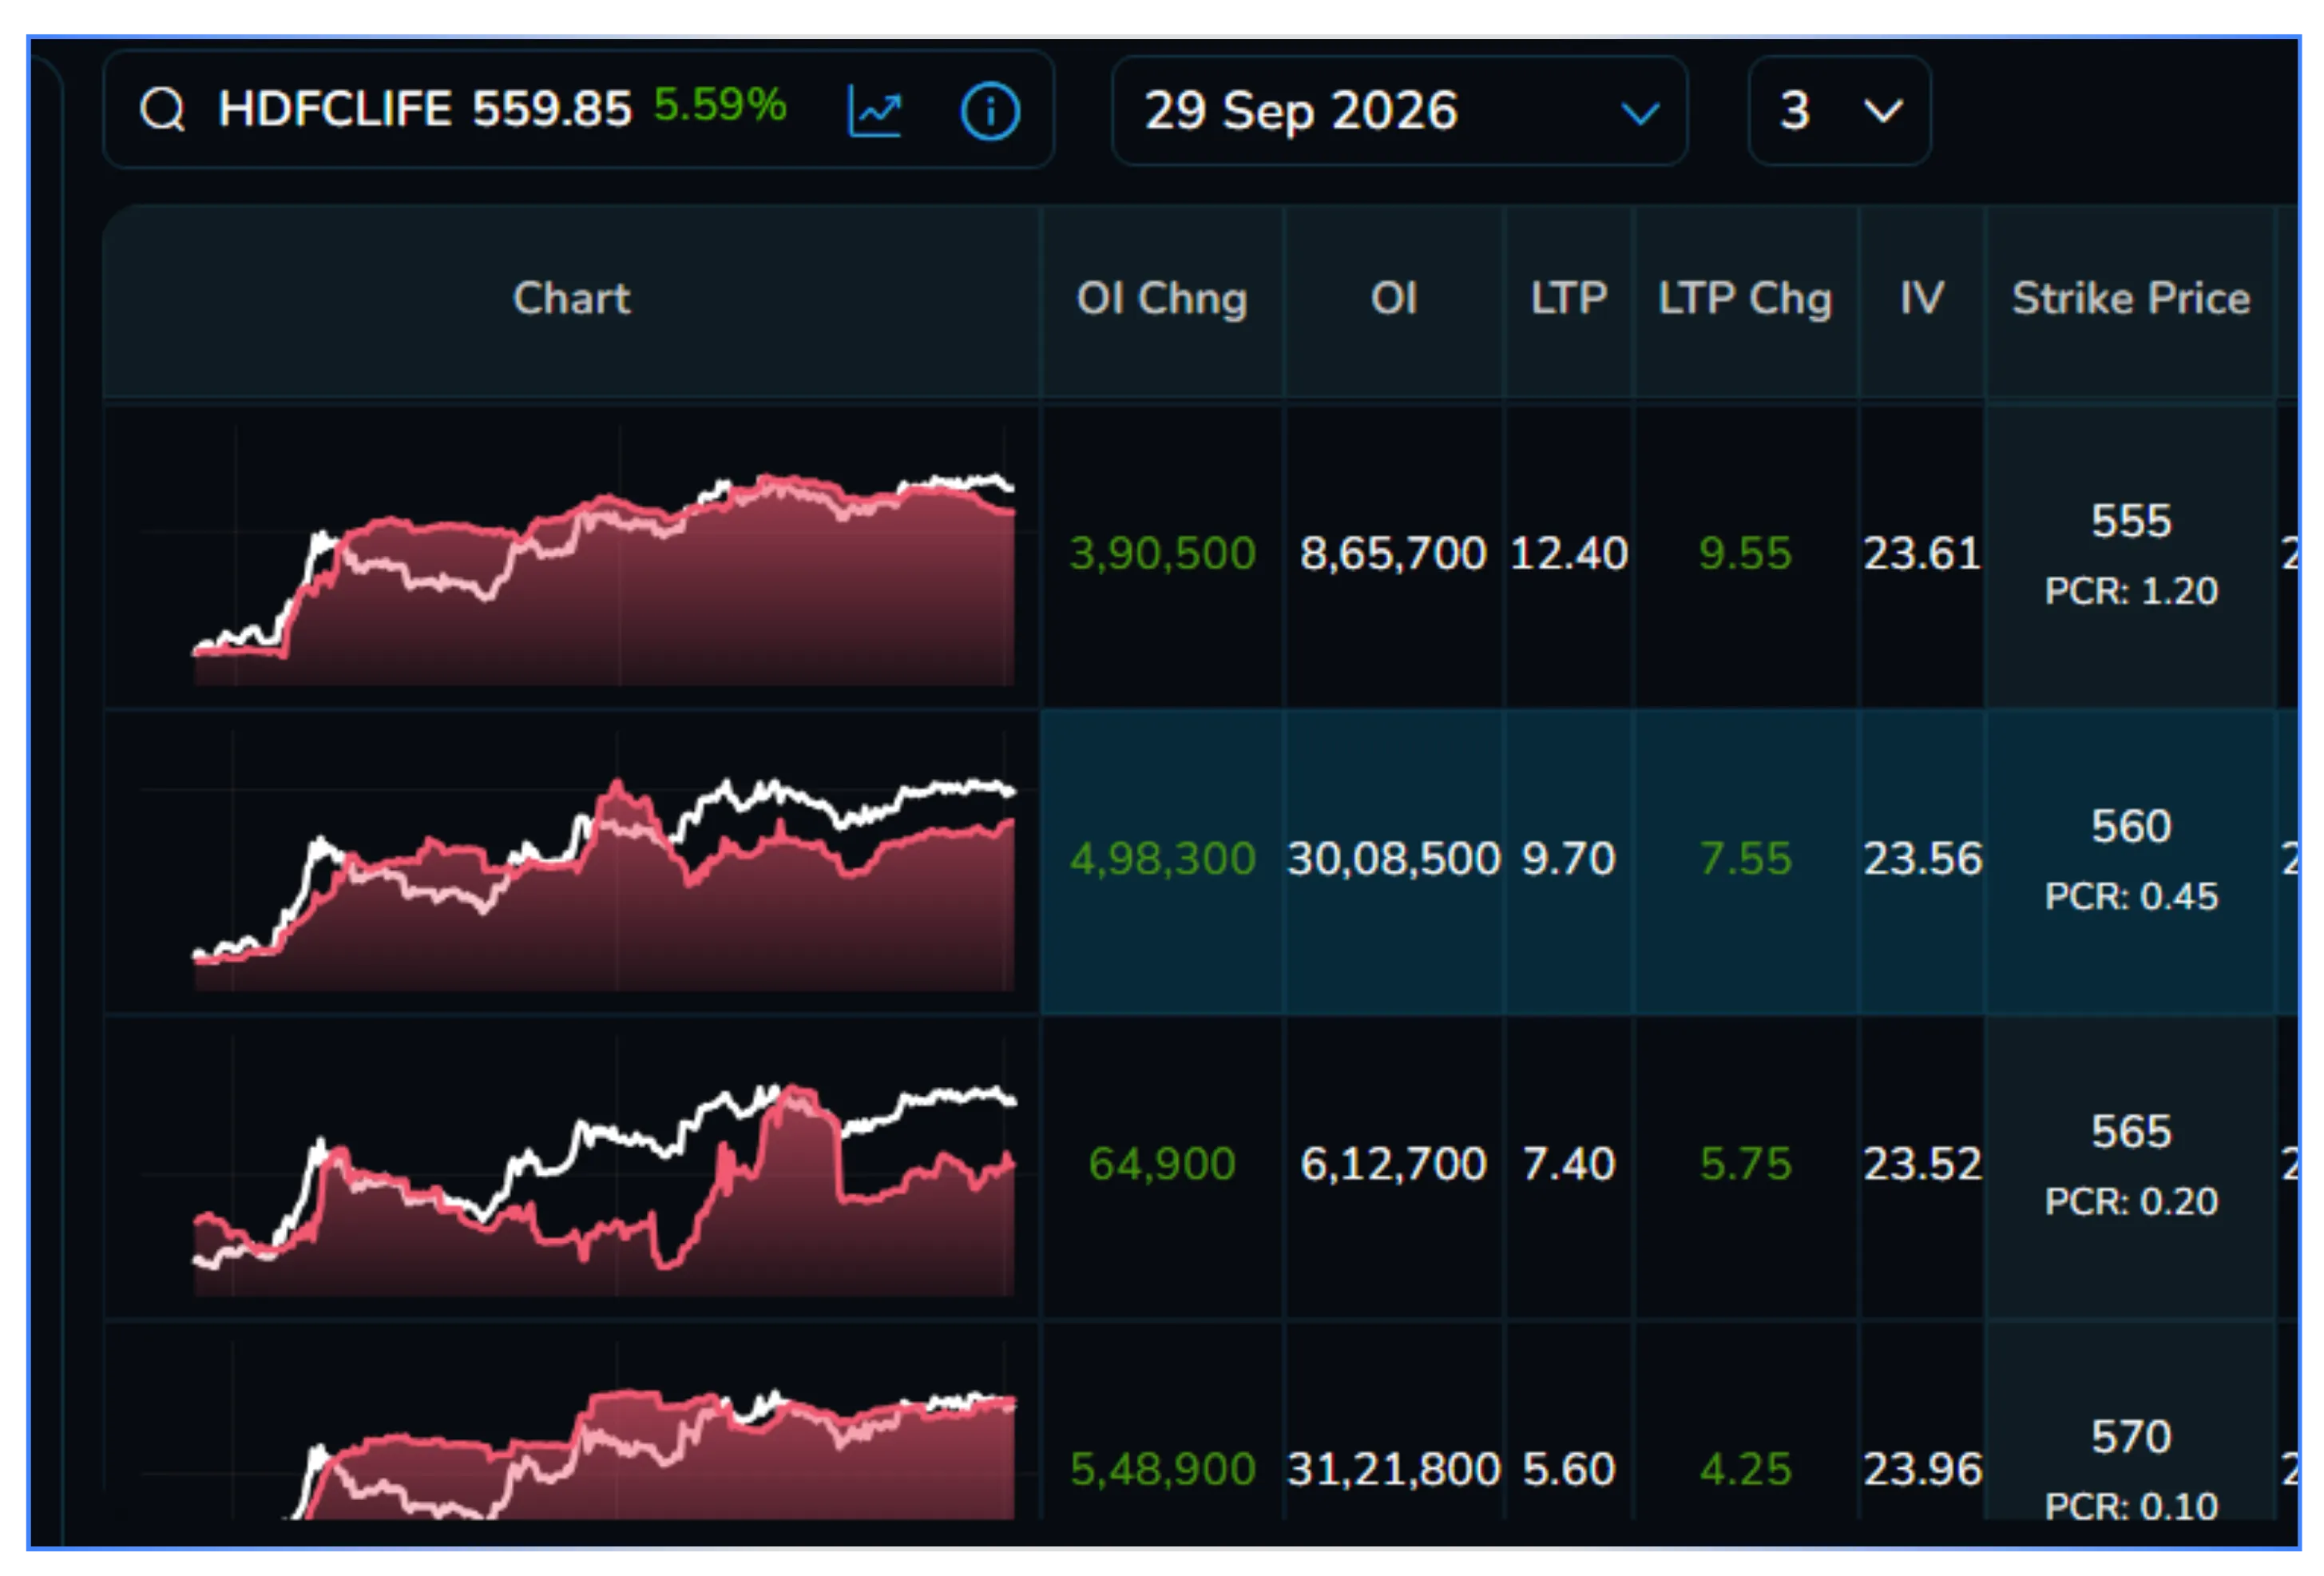
• OI up + premium down → short buildup in the classic sense: writers are adding contracts and comfortable letting premium bleed, i.e., they don't expect that strike to be tested. This is conviction.
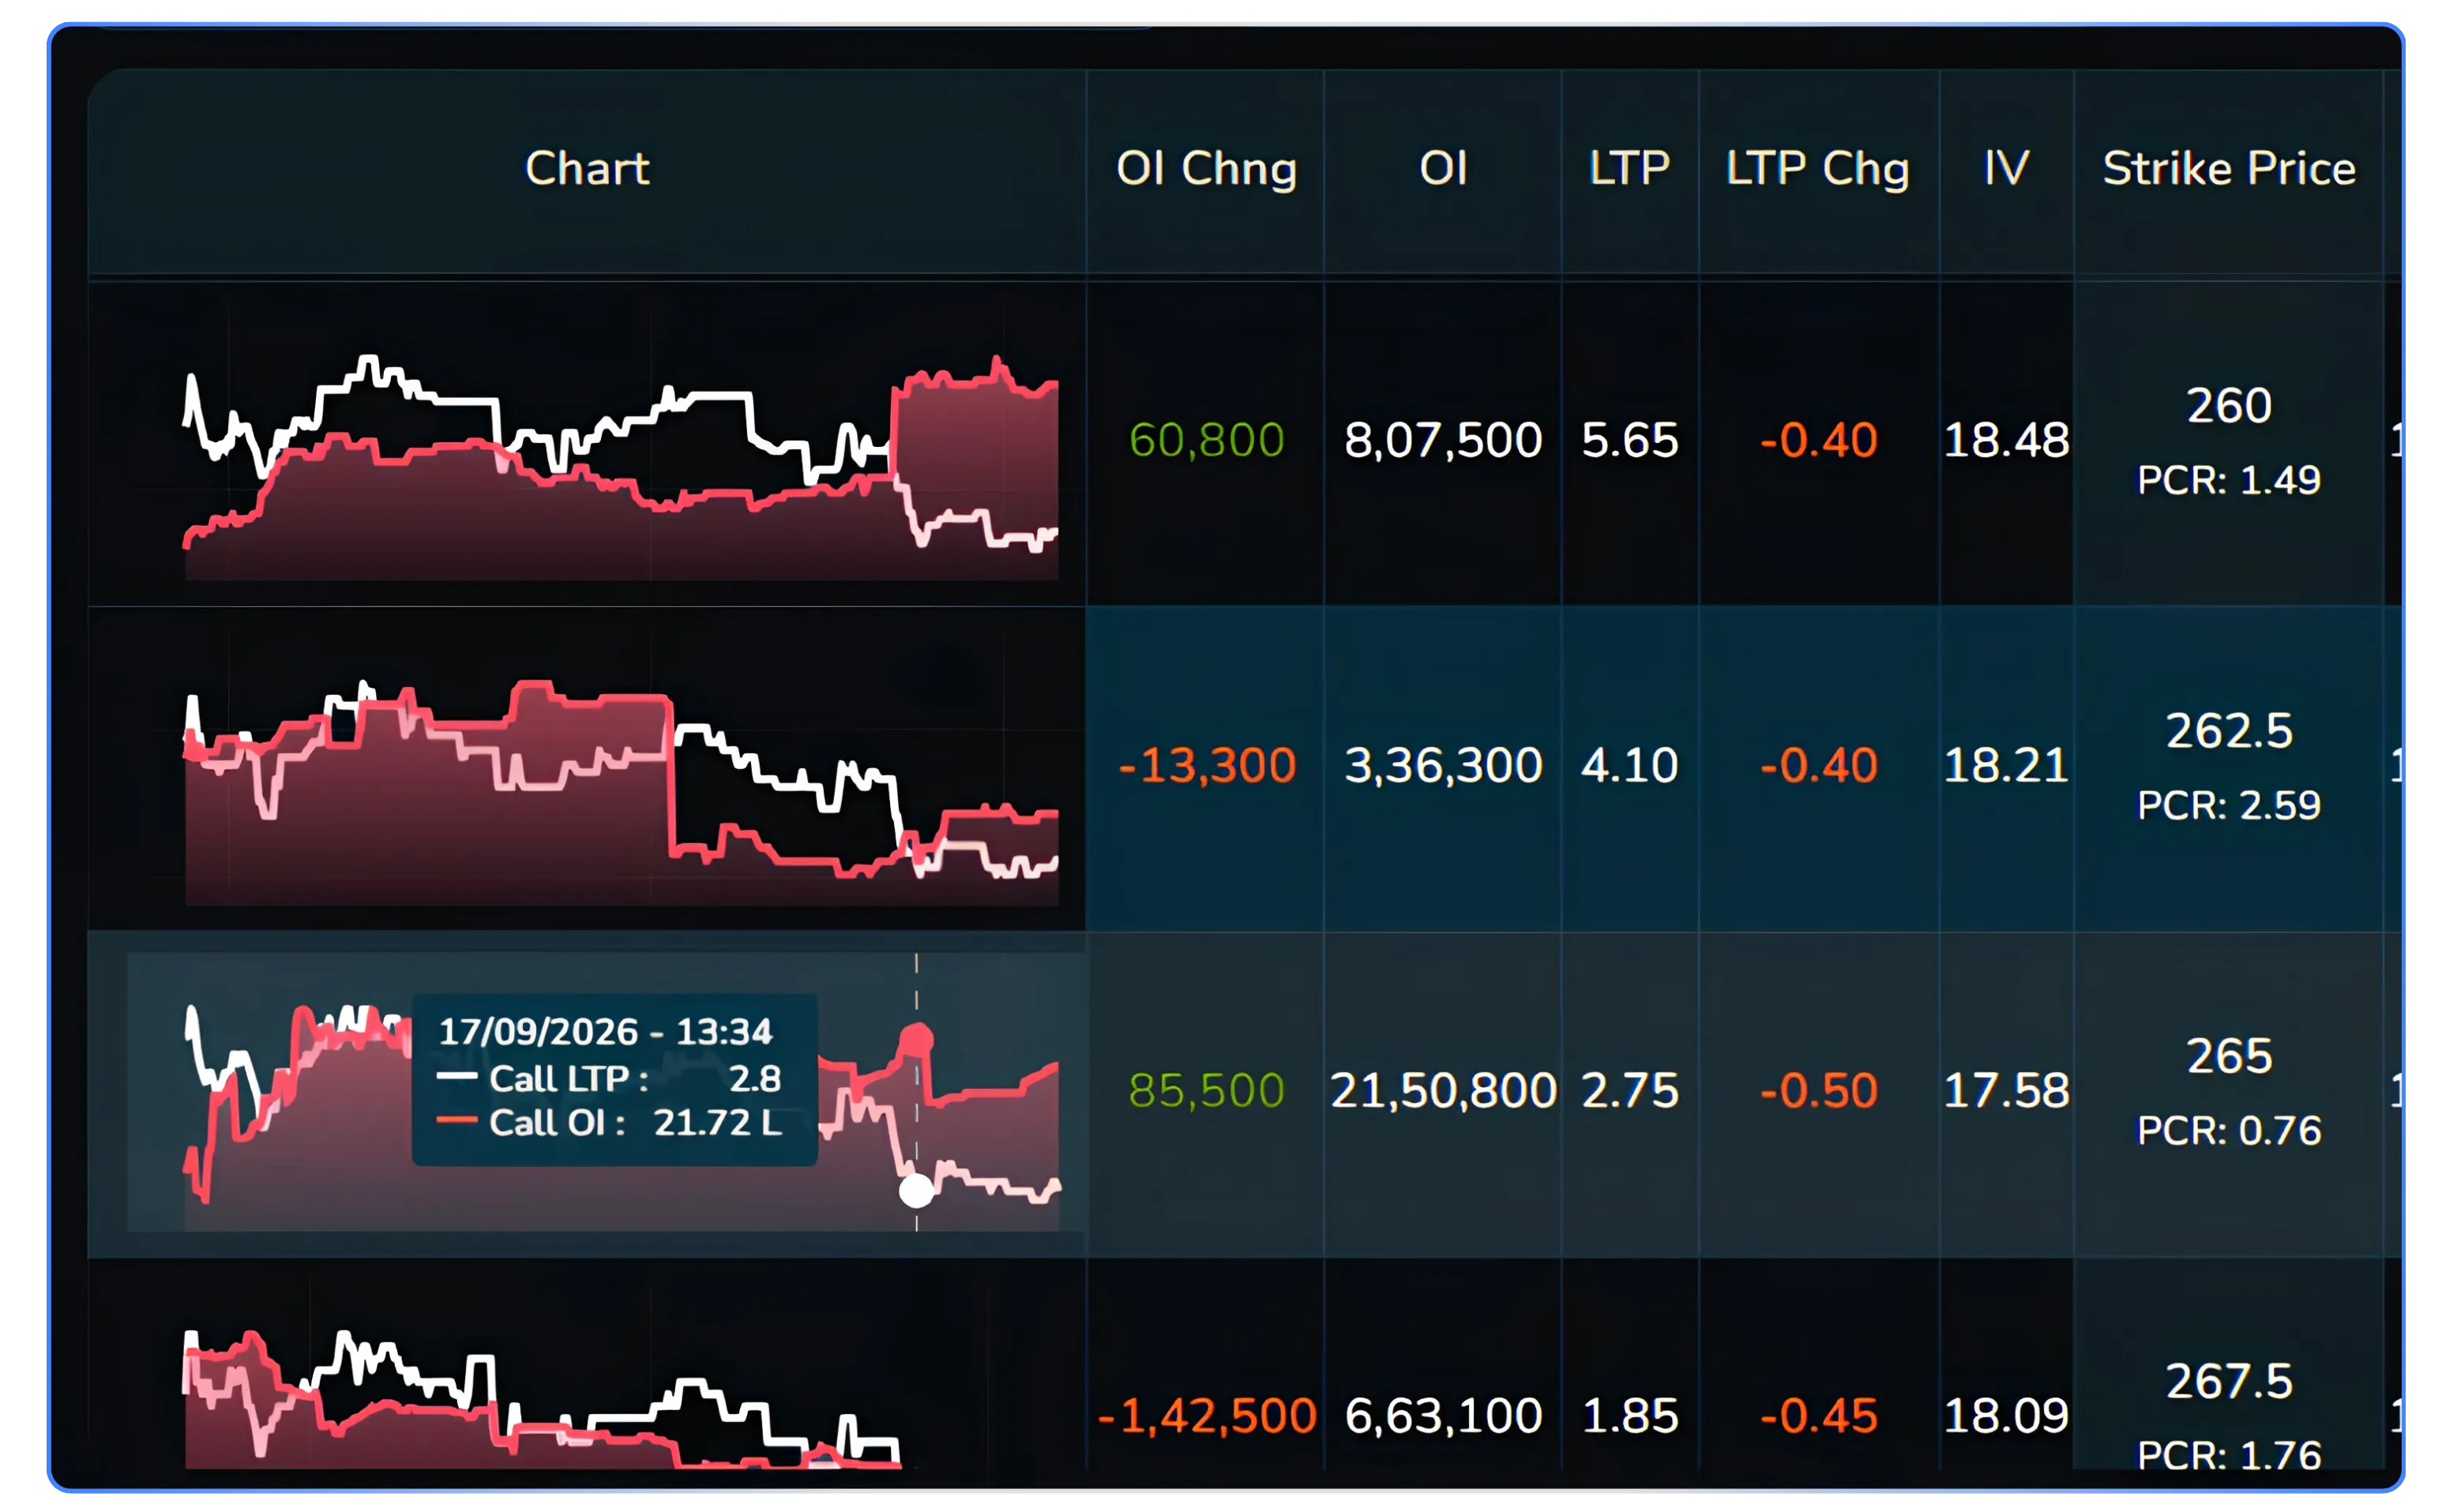
• OI down + premium up → short covering: writers are getting uncomfortable and buying back, pushing premium up as they exit. This is capitulation, not conviction.
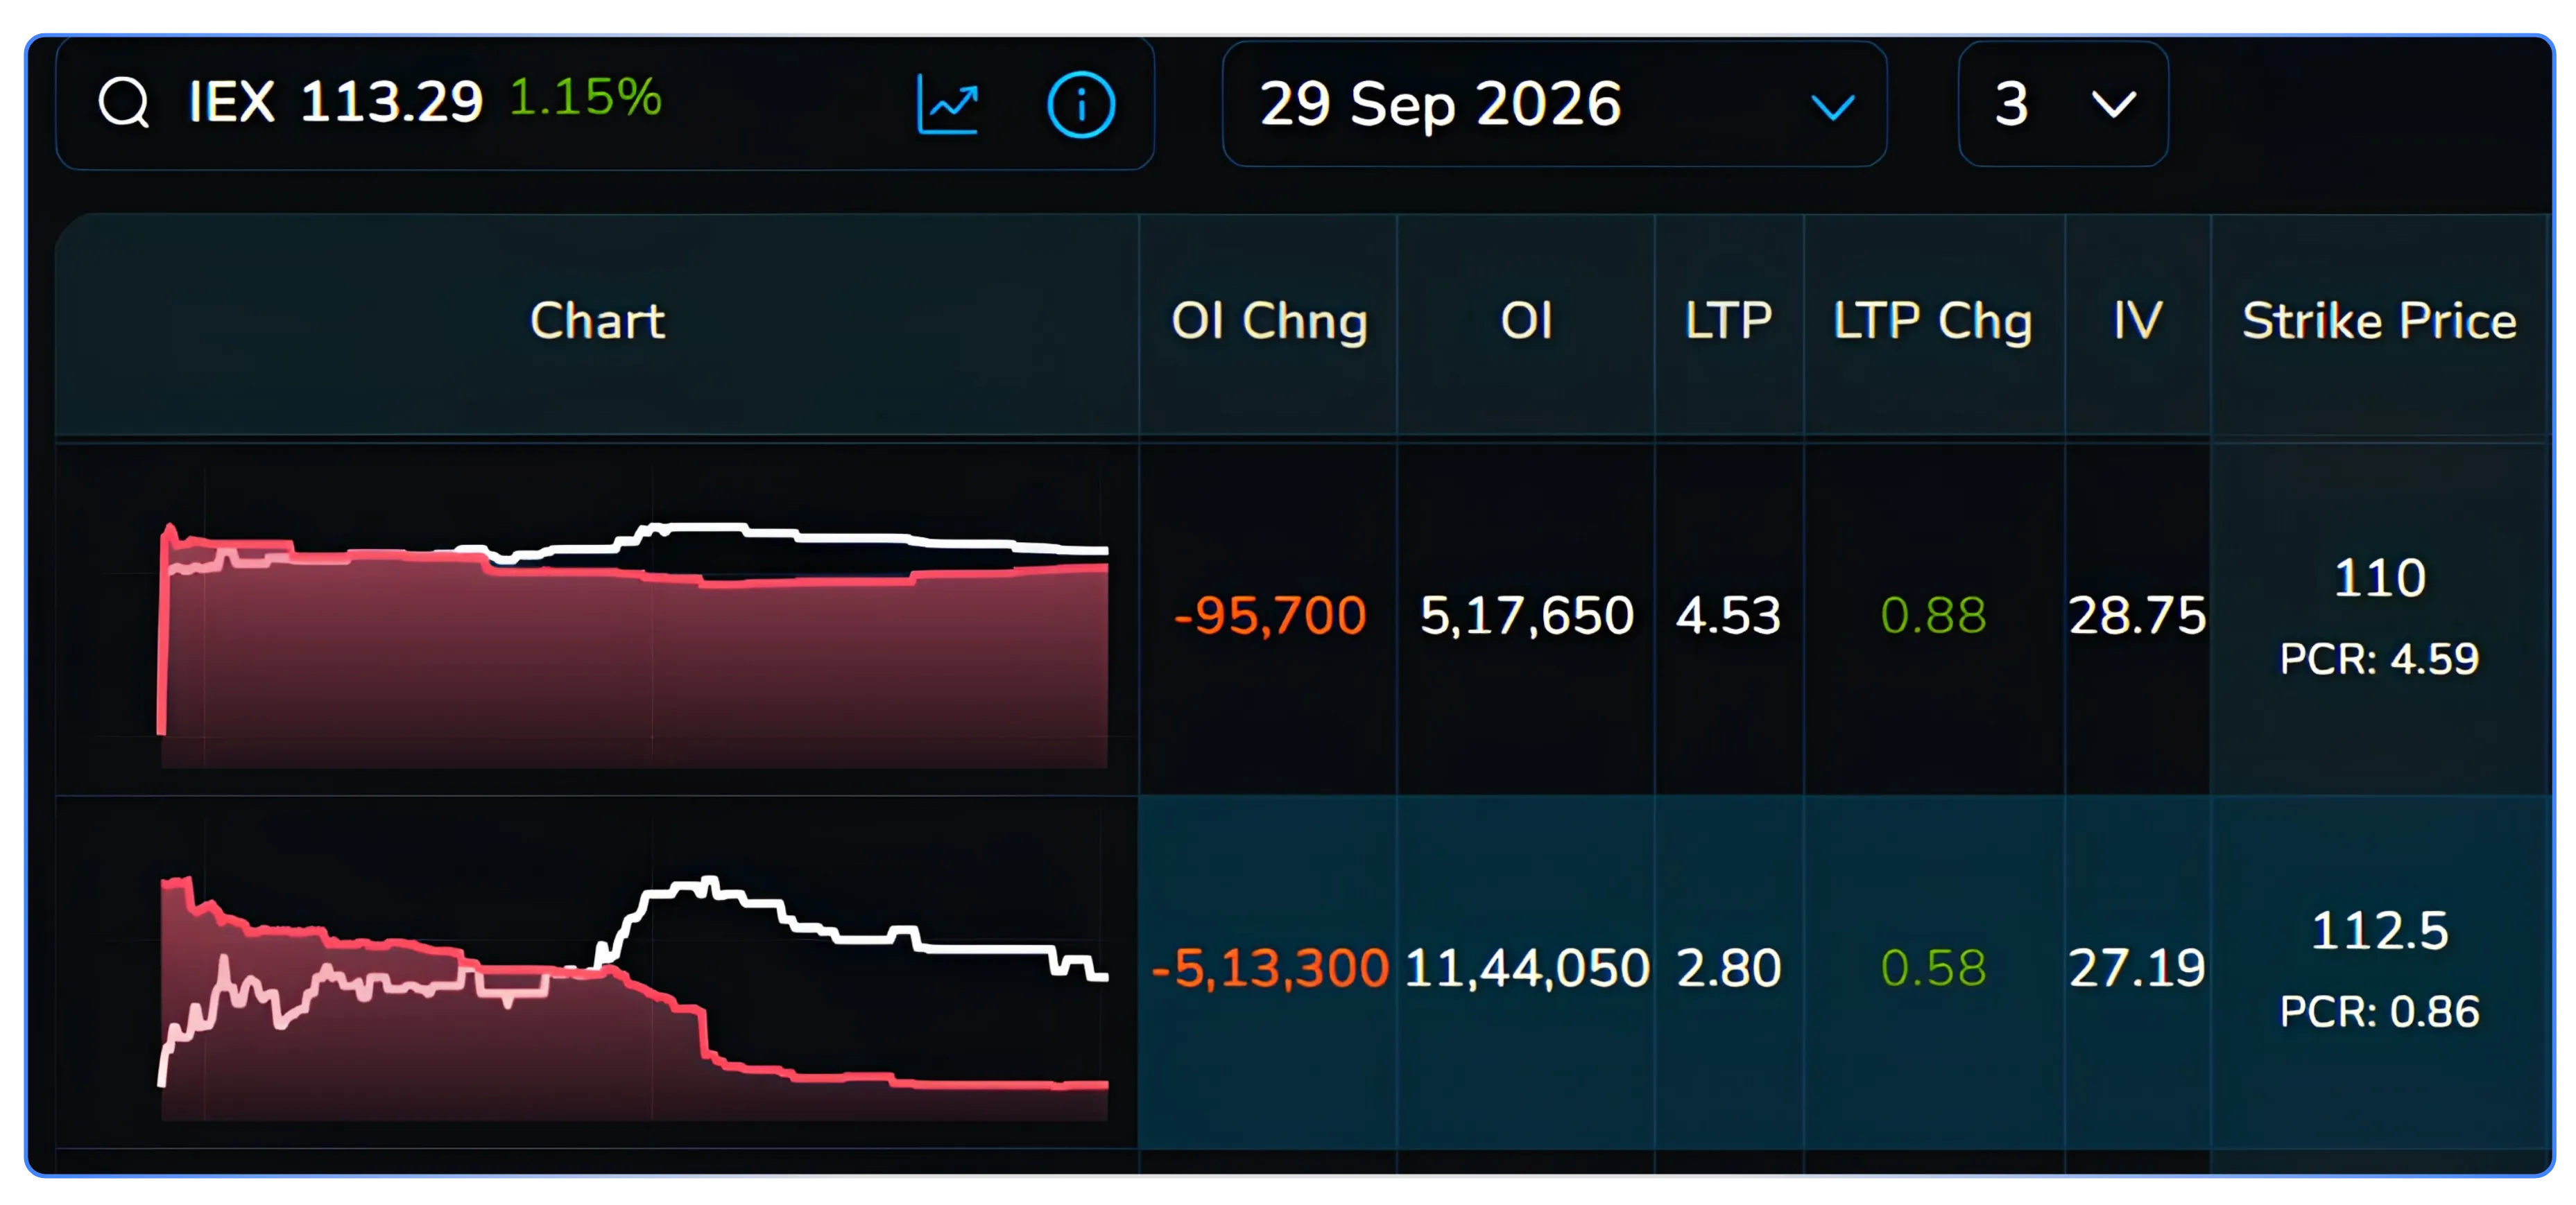
• OI down + premium down → long unwinding: buyers are giving up on the position as premium decays, closing out without a fight. Looking at the intraday shape (not just the net number) matters because a strike can round-trip during the day (build up in the morning, unwind by 2 PM) and the net OI change alone won't show you that the conviction reversed. The chart shows you when in the session the flow turned, which is exactly what you need for a closing-hour read.
2. Strike-wise PCR: don't just read the index-level number
Most people quote a single PCR (Put OI / Call OI) for the whole chain and call it a sentiment gauge. That's a blunt instrument. The more useful read is PCR at each strike, particularly at and around the money; you can see it printed directly under the strike price in this view (e.g., “PCR: 0.37” at a strike near spot, “PCR: 3.13” three strikes out).
• A PCR compressing toward 1 at strikes near spot as the day progresses tells you the market is genuinely undecided and both sides are writing aggressively, a setup for a range-bound close.
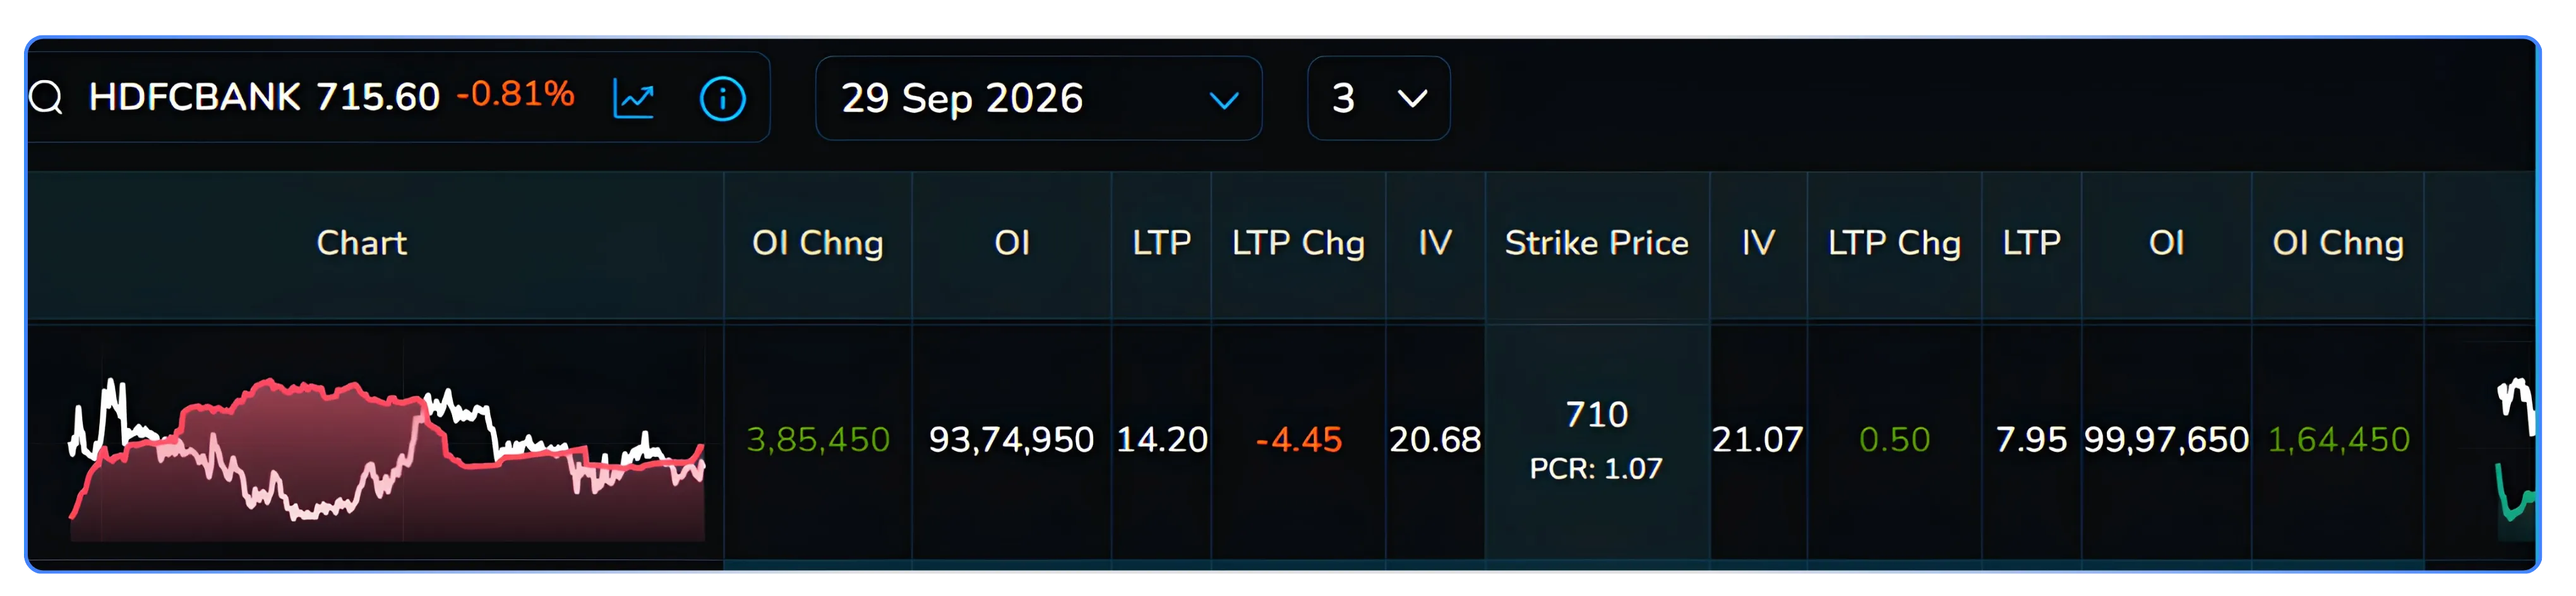
• A PCR at the immediate OTM call strike that's collapsing (call OI growing much faster than put OI at that strike) while PCR one or two strikes further out stays elevated tells you resistance is being reinforced right where price is likely to test it tomorrow morning. • Strike-wise PCR read alongside overall PCR also flags false comfort: overall chain PCR can look neutral while the strikes immediately relevant to tomorrow's likely range are heavily one-sided.
3. Strike-wise IV: separating “real” build-up from repricing
IV per strike is the filter that keeps you from misreading OI change as a directional signal when it's actually a volatility repricing.
• If OI is building at a strike and IV is rising there, the market is pricing in a real chance that strike gets tested; writers are demanding more premium to take the risk, even as they add contracts. That's a stronger, more expensive conviction bet.
• If OI is building at a strike while IV is falling, writers are getting more comfortable, not less; they're adding size because they believe the strike is safe, and the falling IV confirms decaying urgency. This is the cleaner “wall being built” signal.
• A comparison across strikes also gives you a rough skew read: if IV is elevated on the put side relative to equivalent-distance calls, downside hedging demand is real and shouldn't be dismissed even if call OI looks heavier.
4. The core use case: closing-hour unwinding vs. build-up as a BTST/STBT trigger
This is where the three data points above combine into something tradeable.
The last 20–30 minutes of the session is disproportionately informative because it's when option writers (who carry overnight gamma and theta risk) make their final commitment for the day. A pattern worth specifically watching for into the close:
Call-side unwinding + put-side build-up (into the close)
Call writers near/above spot are buying back (OI down, often with a premium pop as they cover), while put writers at or below spot are adding fresh contracts (OI up, premium holding or falling, IV steady-to-down). Read together: call writers no longer feel resistance overhead is safe to hold short against, and put writers are comfortable selling downside protection. Net read: bullish bias into the next session; a candidate BTST long, since the writers with the most skin in the game are both signaling the same direction with real capital, not just price action.
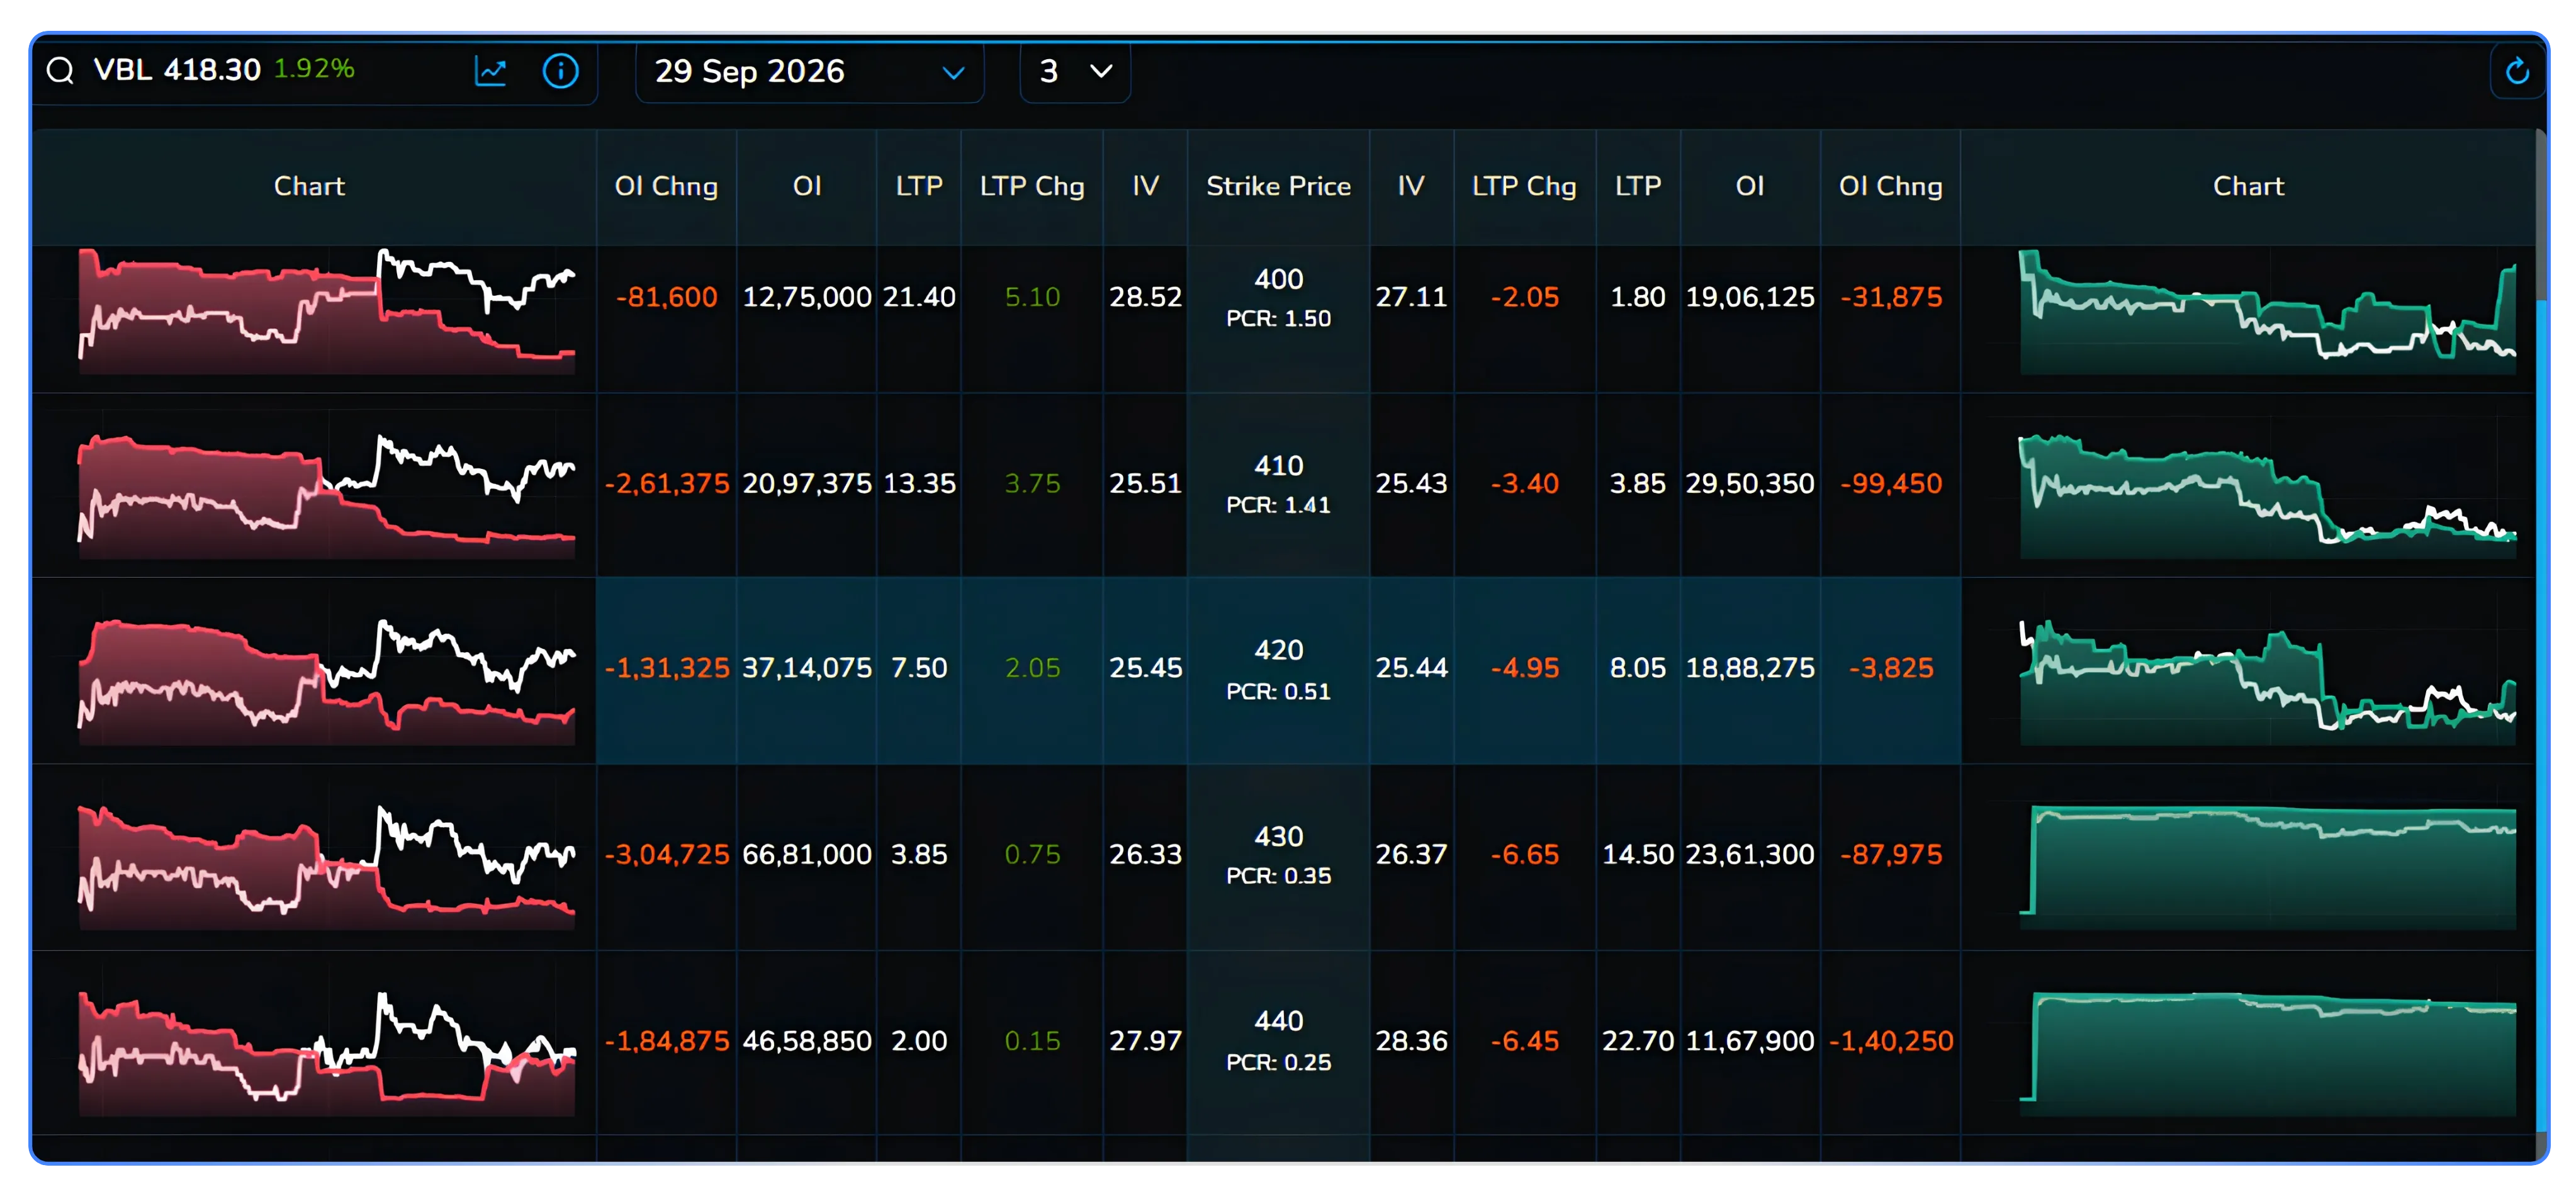
Put-side unwinding + call-side build-up (into the close)
Mirror image: put writers are buying back protection they sold (getting nervous about downside), while call writers are adding fresh short call OI comfortably. Net read: bearish bias into the next session; a candidate STBT short.
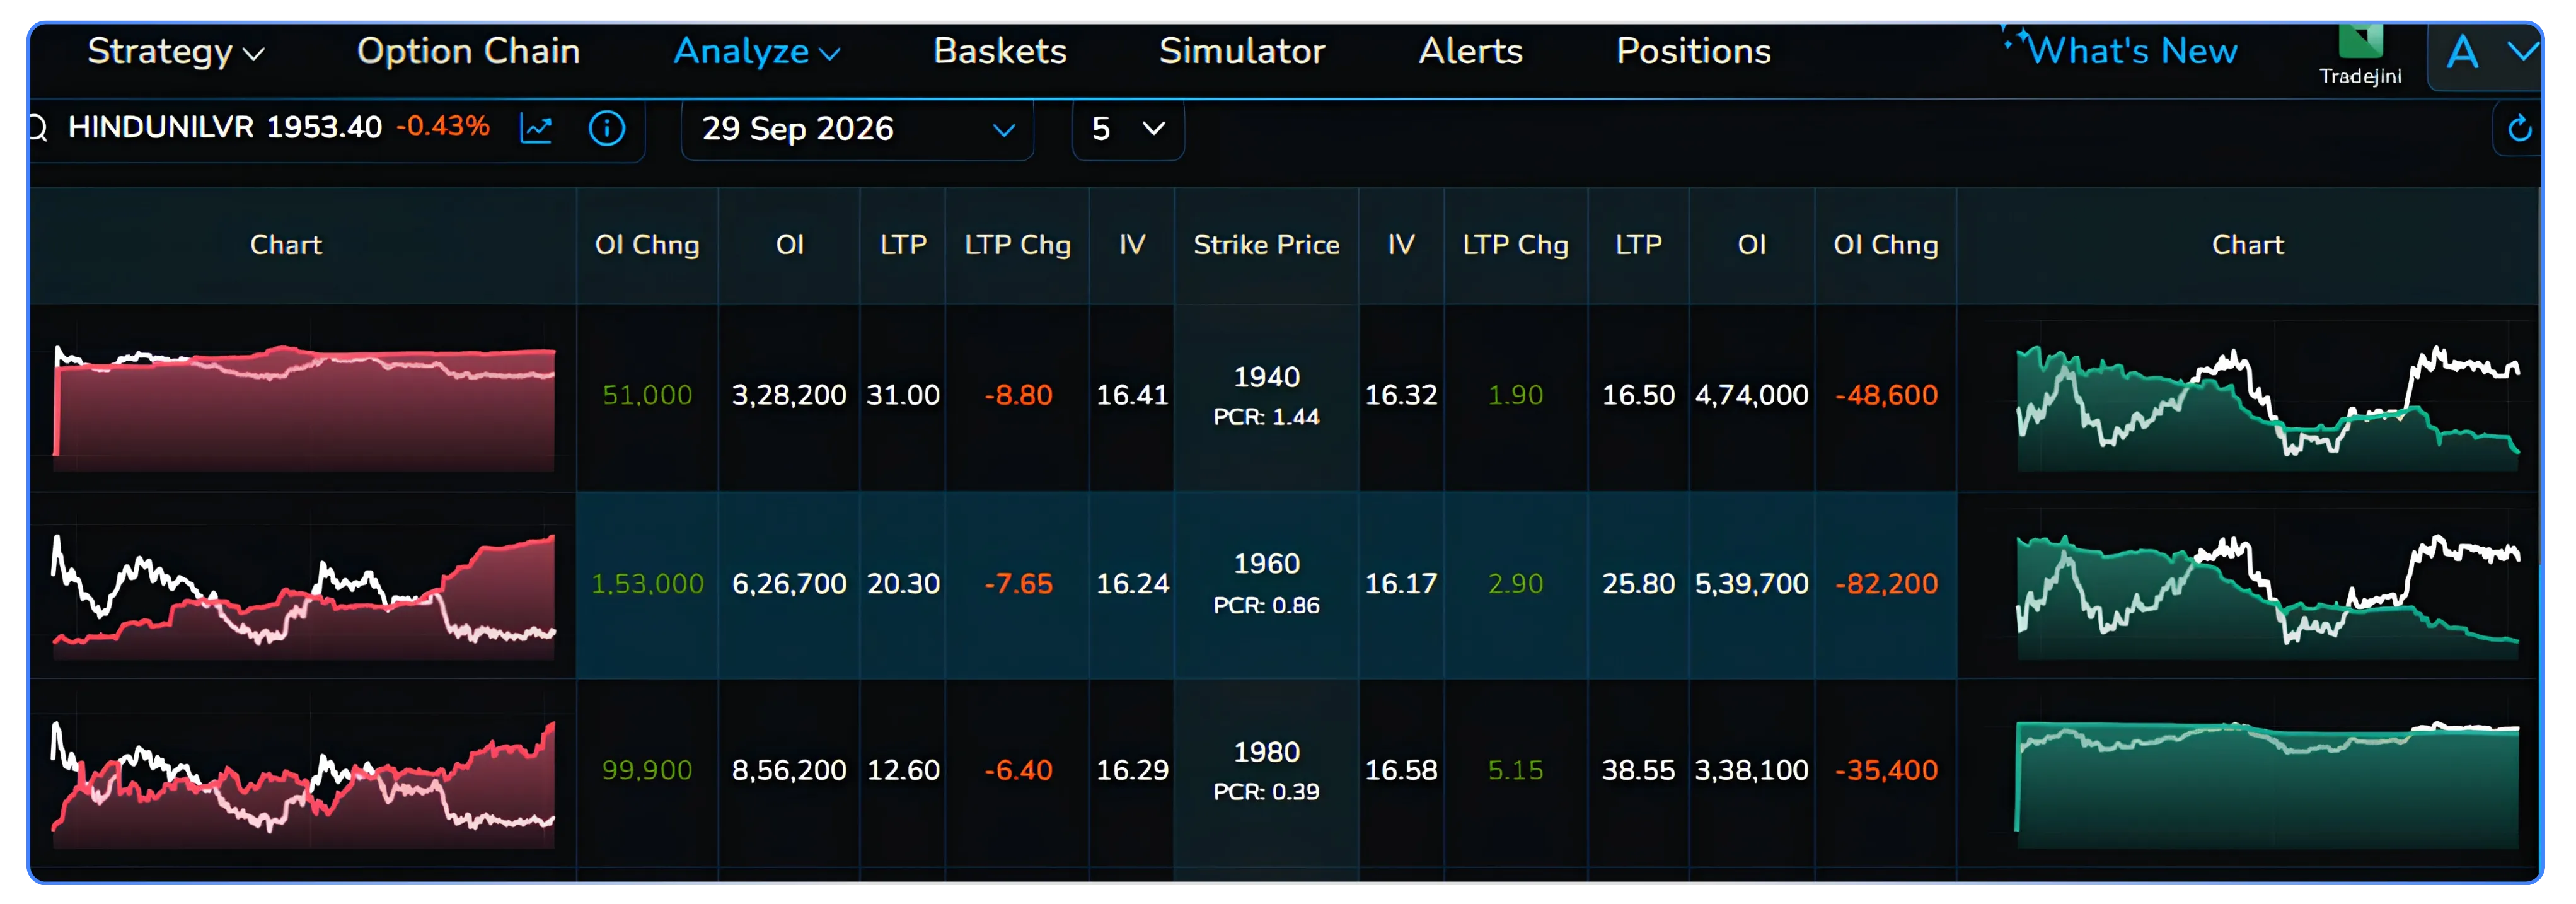
Why this matters more than price action alone
Prices near the close can be noisy. A small volume push either way can move the spot without changing anyone's real position. OI and premium changes at specific strikes, by contrast, require someone to commit fresh margin or close out an existing one. Writers, in particular, are the more informed side of the chain in aggregate (they're pricing risk, not chasing momentum), so a coordinated unwind-on-one-side/build-on-the-other pattern in the last half hour is a higher-conviction signal than the index candle alone.
A practical closing checklist
Pull OI change, LTP change, and IV for the 3–4 strikes on either side of the spot, comparing the last snapshot of the day to the one ~30 minutes earlier.
Confirm the pattern is directionally consistent; you want unwinding concentrated on one side and build-up concentrated on the other, not a scattered mix (a scattered mix means no real consensus, and you should sit out).
Cross-check strike-wise PCR at the money: it should be moving in the same direction as your OI read (rising PCR supporting a bullish call-unwind read, falling PCR supporting a bearish put-unwind read).
Check IV isn't spiking chain-wide (an event-driven IV spike (earnings, macro data) can distort all four readings and should be treated as noise, not conviction, until the event passes).
Size the BTST/STBT position for gap risk regardless of how clean the signal looks; this is a probability tilt from positioning data, not a guarantee, and overnight gaps can move well beyond the strikes you were watching.
Caveats
This read works best on liquid, F&O-active names with genuine two-sided writer participation (large caps, index constituents) — thin-OI strikes will show “build-up” or “unwinding” that's really just one or two lots moving and isn't meaningful. It's also a bias, not a trade in itself: combine it with your existing technical/trend filters rather than trading the OI pattern in isolation. And remember writer positioning can itself be revised the next morning in the first 15 minutes of trade; the read tells you where conviction stood at last night's close, not where it will still be tomorrow.
Disclaimer: The information provided in our blogs is for informational purposes only and should not be construed as financial, investment, or trading advice. Trading and investing in the securities market carries risk. Always conduct your own research and consult with a qualified financial advisor before making any investment decisions. Past performance is not indicative of future results. Copyrighted and original content for your trading and investing needs.
© 2026 — Tradejini. All Rights Reserved.