


At its core. The Triangle in Point & Figure charts is a multi-column consolidation that shows contracting range between rising bottoms and falling tops, or vice versa, that resolves into a decisive breakout. In P&F terms the Triangle is not drawn with trendlines on a bar or candlestick chart. Instead it is identified as a sequence of X and O columns where the columns converge to form at least five vertical columns that display rising bottoms and lower tops in a bullish triangle, or falling tops and higher bottoms in a bearish triangle. The pattern is context-dependent. It frequently acts as a continuation pattern when it forms inside an existing trend, but it can also signal a reversal when it forms at key structural support or resistance. Traders who use Point and Figure Triangle pattern trading rely on discrete P&F signals to convert the visual consolidation into tradeable entries and exits using P&F Double Top Double Bottom confirmation.
Component Breakdown
| Component | Pattern Type | Description | Ideal Time / Duration |
|---|---|---|---|
| Formation baseline | Consolidation | Series of converging X and O columns. Must have ≥ 5 vertical columns to qualify. | Weeks to months depending on box size |
| Rising bottoms | Bullish Triangle component | Sequential bottoms that step up across columns, signaling supply drying up. | 3–8 columns typical |
| Lower tops | Bullish Triangle component | Tops in X-columns fail to reach prior highs, showing demand weakening. | 3–8 columns typical |
| Breakout column | Directional trigger | An X column exceeding previous resistance for bullish. An O column penetrating support for bearish. | Should happen within X–3 sessions after breakout begins |
| Confirmation signals | Volume, adjacent indicators | Volume expansion on the breakout, Relative Strength confirmation, or another P&F buy/sell signal. | Confirm within 1–5 sessions |
Notes. Use box size and reversal settings appropriate to your timeframe. For positional work prefer larger box sizes and 3-box reversal. For intraday P&F scans use smaller boxes and faster reversal counts.
Visual Identification Guide
Smart tip: Start with the big picture. Start with the big picture. Zoom out until you can clearly see the columns of X and O. If the formation looks messy when zoomed out, it’s likely not a valid Triangle.
- Locate at least five vertical columns. A valid Triangle must have four or more columns in the converging sequence. Fewer is unreliable.
- Confirm rising bottoms and falling tops for a Bullish Triangle. Look for a visual staircase where the lowest O in successive O-columns steps higher, while the tops of X-columns step lower. The opposite applies for a Bearish Triangle.
- Check prior trend. Does the Triangle sit inside an uptrend or downtrend. Triangles that align with the prior trend have higher odds of continuation and work best in positional trading P&F chart analysis.
- Volume behavior. Volume should generally decline through the consolidation and expand on the breakout column. Volume expansion validates the breakout, lack of it raises the false-breakout risk.
- P&F signal confirmation. Wait for a P&F Double Top buy signal (bullish) or Double Bottom sell signal (bearish) resulting from the breakout column. Do not trade the visual pattern alone.
- Check supporting indicators. Use Relative Strength, moving-average slope on a parallel price chart, or an IV/option-flow spike if you trade options, to add conviction.
- Touch-point flexibility. Triangles in P&F rarely have perfect symmetry. Focus on the sequence of highs and lows rather than exact touches.
Pro tips.
- If the formation sits right on a known Bullish Support Line, treat breakout signals as higher-probability trades, provided volume and RS align.
- This is a reminder. Do not trust patterns blindly. Always wait for confirmation.
Comparative Analysis
| Feature | Triangle (P&F) | Flag / Pennant |
|---|---|---|
| Shape | Converging columns of X/O over ≥ 4 columns | Small rectangular or pennant on bar/candle charts |
| Typical duration | Medium term on P&F charts | Short-term consolidation (days–weeks) |
| Best use | Continuation within medium-term trend | Quick continuation after sharp impulse |
| Confirmation | P&F buy/sell signal plus volume | Breakout candle with volume on regular charts |
Triangles on P&F charts differ from classical trendline triangles on candlestick charts. The core distinction is the P&F pattern encodes supply/demand through discrete columns and provides cleaner buy/sell signals such as P&F Double Top Double Bottom confirmation. Use Triangles when you want level-based entries derived from box-based signals, and use flags/pennants for fast intraday continuation setups. When combining P&F Triangle measured move target projections with regular chart setups you get complementary target methods.
Market Psychology & Context
Understanding the psychology behind Triangle breakouts explains why they often produce sharp moves. The pattern represents a reduction in volatility and an equilibrium of buying and selling. In P&F terms, buyers provide X columns and sellers provide O columns. When successive bottoms rise and tops fall in a Triangle, you are witnessing supply incrementally drying up, while demand hesitates, or vice versa.
Institutional behavior. Institutions often use consolidations to accumulate or distribute without moving price aggressively. The converging P&F columns show that both sides are testing each other with decreasing conviction. When an institutional order finally tips the scale, it creates a breakout column that produces a P&F buy or sell signal. That breakout often triggers stop orders and algorithmic flows, amplifying the move.
Retail behavior. Retail traders typically react to breakout headlines or visible break levels. Without volume or confirmation, many retail breakout attempts fail as weak hands get trapped. Triangles that break with clean P&F signals usually coincide with real buying or selling pressure rather than noise.
Supply/demand dynamics. A Triangle compresses the range, concentrating liquidity near the apex. When supply is exhausted, a relatively small influx of demand can push price past the resistance X-column. The breakout converts trapped orders into momentum as stop-losses and trend-followers join.
Why signals work. The structure predicts movement because it isolates the moment when supply/demand imbalance becomes decisive. The breakout is a probabilistic event where order flow shifts from balanced to one-sided. The main danger is ignoring volume and broader market context, which magnifies false-breakout risk. Do not trust patterns/indicators blindly. Always wait for confirmation.
Practical Trading Application
Bullish Triangle – Quick Recap.
Forms as rising bottoms with lower tops over ≥ 4 columns. Trading bias is bullish in an uptrend. Enter on the P&F Double Top buy signal that exceeds the triangle’s resistance column, confirmed by Volume confirmation P&F breakout and supportive RS. Place stop below the recent P&F double-bottom. Targets are measured from base width projected from breakout using a P&F Triangle measured move target.
Bearish Triangle – Quick Recap.
Forms as falling tops with higher bottoms over ≥ 4 columns. Trading bias is bearish in a downtrend. Enter on the P&F Double Bottom sell signal that breaks support. Stop is above the recent P&F double-top. Targets use measured move projection from the pattern width.
Real Chart Examples
Bullish Triangle on SBIN
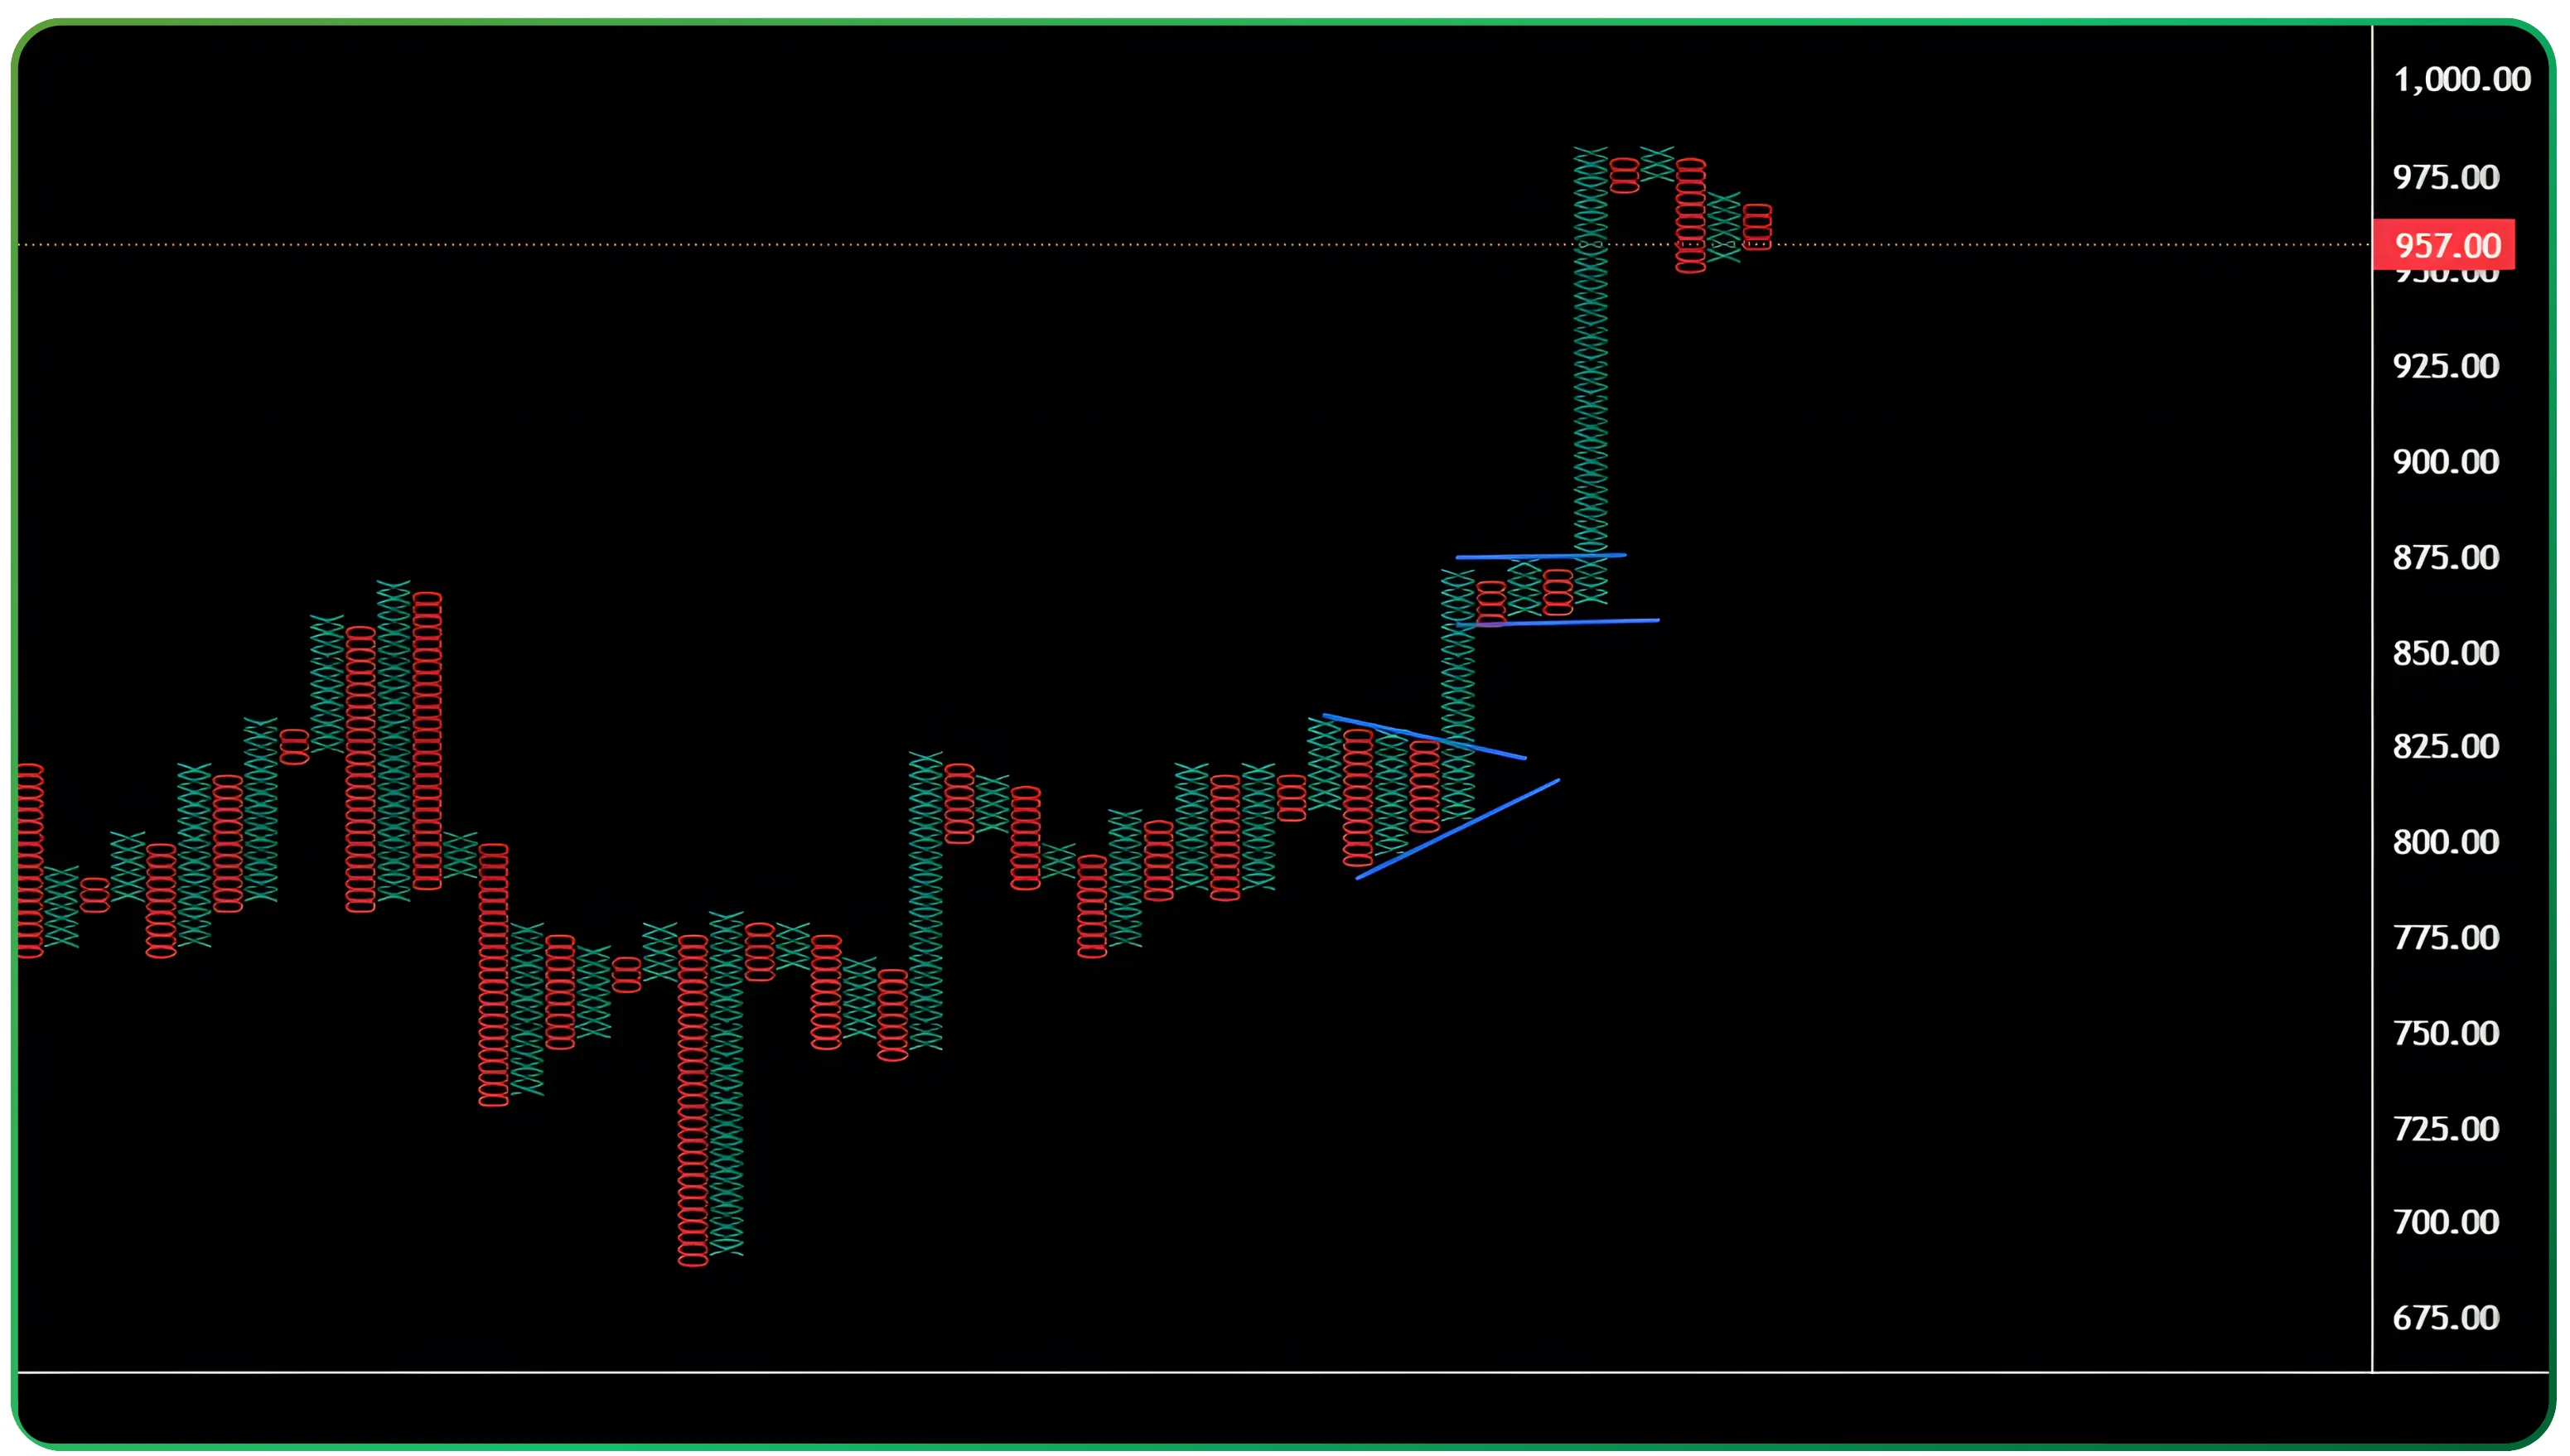
Chart Details:
- Stock: State Bank of India (SBIN)
- Date Range: July 2025 to August 2025
- Pattern Type: Triangle – Bullish
- Price at Pattern Start: ₹805-810 (base where the first O-column of the triangle formed)
Pattern Explanation:
The pattern shows a clean Bullish Triangle: bottoms in successive O-columns rise from ~₹805 to ~₹820, while tops in successive X-columns fall from ~₹840 down toward ₹830. This creates the classic contracting structure.
A strong breakout X-column then clears the upper boundary near ₹840-₹845, completing the Triangle and giving the Double Top buy signal. The following vertical X-run confirms demand overwhelming supply.
Entry Point:
- Entry triggered when: P&F Double Top buy signal above the Triangle resistance.
- Entry Price: ₹845
- Confirmation Signal: Strong expansion in the X-column (vertical run)
Stop Loss:
- Stop Loss Level: ₹820
- Placement Logic: Just below the last rising low within the Triangle. This was the prior O-column low before breakout.
- Risk Amount: Approx. ₹25 per share.
- Stop Loss Level: ₹820
- Placement Logic: Just below the last rising low within the Triangle. This was the prior O-column low before breakout.
- Risk Amount: Approx. ₹25 per share.
- Target Price: ₹930
Trade Outcome:
- Entry: ₹845
- Exit: ₹930
- Profit/Loss: ₹85 or 10.1%
Key Takeaways:
- Demand was building inside the pattern. Rising bottoms show supply drying up.
- Breakout was decisive. The X-column expansion validated control shifting to buyers.
- Placement near an established uptrend added probability.
- Without the Double Top buy signal the move could have been mistaken for noise.
Bearish Triangle on MAXHEALTH
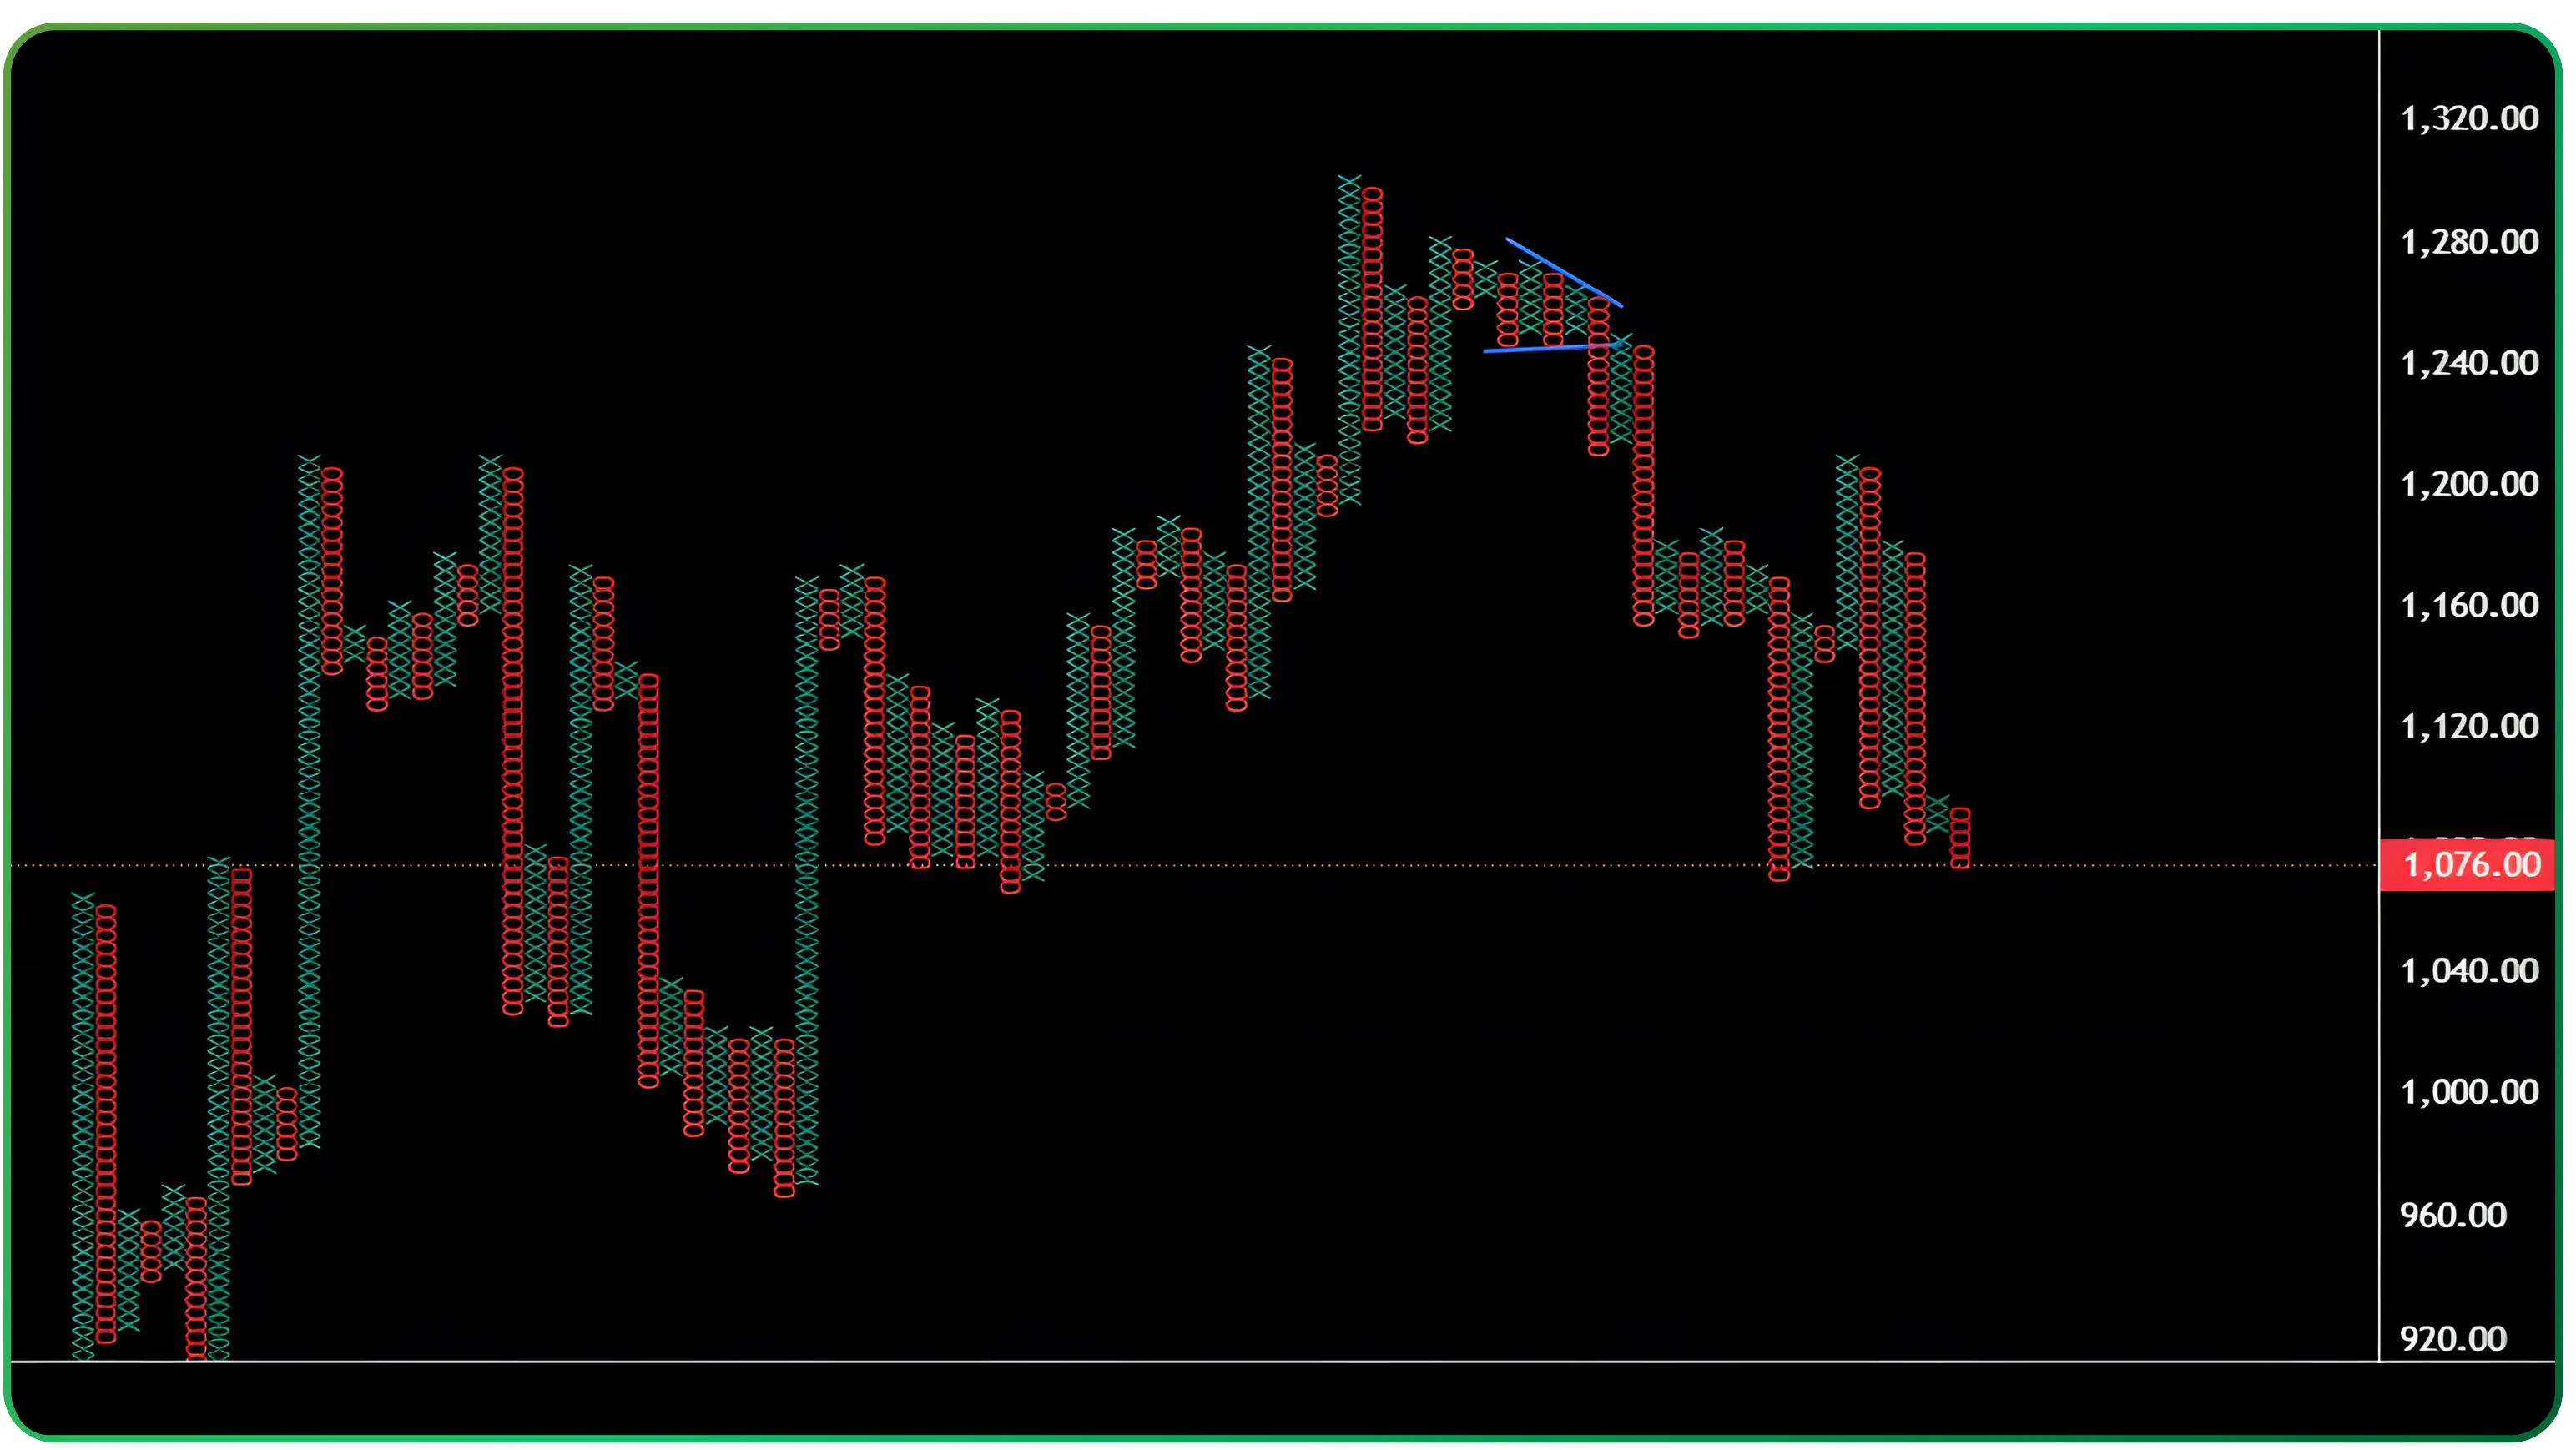
Chart Details:
- Stock/Index: MAXHEALTH
- Date Range: August 2025 - September 2025
- Pattern Type: Triangle – Bearish
- Price at Pattern Start: ₹1260 - ₹1270 (level where the first O-column inside the contraction begins)
Pattern Explanation:
The pattern forms a Bearish Triangle with progressively lower tops in the X-Columns (from ~₹1,300 → ~₹1,285 → ~₹1,270) and slightly higher bottoms early in the pattern before supply takes control. This creates a contracting structure that resolves downward. The decisive O-column breakdown occurs around ₹1,240, completing the Triangle and producing a Double Bottom sell signal.
Entry Point:
- Entry triggered when: P&F Double Bottom sell signal confirmed below Triangle support.
- Entry Price: ₹1,240
- Confirmation Signal: Strong O-column expansion
Stop Loss:
- Stop Loss Level: ₹1,270
- Placement Logic: Just above the last lower top inside the Triangle structure. This level indicates the breakdown if reclaimed.
- Risk Amount: ₹30 per share
Exit Point:
- Target Price: ₹1,120-₹1,130
Trade Outcome:
- Entry: ₹1,240
- Exit: ₹1,095
- Profit/Loss: ₹145 per share or 11.7% gain for a short position
Key Takeaways:
- The structure had a clean series of falling tops, a key trait of a high-quality Bearish Triangle.
- Breakout was decisive. O-column expansion confirmed supply dominance immediately after the trigger.
- Pattern worked because the broader context also titled bearish. Triangle breakdowns in aligned market conditions often travel farther.
- Stop placement above the last lower top kept the trade logically invalidated if broken
Strategic Summary
In P&F Trading triangles are diagnostic consolidations that tell you when the market is compressing supply and demand into a decisive zone. Their strength lies in discrete P&F signals such as Double Tops and Double Bottoms that remove ambiguity around breakout levels. Use Triangles as part of a four-step game plan. Step 1. Check overall market trend. Step 2. Check sector strength. Step 3. Validate the underlying’s fundamentals for longer-term trades. Step 4. Time the entry using the Triangle breakout and accompanying P&F signal.
Core value proposition. Triangles give level-based entries and clear stop placement that is compatible with both equity and options strategies. For options, prefer buying limited-sized positions like one lot of options instead of large share-sized bets, let premium act as your stop if trading calls or puts as a way to gain staying power to expiration. Combining positional trading P&F chart analysis with conservative option sizing improves survival probability through chop.
Technical Specifications Table
| Spec | Recommendation | Notes |
|---|---|---|
| Box size | Daily traders: choose box to reflect ₹5–₹20 moves. Swing/positional: larger boxes | Bigger boxes reduce noise, smaller boxes increase sensitivity |
| Reversal count | 3-box reversal standard | 3-box for cleaner signals; 1–2 box settings are noisy |
| Minimum columns | ≥ 4 columns | Mandatory for Triangle qualification |
| Ideal timeframe | Daily / Weekly for positional traders | Weekly reduces whipsaw |
| Volume consideration | Volume declines during consolidation, expands on breakout | Volume is confirmatory (not primary) in P&F but critical on breakout |
| Breakout confirmation window | 1–5 sessions | Confirm within this window or treat as suspect |
Conclusion
Triangle breakouts in Point and Figure charts are not about prediction. They are about preparation. The pattern tells you when supply and demand are tightening, and more importantly, when that balance finally breaks. By waiting for a confirmed Double Top or Double Bottom signal, you remove guesswork and focus on levels where real participation enters the market.
As the SBIN and MAXHEALTH examples show, Triangle breakouts tend to deliver fast and directional moves when they align with the broader trend and market context. When they fail, they fail for clear reasons. Weak confirmation, poor volume support, or trading against the market bias. That clarity is the real edge. The pattern doesn’t promise certainty. It provides structure, defined risk, and repeatability.
If you want to apply Point and Figure analysis the right way, execution matters as much as analysis. CubePlus by Tradejini lets you scan PnF breakouts, track clean price structures, and execute trades without clutter or noise. Whether you trade equities or use options to express directional views, CubePlus gives you the tools to act decisively when patterns complete.
Triangles compress opportunity. CubePlus helps you catch the expansion.
Disclaimer: The information provided in our blogs is for informational purposes only and should not be construed as financial, investment, or trading advice. Trading and investing in the securities market carries risk. Always conduct your own research and consult with a qualified financial advisor before making any investment decisions. Past performance is not indicative of future results. Copyrighted and original content for your trading and investing needs.
© 2025 — Tradejini. All Rights Reserved.


