


Ever felt like you were nailing a trade on the 5-minute chart, only to get blindsided by a sudden reversal? Then you are not alone. That is the market’s way of reminding us that there's always a bigger picture at play. Intraday trading isn’t just about spotting quick moves, it’s about syncing with the rhythm of the market across multiple timeframes.
Multi-Time Frame Analysis (MTFA) isn’t some complicated strategy; it is just a smarter way to read the charts. In this article, we will explain how to use different timeframes to map the trend, find structure, and enter confidently. Let’s make those intraday decisions a little sharper.
Why does this matter?
Because the market moves in waves within waves. What seems like a strong rally on the 1-minute chart might be just a minor pullback on the 15-minute chart. Without MTFA, you risk going against the overall trend or exiting too early.
In intraday trading, where every tick and second counts, multi-time frame analysis isn't optional. It’s essential for staying aligned with the broader price action.
Mapping the market: primary, secondary, and minor Trends
| Trend Type | Description |
|---|---|
| Primary Trend | The overall market direction for the day. Sets the bias (bullish/bearish/sideways). |
| Secondary Trend | Secondary Trend Intraday pullbacks or rallies within the primary trend. |
| Minor Trend | Very short-term moves; used for precise entries and exits. |
Time frames: direction, behaviour, and entry
Intraday traders enter and exit trades within the same session. They aim to profit from small price fluctuations, so time frame selection is crucial.
- Direction Time Frame: Use the 1-hour chart to determine the primary trend.
- Behaviour Time Frame: Use the 15-minute chart to assess price patterns, momentum, and potential reversals.
- Entry Time Frame: Use the 5-minute chart to identify exact entry and exit levels.
Example Setup:
If the 1-hour chart shows an uptrend, the 15-minute chart confirms bullish momentum, and the 5-minute chart breaks out, that’s a high-probability long trade.
Example- 1
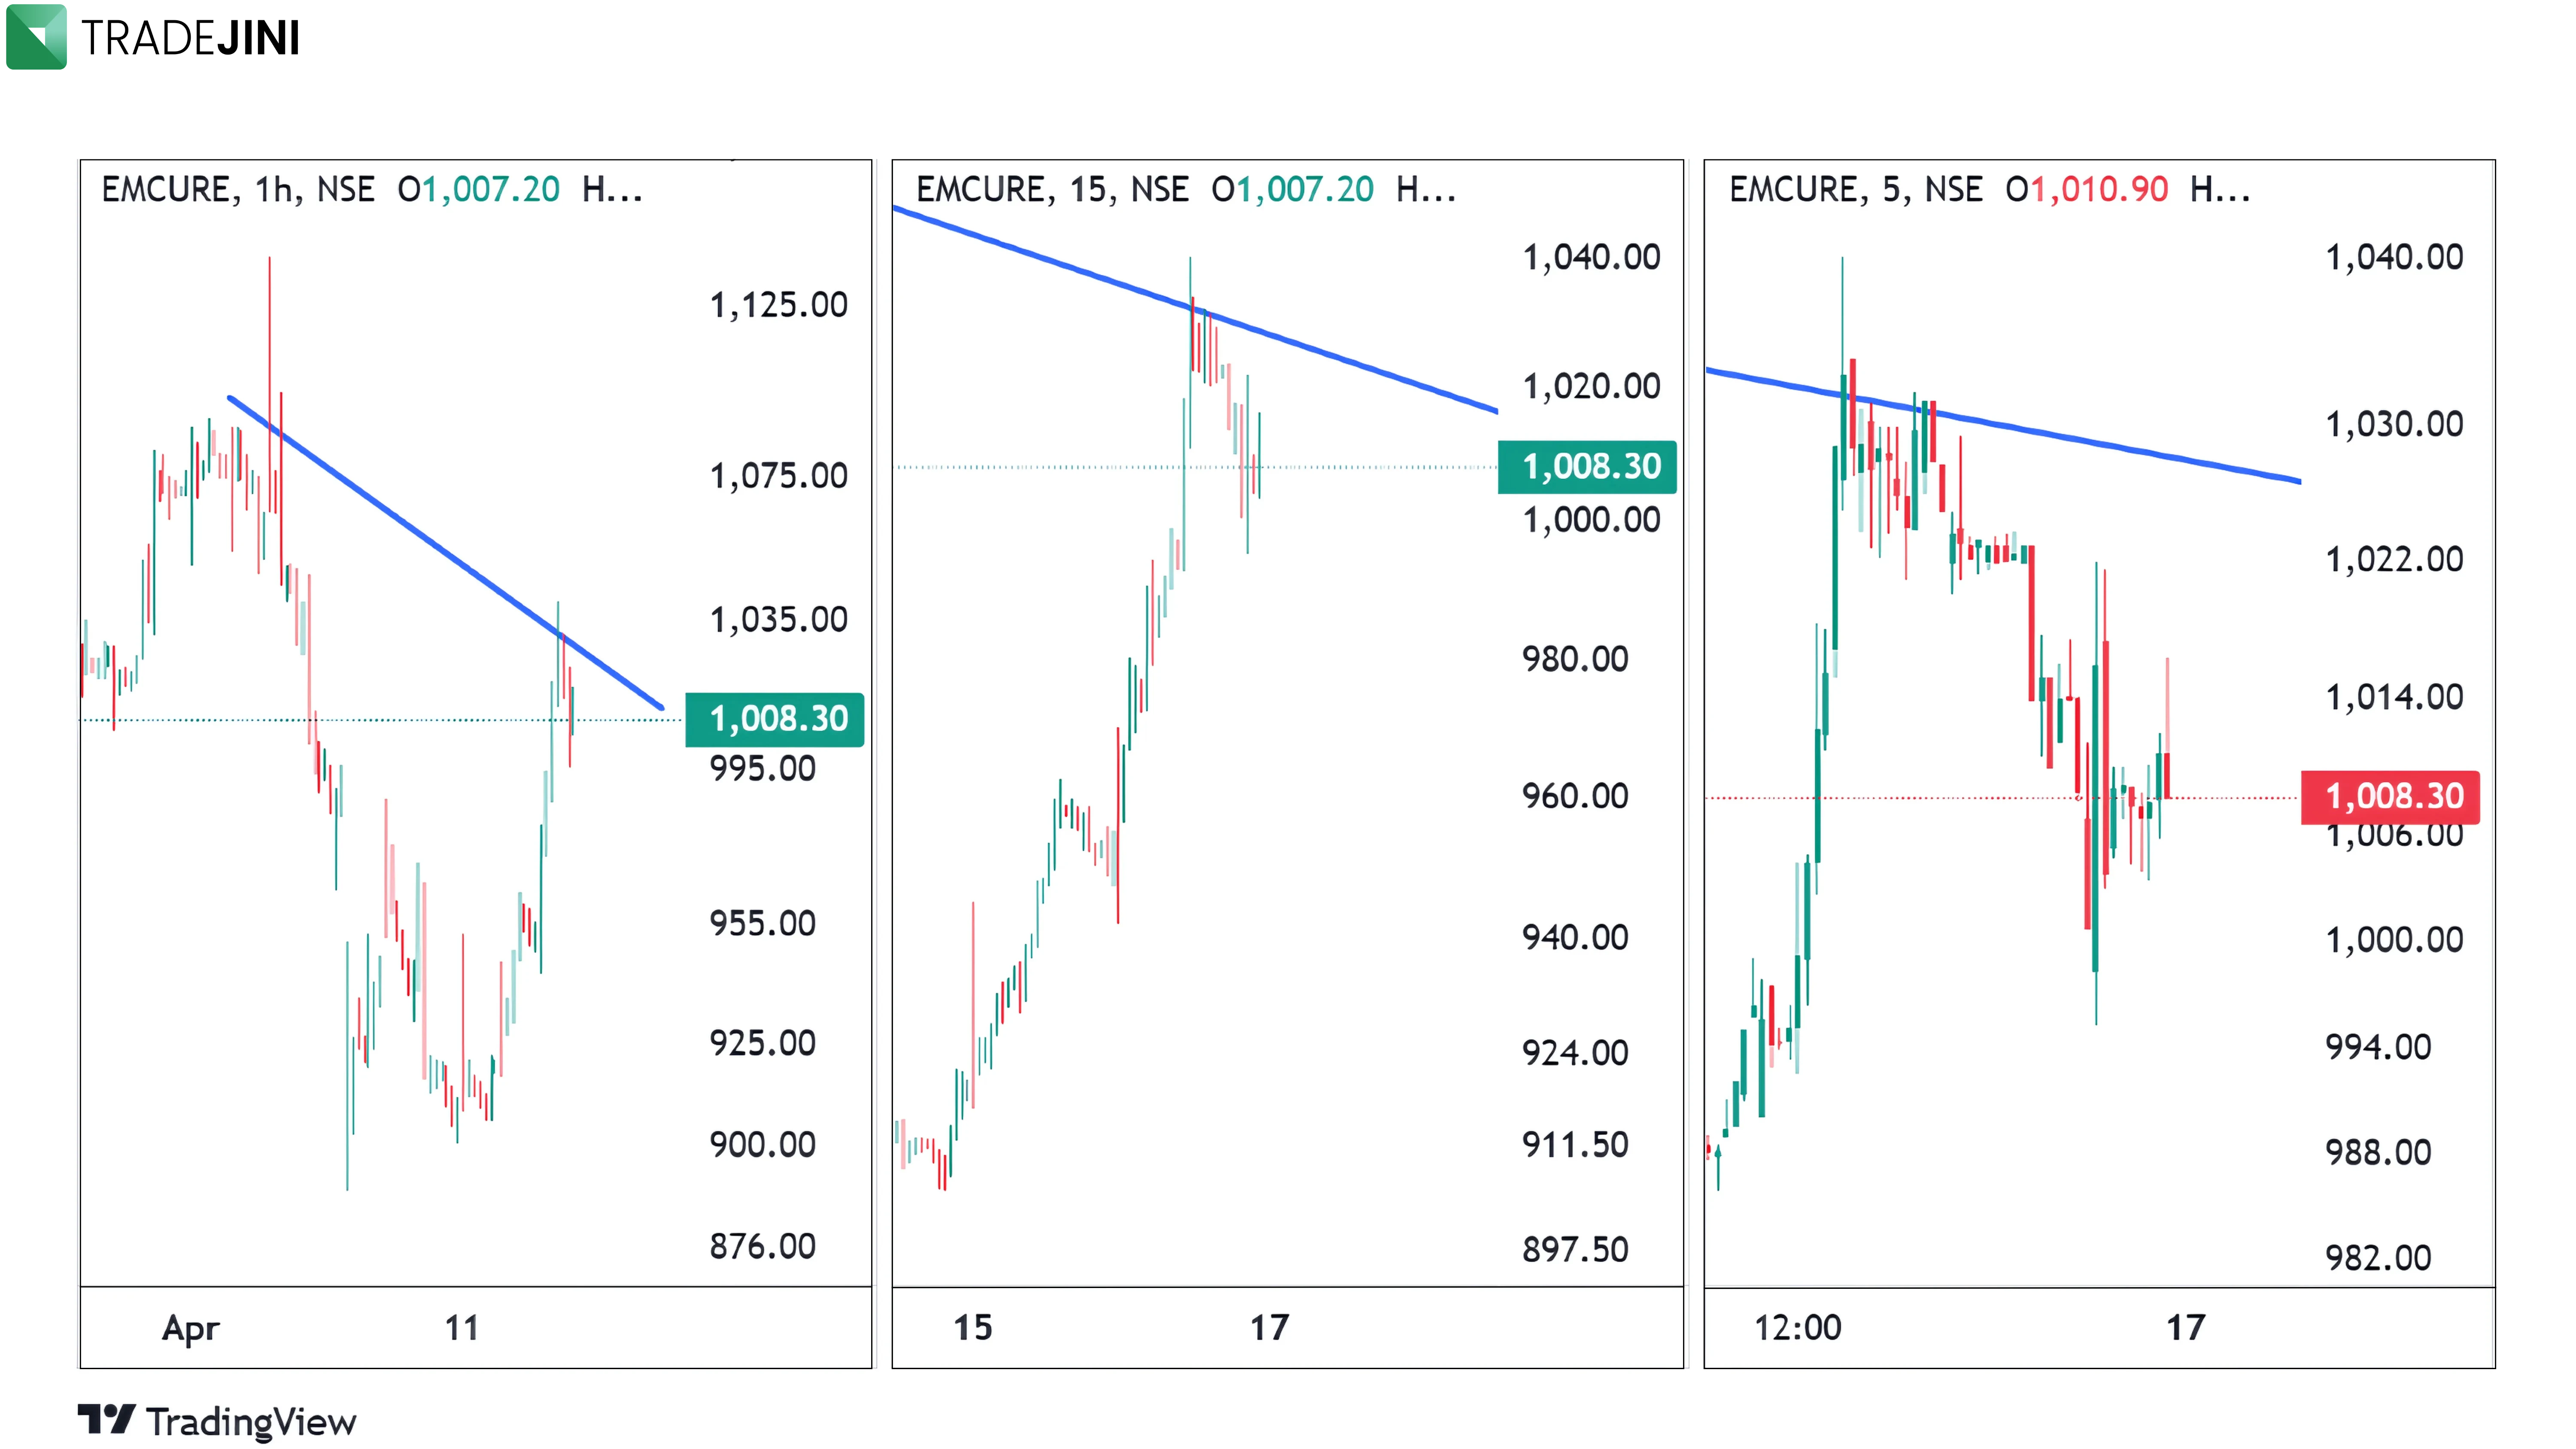
On the 1-hour chart of Emcure, the trend was down, and a trendline was drawn to mark this direction. When switching to the 15-minute and 5-minute time frames, the same trendline was visible on the side-by-side screens. However, the trendline was never broken in any of the time frames. This indicates that no entry signal was triggered, as the trendline consistently acted as strong resistance across all time frames. But on the 5-minute time frame, one can think of entering a sell trade (refer to image 2).
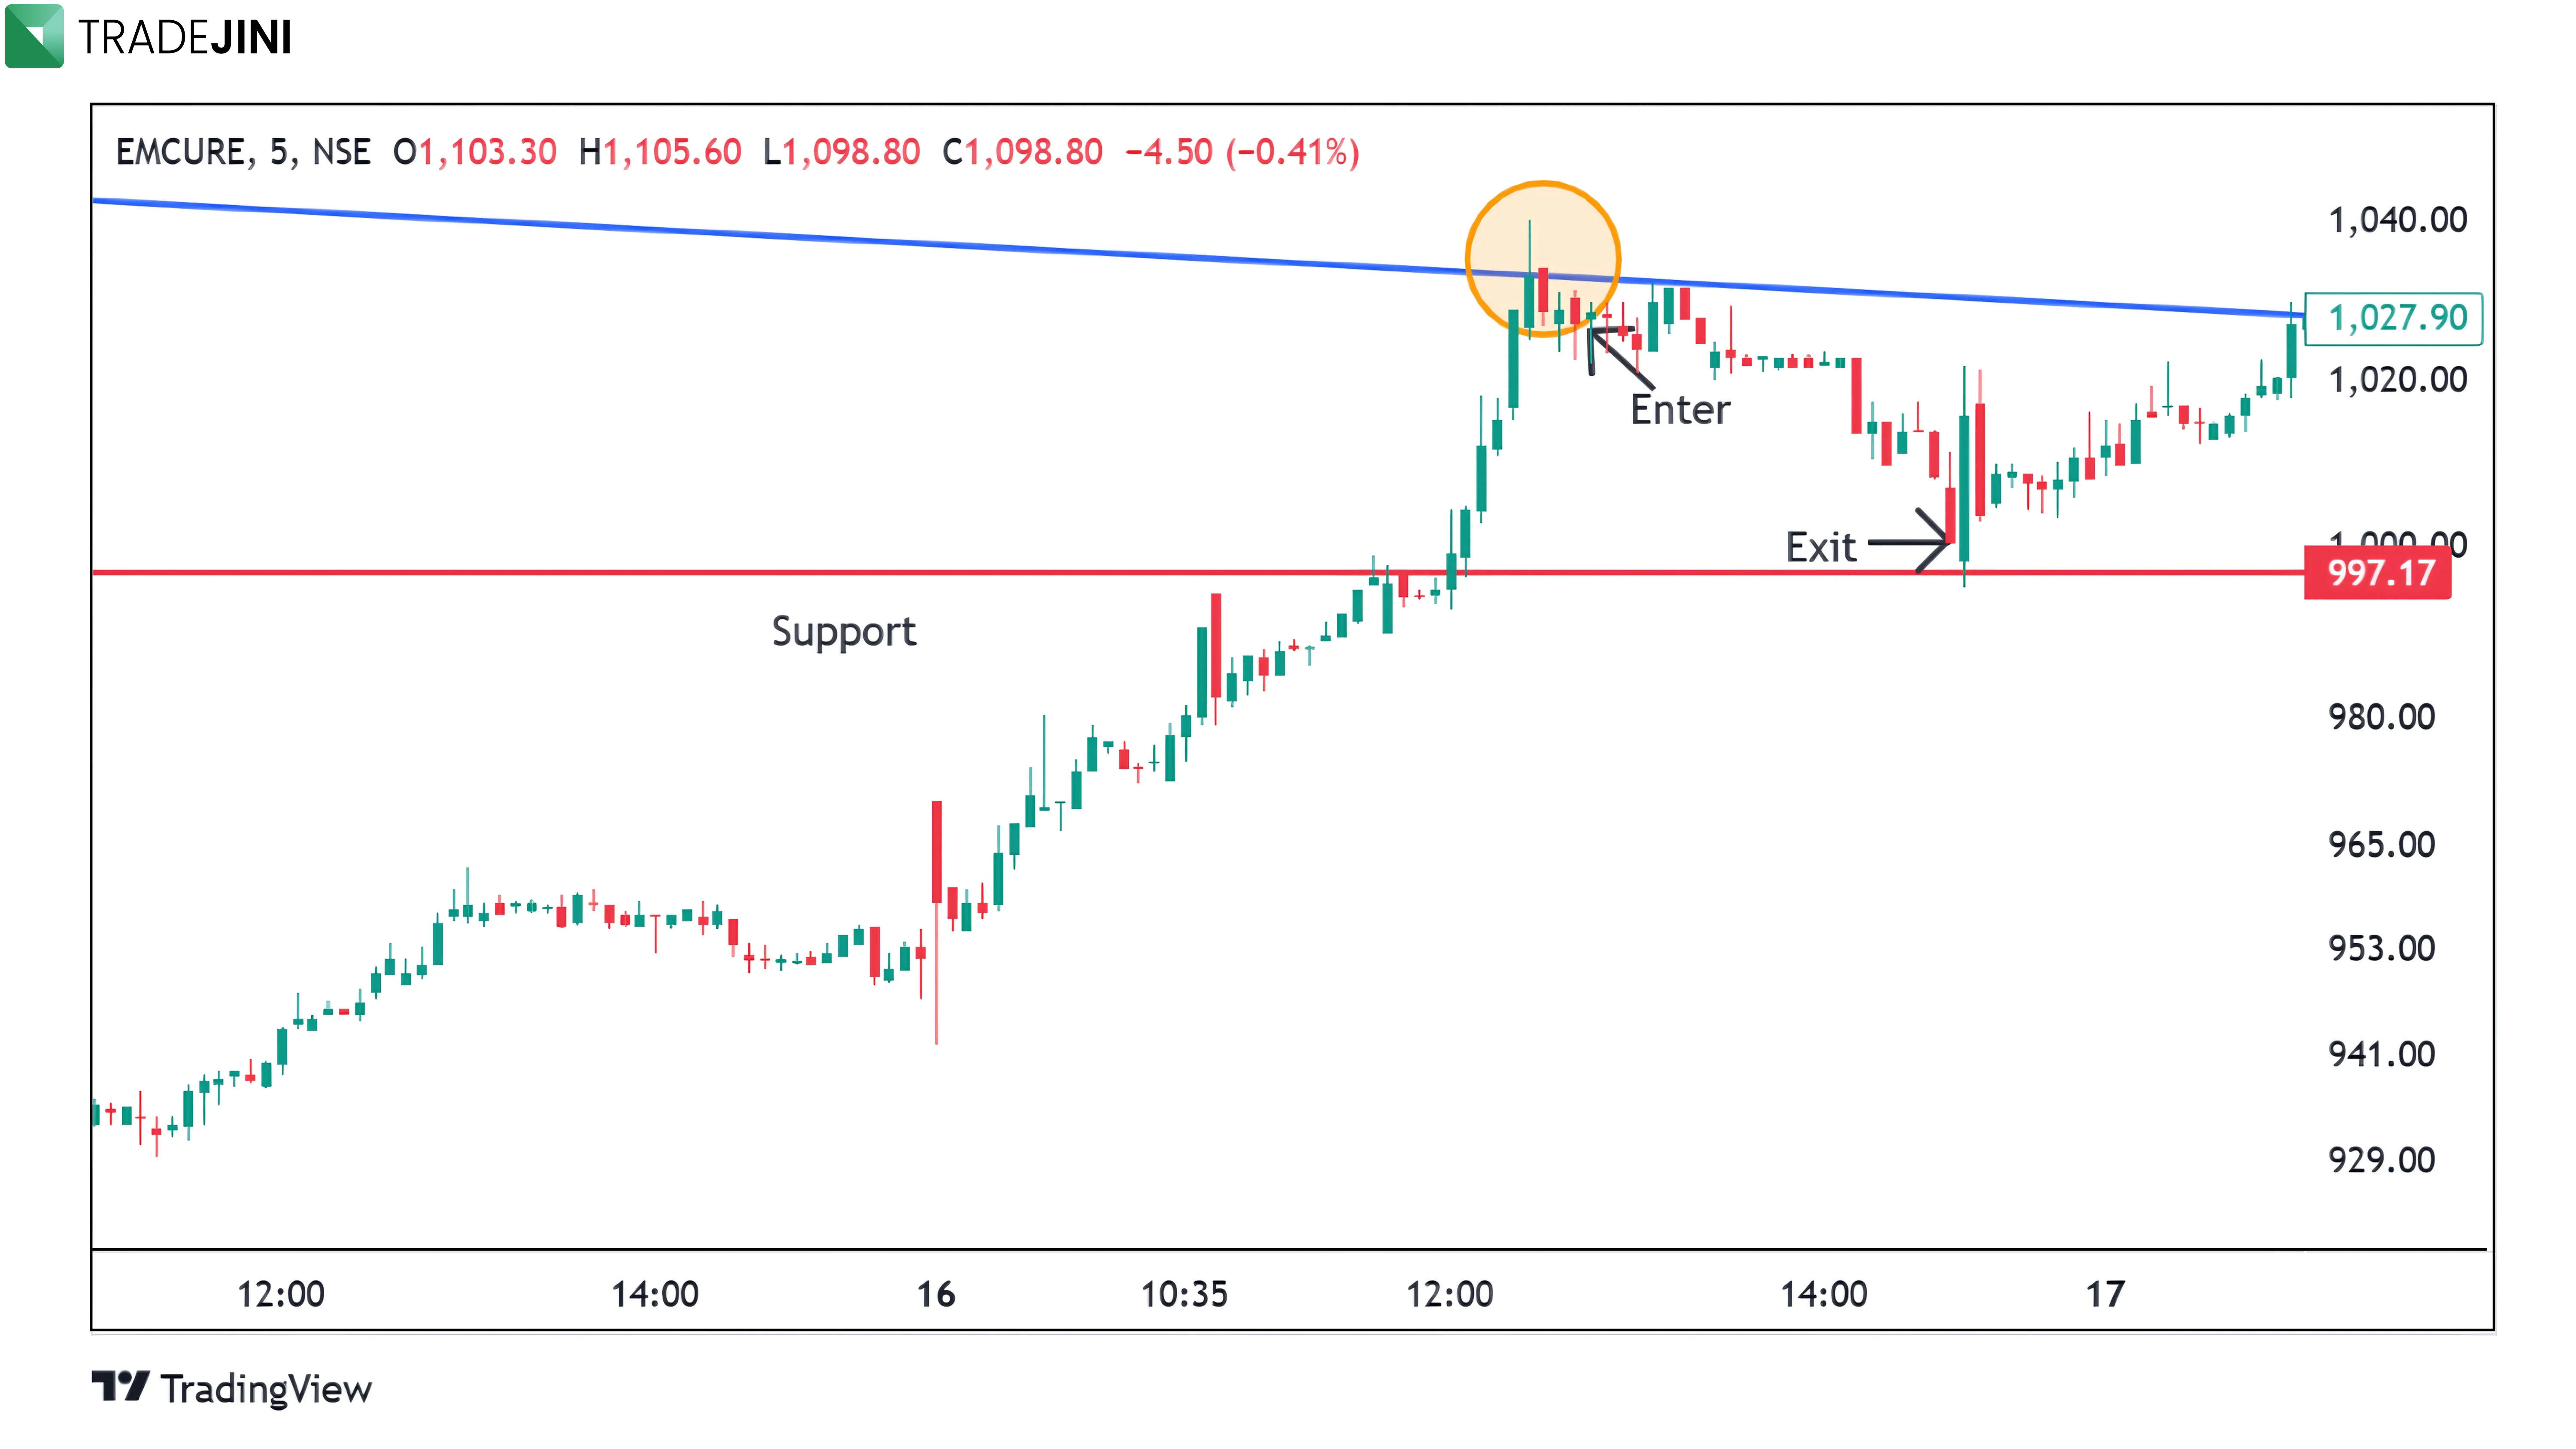
When resistance is observed across multiple time frames, a trader can consider entering a position based on price rejection at that level. In the case of EMCURE on 16th April 2025, the price faced rejection near a key resistance zone. A potential entry could be taken at the low of the rejection candle, which was ₹1025, with a target at the previously identified support zone around ₹997. The stop loss should be placed just above the resistance, ideally above the closing of the rejection candle, to manage risk effectively.
Example -2
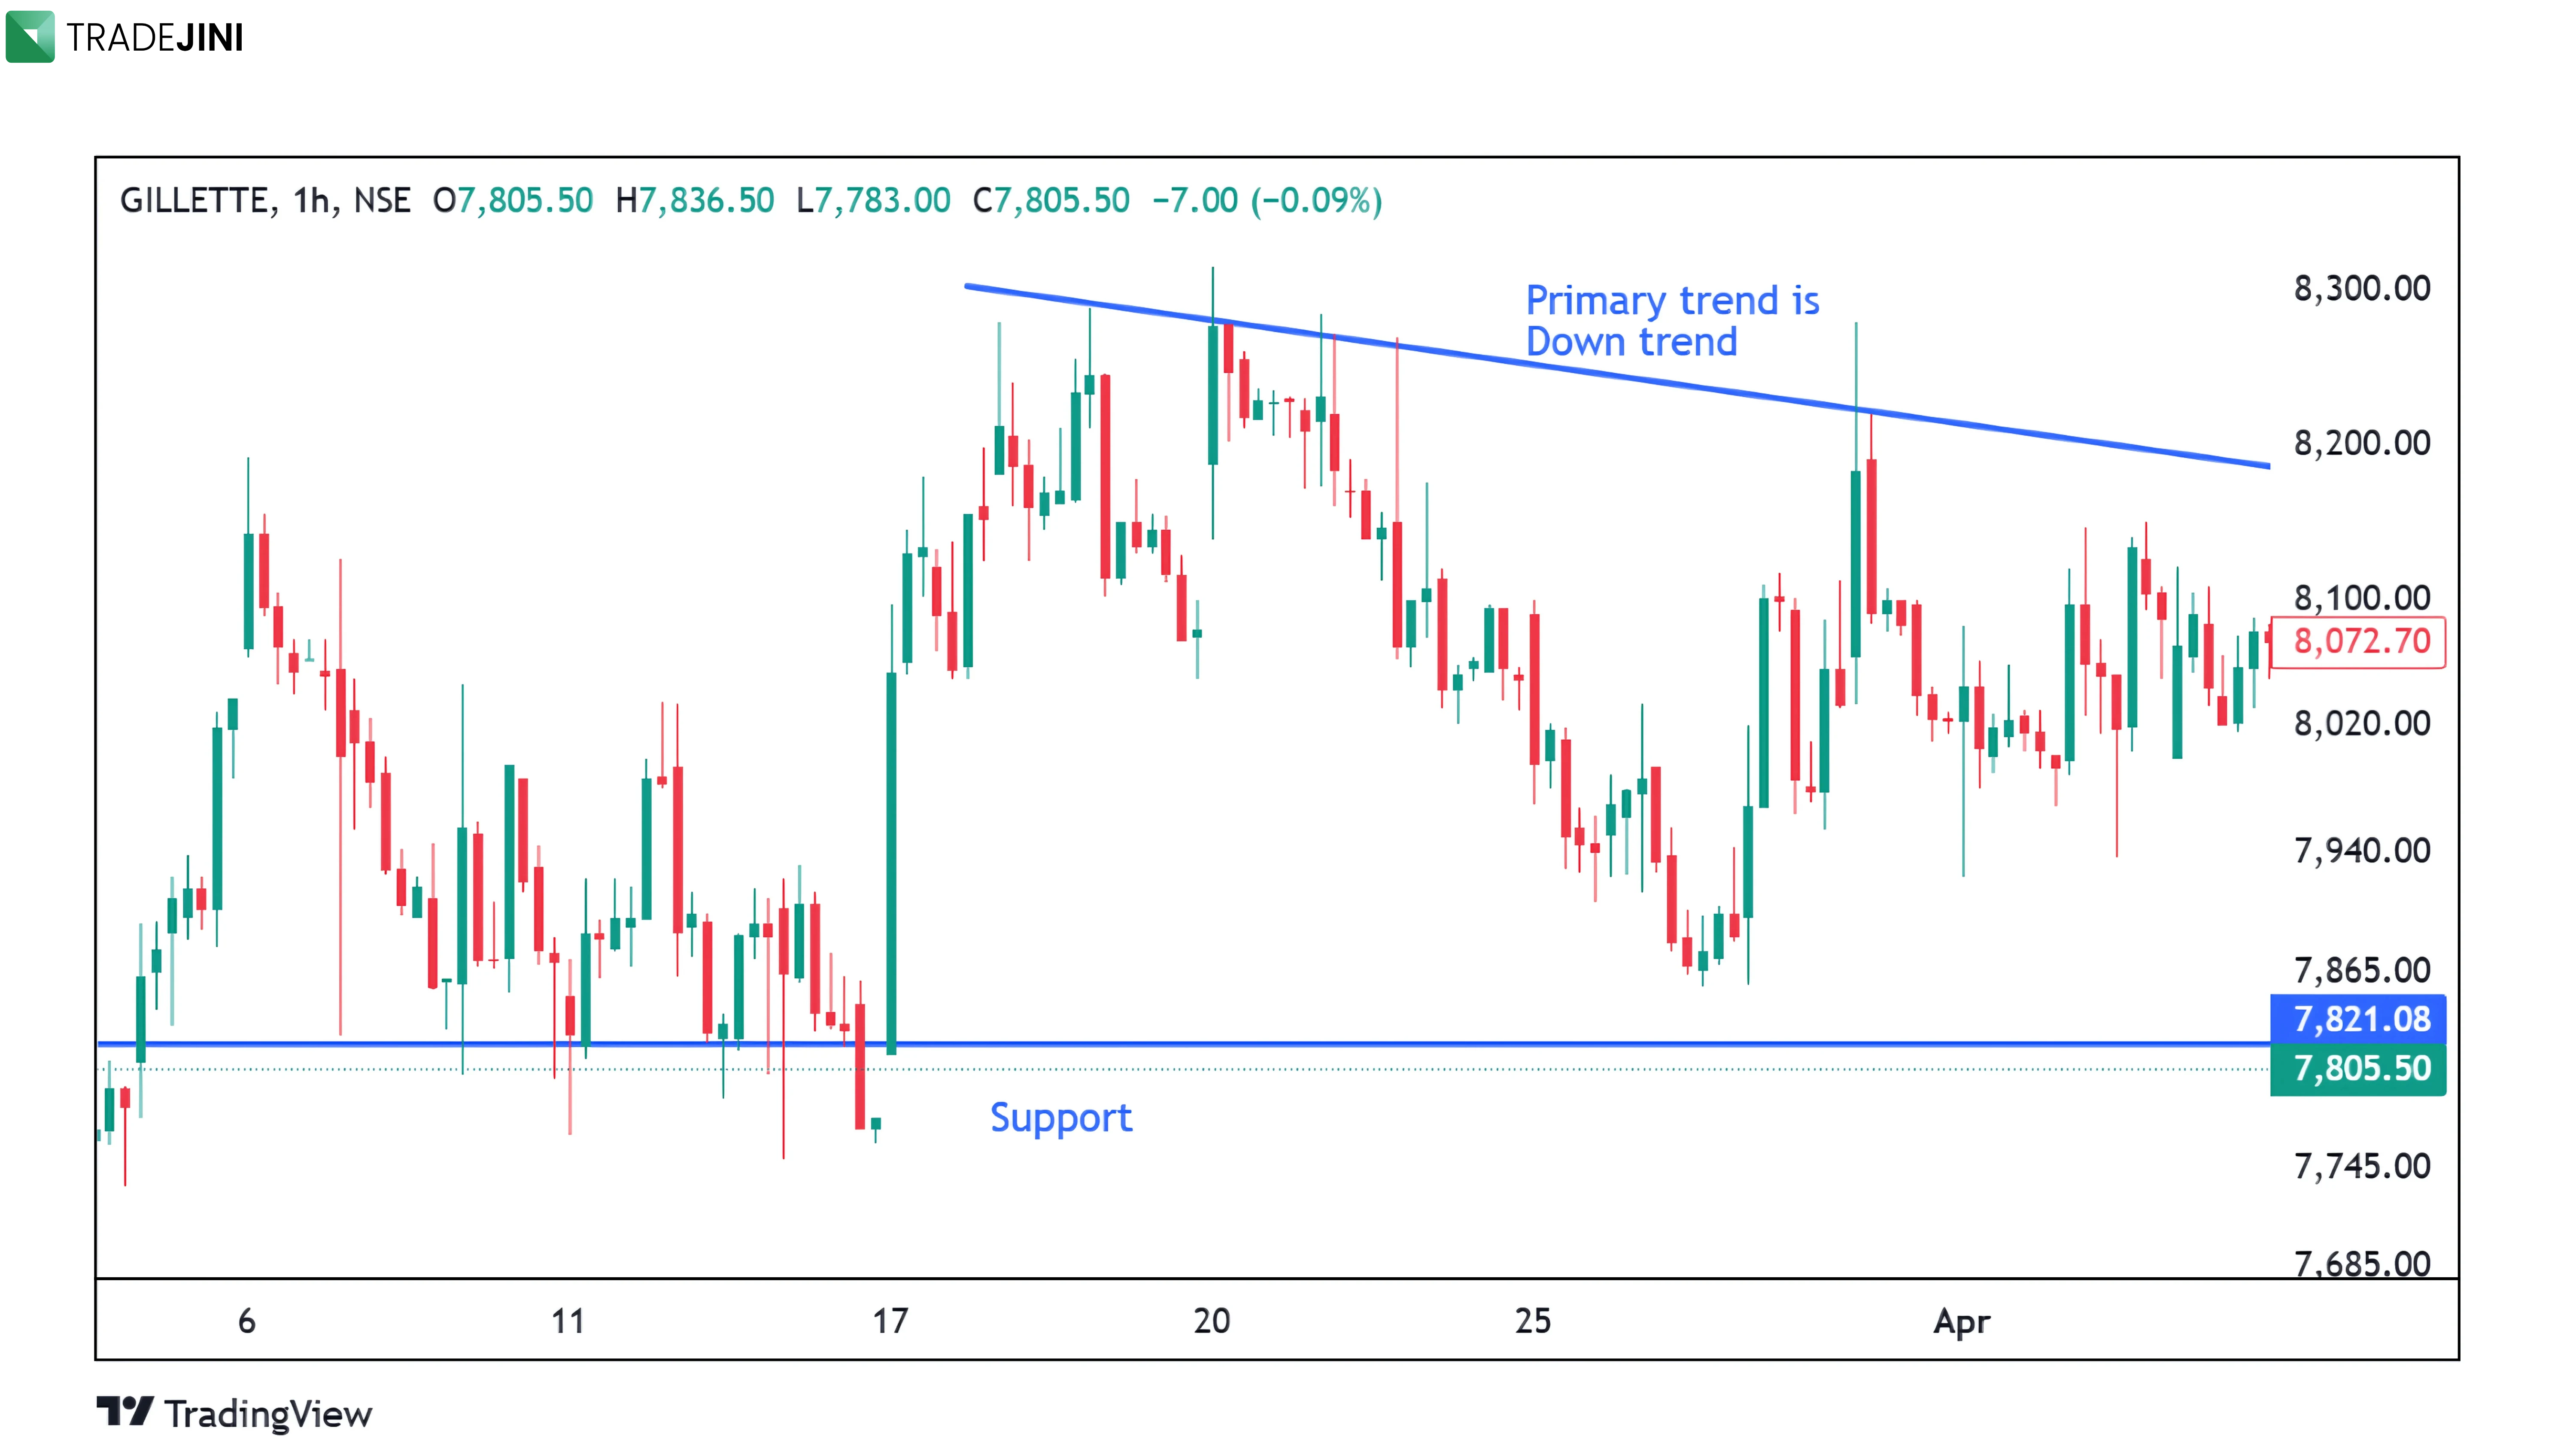
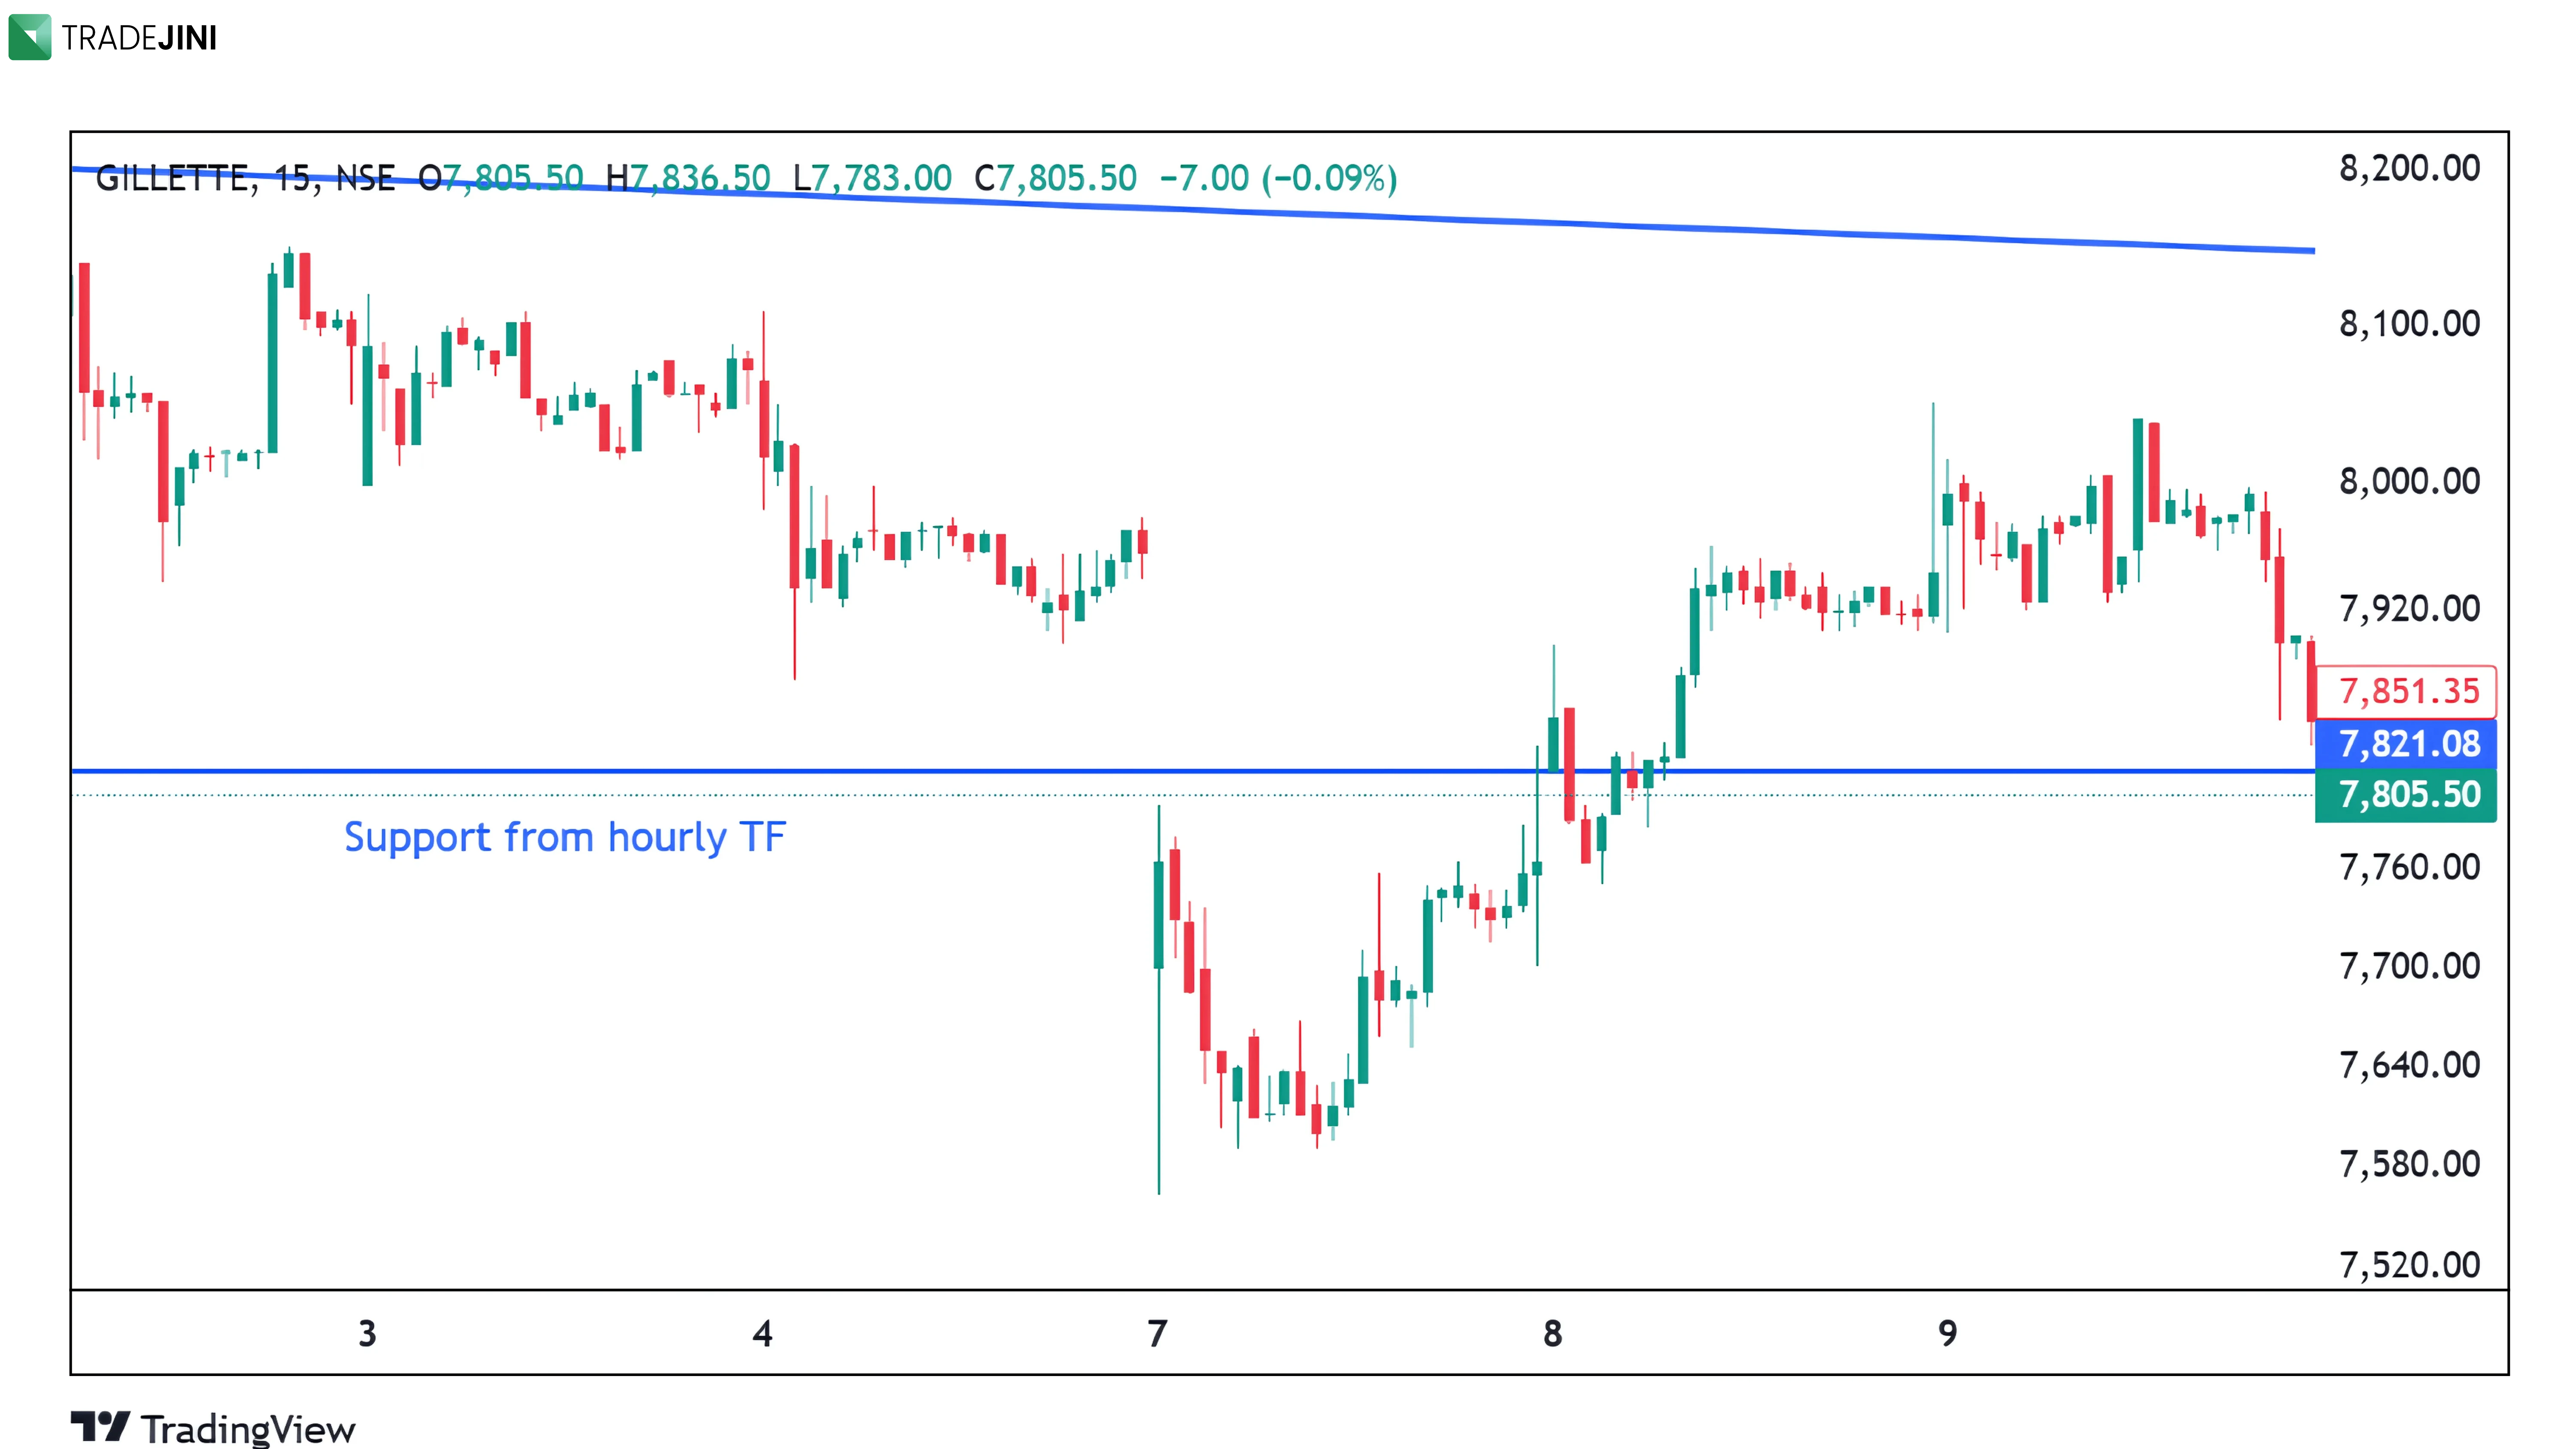
On the Gilette stock's hourly chart, the primary trend was a downtrend, with support at ₹7821 and a trendline on the upper band. The chart is dated till 3rd April 2025. To find the secondary trend, one needs to switch to the 15-minute time frame. For the next trading session, we can keep checking when we get an entry.
On the secondary trend, the stock broke its hourly support with a gap-down move. In such instances, there is often an underlying news trigger, which may not be immediately visible. It is generally advisable to avoid entering trades in these scenarios due to increased uncertainty and risk.
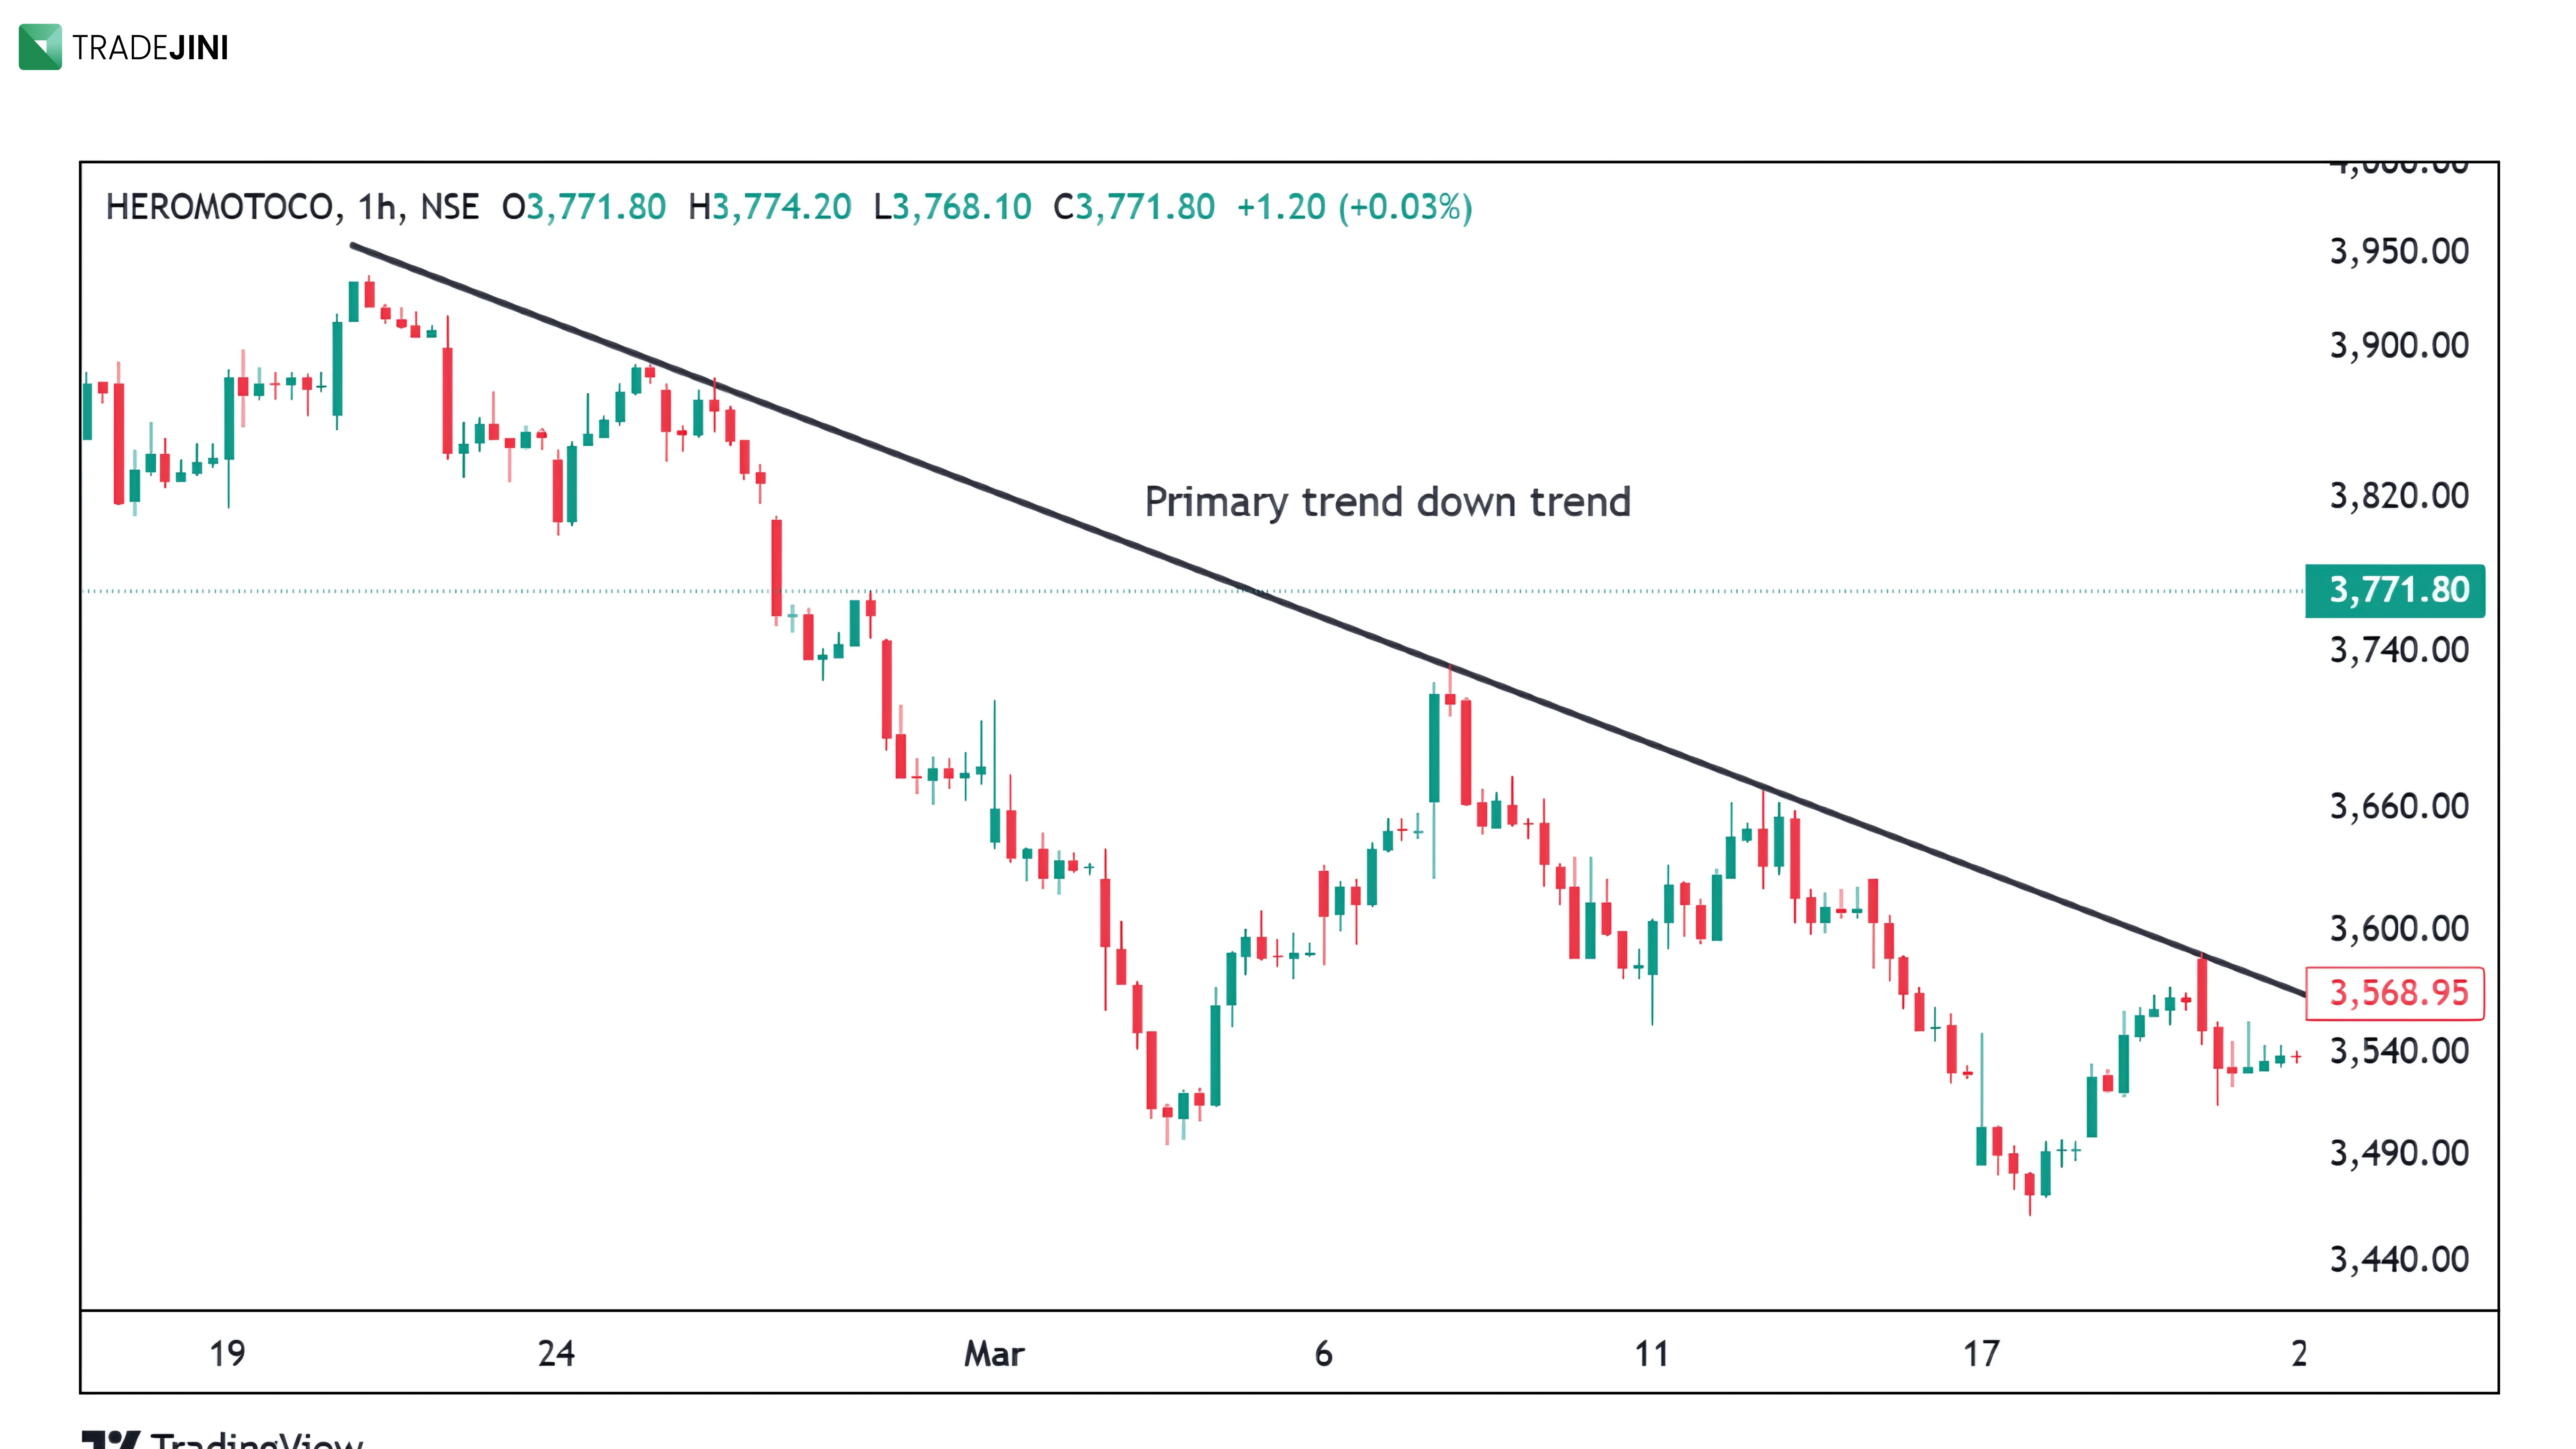
Example 3 – HEROMOTOCO
The primary trend of Hero MotoCorp (HEROMOTOCO) from 20th February 2025 to 18th March 2025 indicates a downtrend. For a potential entry, it is now important to observe the 15-minute time frame for signs of rejection or breakout and use the 5-minute time frame to time the actual entry. This will be analyzed in the charts provided below.
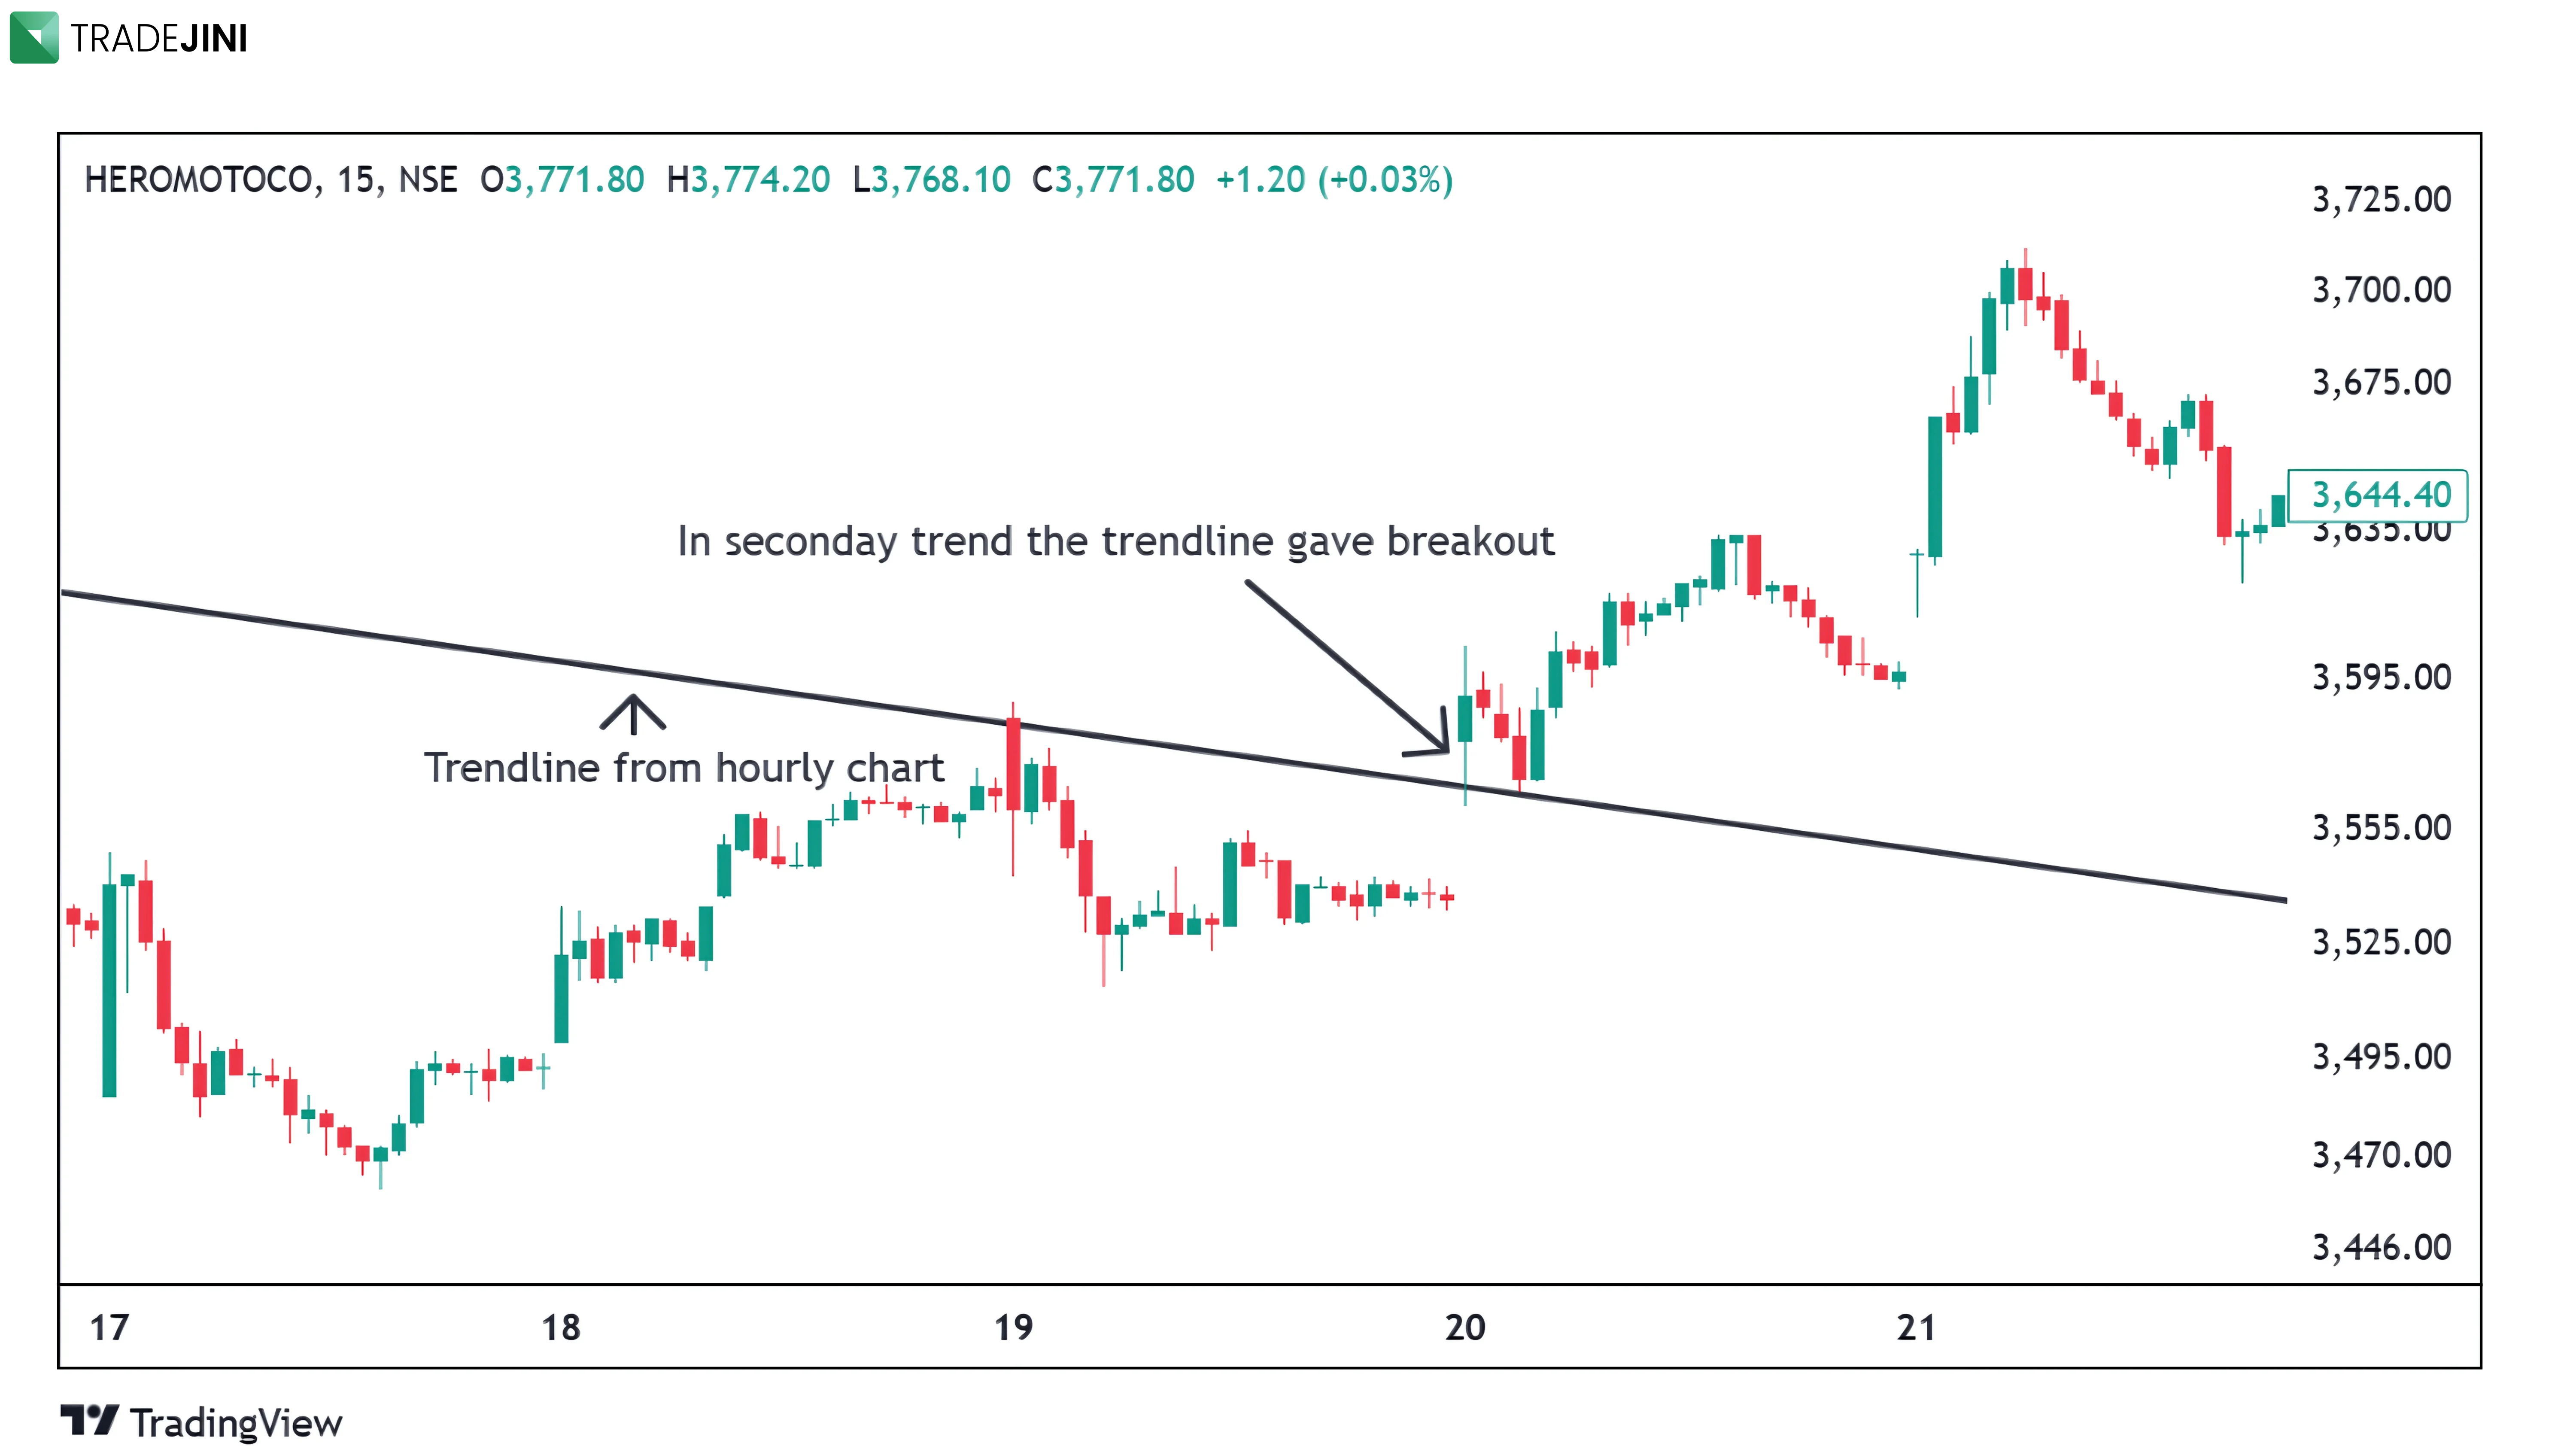
Shifting to the 15-minute time frame, a trendline breakout was observed on 20th March 2025. To identify a precise entry and exit, one should now shift to the 5-minute time frame for better trade execution.
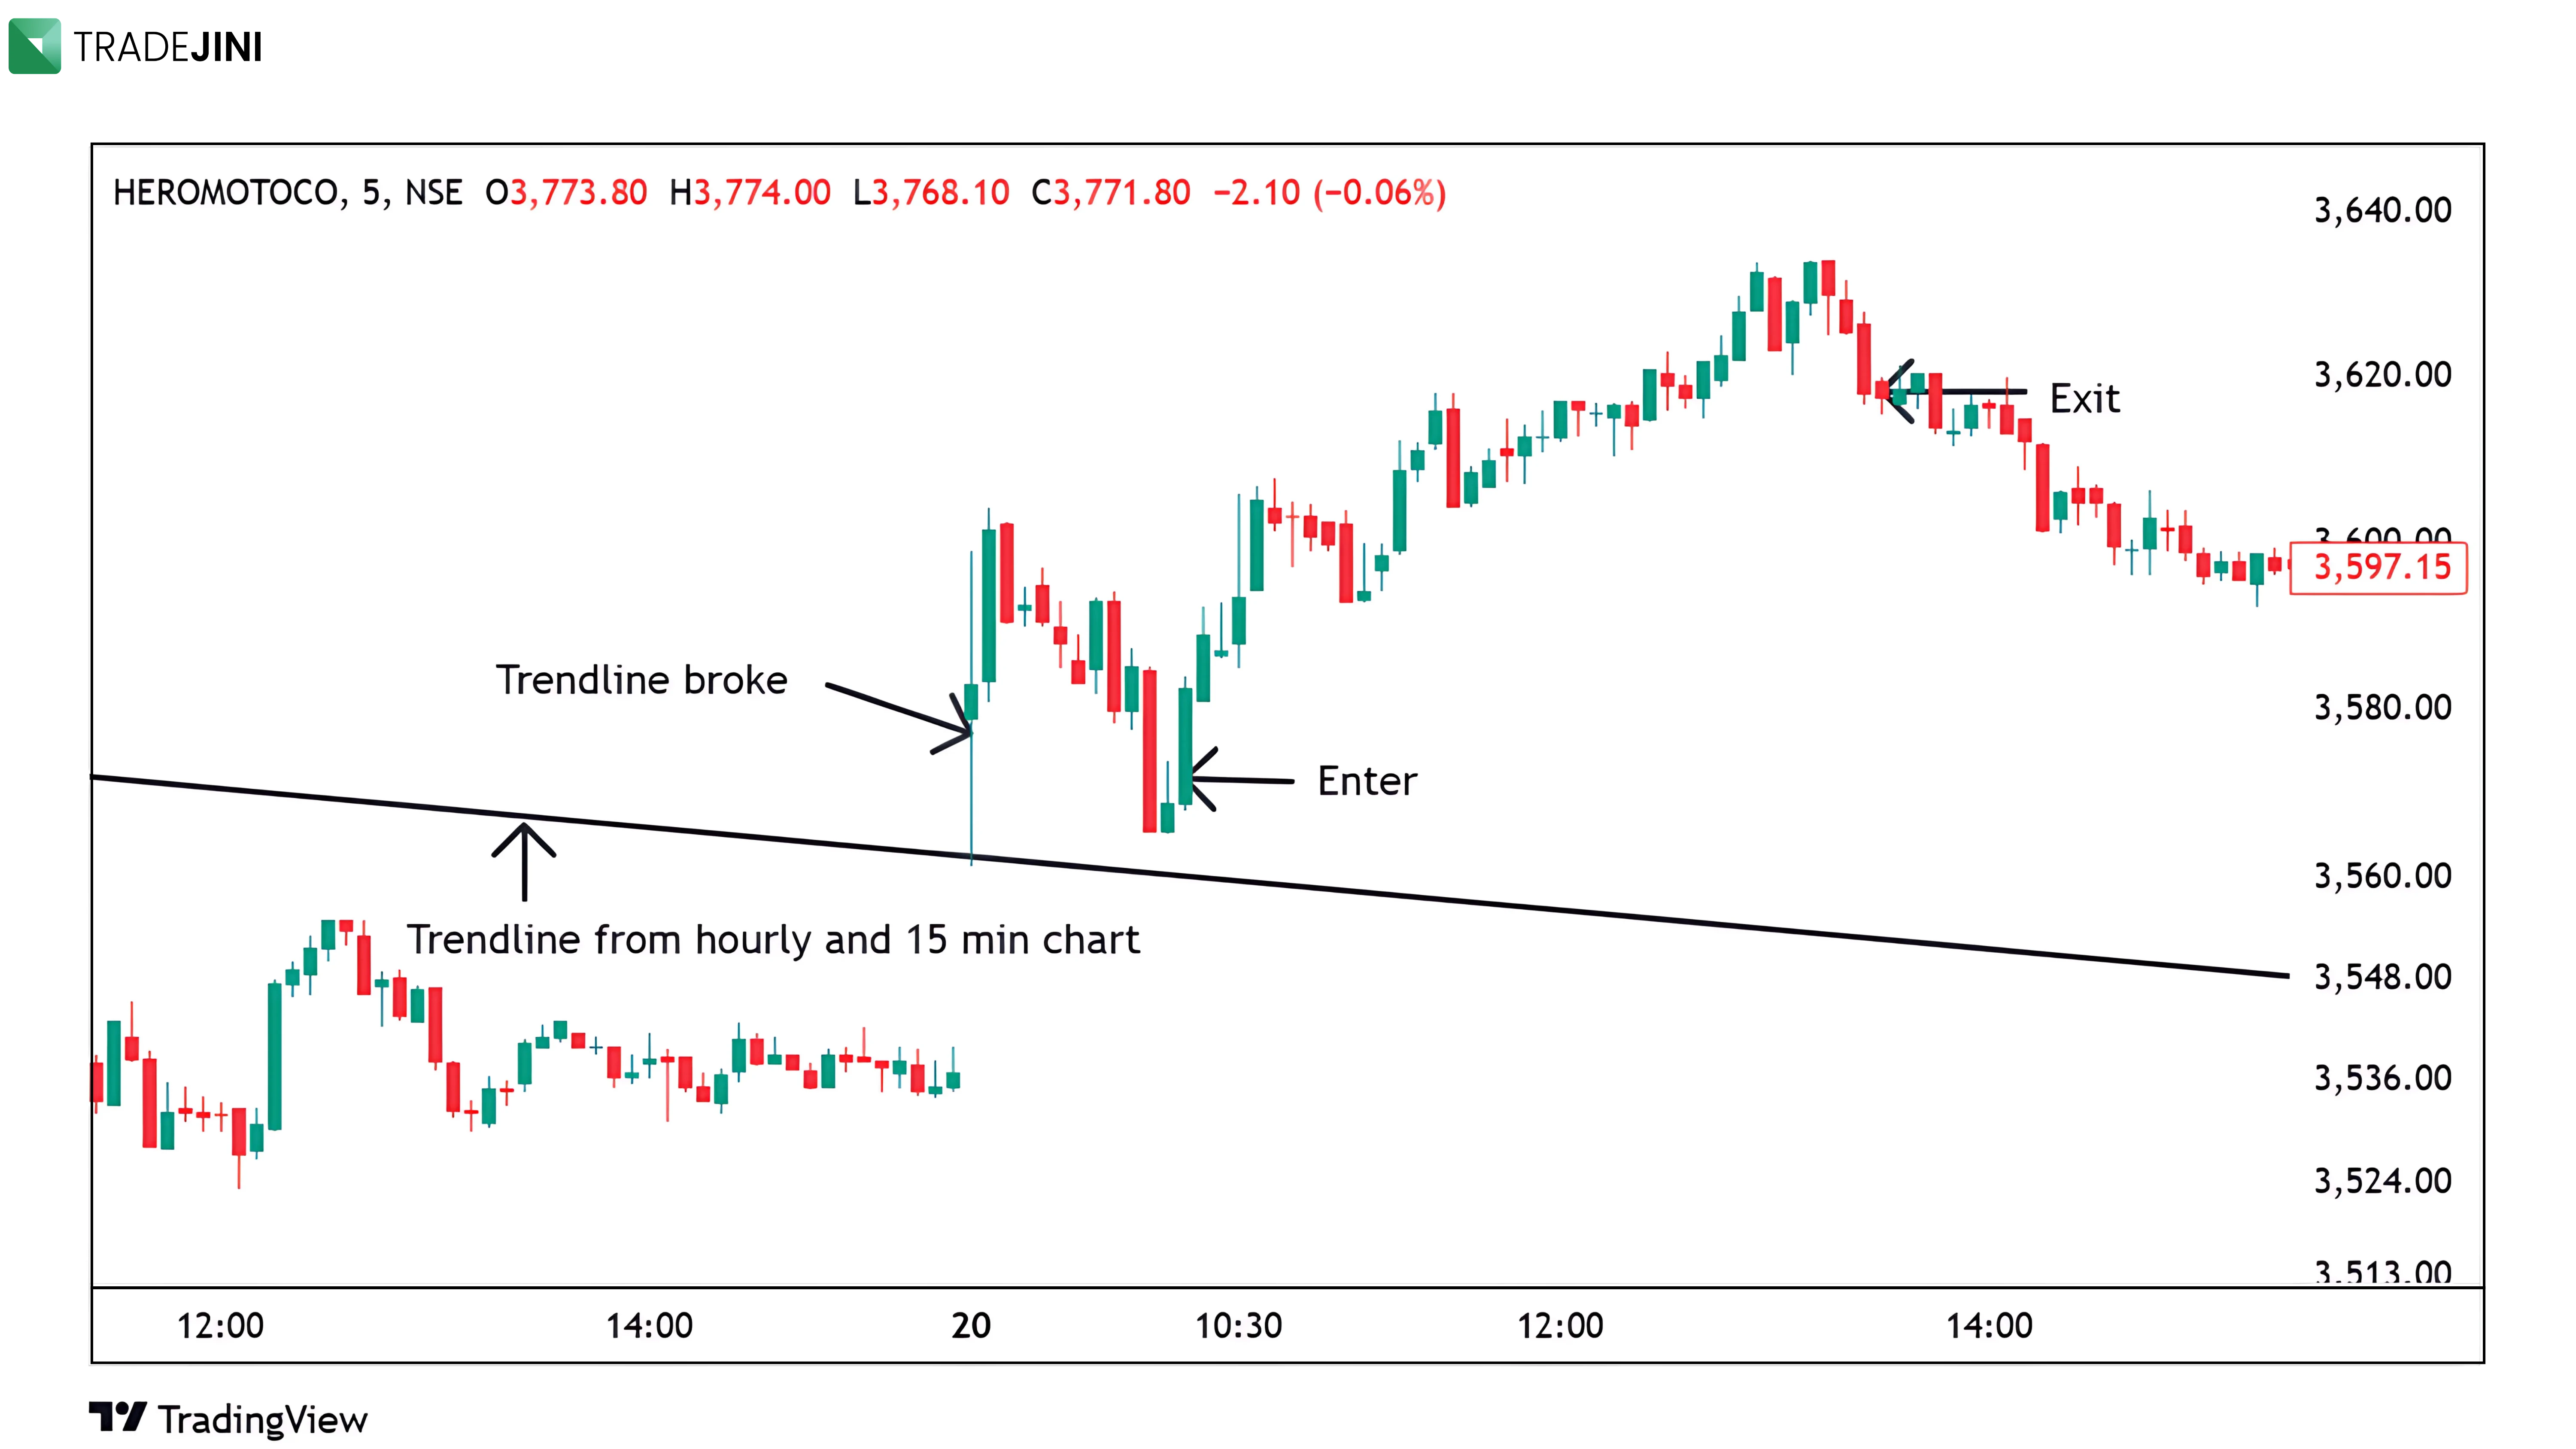
On the 5-minute time frame (refer to the image below), Hero MotoCorp showed a clear breakout on 20th March 2025. The first candle lacked confirmation for entry due to its large size, so the preferred approach was to wait for a price rejection near the trendline. An entry was triggered at ₹3567 after the rejection, and an exit was taken at ₹3619 following the formation of three consecutive red candles (Three Black Crows), with a stop-loss maintained just below the trendline.
Practical Applications for Different Types of Traders
- Positional Traders: Use the monthly chart as the primary trend and add to positions during dips identified on the weekly chart.
- Swing Traders: For swing traders, the primary trend is often the weekly chart, and corrections can be identified on the daily chart.
- Day Traders: For intraday traders, the hourly or 15-minute charts act as the primary trend, with smaller time frames used for identifying entry and exit points.
Let the Higher Time Frame Guide You
The most crucial takeaway from multiple time frame analysis is that traps in the market can be avoided by respecting higher time frame trends.
When the primary trend is bullish, avoid shorting even if lower time frames flash bearish signals.
When the primary trend is bearish, avoid going long even if minor time frames show strength.
This disciplined approach significantly reduces the chances of being trapped and improves overall trading success.


