


As an options trader, how often have you looked back at a missed opportunity and thought, 'What if I had taken that trade?' or 'If only I could see how my strategy would have held up during last week’s volatility.' This constant loop of 'what-ifs' is a natural part of trading, but it often lacks concrete, data-driven answers. Until now!
What if you could step into a trading time machine, deploy any strategy on any historical market day, and watch it play out, tick by tick, without risking a single rupee of your capital?
This is precisely the power that the NXTOption Simulator on Tradejini puts at your fingertips. It’s not just a paper trading platform; it’s a sophisticated backtesting environment designed to transform your theoretical strategies into battle-tested trading plans. Let’s walk through how you can leverage this powerful tool to refine your approach and trade with unparalleled confidence.
What is the NXTOption Simulator?
At its core, the NXTOption Simulator is a high-fidelity virtual trading environment that uses real historical options and underlying price data. It allows you to:
Comprehensive Options Backtesting Platform
Backtest Any Strategy
From straightforward call or put buying to complex multi-leg structures such as iron condors, butterflies, or calendar spreads, the platform allows you to design and test virtually any options strategy. Each leg can be customized with strike, expiry, direction (buy/sell), and quantity, giving both novice traders and professionals complete flexibility.
Leverage Real Historical Market Data
Simulations are powered by actual historical data from NSE indices and F&O stocks. By incorporating real price movements, volatility shifts, and liquidity conditions, the platform ensures your backtests reflect true market behavior rather than theoretical assumptions. This enables a more accurate assessment of strategy robustness.
Test at Any Point in Time
Go beyond end-of-day analysis by backtesting trades on a minute-by-minute basis. Whether you want to evaluate a strategy during intraday moves or test performance around key events—such as earnings announcements, RBI policy decisions, or the Union Budget—you can precisely simulate entry and exit at the exact date and time of your choice.
In-Depth Performance Analytics
Gain a comprehensive view of strategy performance with detailed metrics, including:
- Profit and Loss (P&L) projections across multiple market scenarios
- Breakeven levels and risk–reward ratios
- Option Greeks (Delta, Gamma, Theta, Vega, Rho) to evaluate sensitivity to market movements, volatility changes, and time decay
- Scenario and sensitivity analysis to stress-test strategies under varying conditions
This structured evaluation helps traders refine strategies, optimize risk management, and improve decision-making before deploying real capital.
Stepping into the Simulator: Your first backtest
Getting started is simple. Let’s recreate a trade from a past date to understand the workflow.
Step 1: navigate to the Simulator tab in the NXTOption menu
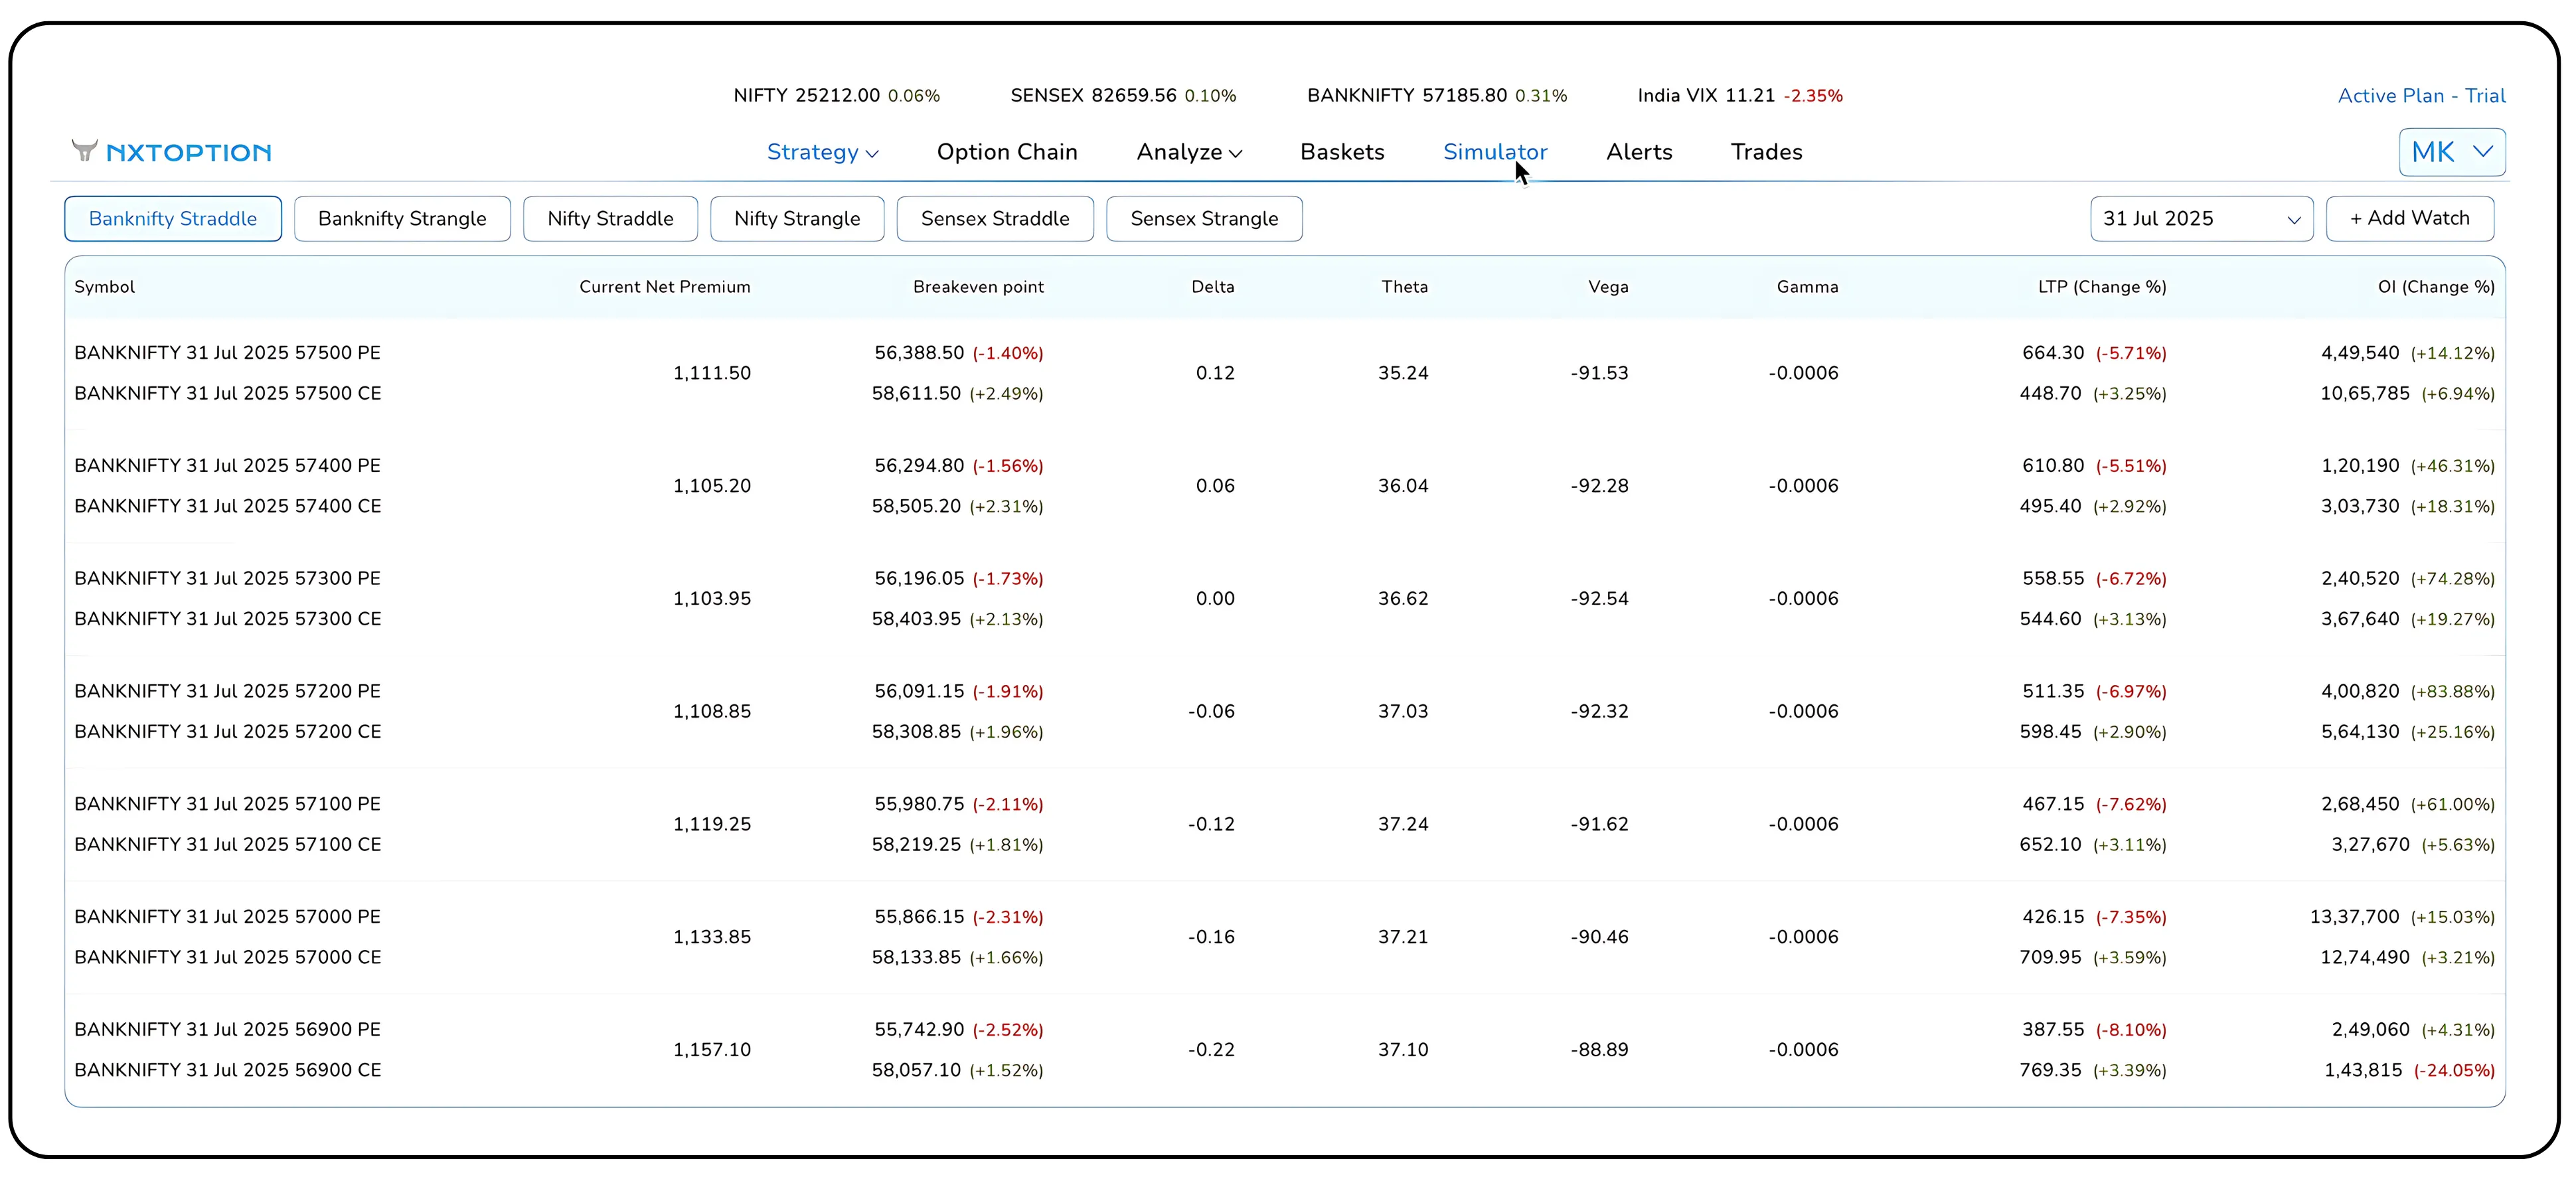
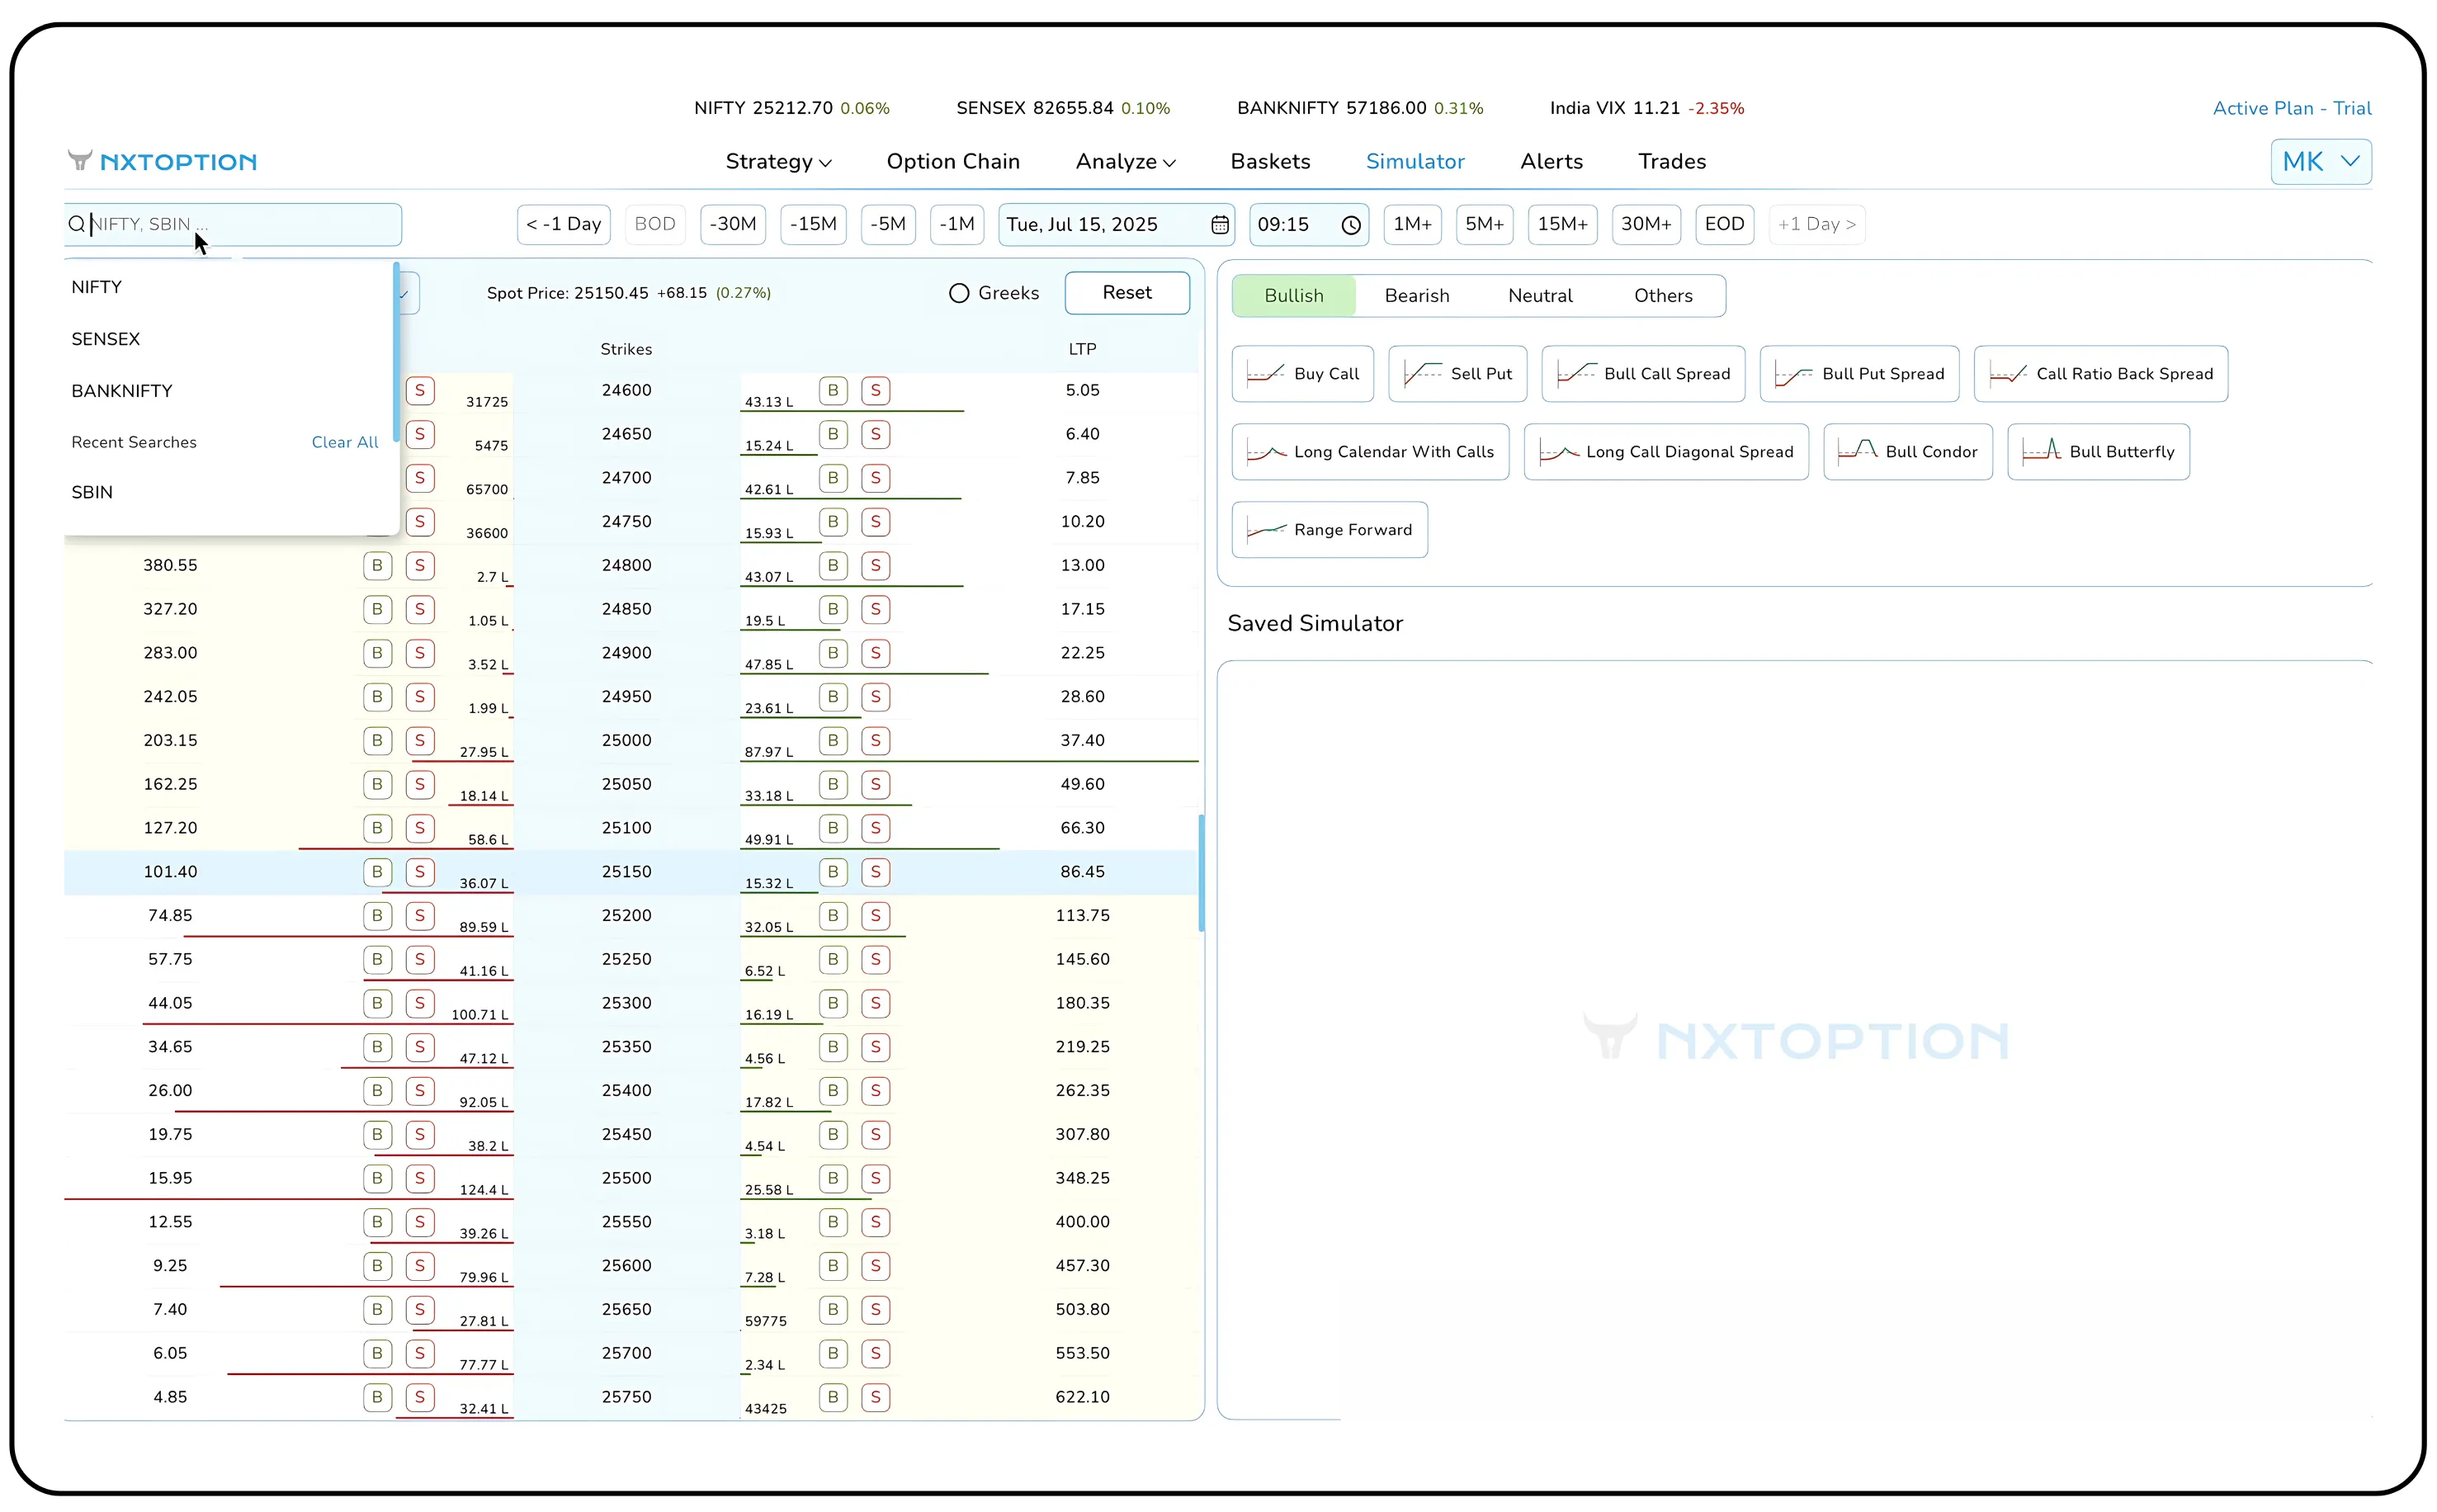
Here, you can select your instrument of choice, be it NIFTY, BANKNIFTY, or an individual stock like RELIANCE
Next, click on the date field. A calendar will appear, allowing you to travel back to any historical trading day. For this walkthrough, let's select April 2, 2024. Then, using the clock icon, you can set the exact entry time, for instance, 12:17 PM
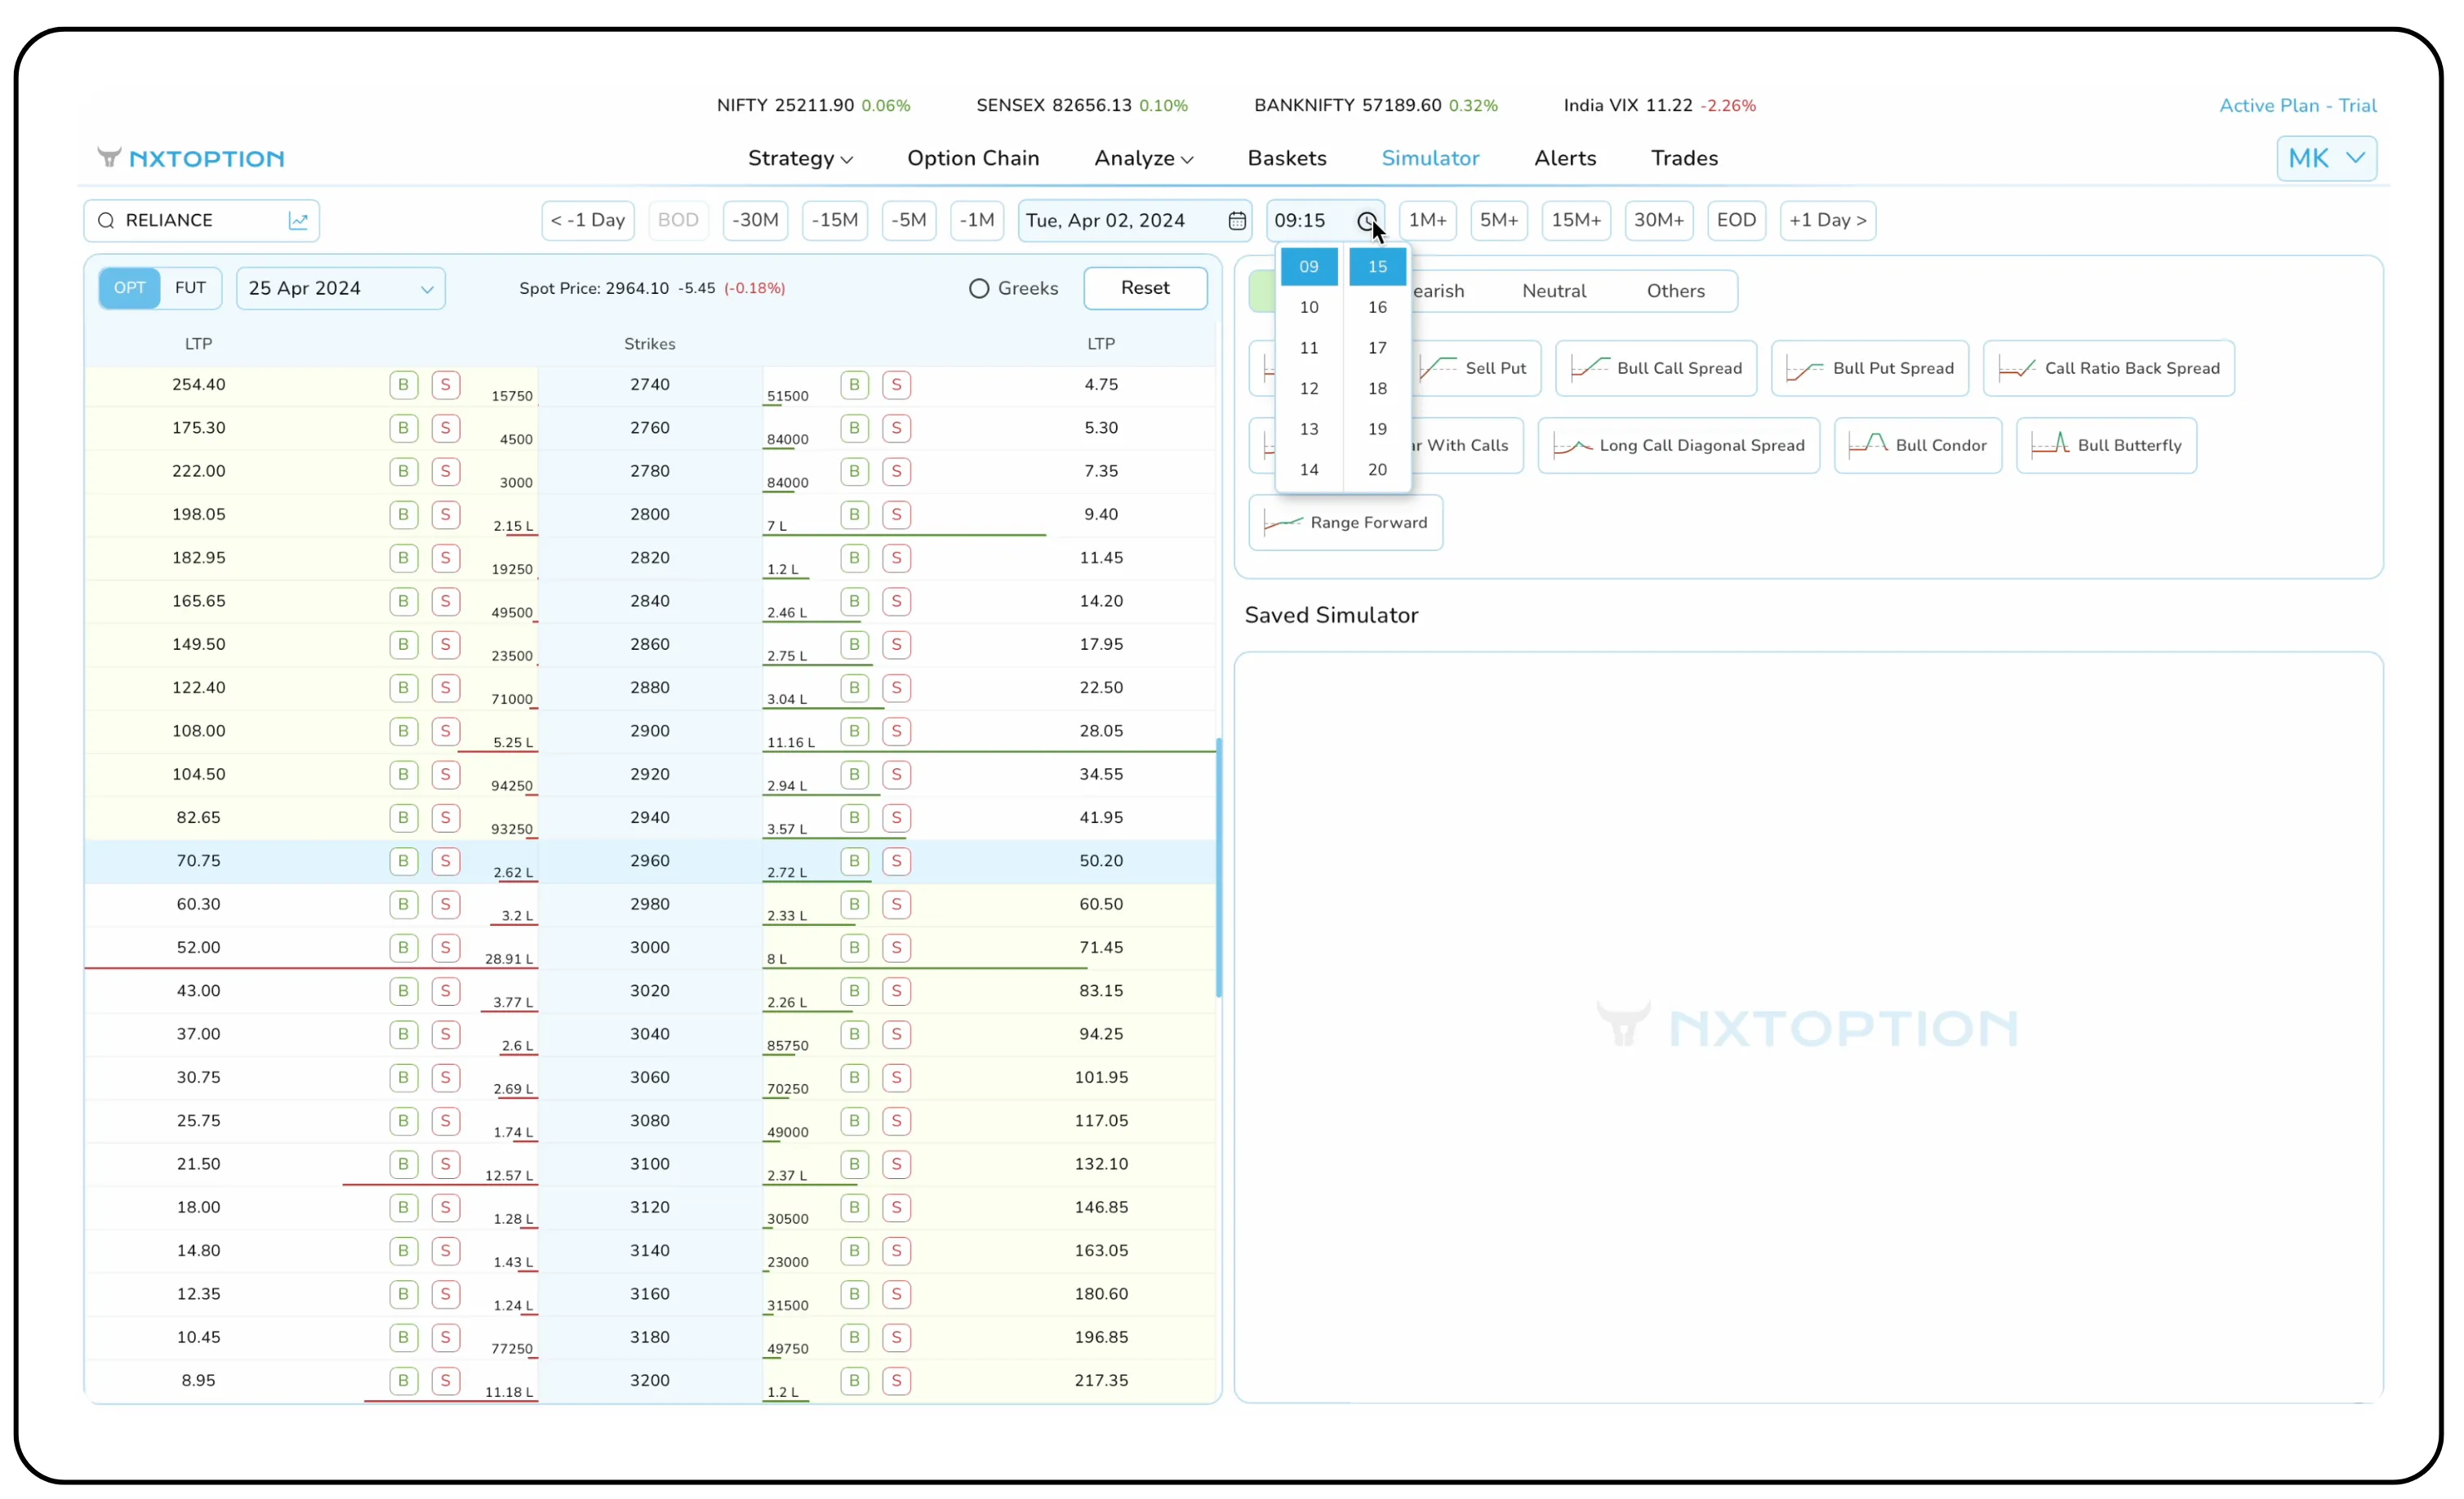
The platform instantly populates the option chain with the actual, precise premiums from that very moment. Here we have the feature to shift to futures and in Options, we can turn on and off the Greeks button.
Step 2: Deploy your strategy instantly
Instead of building legs manually, the simulator offers pre-built templates. Based on your market outlook (Bullish, Bearish, or Neutral), you can deploy complex strategies in a single click.
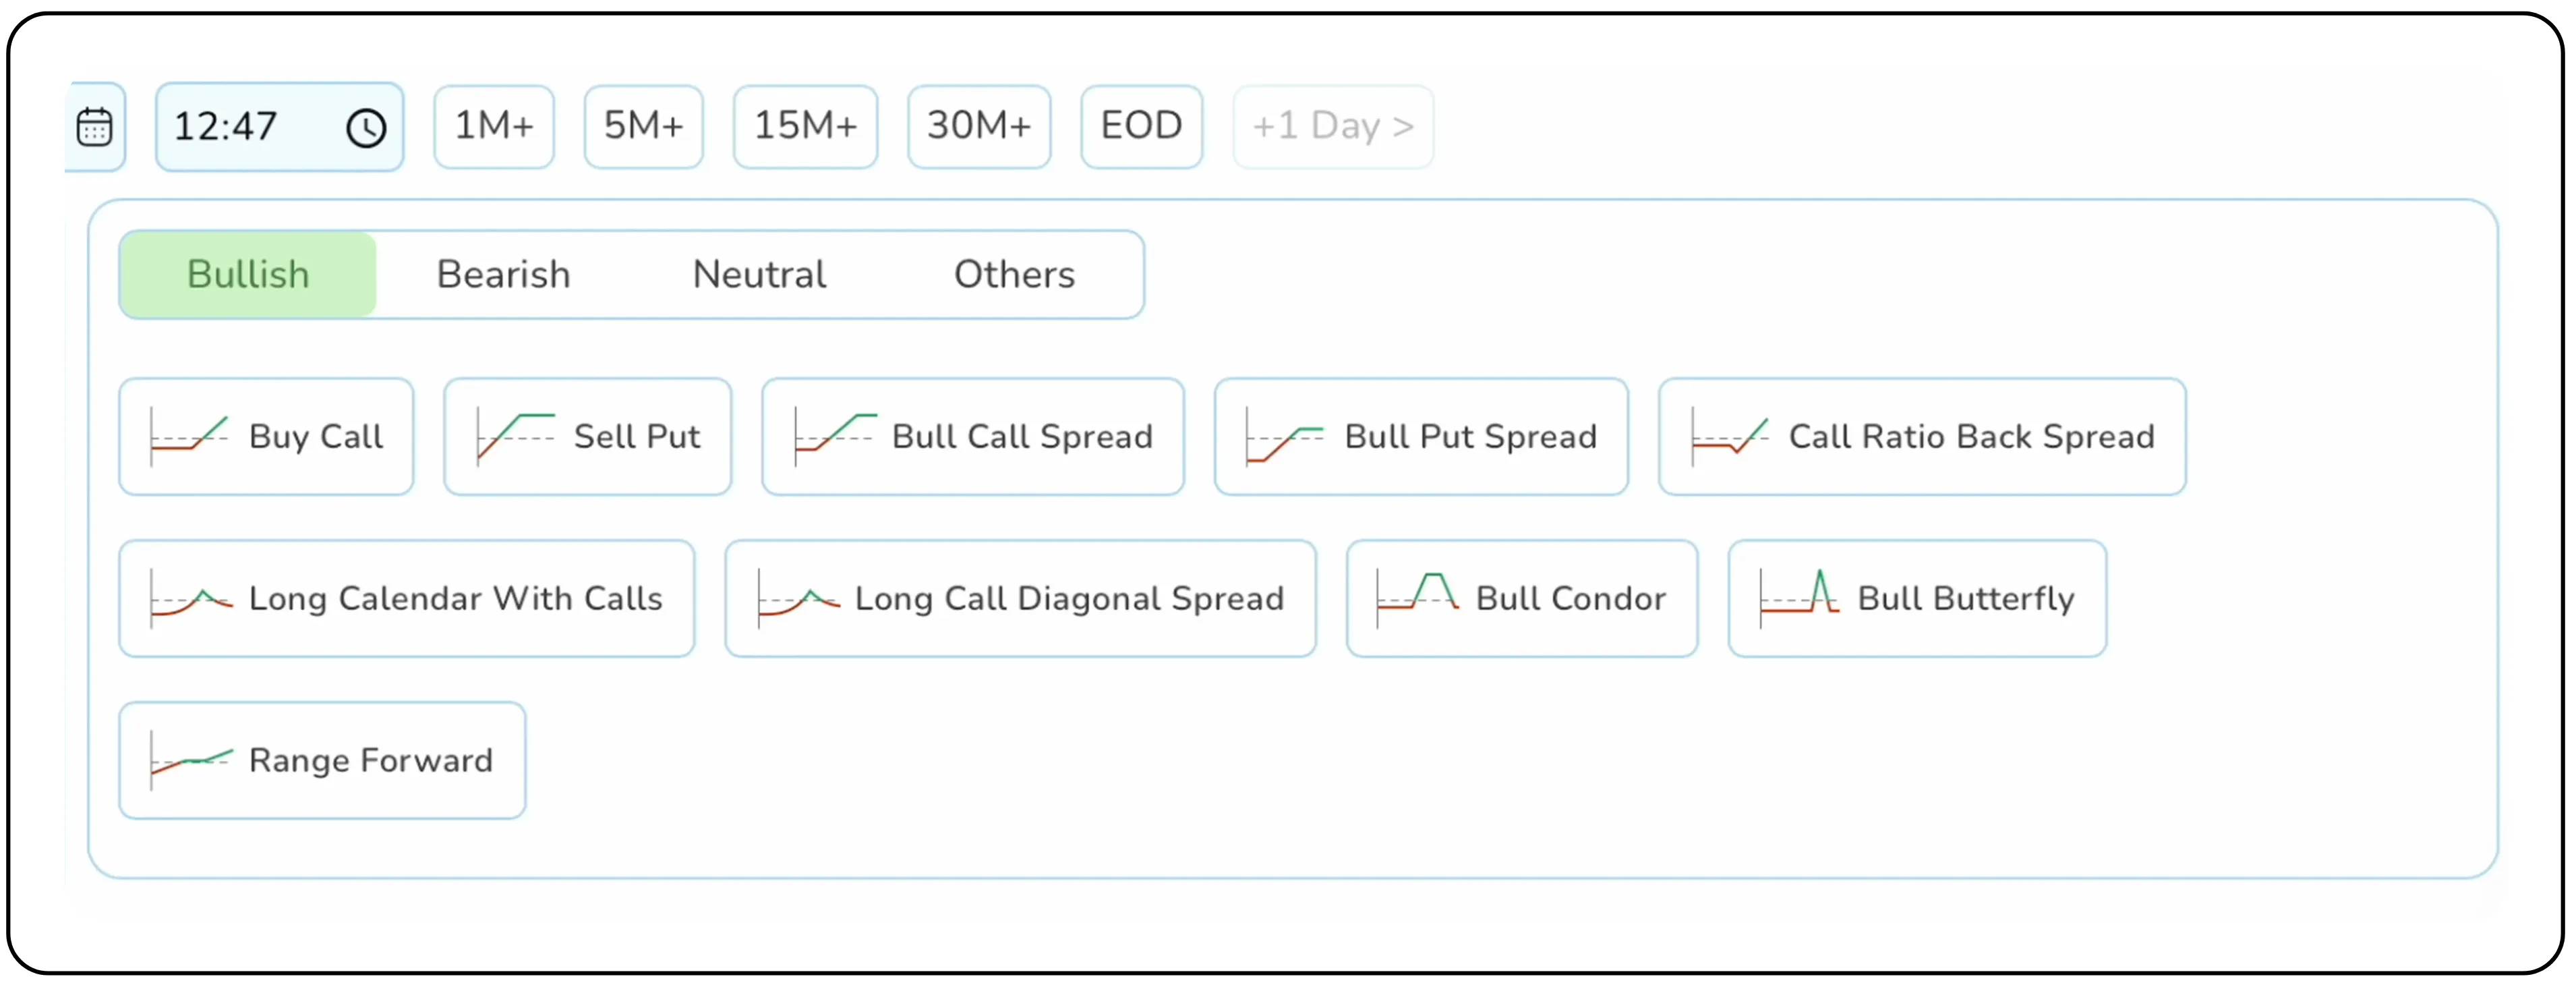
Let’s assume a neutral outlook on Reliance. By clicking the Neutral tab and then Short Straddle, the simulator automatically creates a straddle at the nearest strike price, populated with the exact entry prices for that time.
Also Read: Why Synthetic Long Position Is the Smarter Way to Go Bullish
From data to decision: Analysing your simulated trade
Once your strategy is on the canvas, the real analysis begins. The right-hand panel provides a comprehensive dashboard:
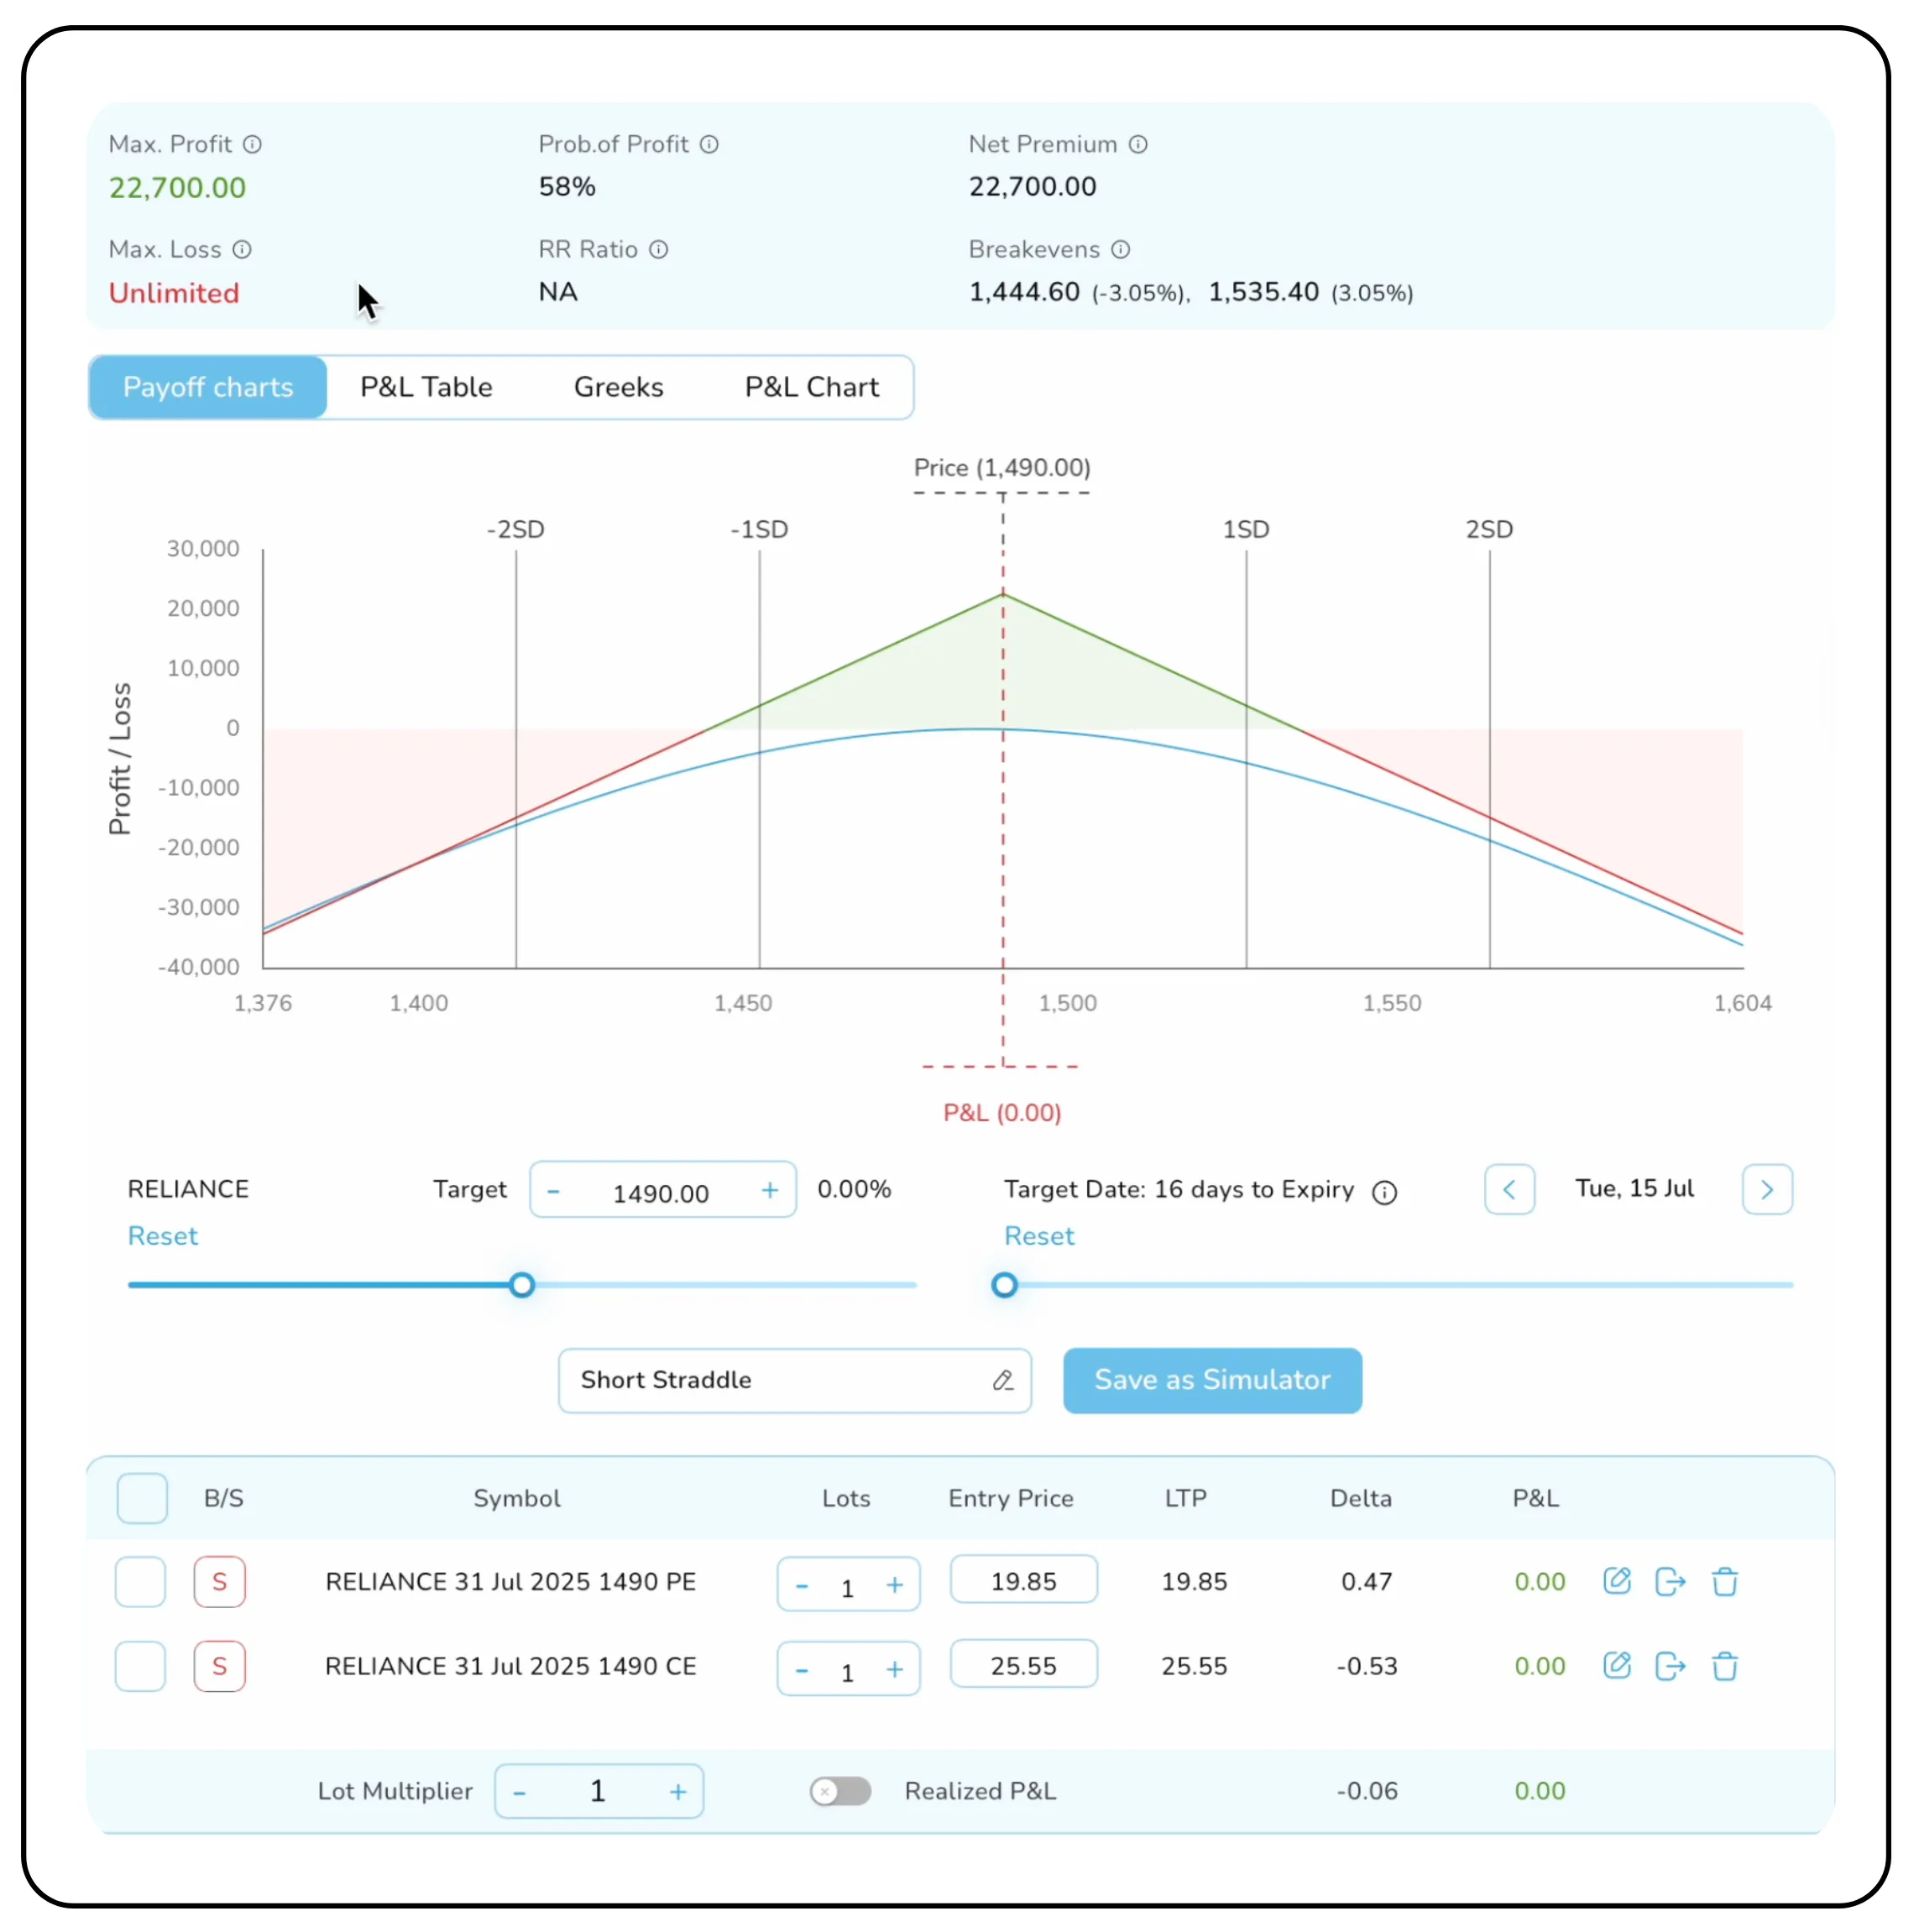
From this panel, you can view key metrics such as Max. Profit, Max. Loss, Probability of Profit, Net Premium, and Breakeven Points.
The panel also offers customization tools, allowing you to set a target, adjust the target date, and modify the lot size with a multiplier. Additionally, you have the option to name your strategy.
- Payoff chart: A clear visual representation of your strategy’s risk-reward profile, including Max Profit, Max Loss, and Breakeven points.
- P&L table: This table itemizes each leg of your strategy, showing the Entry Price, the Last Traded Price (LTP) for that historical moment, and the running P&L.
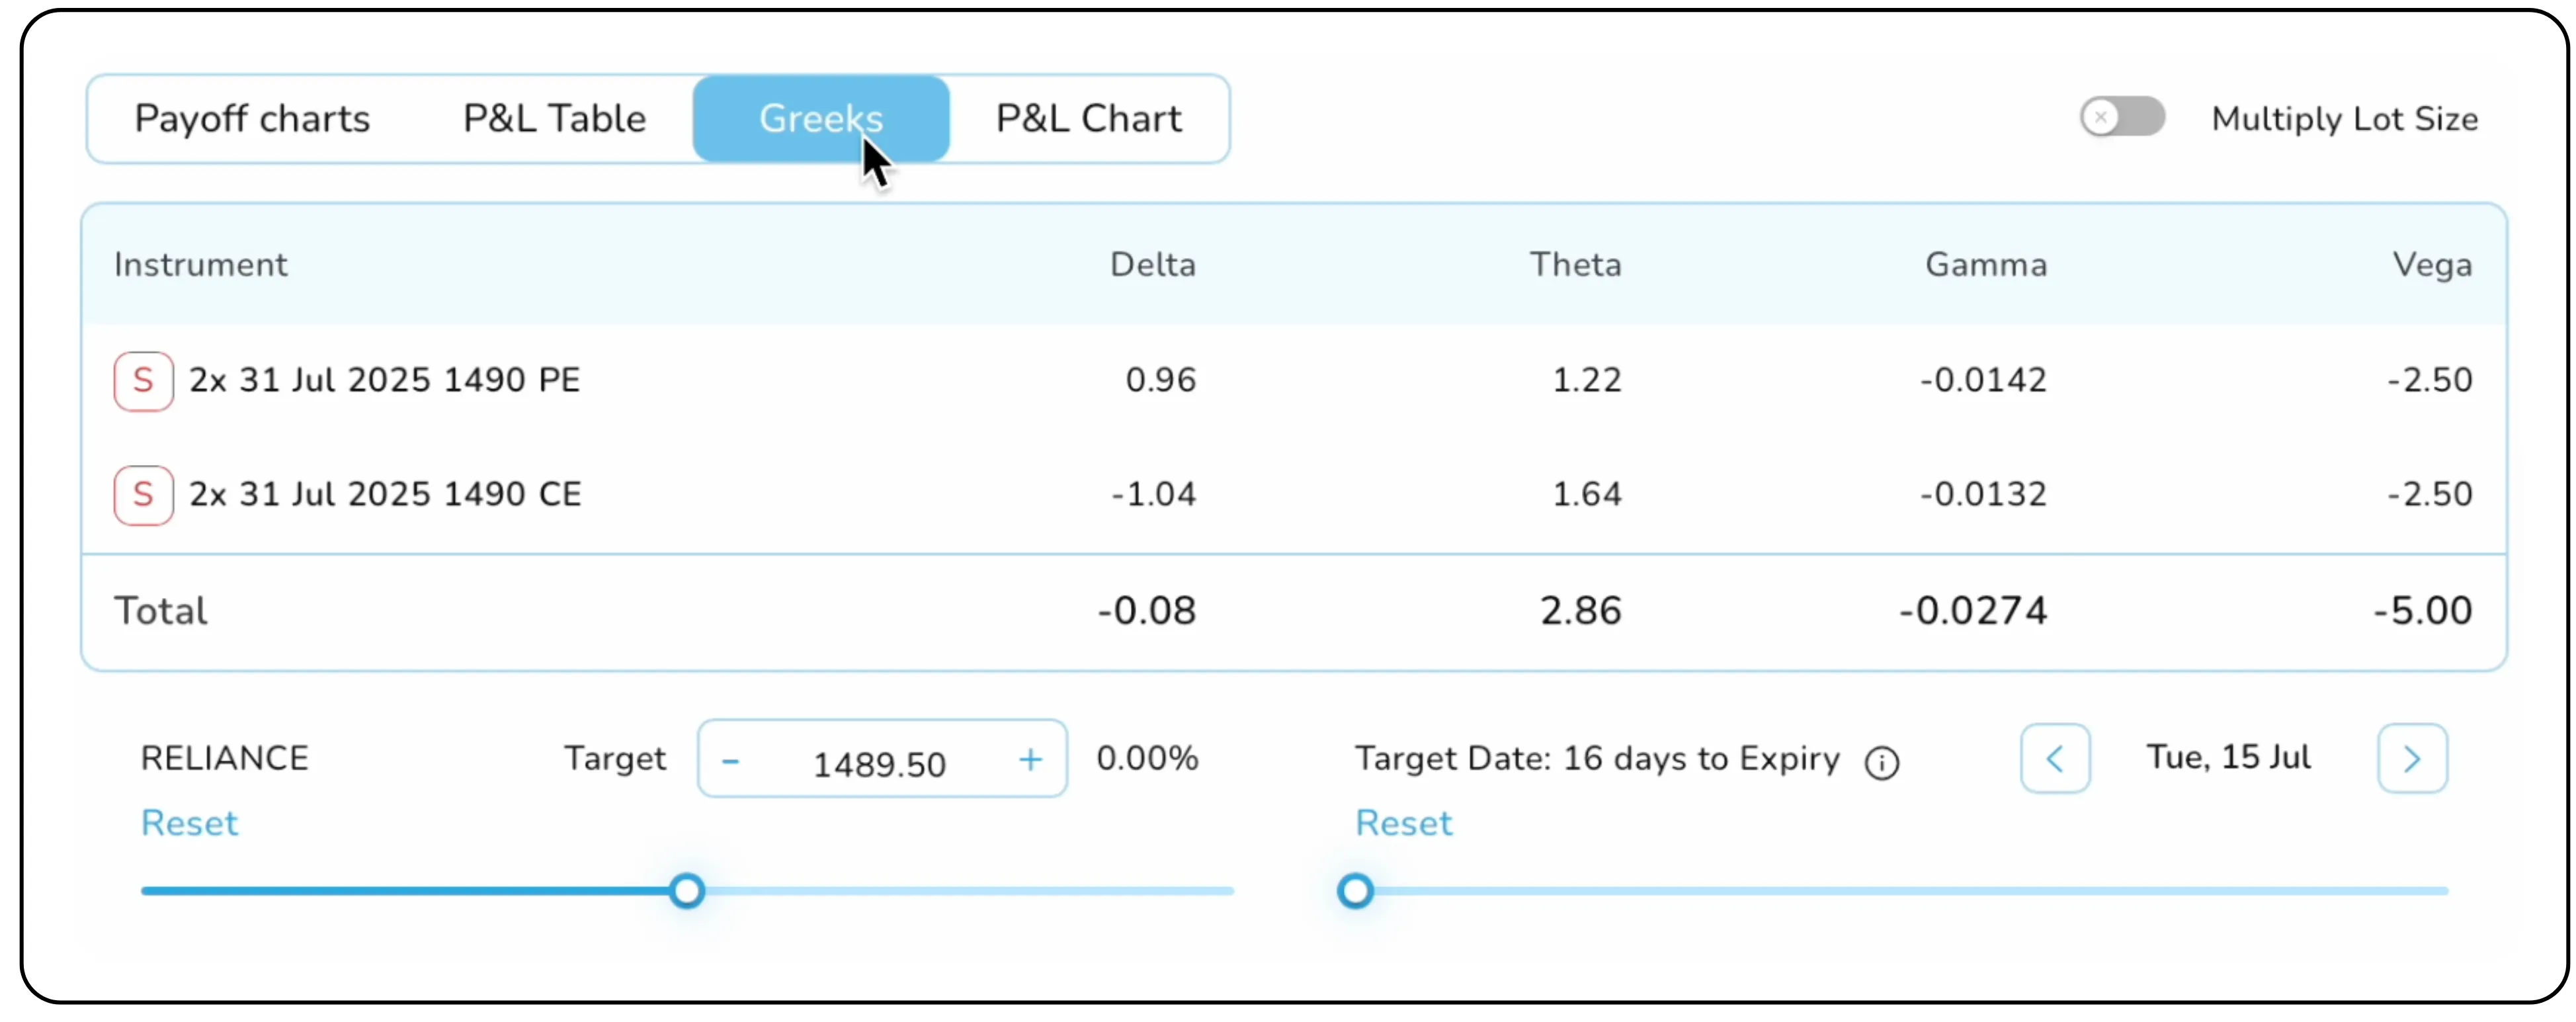
- The greeks panel: Curious how time decay or a spike in volatility would have impacted your trade? The Greeks tab displays the real Delta, Theta, Gamma, and Vega of your consolidated position at the time of entry
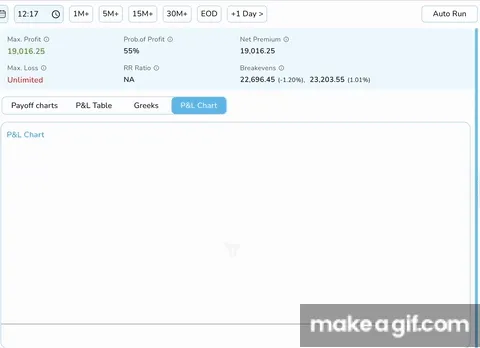
The ultimate test: Using the Auto-Run Replay
This is the simulator’s most dynamic feature. The Auto-Run function simulates the passage of time, allowing you to watch your trade play out as if you were in the live market.
Activate Auto Run and set your preferred speed, for example, let every second of the replay represent 5 minutes of the trading day. Now, press play.

You can observe the P&L change in real-time as the underlying price fluctuates. For a more intuitive view, switch to the P&L Chart tab. Here, you'll see a graph plotting your profits and losses as the day progresses, providing an invaluable look at your strategy’s intraday performance and drawdowns. You can pause the replay at any moment to analyse the market or simulate closing your position.
From backtesting to breakthroughs
The NXTOption Simulator is more than just a practice tool, it’s a strategic asset for every serious trader
- Test with zero risk: Experiment with new strategies or hedge ideas on real market data without any financial exposure.
- Refine your edge: Understand which strategies perform best in different market conditions (trending, range-bound, or volatile) by testing them on specific historical days.
- Build confidence: Gaining data-backed proof that your strategy works is the fastest way to build the conviction needed to execute it decisively in live markets.
Stop relying on assumptions and start making data-driven decisions. Log into NXTOption, open the Simulator, and begin your journey of trading with the power of hindsight.
Disclaimer: The information provided in our blogs is for informational purposes only and should not be construed as financial, investment, or trading advice. Trading and investing in the securities market carries risk. Always conduct your own research and consult with a qualified financial advisor before making any investment decisions. Past performance is not indicative of future results. Copyrighted and original content for your trading and investing needs.
© 2025 — Tradejini. All Rights Reserved.