


The Bat pattern is a precise harmonic trading pattern discovered by Scott Carney in 2001. It ranks among the most accurate patterns in harmonic trading, designed to identify high-probability reversal zones with mathematical precision. Unlike simple chart patterns that rely on visual recognition, the Bat pattern uses specific Fibonacci ratios to define exact entry and exit points, making it invaluable for traders seeking reversal opportunities with tight risk management.
The pattern's defining characteristic is the 0.886 retracement of the initial XA leg, which creates what harmonic traders call the Potential Reversal Zone (PRZ). This deep retest of support or resistance frequently produces sharp, quick reversals a hallmark of valid Bat patterns.
Component breakdown
| Component | Ratio Requirement | Example | Description |
|---|---|---|---|
| XA Leg | Initial impulse move | From Rs 100 share price went Rs 110 | The primary trend movement that initiates the pattern |
| AB Retracement | 0.382 to 0.50 of XA (ideal: 0.50) | AB = 38.2% → 50% of XA → AB = ₹10 × (0.382 to 0.50) → AB = ₹3.82 to ₹5.00 | Point B must be less than 0.618 of XA |
| BC Projection | Minimum 1.618 to 2.618 (ideal: 1.618 or 2.0) | If AB = ₹3.82 → BC = ₹3.82 × (0.382 to 0.886) = ₹1.46 to ₹3.39 If AB = ₹5.00 → BC = ₹5.00 × (0.382 to 0.886) = ₹1.91 to ₹4.43 |
Must not be 1.27 this invalidates the structure |
| CD Leg | 0.886 retracement of XA | If BC 1.91 * 1.618= If BC 4.43 *1.618 = |
The signature element defining the PRZ |
| AB=CD Pattern | Extended: 1.27 AB=CD (minimum: equivalent 1.0) | Internal harmonic structure within the Bat |
Key validation rules:
- B point exceeding 0.618 invalidates the pattern
- BC projection below 1.618 disqualifies it as a Bat
- The 0.886 XA retracement is non-negotiable
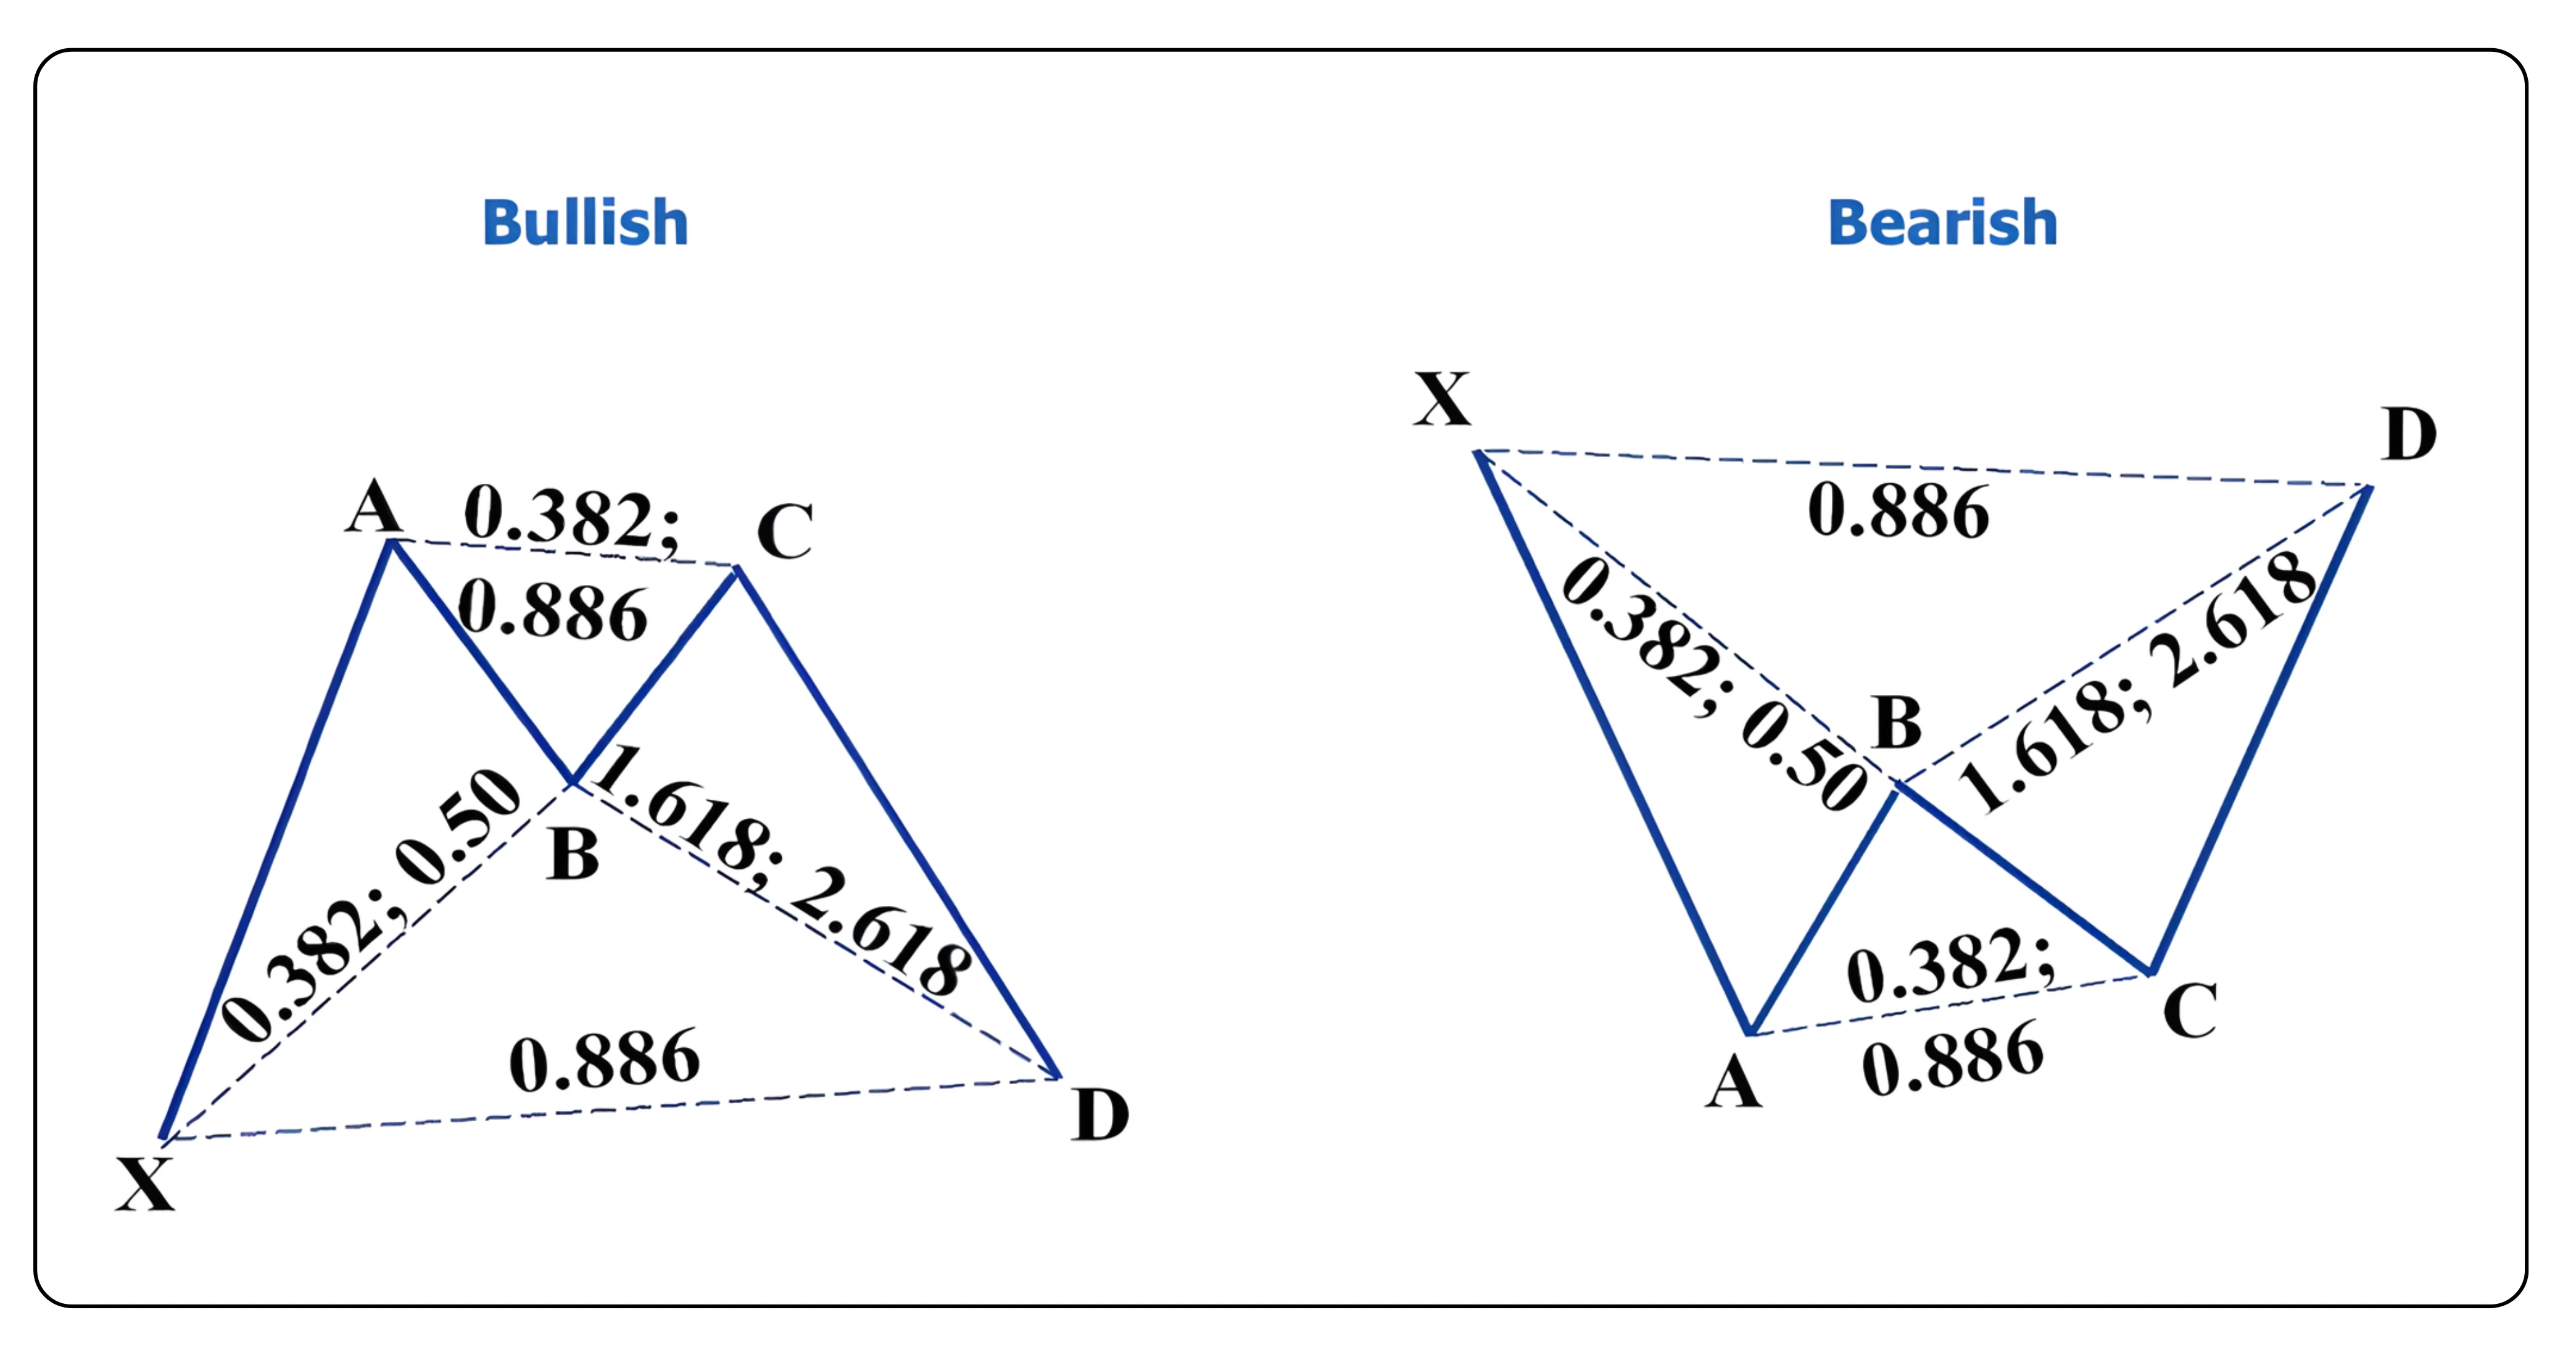
Types of Bat patterns
Bullish Bat Pattern: Appears at the end of a downtrend, signaling potential reversal upward. It forms when the price deeply retests support before bouncing.
Bearish Bat Pattern: Appears at the end of an uptrend, signaling potential reversal downward. It forms when the price deeply retests resistance before declining.
How to identify a valid Bat pattern
| Characteristic | Requirement | Validation Check |
|---|---|---|
| XA impulse | Strong, clear directional move | Without a defined XA leg, ratios lack meaning |
| B point | 0.382–0.50 of XA (max 0.618) | Key differentiator from the Gartley pattern |
| BC projection | 1.618–2.618 (never 1.27) | 1.27 indicates Gartley, not Bat |
| D point (PRZ) | 0.886 retracement of XA | The pattern's signature element |
| AB=CD confluence | Extended (1.27) or equivalent | Adds reliability to the PRZ |
Smart tips for spotting the Bat pattern
- Start with the XA leg: Identify a strong, clear impulse move as your foundation.
- Check the B point immediately: If it's around 0.50 of XA and definitely below 0.618, you might have a Bat forming.
- Measure BC projection carefully: Use Fibonacci extension tools. The 1.618 to 2.618 range keeps the pattern valid.
- Wait for the 0.886 retracement: This deep retest creates the PRZ. The pattern isn't complete until the price reaches this level.
- Look for confluence: The strongest Bat patterns show multiple Fibonacci levels converging at the PRZ—0.886 XA, BC projection, and extended AB=CD all aligning.
- Use proper tools: Harmonic patterns demand precise measurement. Manual estimation leads to errors.
The psychology behind the Bat pattern
The Bat pattern captures specific market behavior: a deep retest before a sharp reversal.
The XA impulse represents strong directional momentum either buyers driving the price up or sellers pushing it down.
The AB retracement (typically 50% of XA) shows profit-taking. Early participants exit, but the larger move isn't finished.
The BC extension (1.618 or more) represents renewed momentum in the original direction. Late traders enter here, believing they are catching the trend but this is often a trap.
The deep CD retracement (0.886 of XA) is where the pattern's power emerges. Price returns almost to the original level but stops short. This deep test shakes out weak positions and traps late entrants, while smart money accumulates at this precise level.
The reversal at the PRZ is typically sharp because stop losses trigger, weak hands exit, and the deep retest confirms the level's strength. The favorable risk-reward at this point attracts institutional positioning.
This explains why Bat patterns allow smaller stop losses. Valid reversals are usually quick and decisive.
Bat vs. Gartley: key differences
| Feature | Bat Pattern | Gartley Pattern |
|---|---|---|
| B Point | 0.382–0.50 of XA | Typically 0.618 of XA |
| D Point (PRZ) | 0.886 of XA | 0.786 of XA |
| BC Projection | Min 1.618, up to 2.618 | Typically 1.27 or 1.618 |
| Depth | Very deep (88.6%) | Moderate (78.6%) |
Quick identifier:
- B point around 0.50 + D point at 0.886 = Bat
- B point at 0.618 + D point at 0.786 = Gartley
Bat pattern – quick recap
- Forms after a clear XA impulse with specific harmonic retracements
- 0.886 retracement of XA is the signature defining element
- B point must stay below 0.618 of XA (ideally 0.50)
- BC projection requires a minimum of 1.618 (never 1.27)
- Includes extended AB=CD structure (ideally 1.27)
- PRZ is where multiple Fibonacci levels converge
- Reversals are often sharp and quick
- Requires smaller stop losses than most patterns
How to trade the Bat pattern
Bullish Bat pattern example
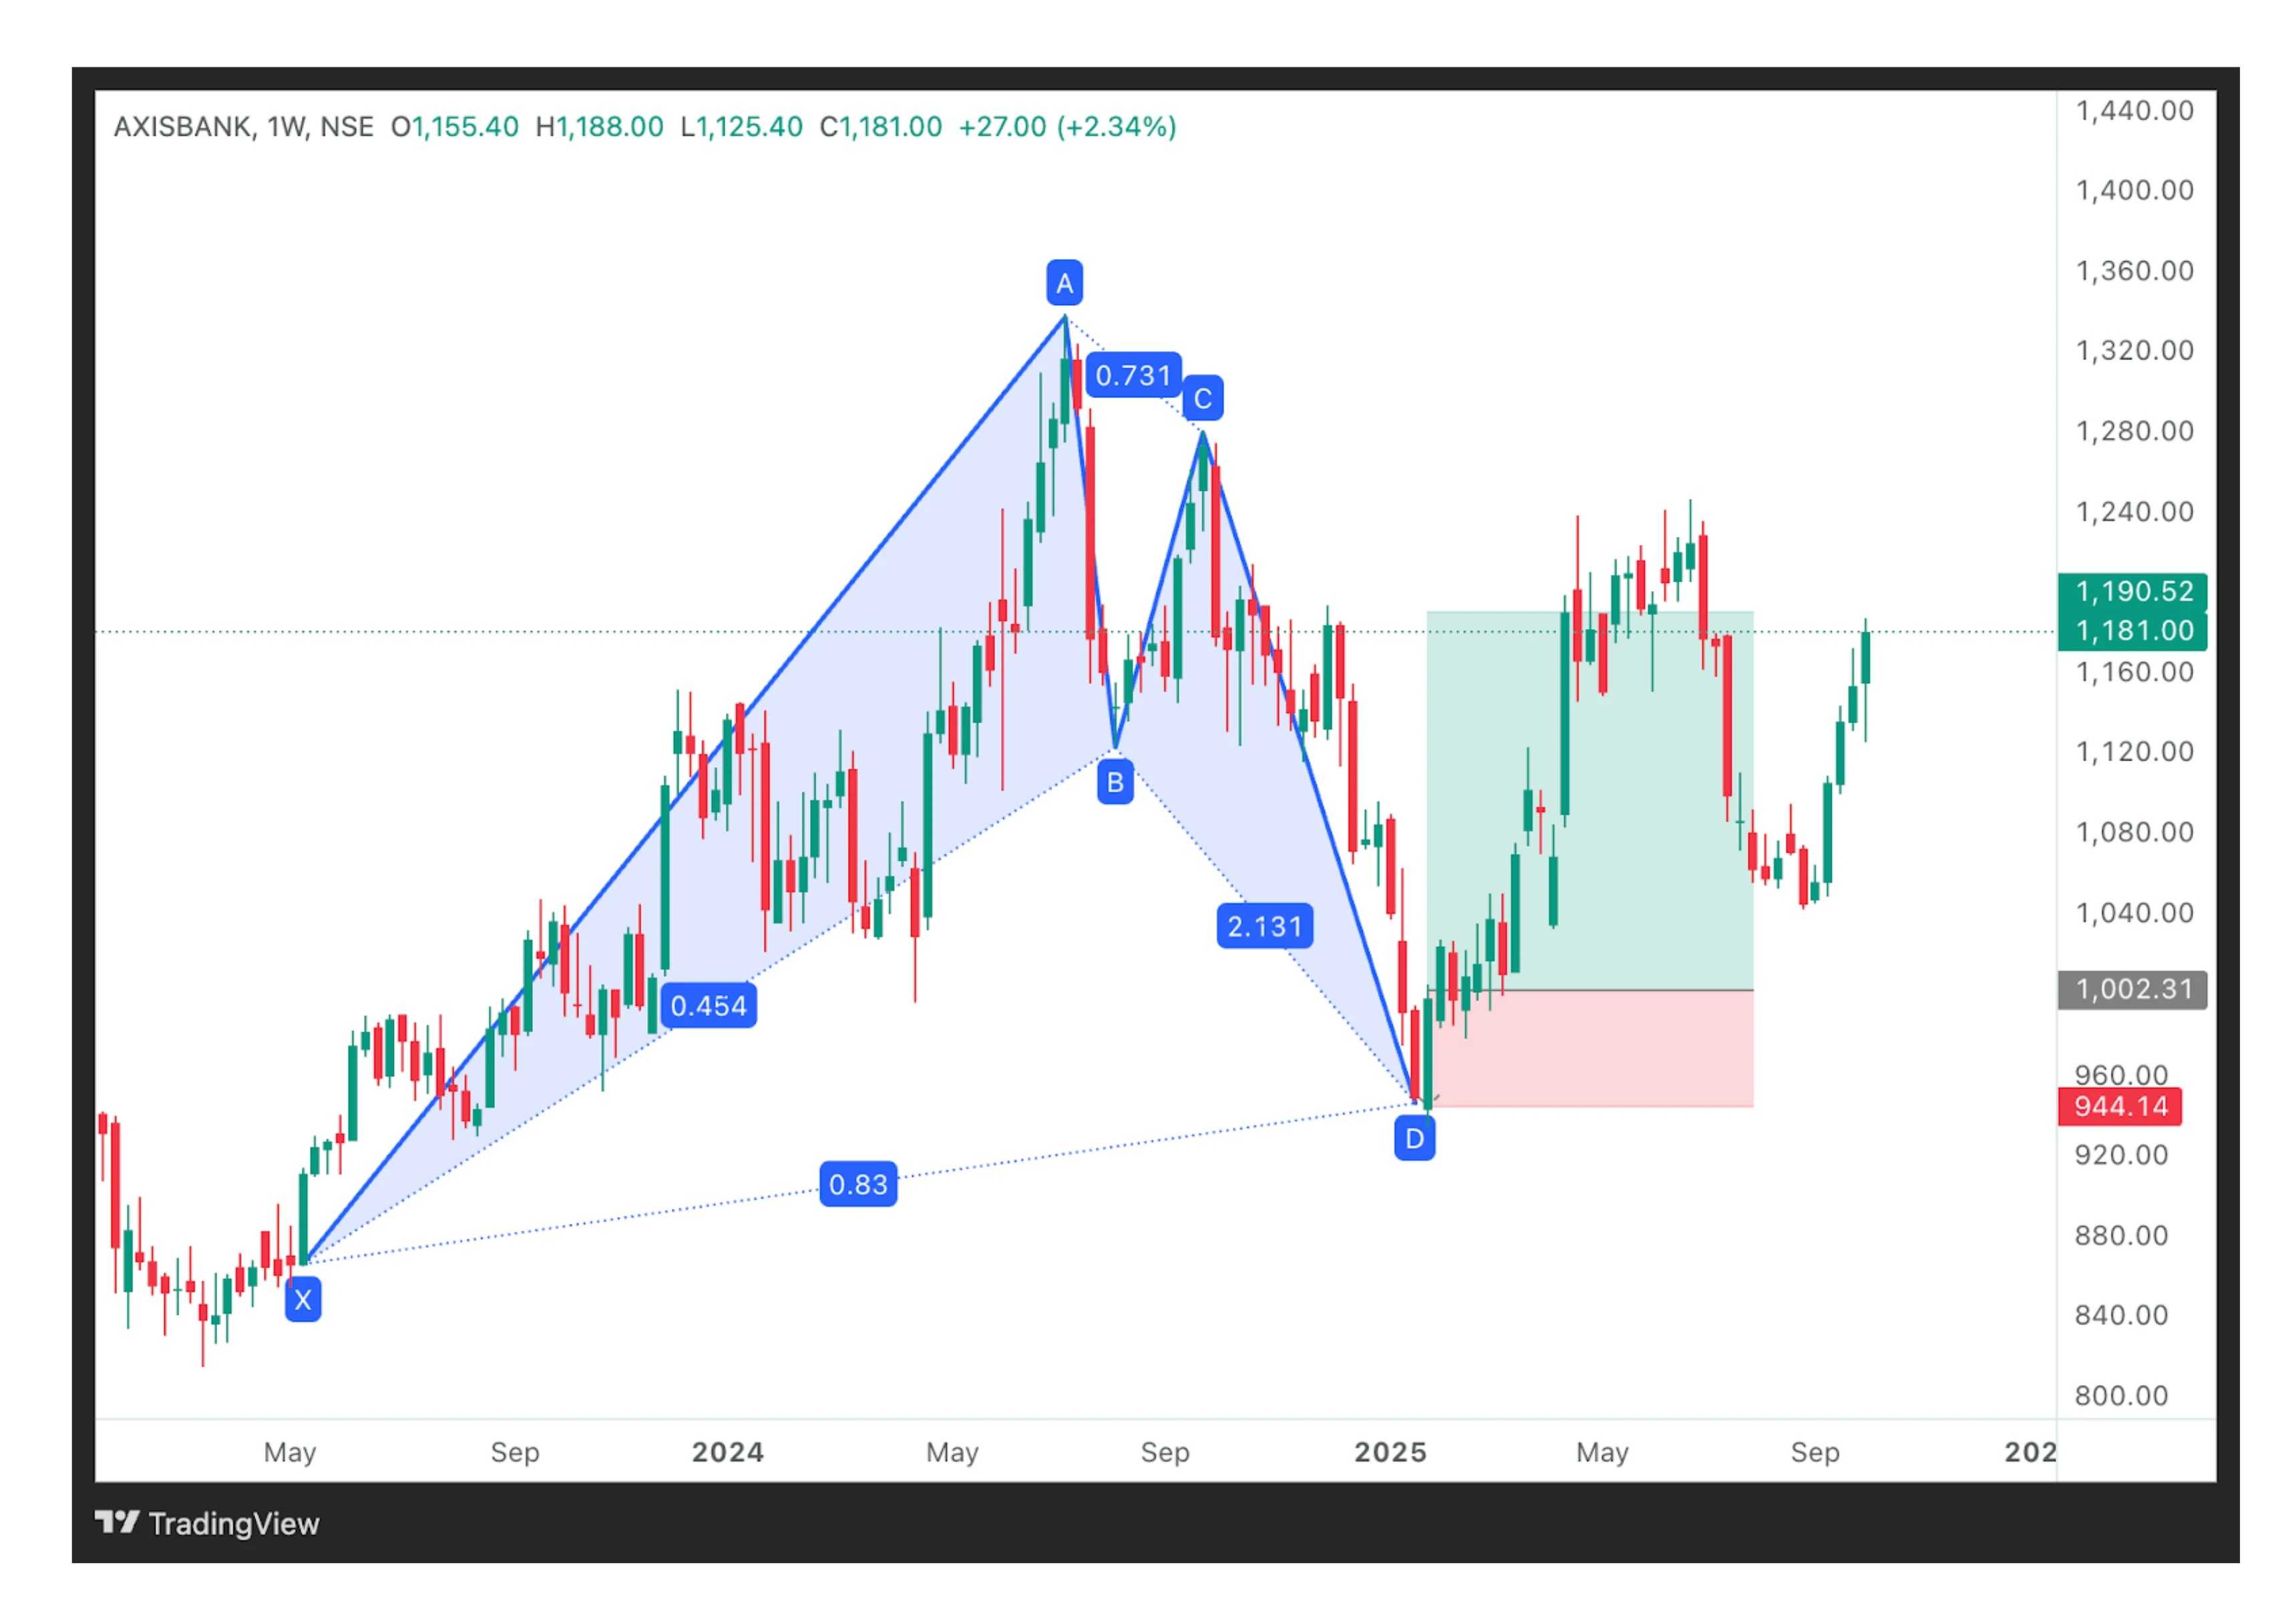
Pattern explanation:
A bullish bat pattern has formed on Axis Bank. After the XA rally, the price retraced 45% to B, then extended sharply with BC reaching 2.131 of AB. The final leg CD completed close to the 0.83–0.886 retracement of XA, creating a potential PRZ (Potential Reversal Zone) around INR 1000. This alignment of Fibonacci levels signaled exhaustion of the downtrend and the possibility of a bullish reversal.
Entry Point: A Long entry was triggered near point D (PRZ INR 1000) after bullish confirmation. The price bounced with strong green candles. Traders could also use RSI divergence or volume expansion for confirmation.
Stop Loss: Placed just below point D or slightly under the 1.0 retracement of XA (INR 920–940) zone. This aligns with the Bat’s principle of tight stop losses (usually 2-4%).
Targets:
- Target 1: 0.382 retracement of AD (INR 1100), partial profits can be booked here
- Target 2: 0.618 retracement of AD (INR 1180 – 1200) primary target
- Target 3: Point C level or beyond (remaining position)
Confirmation:
The strong bullish reversal from the PRZ, with expanding volume and candles reclaiming resistance zones, validated the Bat’s reversal potential.
Bearish Bat pattern example
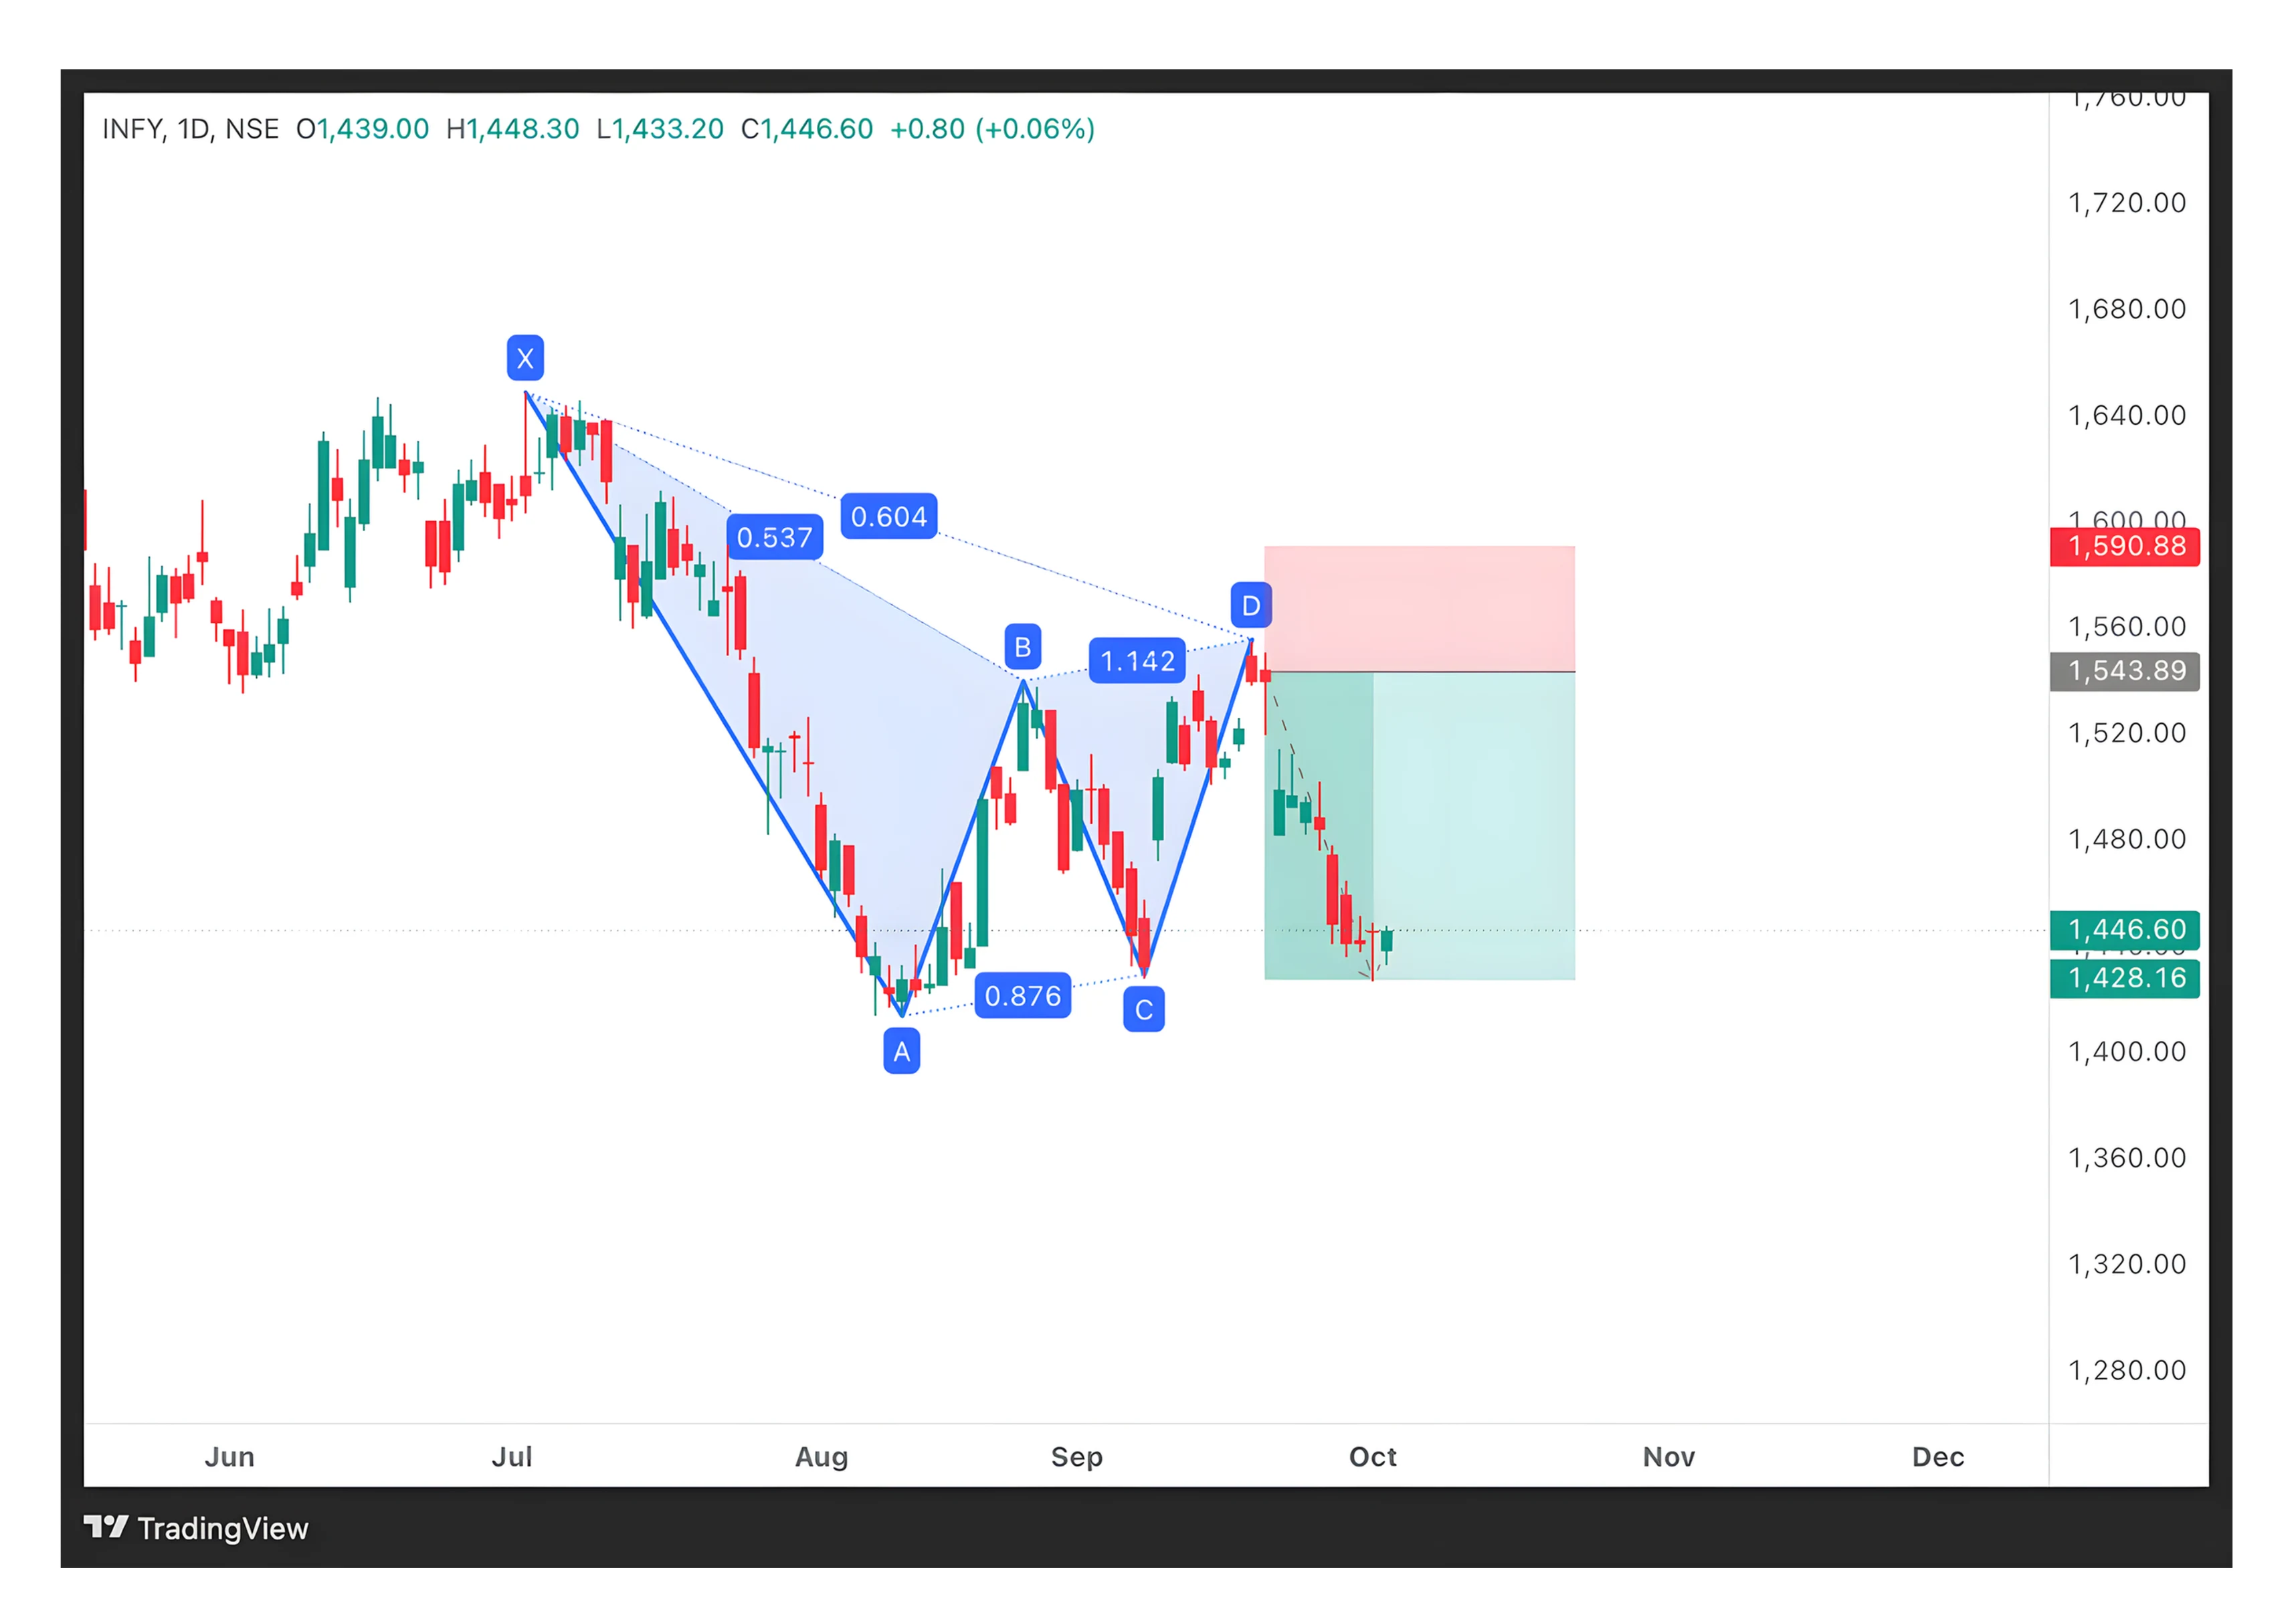
Pattern explanation:
Infosys has completed a Bearish Bat harmonic structure. After the XA rally, the price retraced ~53% to point B, then extended upward with BC around 0.87 of AB, before completing the CD leg near 1.142 XA retracement.
Entry Point: Short entries were valid near point D (~₹1540–1560), after bearish confirmation candles.
Stop Loss: Tops placed just above point D or beyond the 1.0 retracement of XA (~₹1600 zone), protecting against pattern invalidation.
Targets:
- Target 1: 0.382 retracement of AD (₹1480) → already achieved.
- Target 2: 0.618 retracement of AD (₹1425–1430)
- Target 3: Point C level and beyond (₹1360) if momentum persists.
Risk-Reward: The tight PRZ allows a favorable risk-reward setup, typically 1:2 or better. The Infosys rejection from D suggests a strong bearish conviction.
The strategic role of the Bat Pattern
The Bat pattern represents mathematically precise reversal opportunities combining multiple Fibonacci relationships into high-probability setups. Its 0.886 retracement creates optimal risk-reward scenarios by testing—but not breaking—key levels.
Unlike subjective patterns, the Bat's strict requirements remove guesswork, providing exact entry levels, tight stops, and clear targets. Its effectiveness captures the final shakeout psychology before reversals, where smart money accumulates while retail traders panic or chase the market.
When confirmed with RSI divergence, volume expansion, or candlestick patterns, Bat patterns offer exceptional risk-reward ratios. Their tight stops and sharp reversals make them particularly valuable for swing traders seeking defined-risk opportunities at potential turning points.
Disclaimer: The information provided in our blogs is for informational purposes only and should not be construed as financial, investment, or trading advice. Trading and investing in the securities market carries risk. Always conduct your own research and consult with a qualified financial advisor before making any investment decisions. Past performance is not indicative of future results. Copyrighted and original content for your trading and investing needs.
© 2025 — Tradejini. All Rights Reserved.


