


Most traders know their charts, indicators, and setups. But when trades don’t go as planned, the problem often isn’t the strategy, it’s the timing. That’s where multi-time frame analysis steps in.
By looking at the same stock or index across different time frames, you get a clearer view of the trend, strength, and potential turning points. It’s a simple shift in approach that helps avoid chasing false signals and jumping in too early. For anyone trading positionally, this discipline of aligning with the bigger trend can make all the difference.
The importance of Multi-Time Frame Analysis in trading
Multi-time frame analysis (MTFA) is a powerful technique that helps traders view the same asset across different time intervals. By doing so, it offers a more complete picture of market trends and price movements. This broader perspective allows traders to align their trades with the dominant trend, filter out noise, and avoid false signals. As a result, it improves the accuracy of entry and exit points, making MTFA a valuable part of any trader’s strategy.
Understanding trends with Multiple time frames for positional trading
| Trend Type | Description |
|---|---|
| Primary Trend | The main trend that shows the overall market direction lasts for months or even years. |
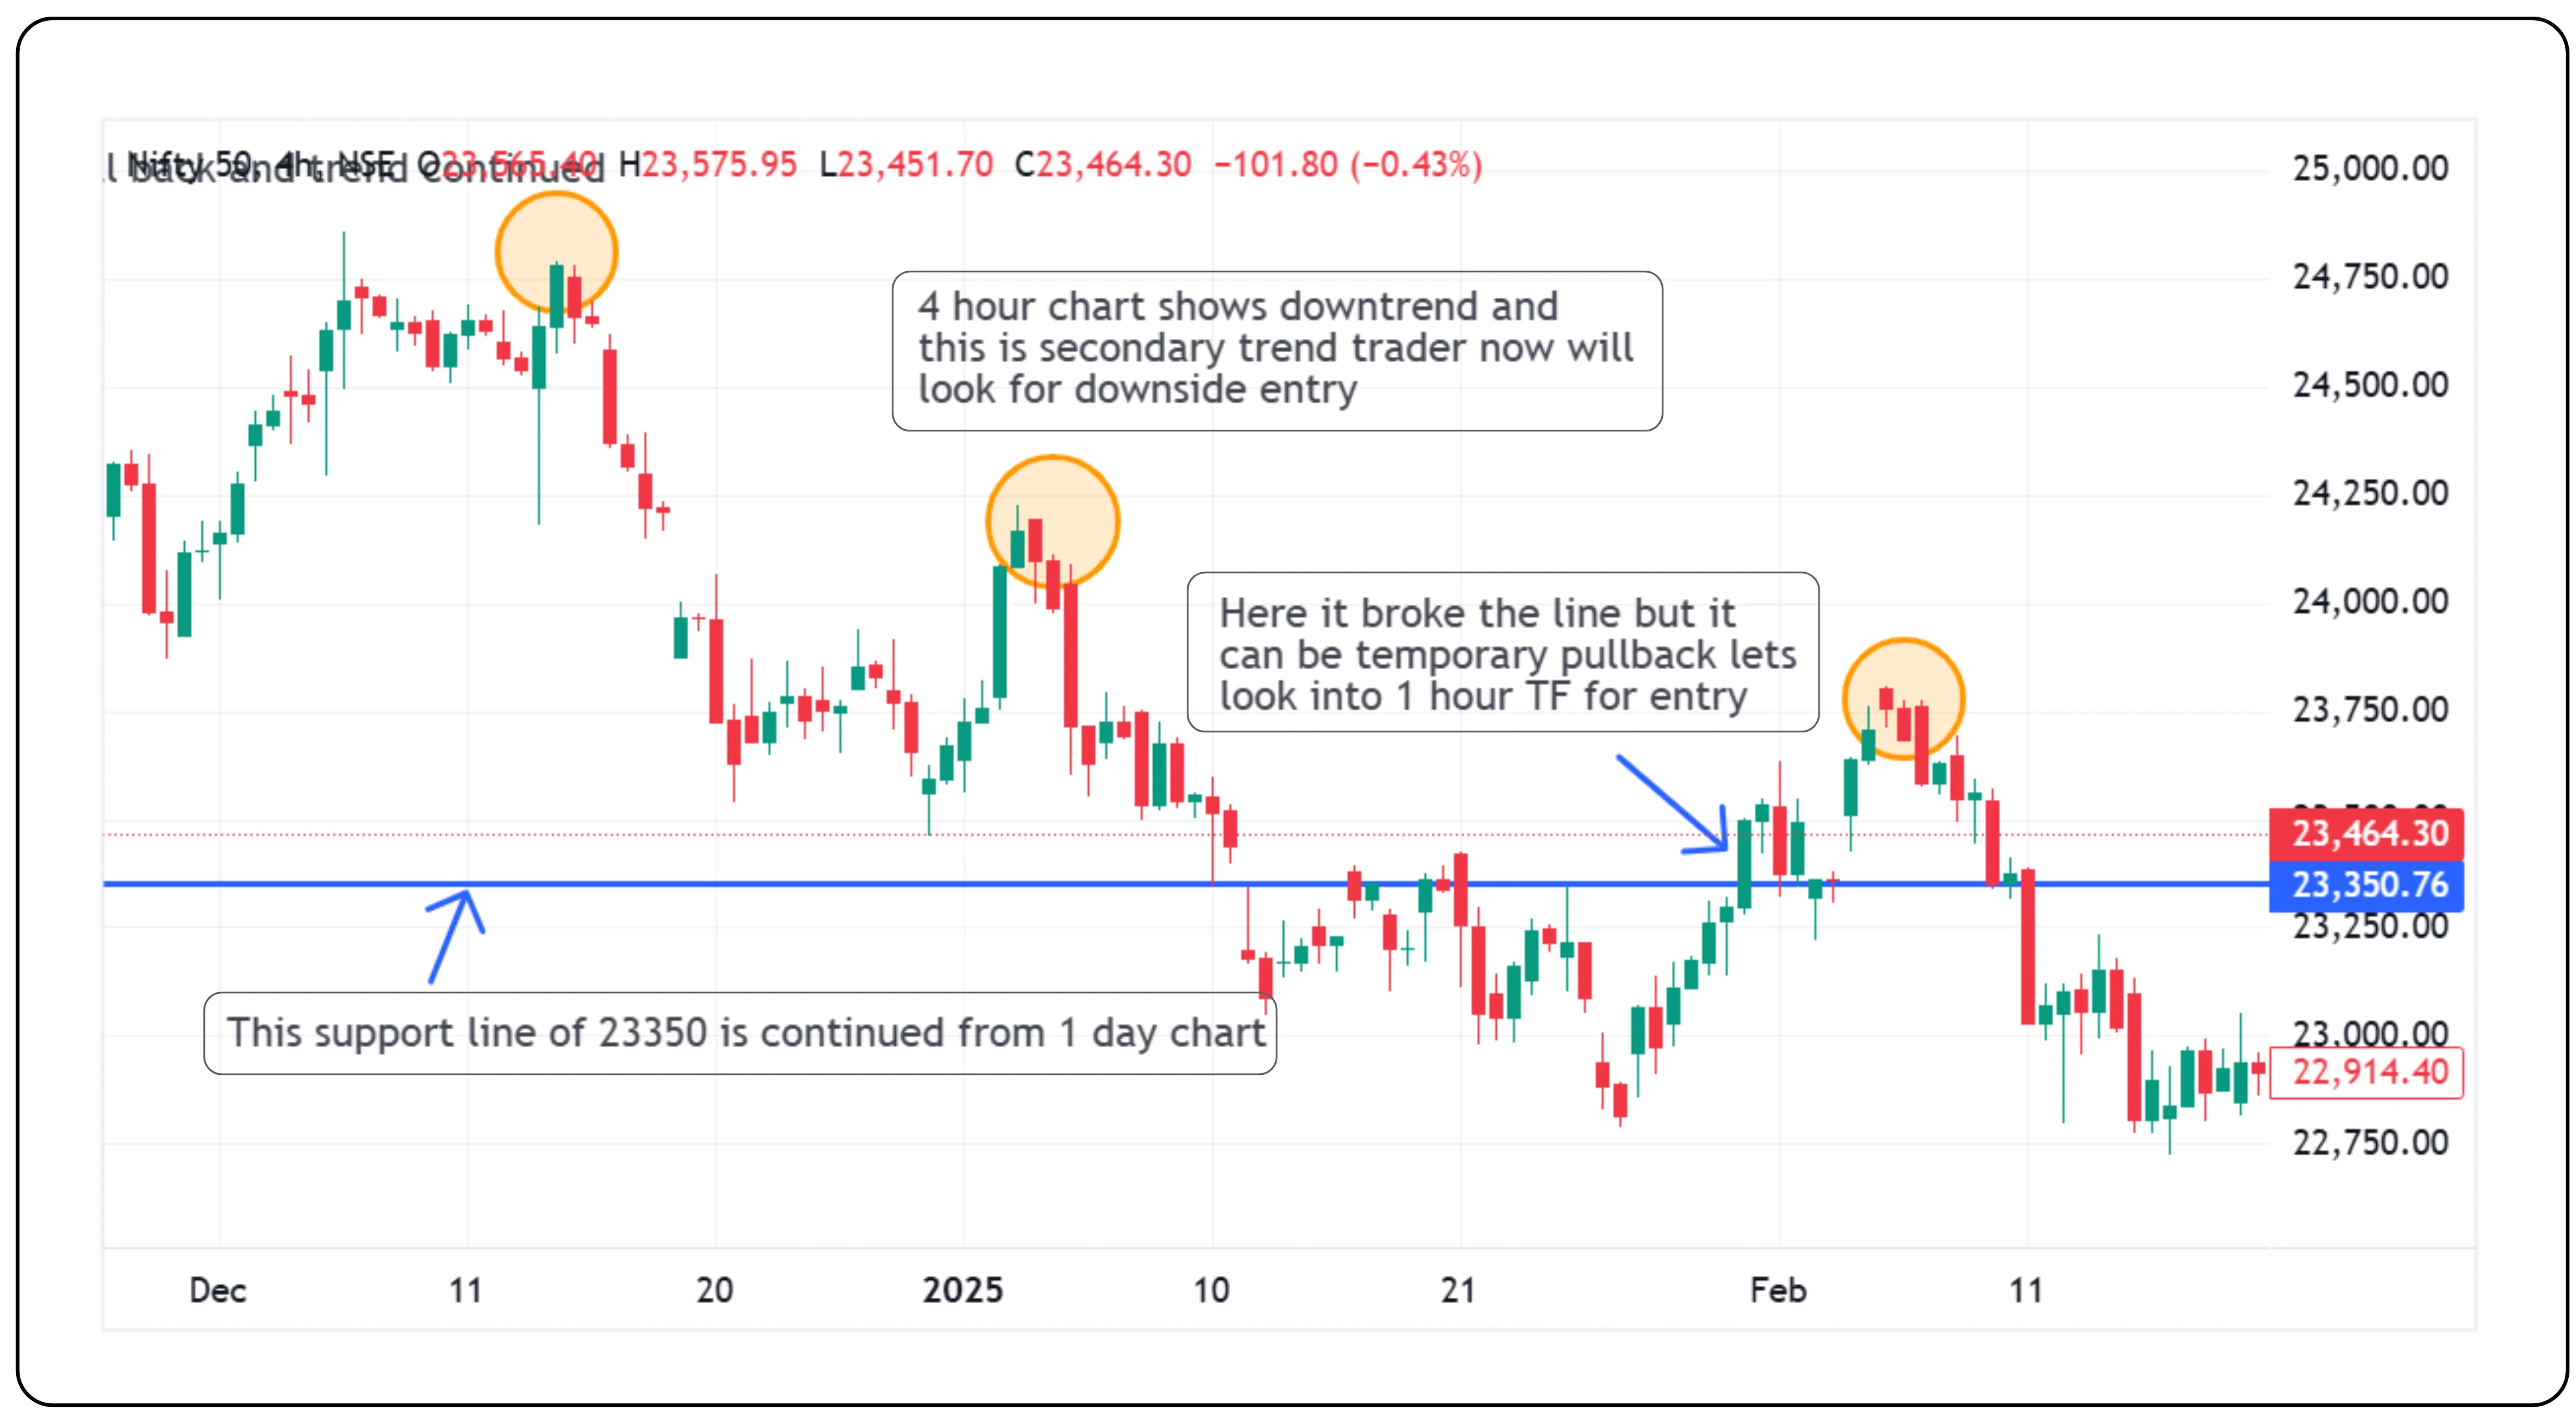
| Secondary Trend | A correction within the primary trend generally lasts a few weeks to a few months. |
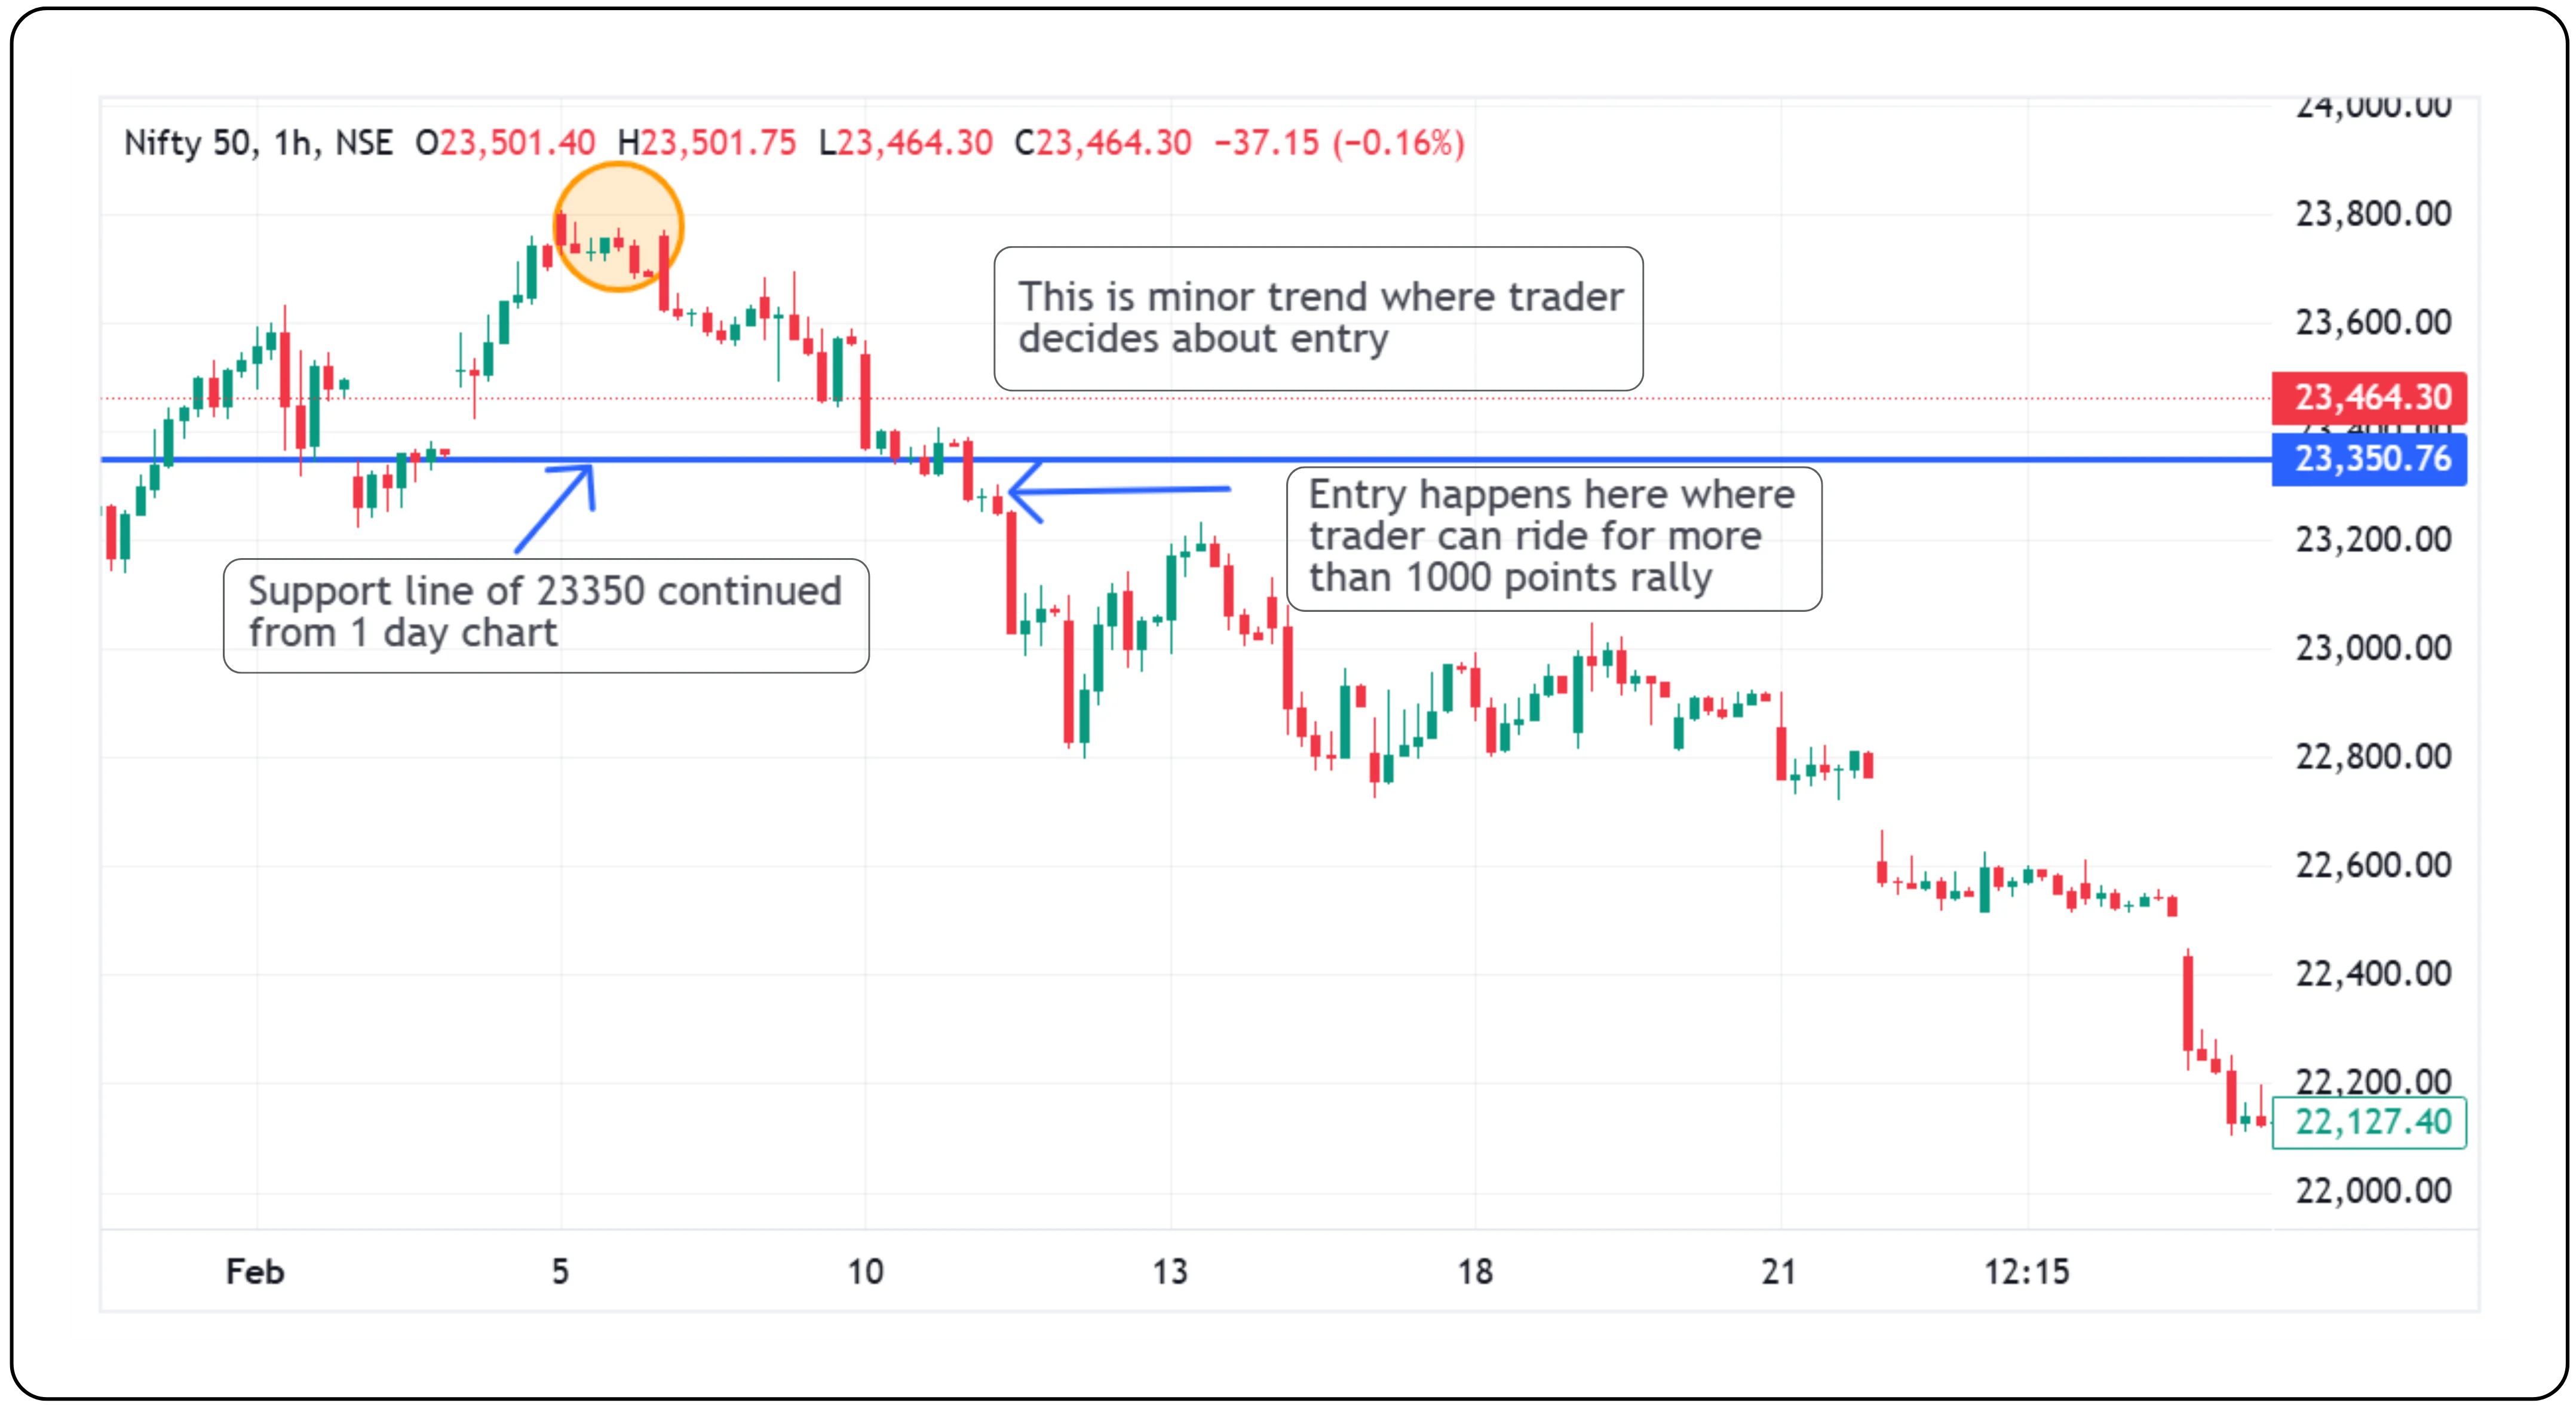
| Minor Trend | A short-term trend that is part of the secondary trend, lasts from a few days to weeks. |
Managing risk with Multi-Time Frame analysis
Multi-time frame (MTF) analysis is an effective way to manage risk by aligning trade setups with the broader market trend. By examining price action across different timeframes, traders can time their entries and exits more precisely and adapt their strategy based on their trading style, be it intraday, swing, or positional.
Longer timeframes help identify the primary trend, while intermediate ones highlight potential pullbacks. Shorter time frames then assist in spotting ideal entry points. This layered approach helps avoid premature or false entries, ensuring trades are made in sync with the market’s overall direction.
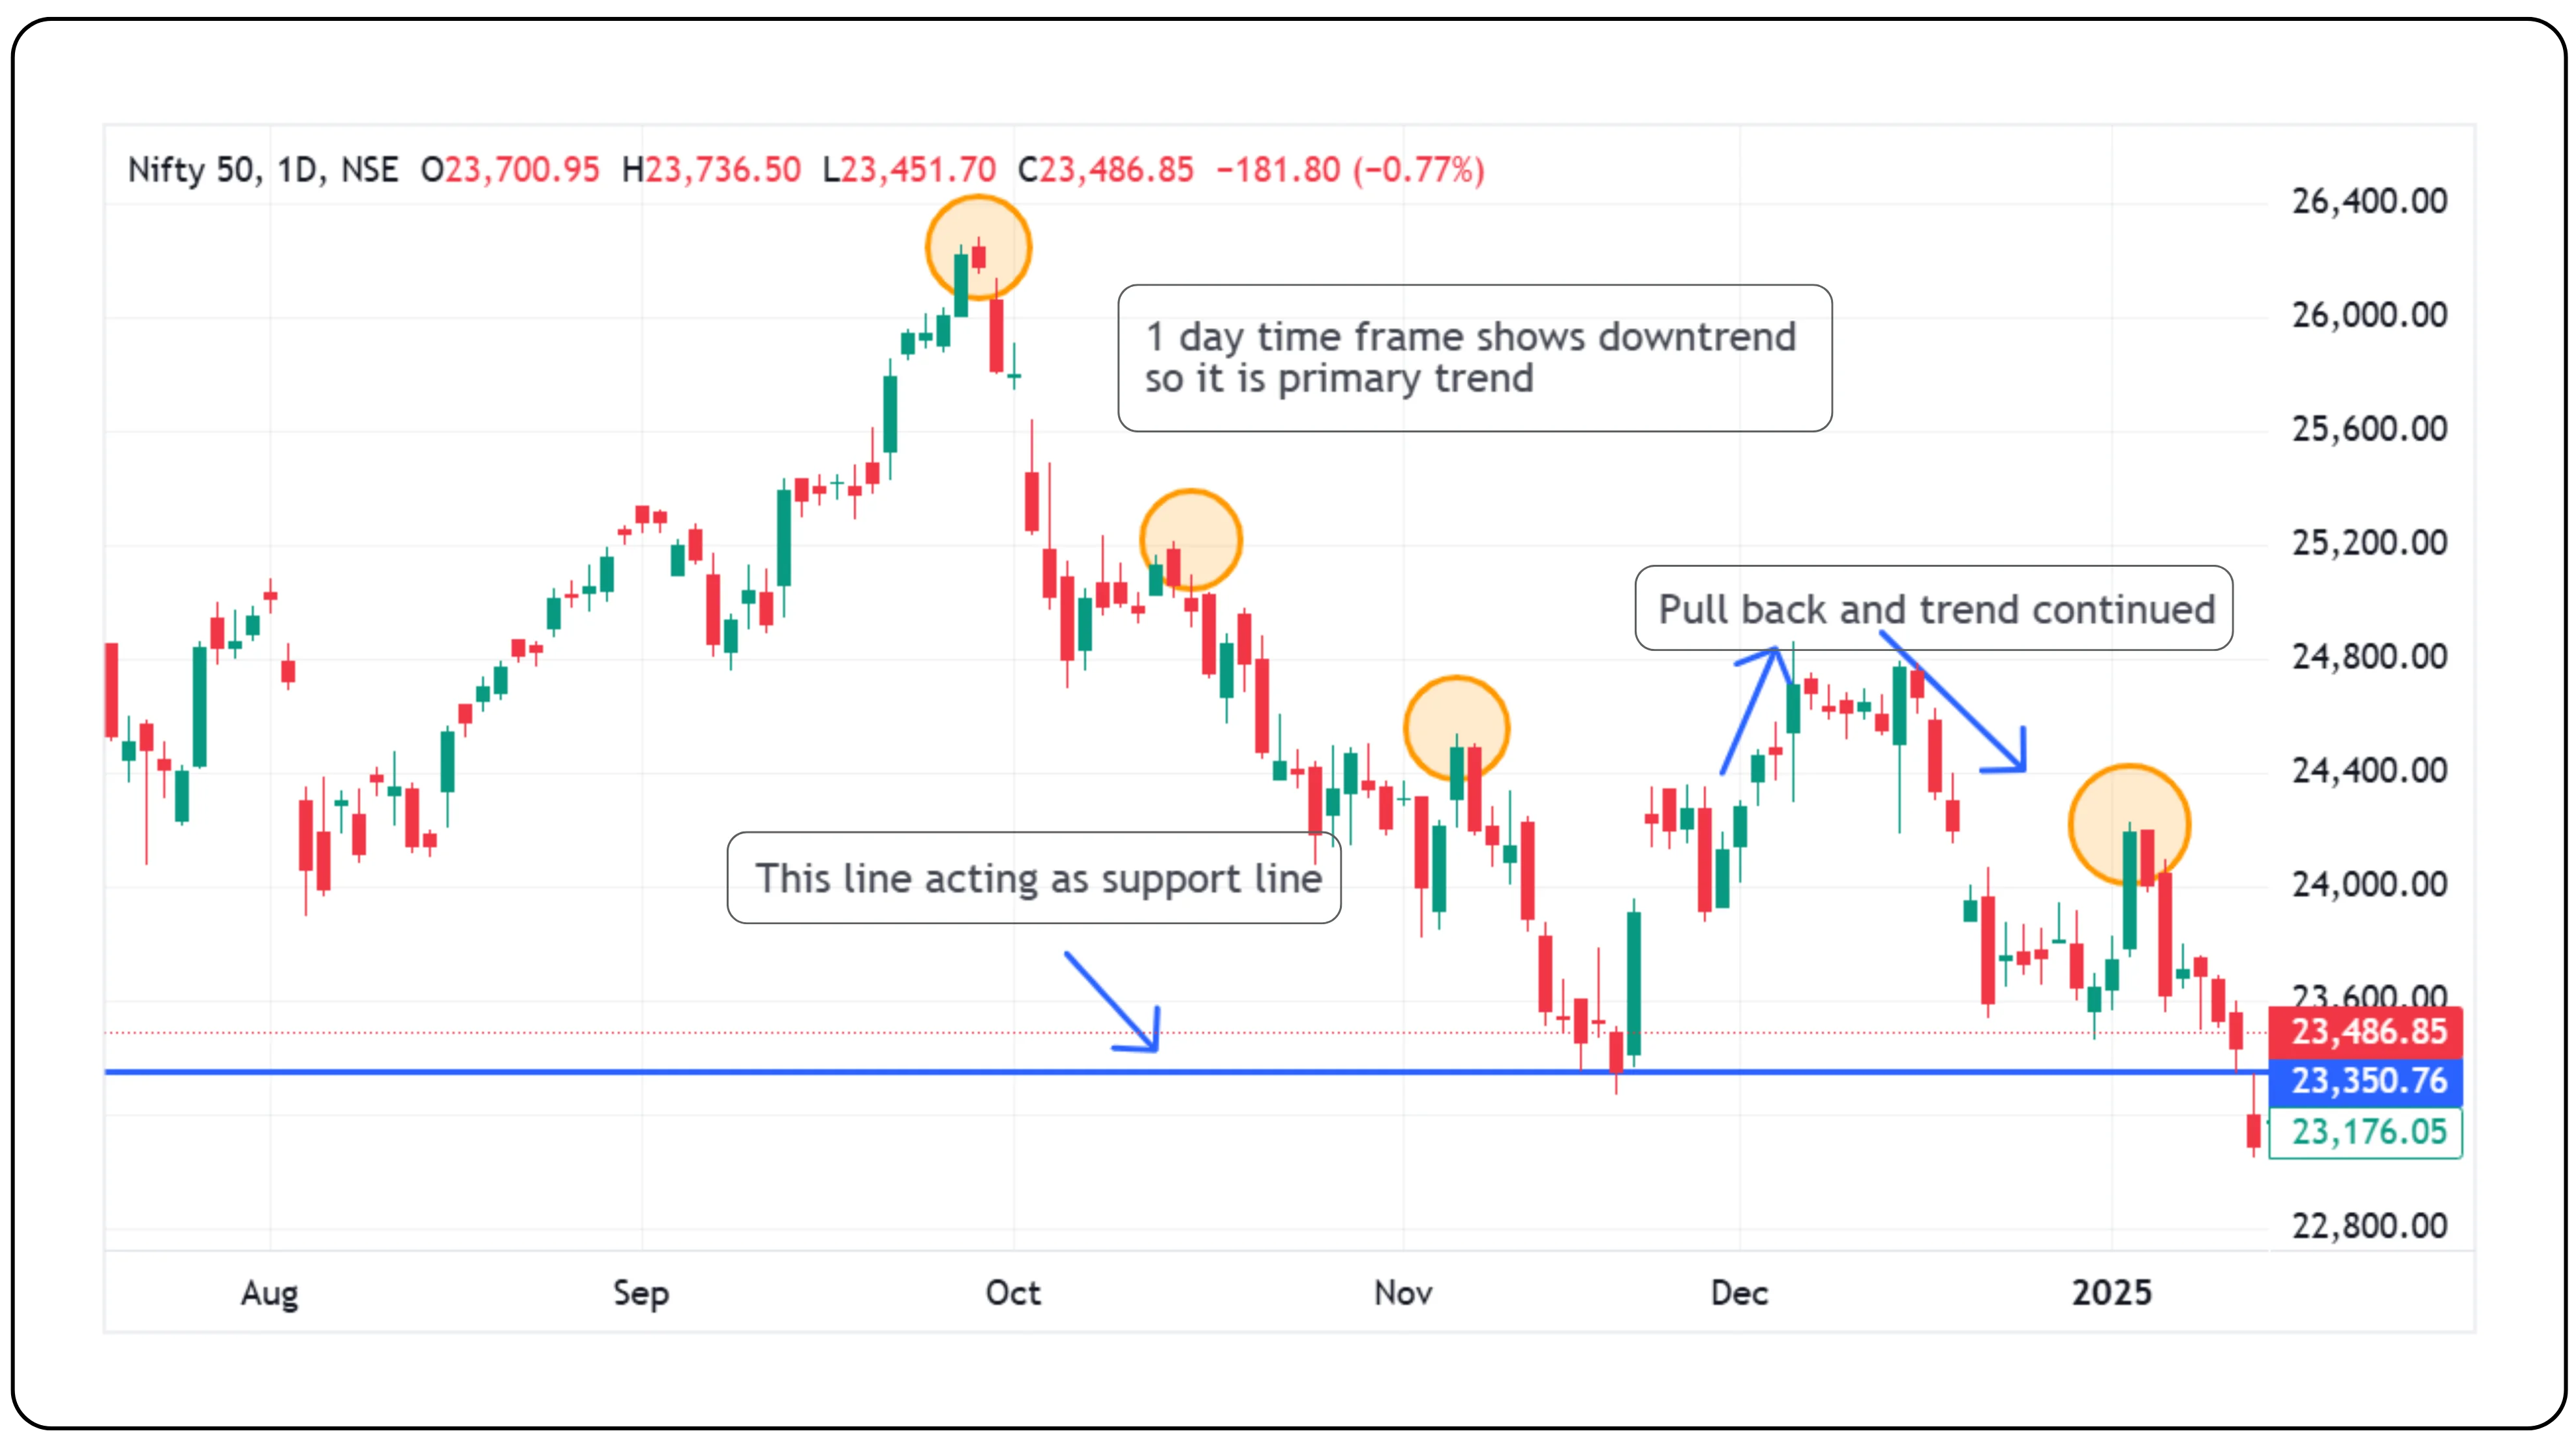
By identifying both the primary and secondary trends, traders can avoid entering during temporary pullbacks, thereby reducing the risk of losses. The minor trend, on the other hand, helps in pinpointing the ideal entry point, allowing traders to capture more points with limited downside. A clear example of this approach can be seen on the Nifty 50 chart between February 1 and February 25, 2025, where aligning with the trend across timeframes delivered more precise and confident trades.
Analyzing Nifty 50 chart using multiple time frames
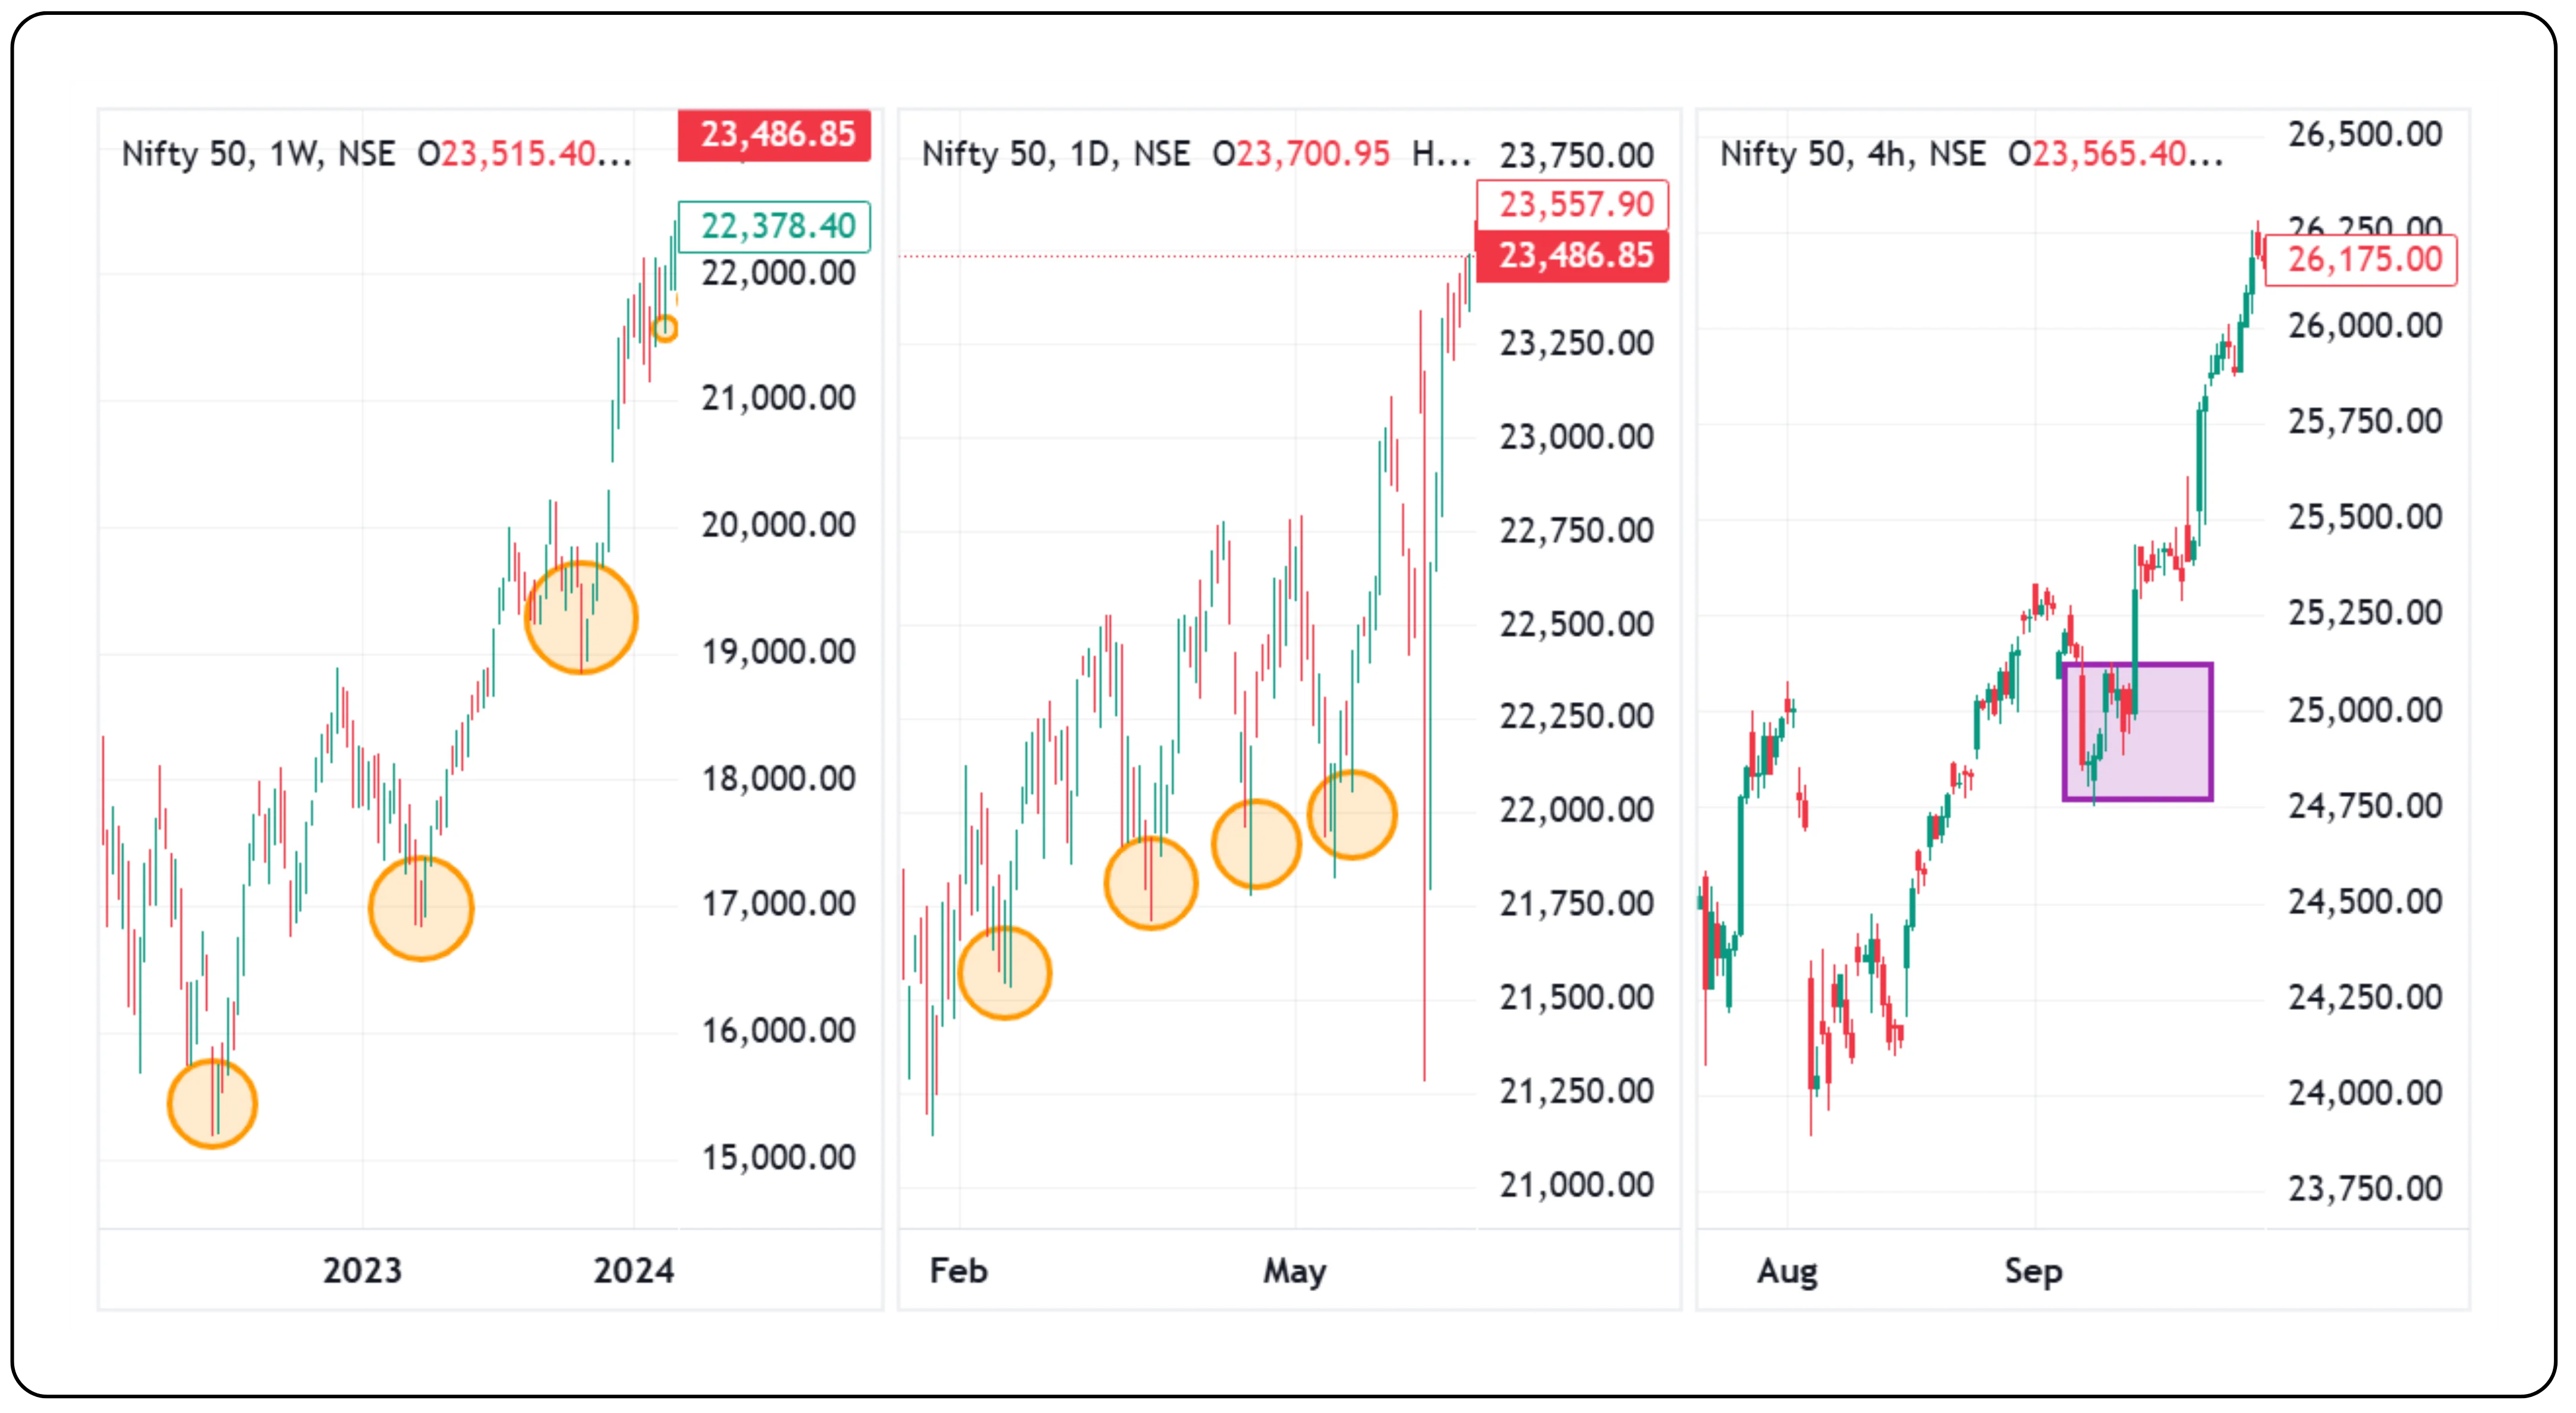
Below is all the time frame chart for a quick overview.
Let’s apply this concept to the Nifty 50 chart, specifically from a positional trading perspective.
1. Weekly chart (Primary trend):
The weekly chart of Nifty 50 clearly shows that the primary trend remains upward. Since 2023, the index has been forming higher highs without any lower tops, indicating that the long-term trend is intact. For positional traders or investors, this serves as a reliable anchor for decision-making. The chart below, covering the period from March 2023 to July 2024, reflects this consistent uptrend.

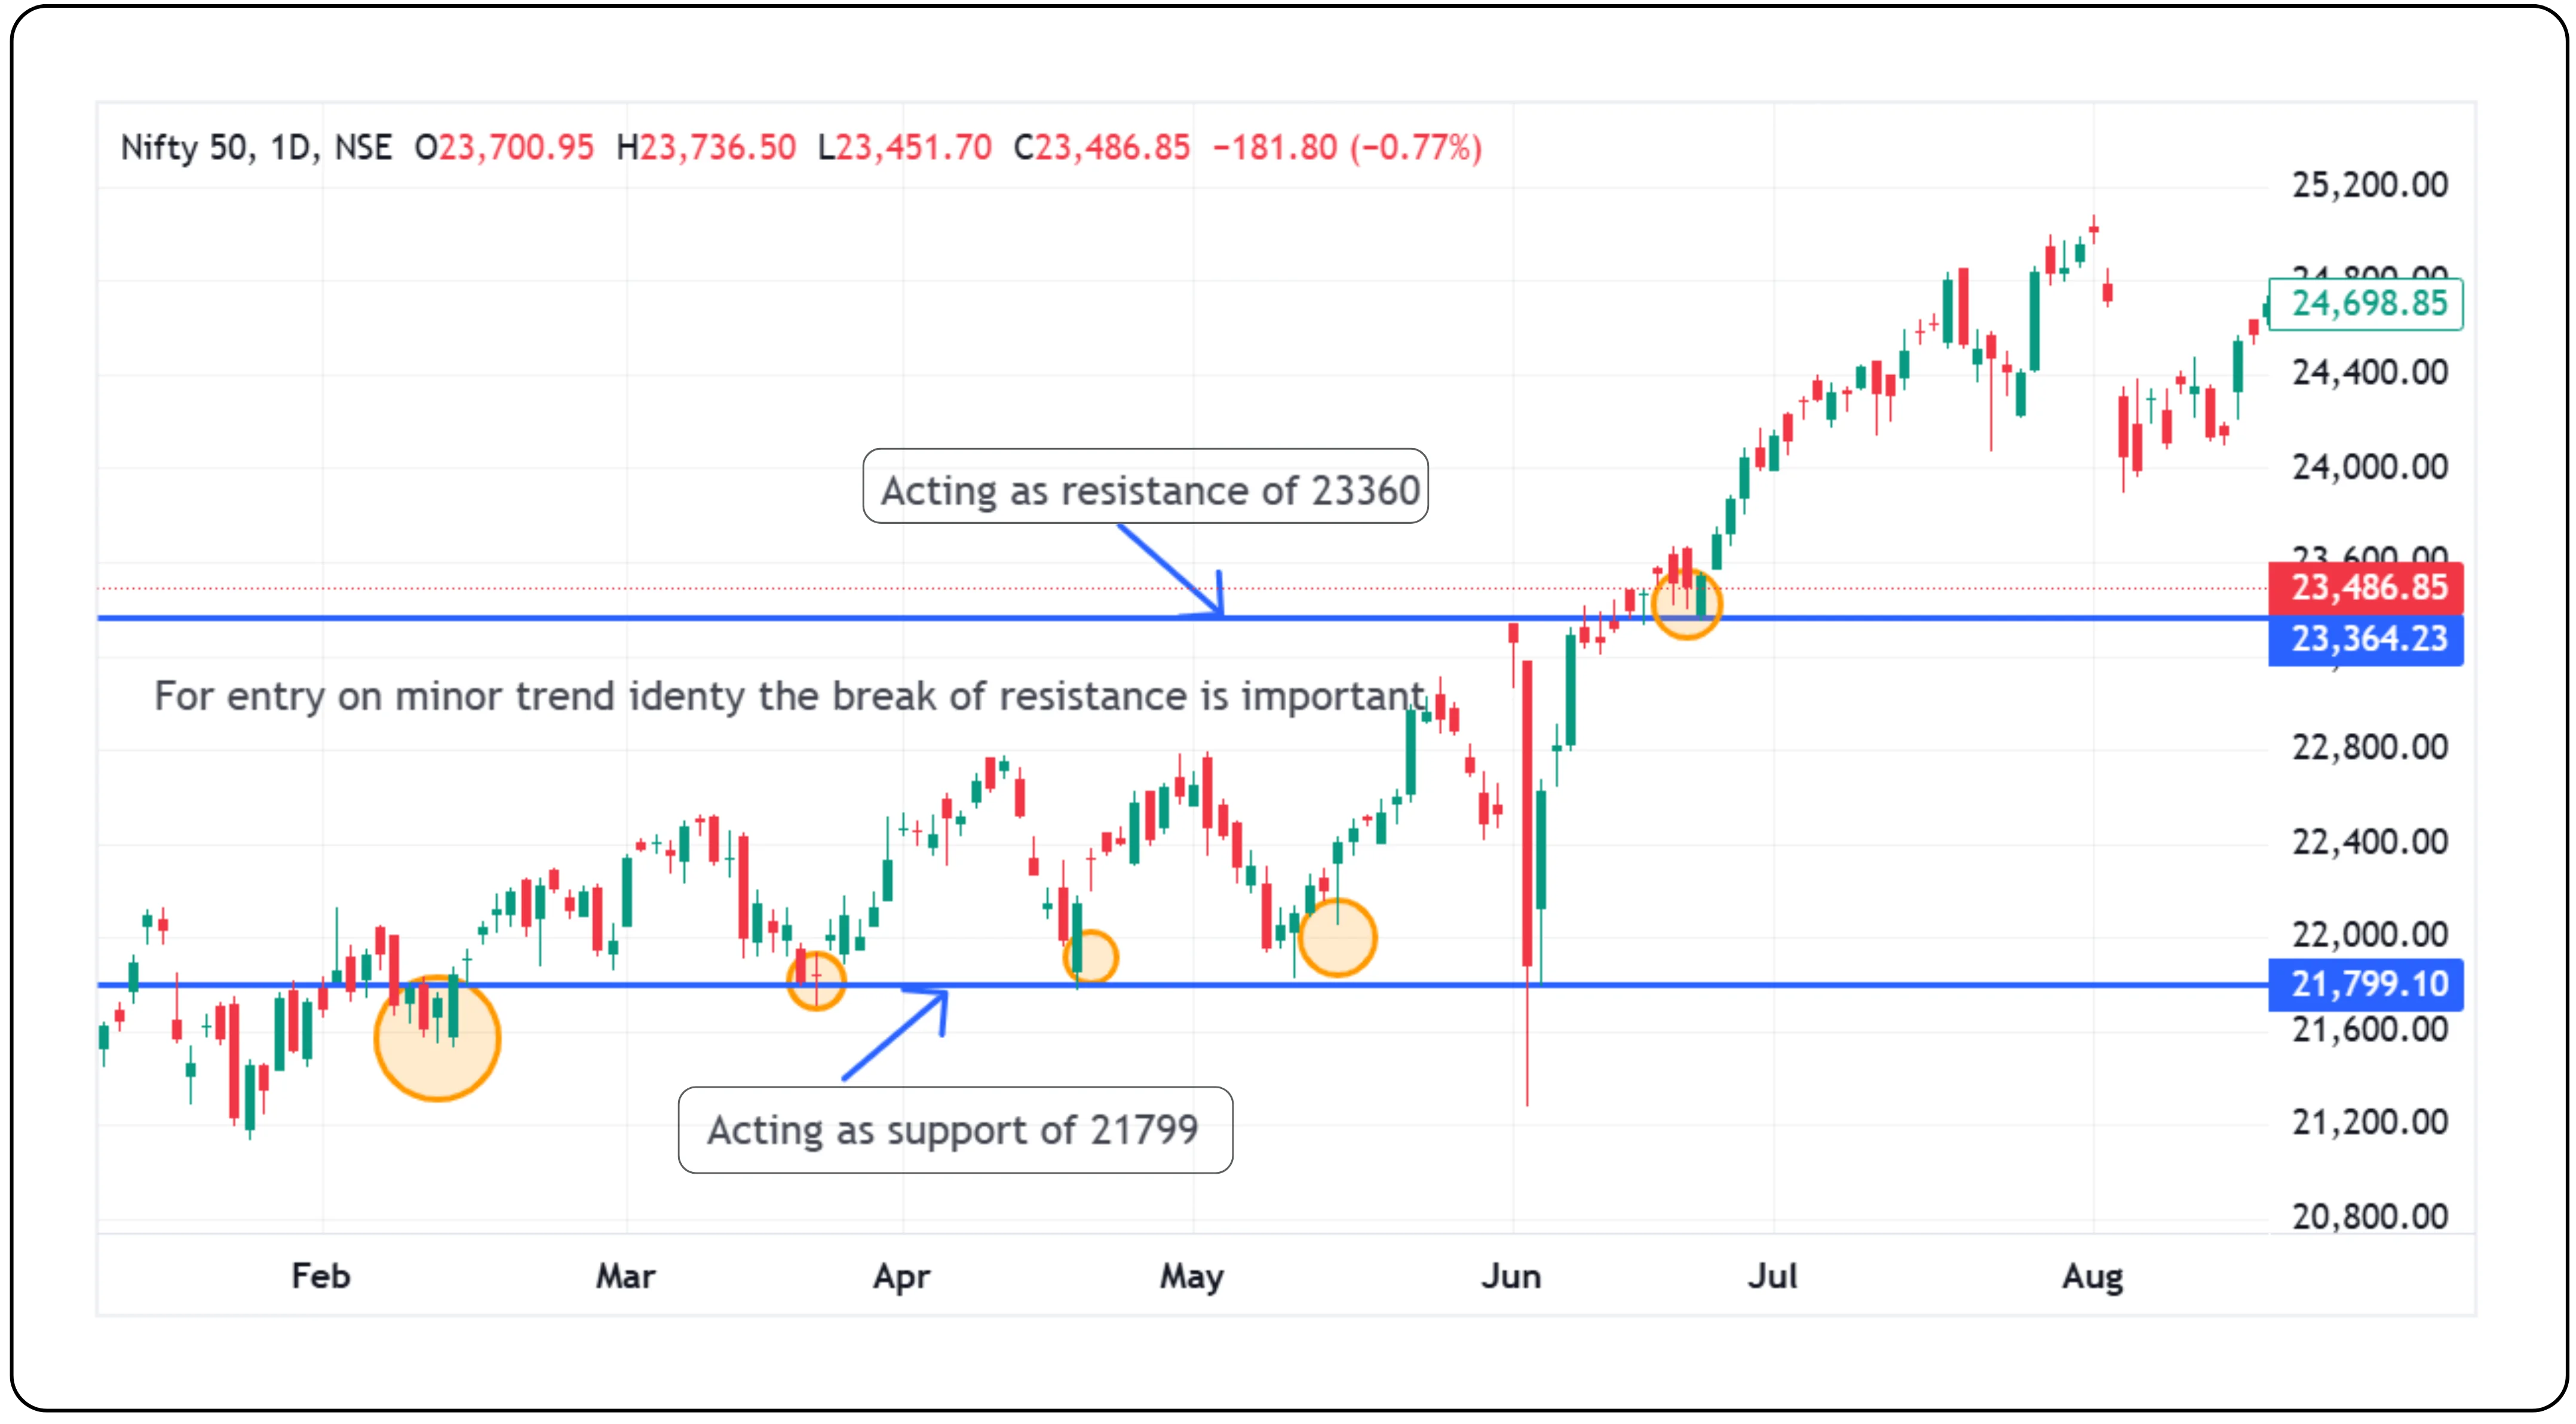
2. What is Secondary trend:
The secondary trend always moves within the broader primary trend. On the daily chart, a gradual upside was observed between February 2024 and June 4, 2024. This steady movement was followed by a sharp rally, which began around the same level, 23,364, where a pullback was earlier noted on the weekly chart.
For positional traders, it’s important to avoid fresh allocations during a weekly correction and instead wait for clear signs of momentum resuming before re-entering.
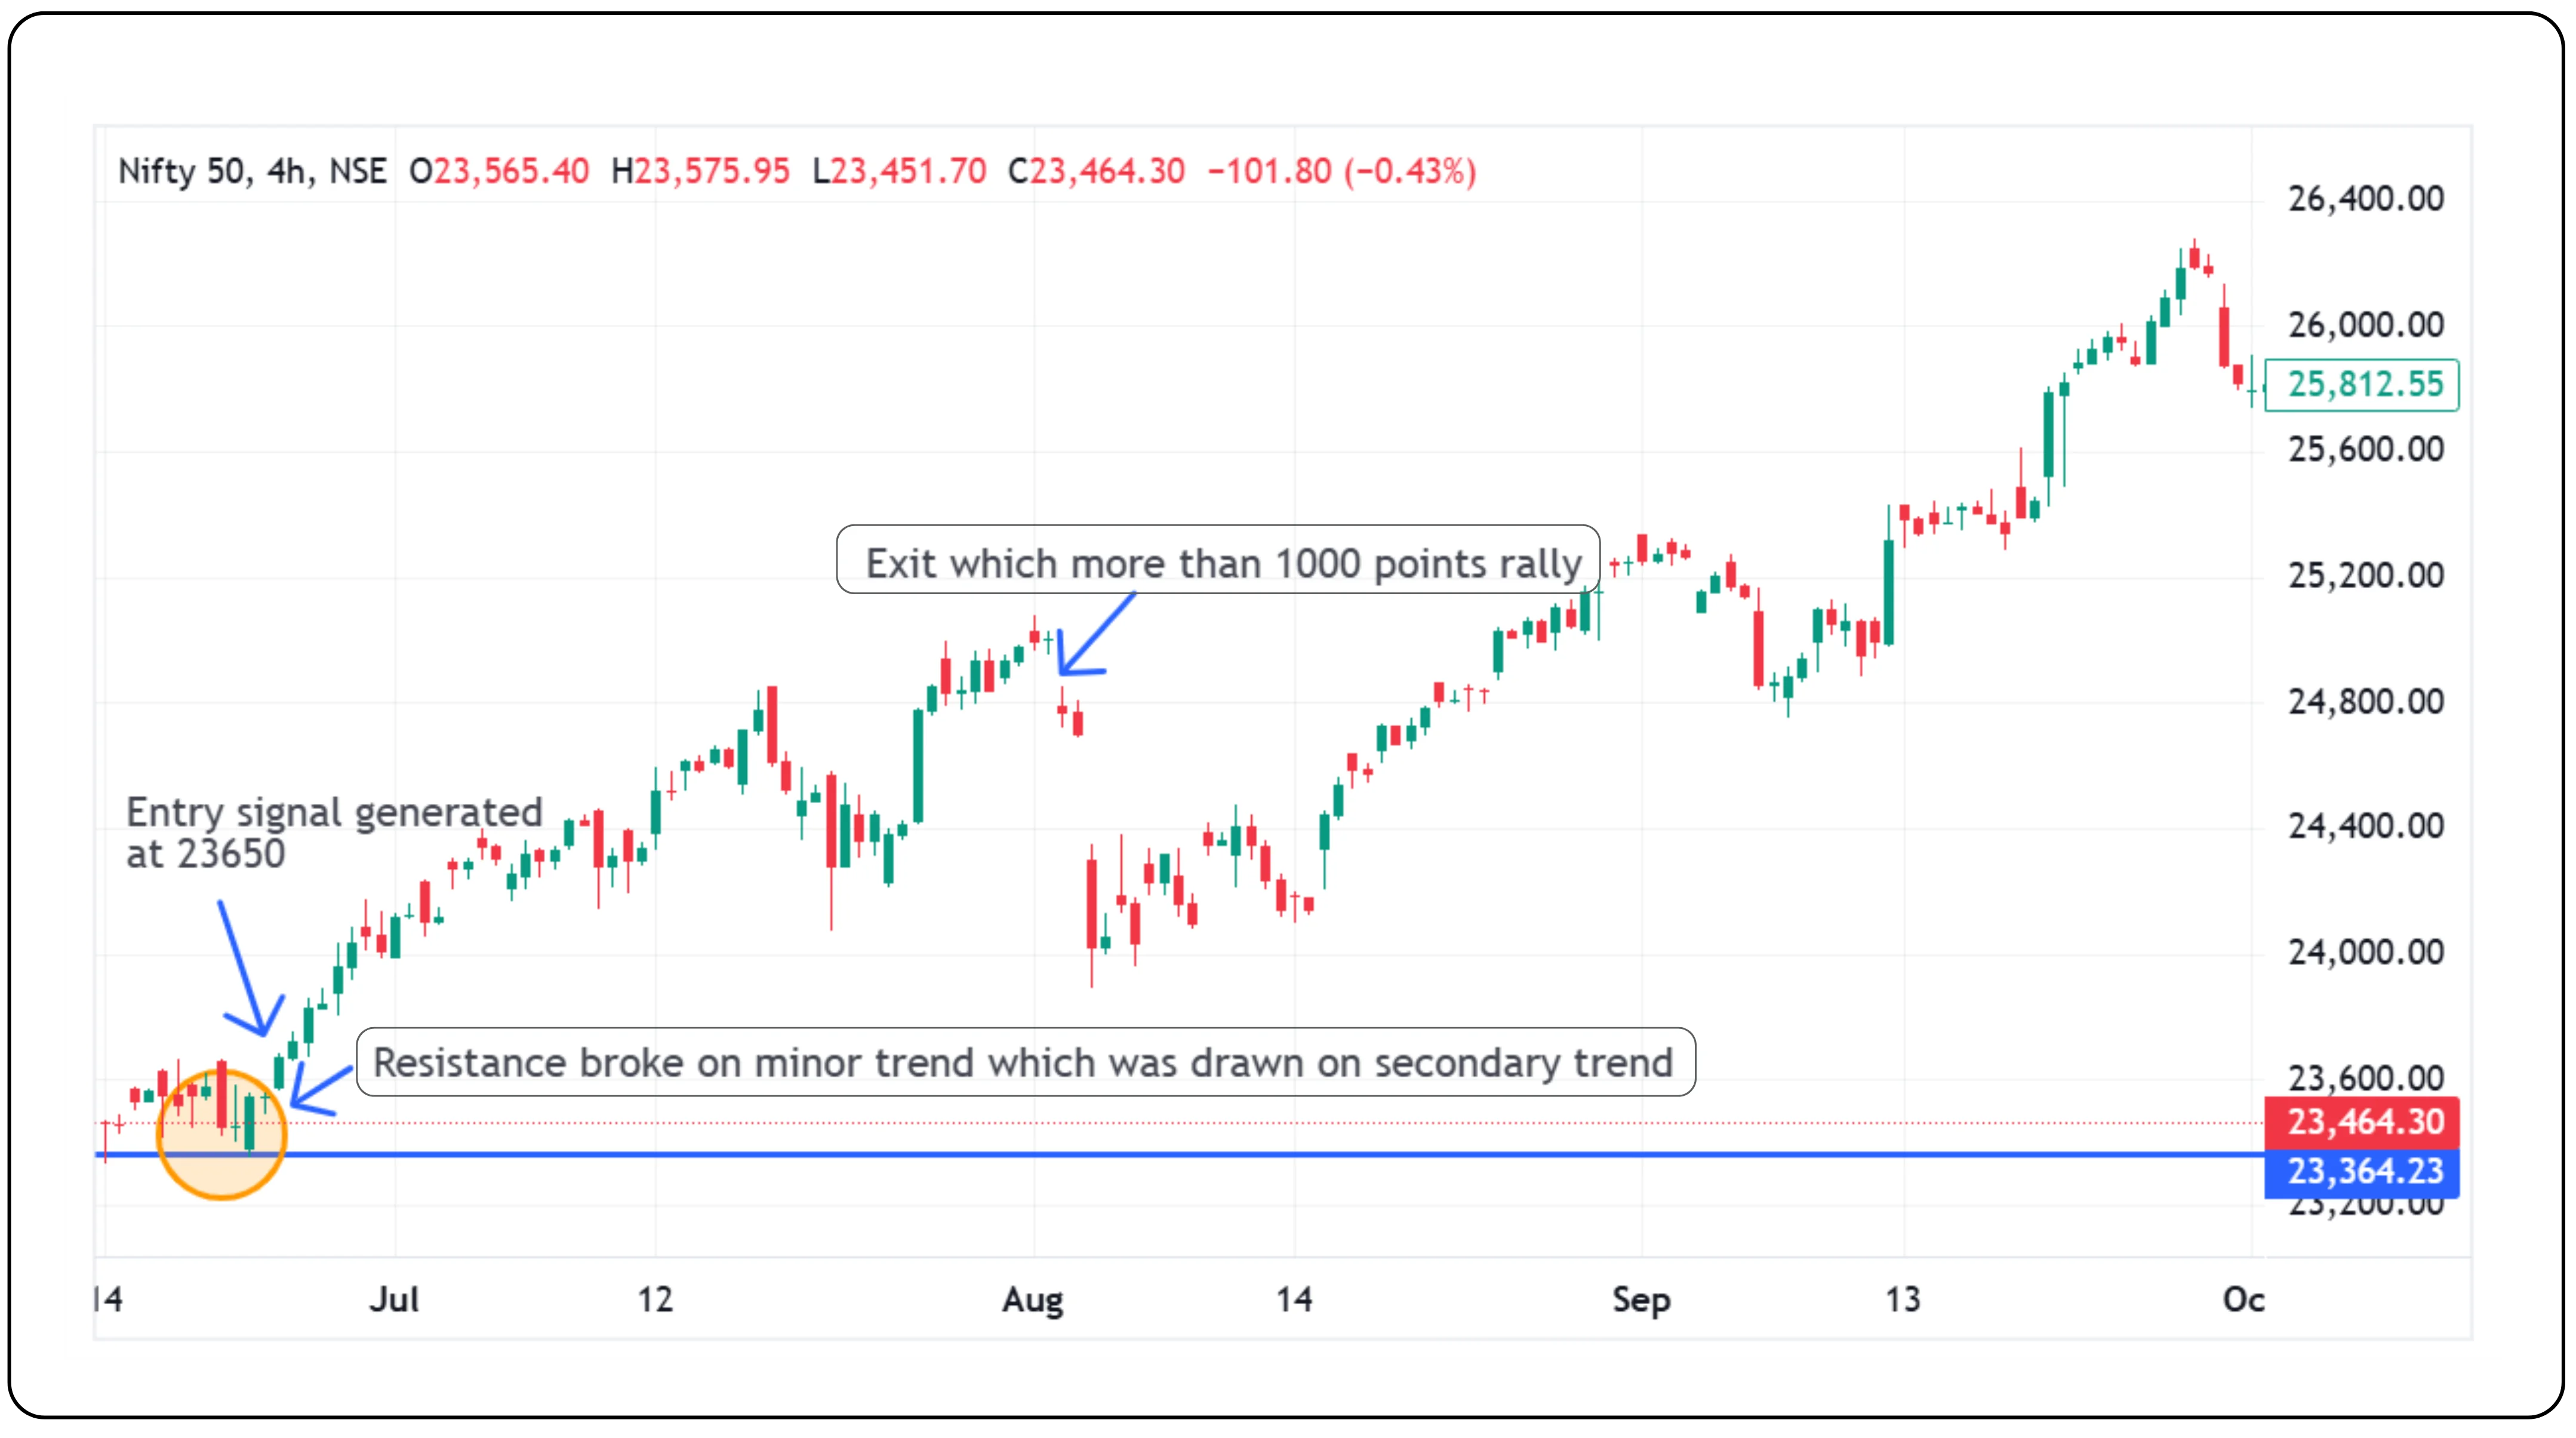
3. What is Minor trend:
A minor trend is a smaller movement within the secondary trend and is crucial for timing precise trade entries. On the 4-hour chart, a candle closed above the resistance drawn from the secondary trendline. Once the high of the marked candle from August 16, 2024, is breached, and the price breaks out of the correction in line with both the primary and secondary trends, it indicates a potential buying opportunity.
Also read: How to Trade in Options with Small Capital
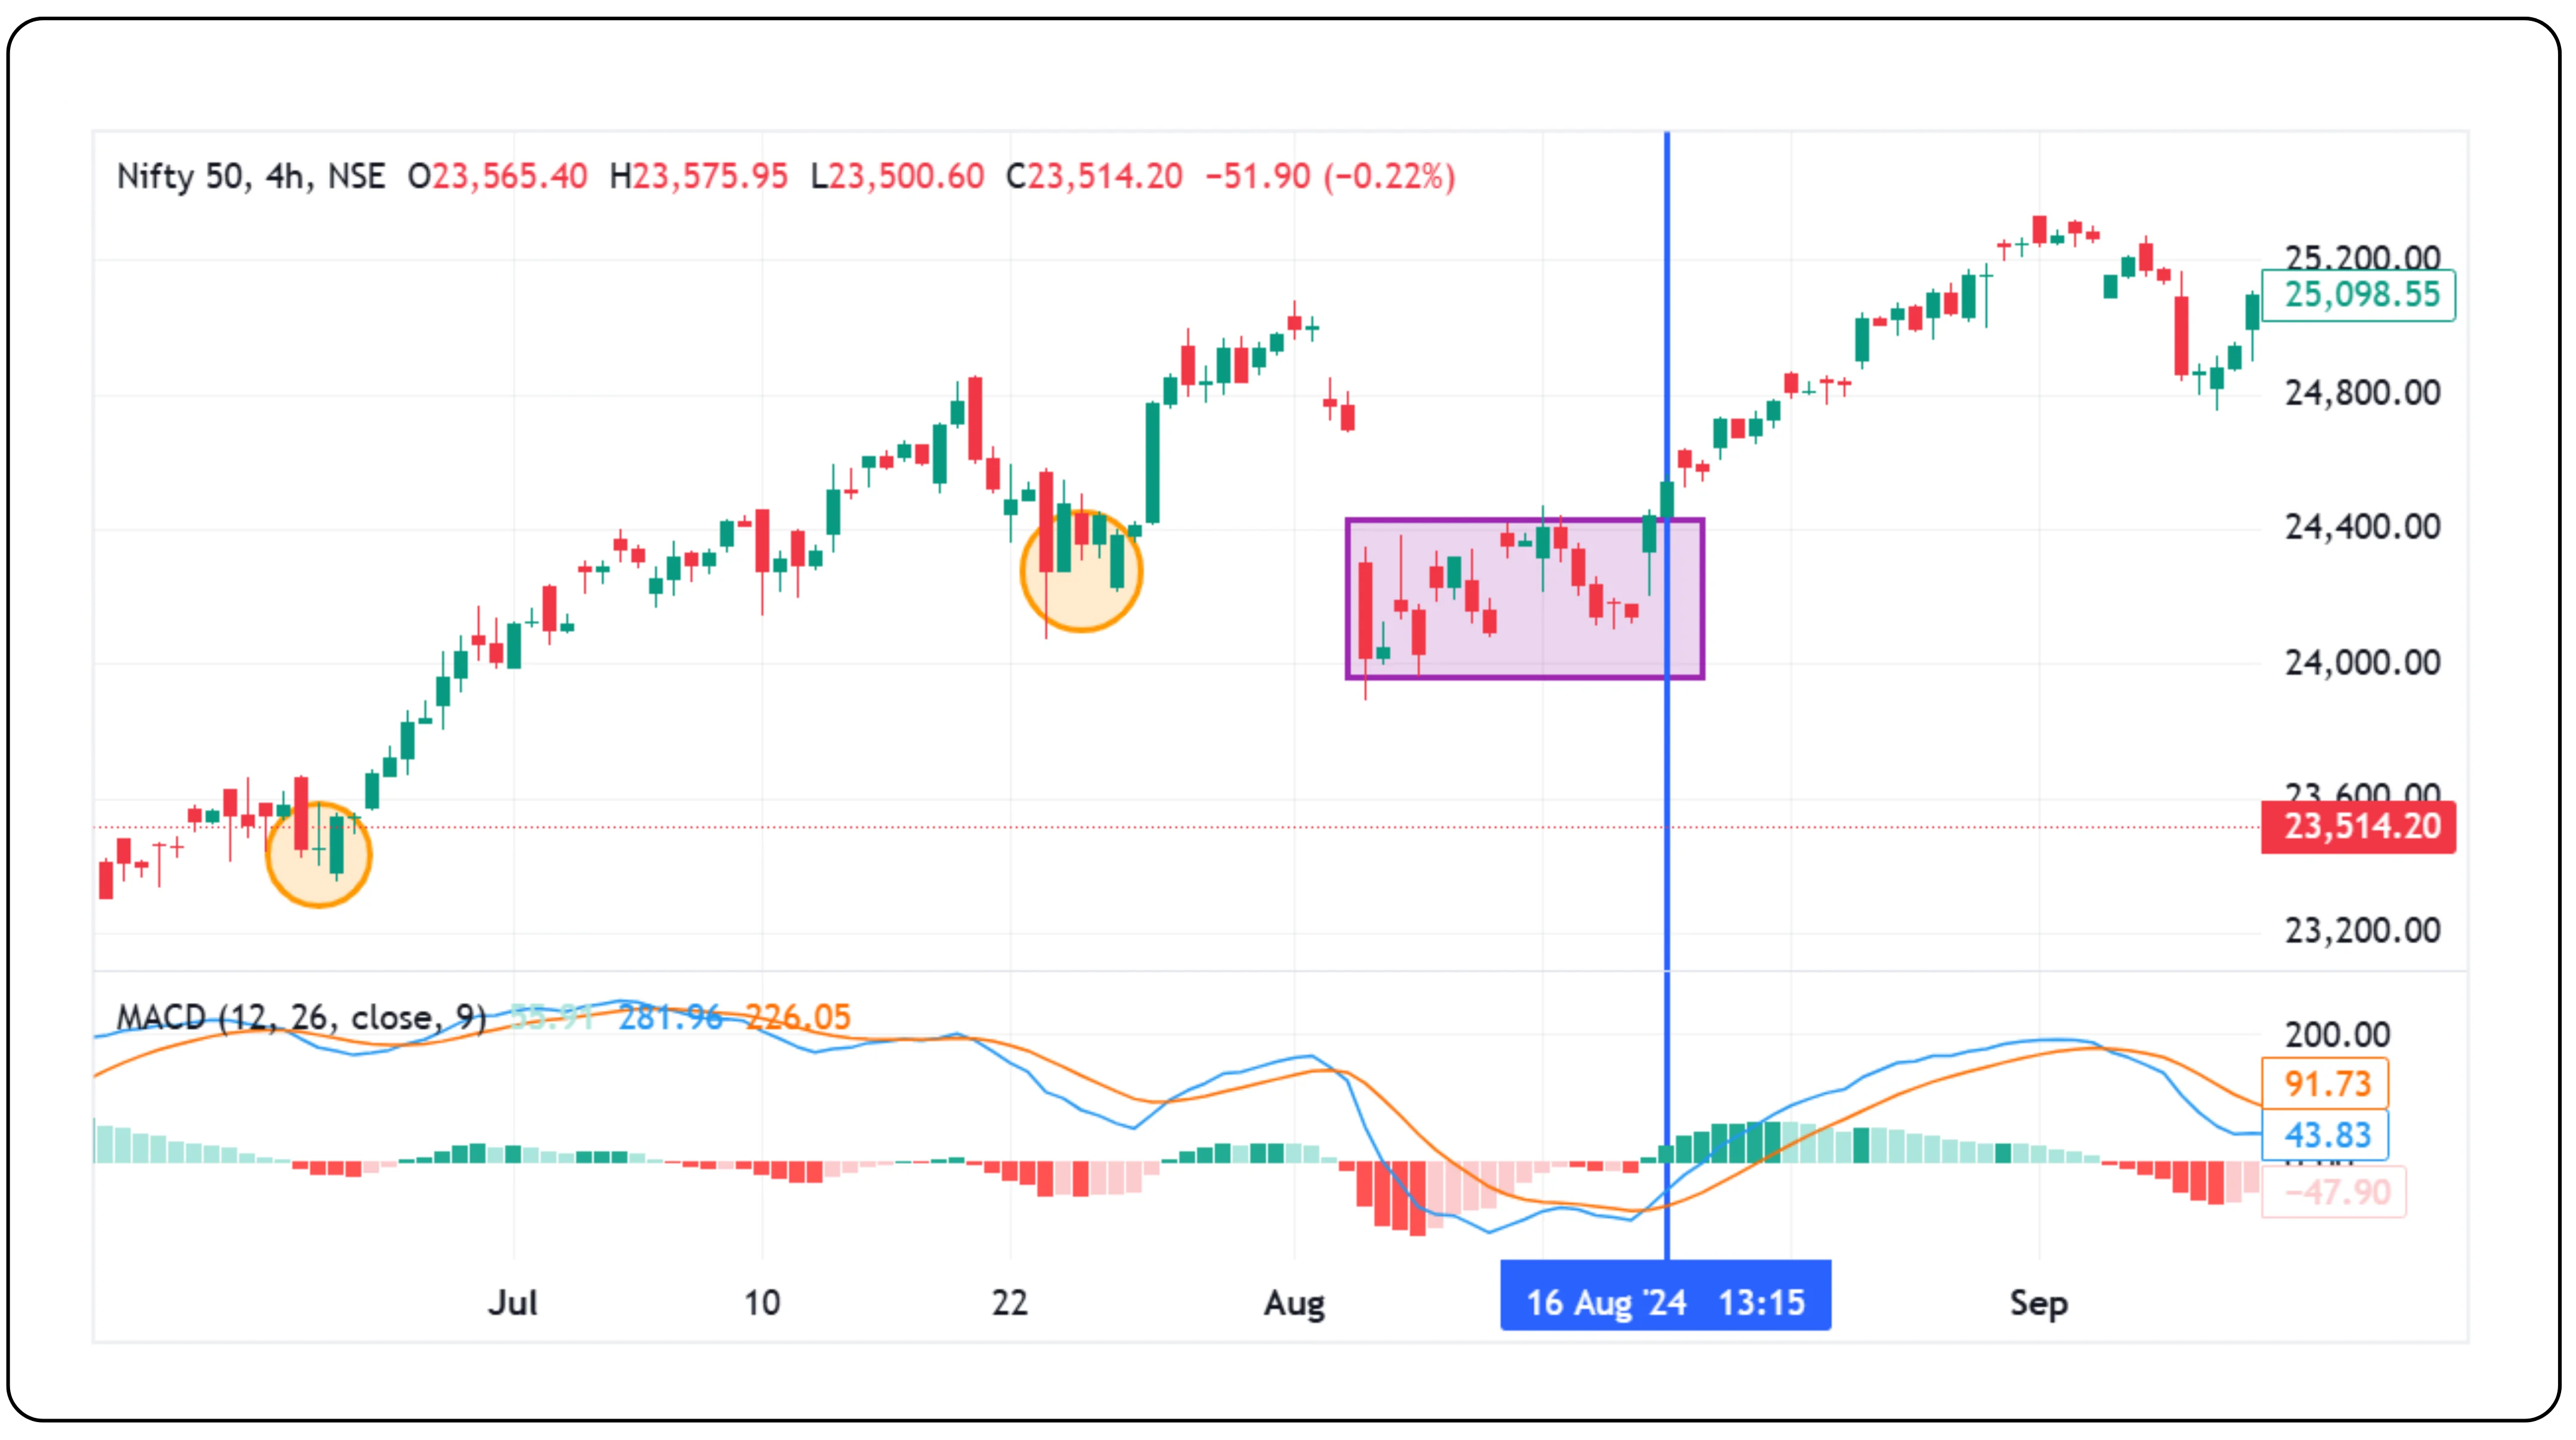
After exiting a trend, if a pullback is observed on the chart, traders can use supporting indicators to confirm the setup. The minor trend often shows a phase of consolidation before the broader trend resumes in line with the primary and secondary trends. This can offer a fresh opportunity for re-entry, allowing traders to stay aligned with the overall market direction.
After exiting the trade, when a trader notices a pullback on the chart, they can confirm it using supporting indicators. The minor trend often reflects consolidation before the trend resumes in line with the primary and secondary trends. This presents another opportunity for the trader to consider re-entering the market.
Also read: Capital Market Instruments
Why time frame discipline separates winning traders
The biggest edge in multi-time frame analysis lies in staying true to the higher trend. When the primary trend is bullish, resist the urge to short, even if lower time frames suggest otherwise. Similarly, don’t go long in a bearish market just because a minor chart shows a bounce. Following the dominant trend across time frames helps avoid false signals and keeps your trading aligned and effective.
Also read: How India’s Securities Market Channels Capital into Growth
Disclaimer: The information provided in our blogs is for informational purposes only and should not be construed as financial, investment, or trading advice. Trading and investing in the securities market carries risk. Always conduct your own research and consult with a qualified financial advisor before making any investment decisions. Past performance is not indicative of future results. Copyrighted and original content for your trading and investing needs.
© 2025 — Tradejini. All Rights Reserved.


