


Have you ever seen a stock suddenly shoot up and thought, ‘I wish I knew that before’? We have all felt that. What if there was a tool that could tell you, ‘This stock is starting to move,’ even before others notice?
That’s where CubePlus by Tradejini comes in.
What’s CubePlus RRG chart?
CubePlus is Tradejini’s smarter trading platform that helps you spot strong stocks faster. One of the standout features is something called an RRG chart, short for Relative Rotation Graph. Sounds fancy, but it’s actually super helpful.
Think of it like a map that shows how stocks are doing compared to others in the same group, whether it’s Nifty 50, Nifty Auto, or any other sector. It helps you see which stocks are just getting started on a strong momentum move, which are slowing down, and which ones might be ready to turn around. Or even consider when you have the delivery of the stock and due to the quadrant RRG chart, it is helpful to even cut the position on time.
How Hero MotoCorp popped up on radar
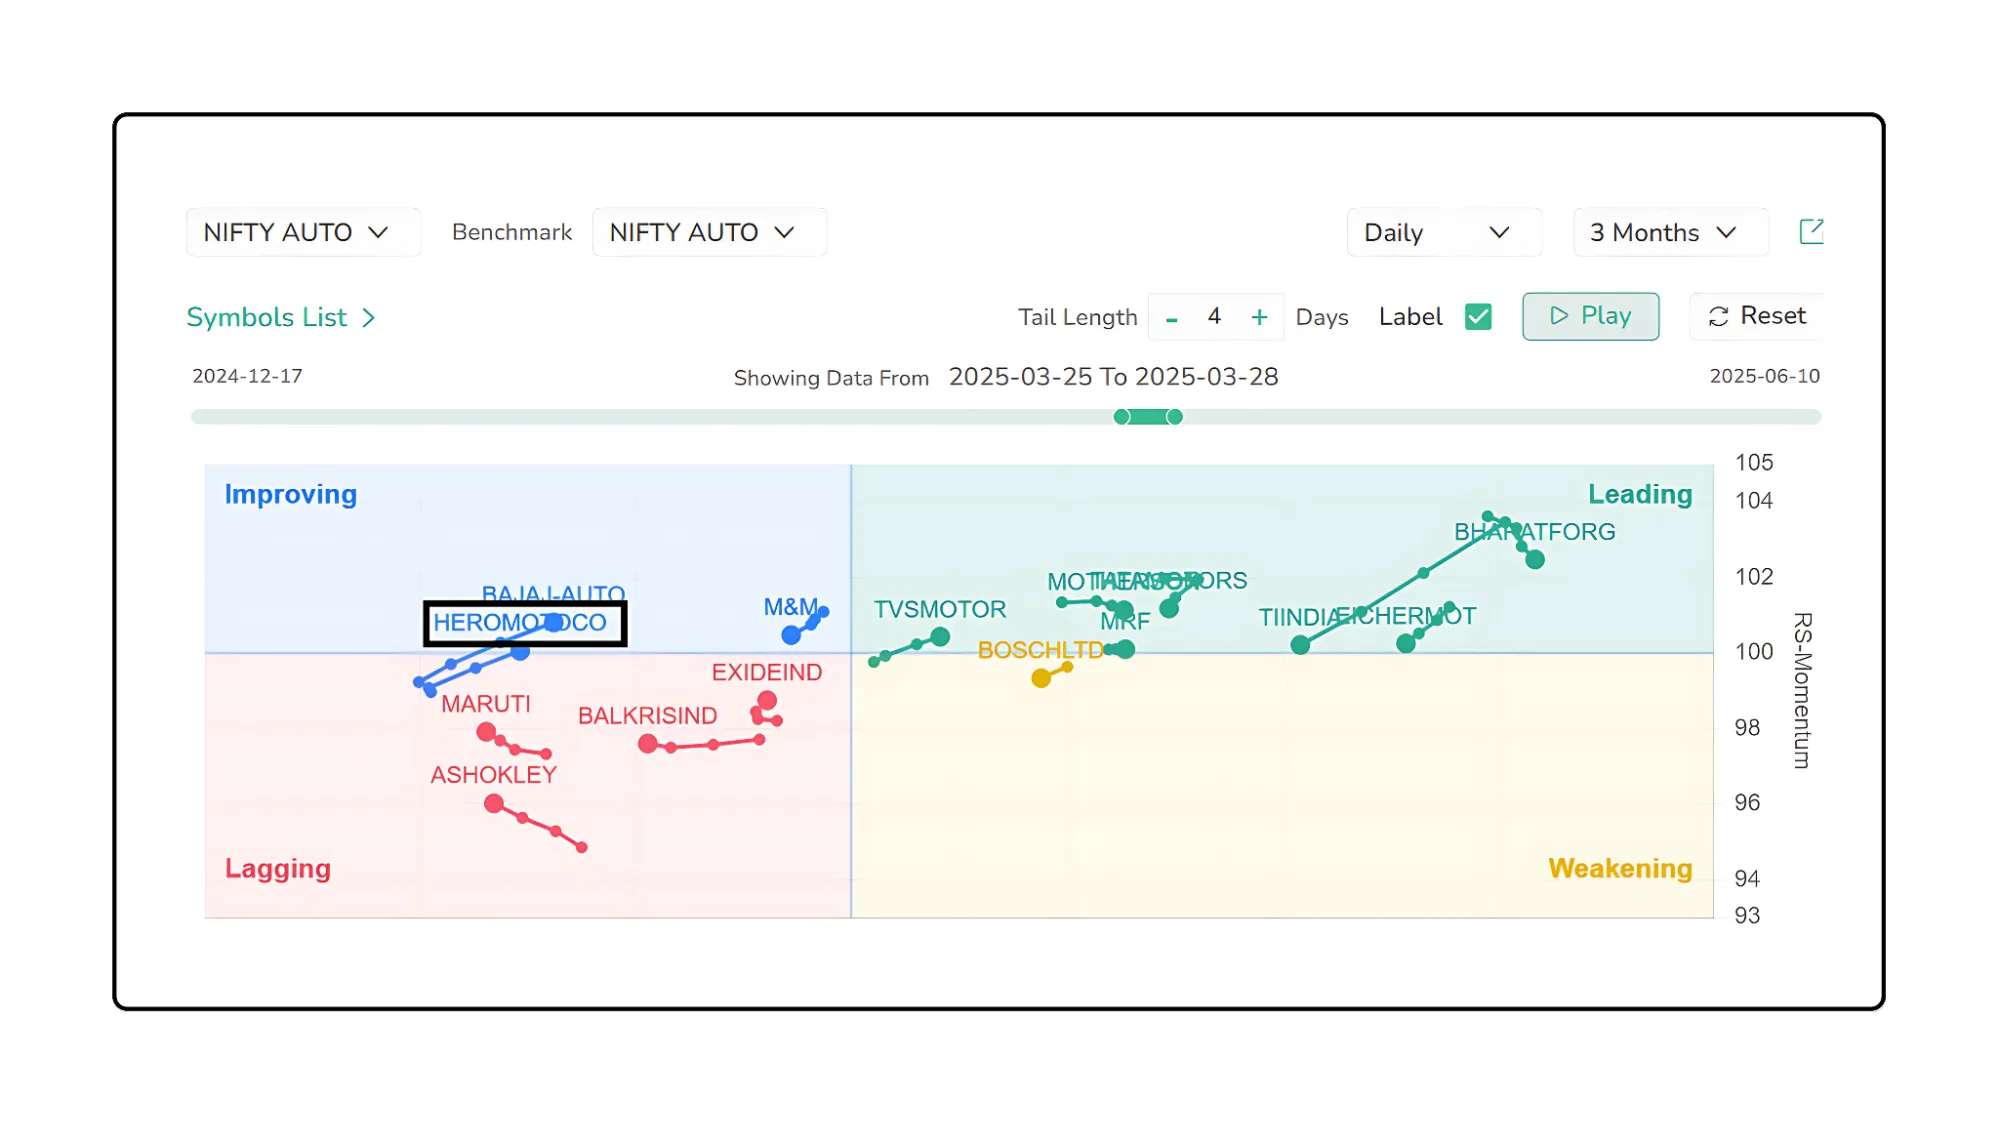
Here’s a real example. Using RRG chart, Hero MotoCorp got automatically highlighted when it started shifting from the 'Lagging' section to the ‘Improving’ section. It basically signaled the stock was gaining momentum .
Normally, anyone finding the breakout stock has to manually do lots of screening on charts to catch something like this. The below image reflects how the Hero MotoCorp shifted from the lagging to improving quadrant, giving the sign of looking into stock closely.
The Chart Backed It Up
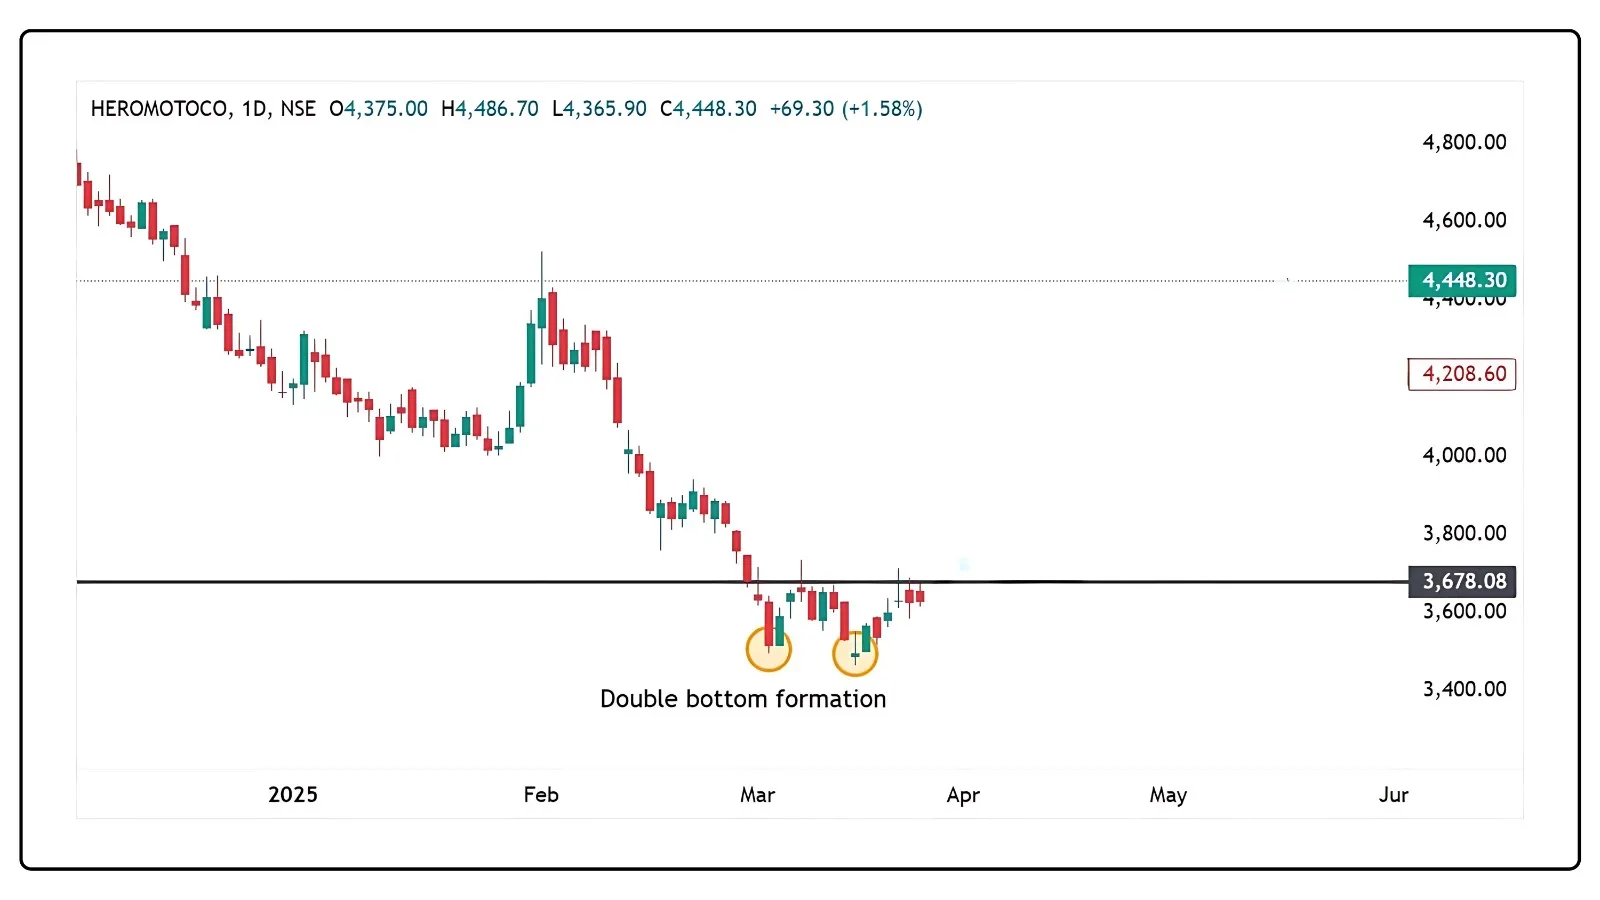
Once Hero MotoCorp was flagged, we looked at its price chart. And guess what? The timing couldn’t have been better. Around 18th March 2025, the stock was forming a double bottom a classic pattern that often signals a bounce or reversal.
So now we had two clear signals:
The RRG chart said the stock was gaining strength.
The price chart said a bounce was likely
That combo gave traders a pretty confident reason to enter the trade as seen in the image below.
Missed the First Entry? There Was a Second Chance
If you didn’t jump in right away, there was another chance.
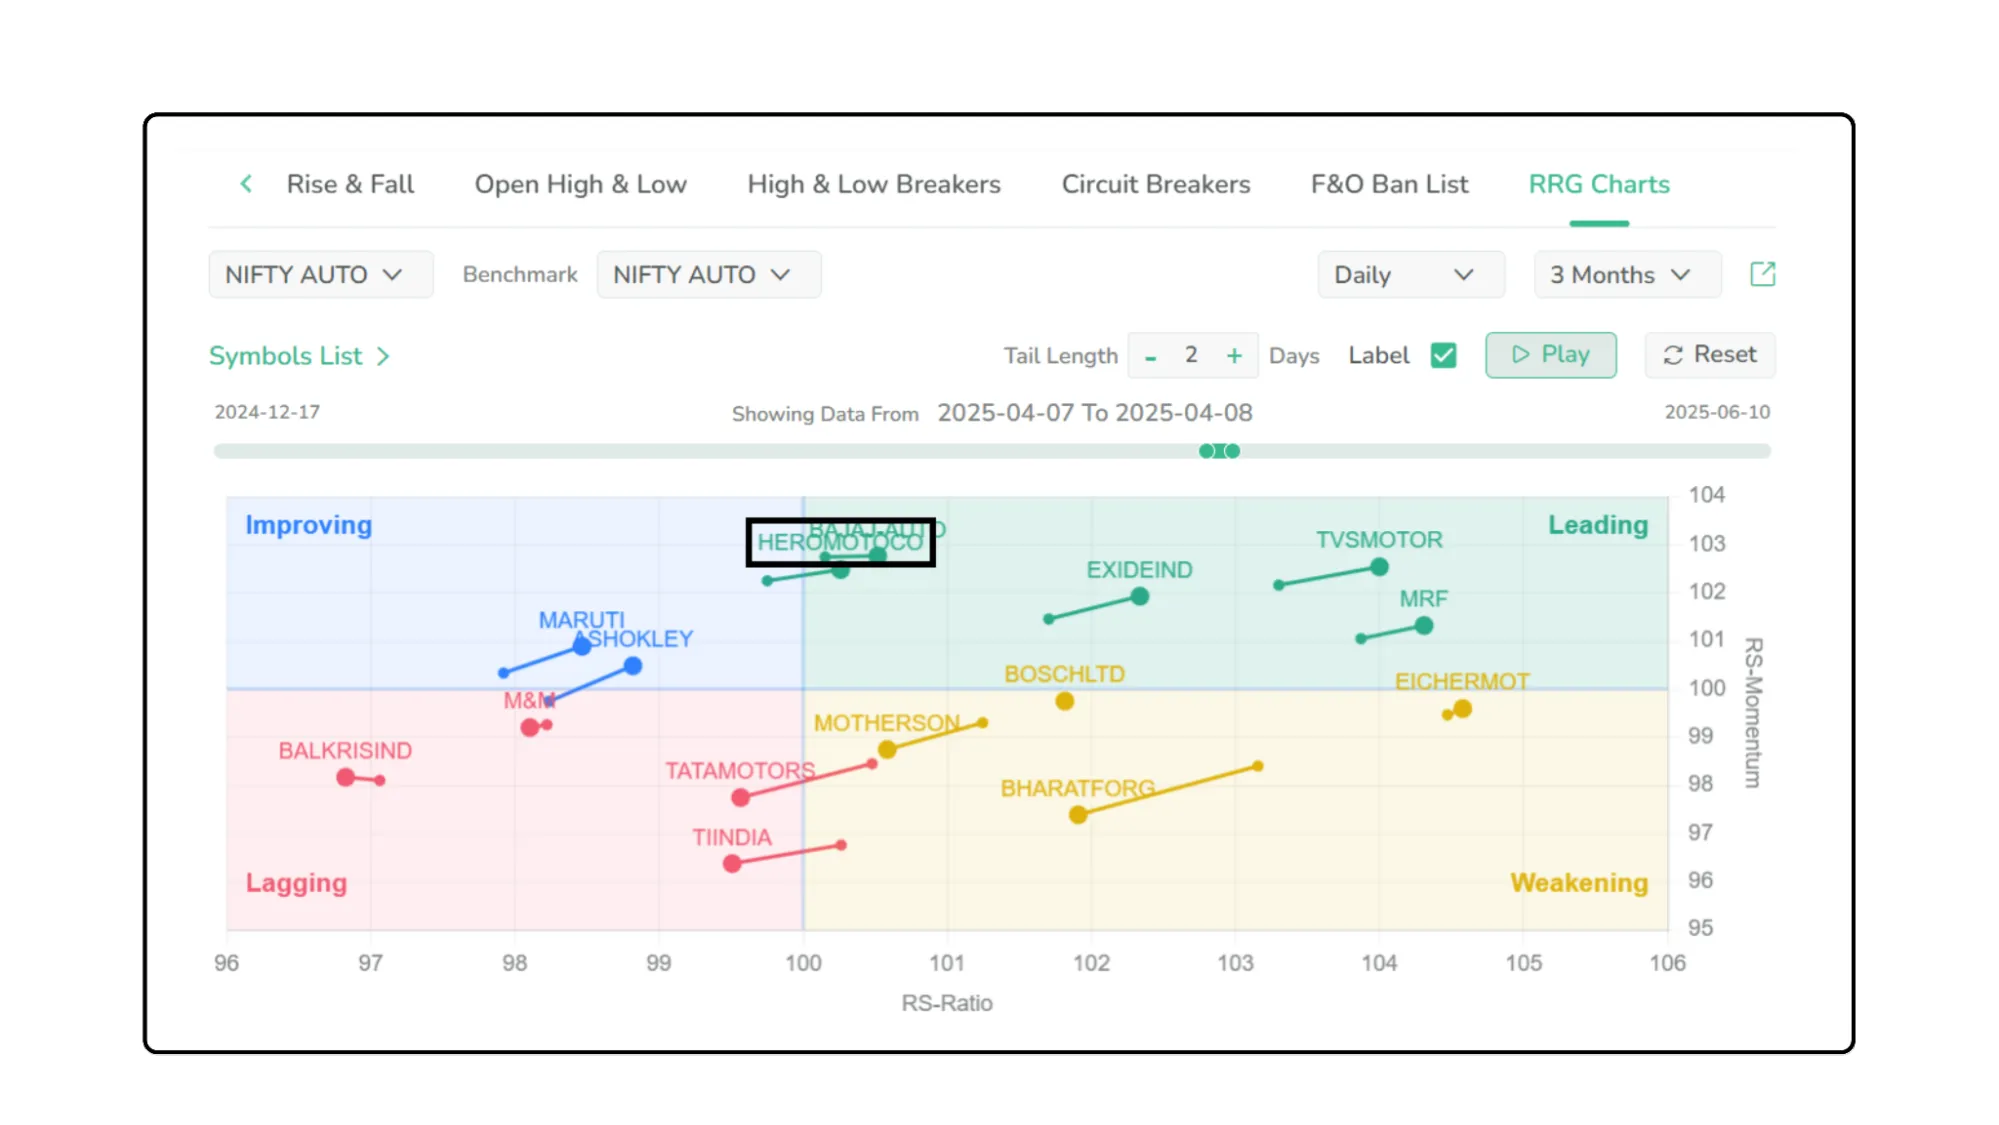
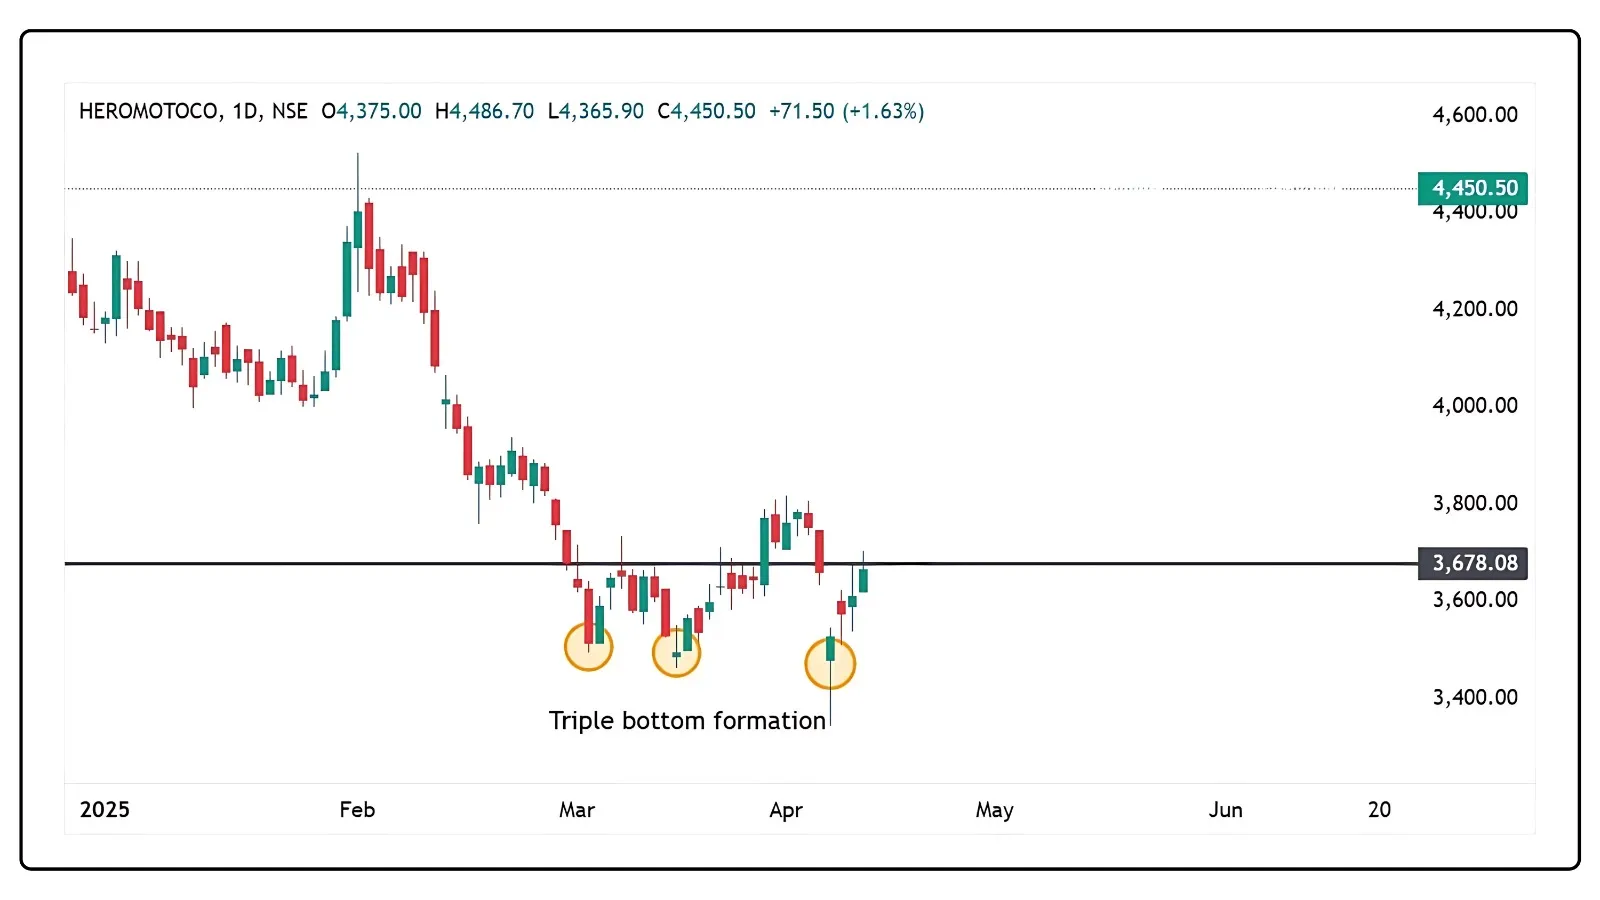
By 7th April, the chart showed a triple bottom which was another strong pattern. A few days later, by 11th April, Hero MotoCorp moved from ‘Improving’ to ‘Leading’ on the RRG chart, which was showing it was now one of the top-performing stocks in its group.
And when the stock broke above its neckline on 15th April, that was the final green light.
Traders who got in around ₹3715 saw it rise to around ₹4384 that’s a nice gain of nearly ₹700 per stock which is clearly seen in the below image
The best part? The RRG chart kept backing the trade the whole way through.
Why this RRG tool is so useful
Here’s what makes it a game-changer:
It scans the entire market for you using smart indicators
Flags high-potential stocks quickly, no guesswork needed
Combines really well with simple chart patterns
Tracks momentum shifts across different sectors and timeframes
So instead of spending hours analysis on charts or second-guessing yourself, you can let CubePlus do the heavy lifting. It gives you solid clues on where the momentum might be and when the charts confirm it, you’ve got a pretty strong case.
How a smart tool turned market noise into opportunity
The Hero MotoCorp trade perfectly shows how combining chart patterns like double and triple bottoms with RRG can give traders a real edge and make portfolio look more green. While the price didn’t scream 'buy' at first, the RRG chart quietly showed a shift from 'lagging' to 'leading' signaling growing momentum and strength. This wasn’t about luck but about using the right tools to spot opportunities early. CubePlus made it easier by scanning and surfacing this move before it became obvious. Hero MotoCorp is just one example of how smart tools and clean setups can help you trade with more confidence and clarity
Also Read:Relative Rotation Graph (RRG) Explained
Disclaimer: The information provided in our blogs is for informational purposes only and should not be construed as financial, investment, or trading advice. Trading and investing in the securities market carries risk. Always conduct your own research and consult with a qualified financial advisor before making any investment decisions. Past performance is not indicative of future results. Copyrighted and original content for your trading and investing needs.
©️ 2025 — Tradejini. All Rights Reserved.