Most traders spend hours tweaking indicators like RSI, MACD, or Bollinger Bands while completely ignoring the simplest indicator on the chart, volume.
Here's the thing: price tells you what happened, but volume tells you how much conviction was behind it. That's why professional traders never look at price alone.
The Indicator Everyone Scrolls Past
Open almost any retail trader's chart, and you will probably find moving averages, RSI, MACD, Supertrend, Fibonacci levels, and plenty of other indicators. But look at the bottom of the chart. Those green and red bars? Most traders barely notice them. That's volume. Ironically, it's one of the few indicators that isn't derived from price. It's actual market activity.
Imagine driving a car while watching only the speedometer but ignoring the fuel gauge. You know how fast you are moving, but you don't know whether there is enough fuel left to continue.
Trading without volume is the same. Price may be rising or falling, but unless volume supports that move, you don't know whether it's being driven by genuine buying and selling or simply short-term speculation.
In simple terms, volume means the number of shares traded during a particular candle or time period. It doesn't tell you where price will go next. Instead, it tells you how much participation and conviction exists behind the move. High participation usually means institutions are involved. Low participation often means they aren't.
Missed part 1? Read here: https://www.tradejini.com/blogs/why-do-most-investors-buy-high-and-sell-low
Why Relative Volume Matters More Than Absolute Volume?
One of the biggest mistakes beginners make is looking at the volume number itself.
‘Today's volume is 50 lakh shares.’
Is that high?
Low?
Normal?
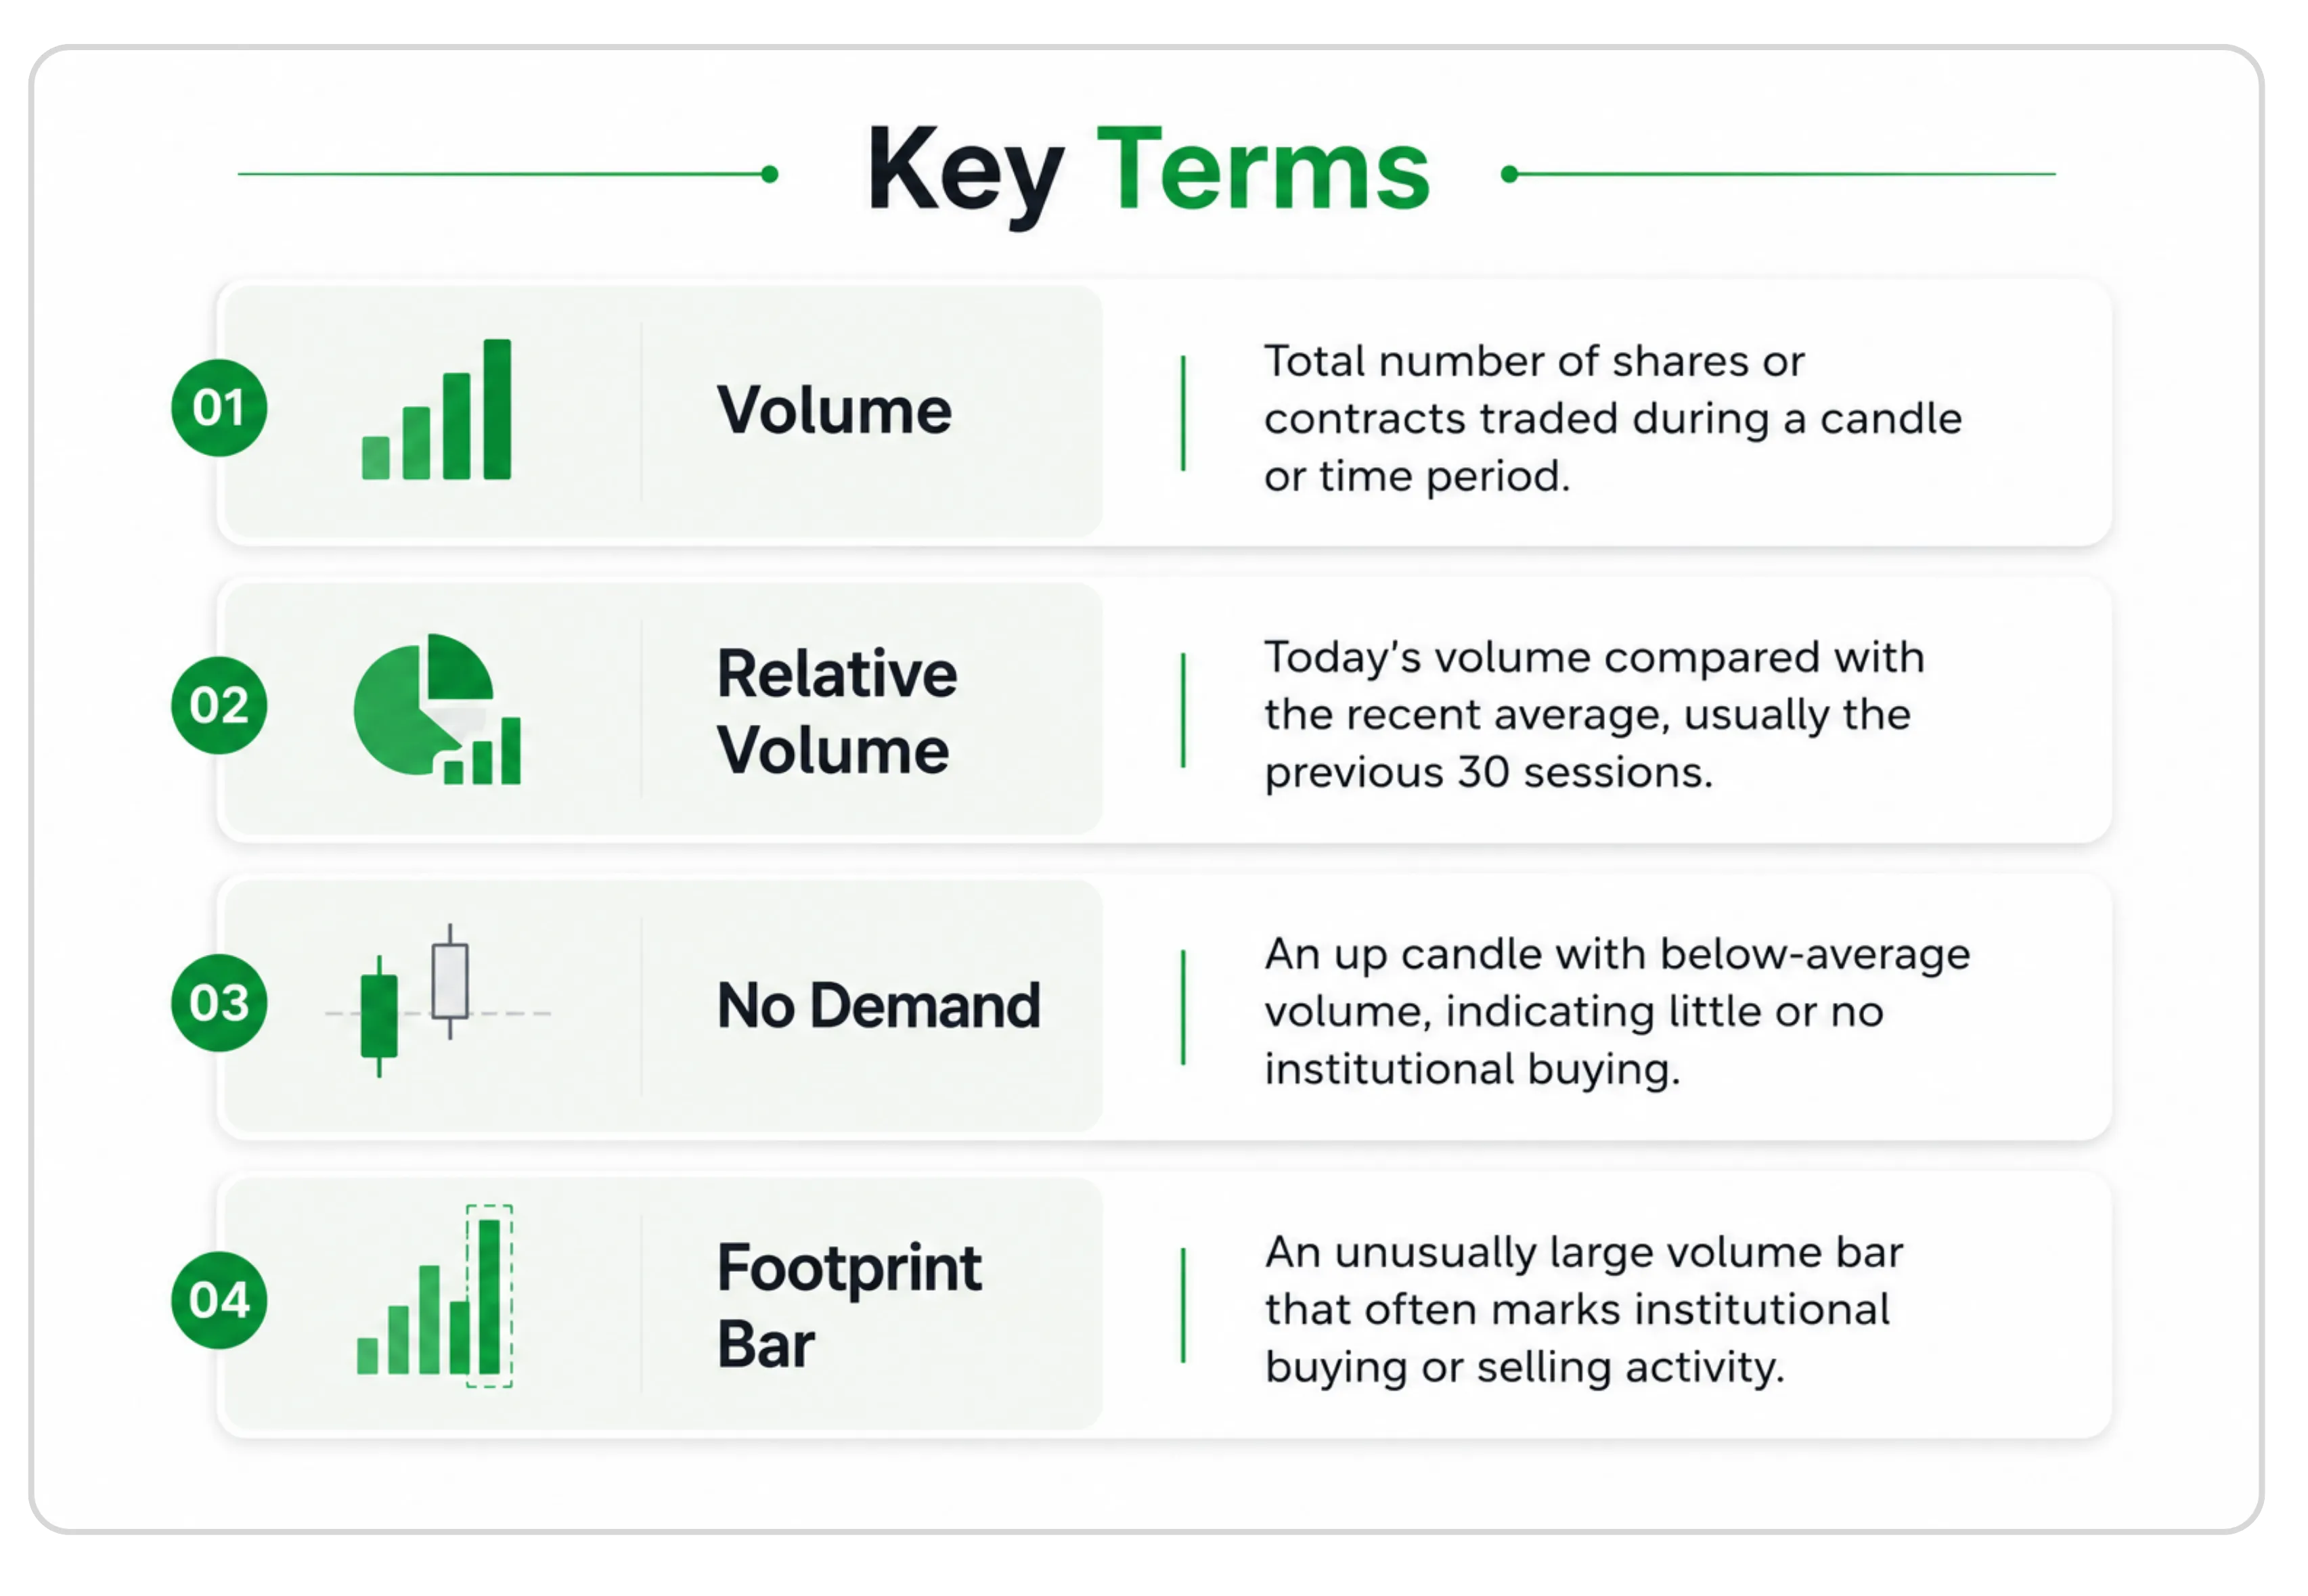
Without context, the number means nothing. Volume only becomes meaningful when compared with recent history. In Volume Spread Analysis (VSA), traders compare today's volume against roughly the previous 30 trading sessions.
Tom Williams, the pioneer of VSA, explained it with a simple analogy. Imagine thirty people standing in a line. The tallest person is easy to spot because everyone else provides context. A single person standing alone doesn't tell you whether they are tall or short.
Volume works the same way. Today's volume matters only when compared with yesterday's and the previous weeks.
Example
HDFC Bank usually trades around 1 crore shares on an average day. Now imagine one session where volume suddenly jumps to 3 crore shares. That unusually tall volume bar isn't random.
It often signals that large institutional participants, mutual funds, FIIs, DIIs, or other professional traders have entered the market. Those are the footprints VSA traders pay attention to.
What Different Volume Levels Tell You?
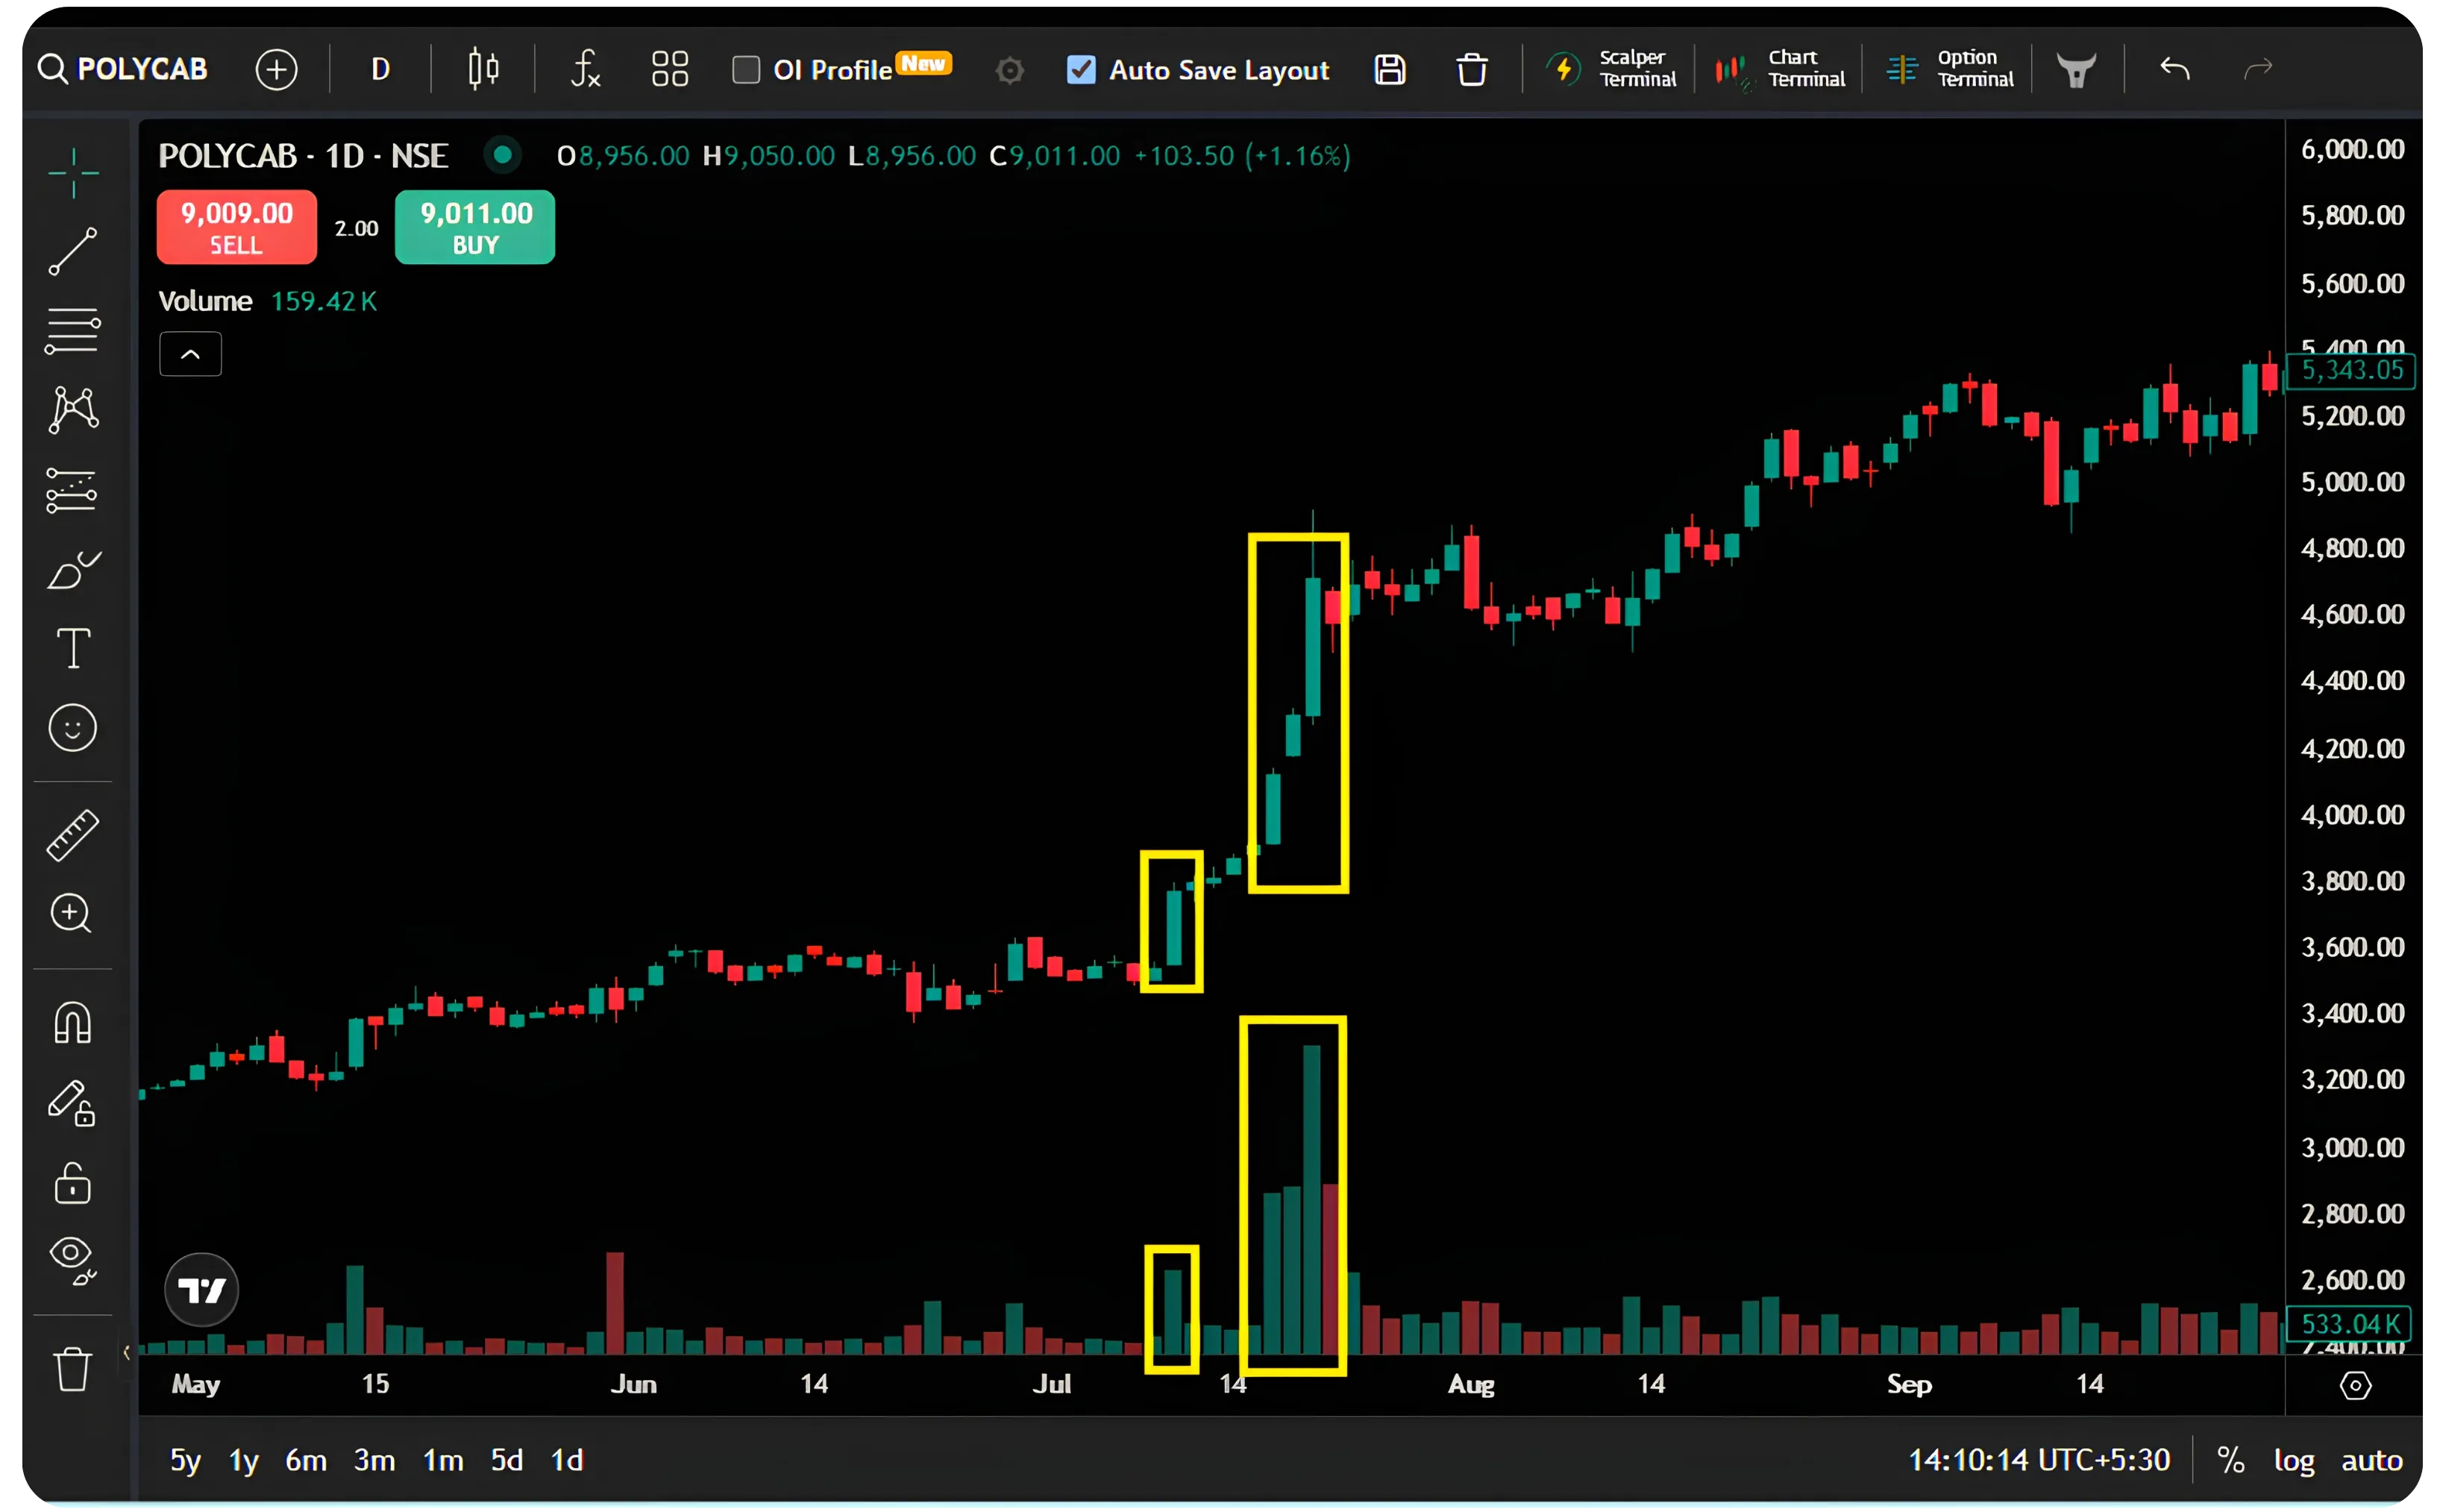
1. High Volume on an Up Candle
When price rises and volume is significantly above average, it shows that buyers are actively supporting the move. This isn't just retail enthusiasm. Large participants are likely involved. Strong rallies are usually built on strong volume.
2. Low Volume on an Up Candle (No Demand)
This is one of the most powerful ideas in VSA. Suppose a stock keeps moving higher, but volume keeps getting smaller. At first glance, everything looks bullish. But professionals see something different.
If institutions truly believed prices were going much higher, they'd be buying aggressively. Instead, they're staying away. The rally continues only because smaller traders are still buying.
Without institutional participation, these rallies often lose momentum and reverse. This pattern is called No Demand.
Example
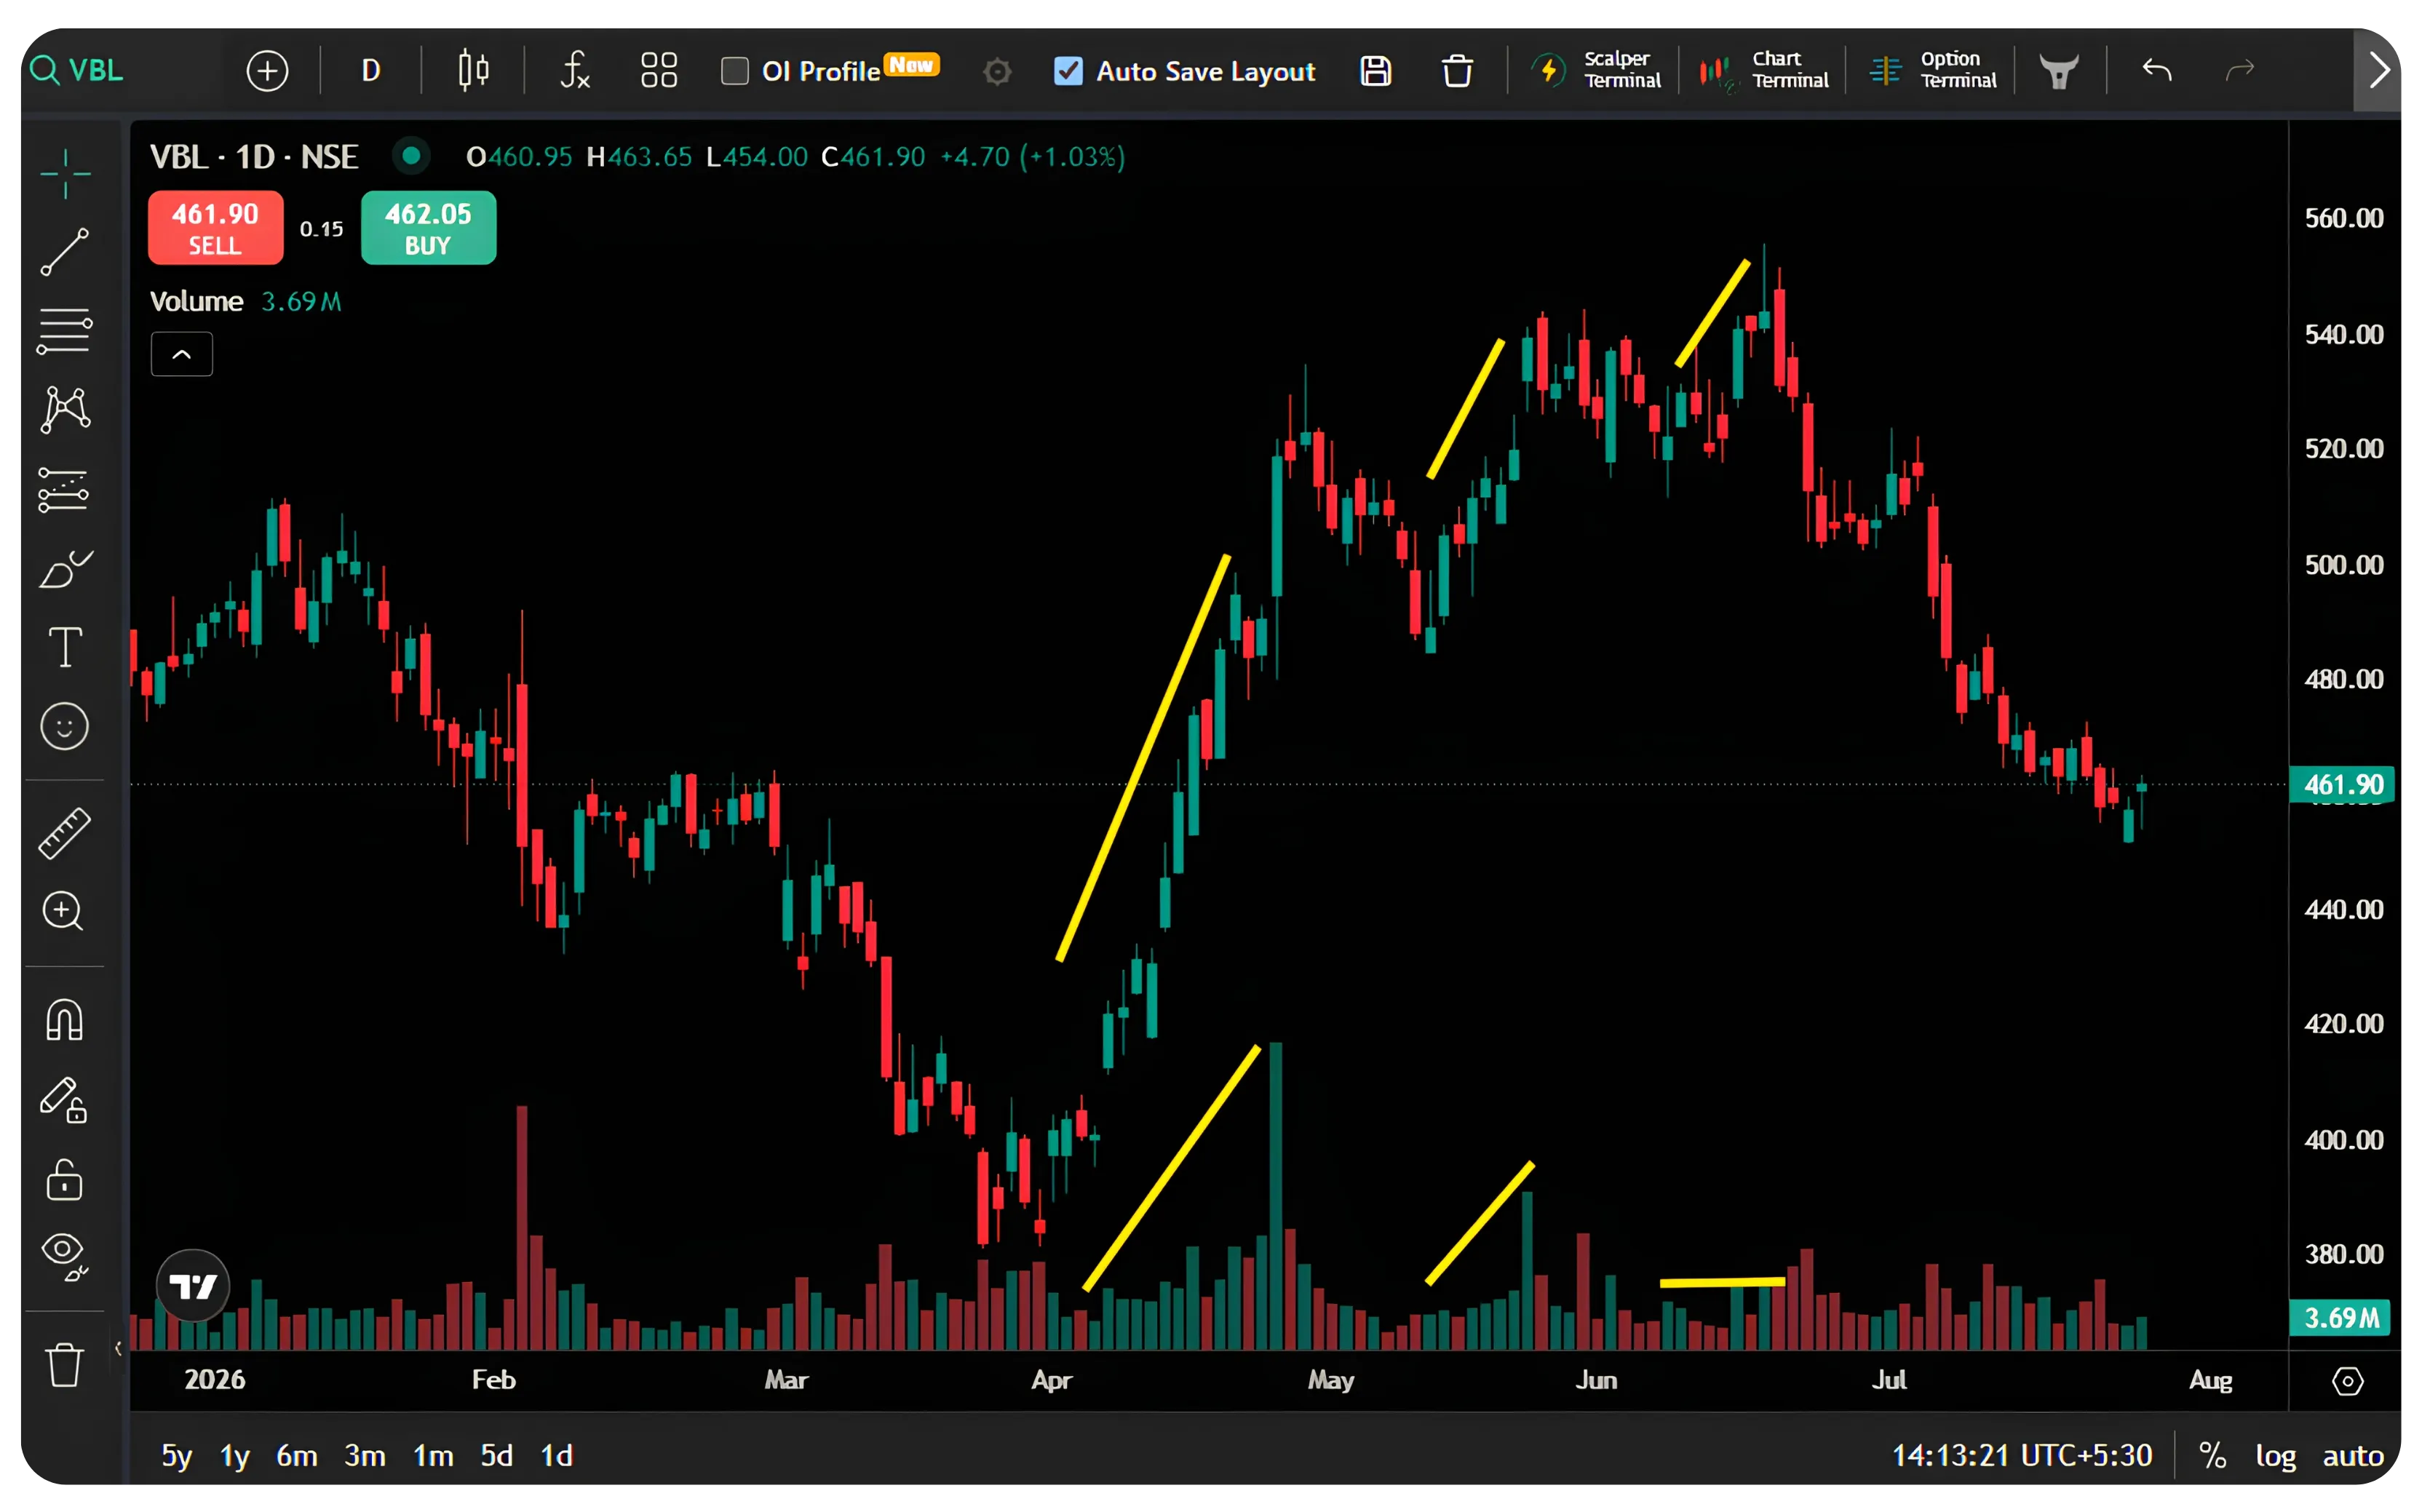
A mid-cap IT stock announces positive news and opens 3% higher. Social media is full of excitement. But by the end of the session, volume is only half of its normal average. An experienced VSA trader doesn't chase the breakout. Instead, they question it. If the news was truly important, why weren't institutions buying? Low-volume rallies deserve caution.
3. High Volume on a Down Candle
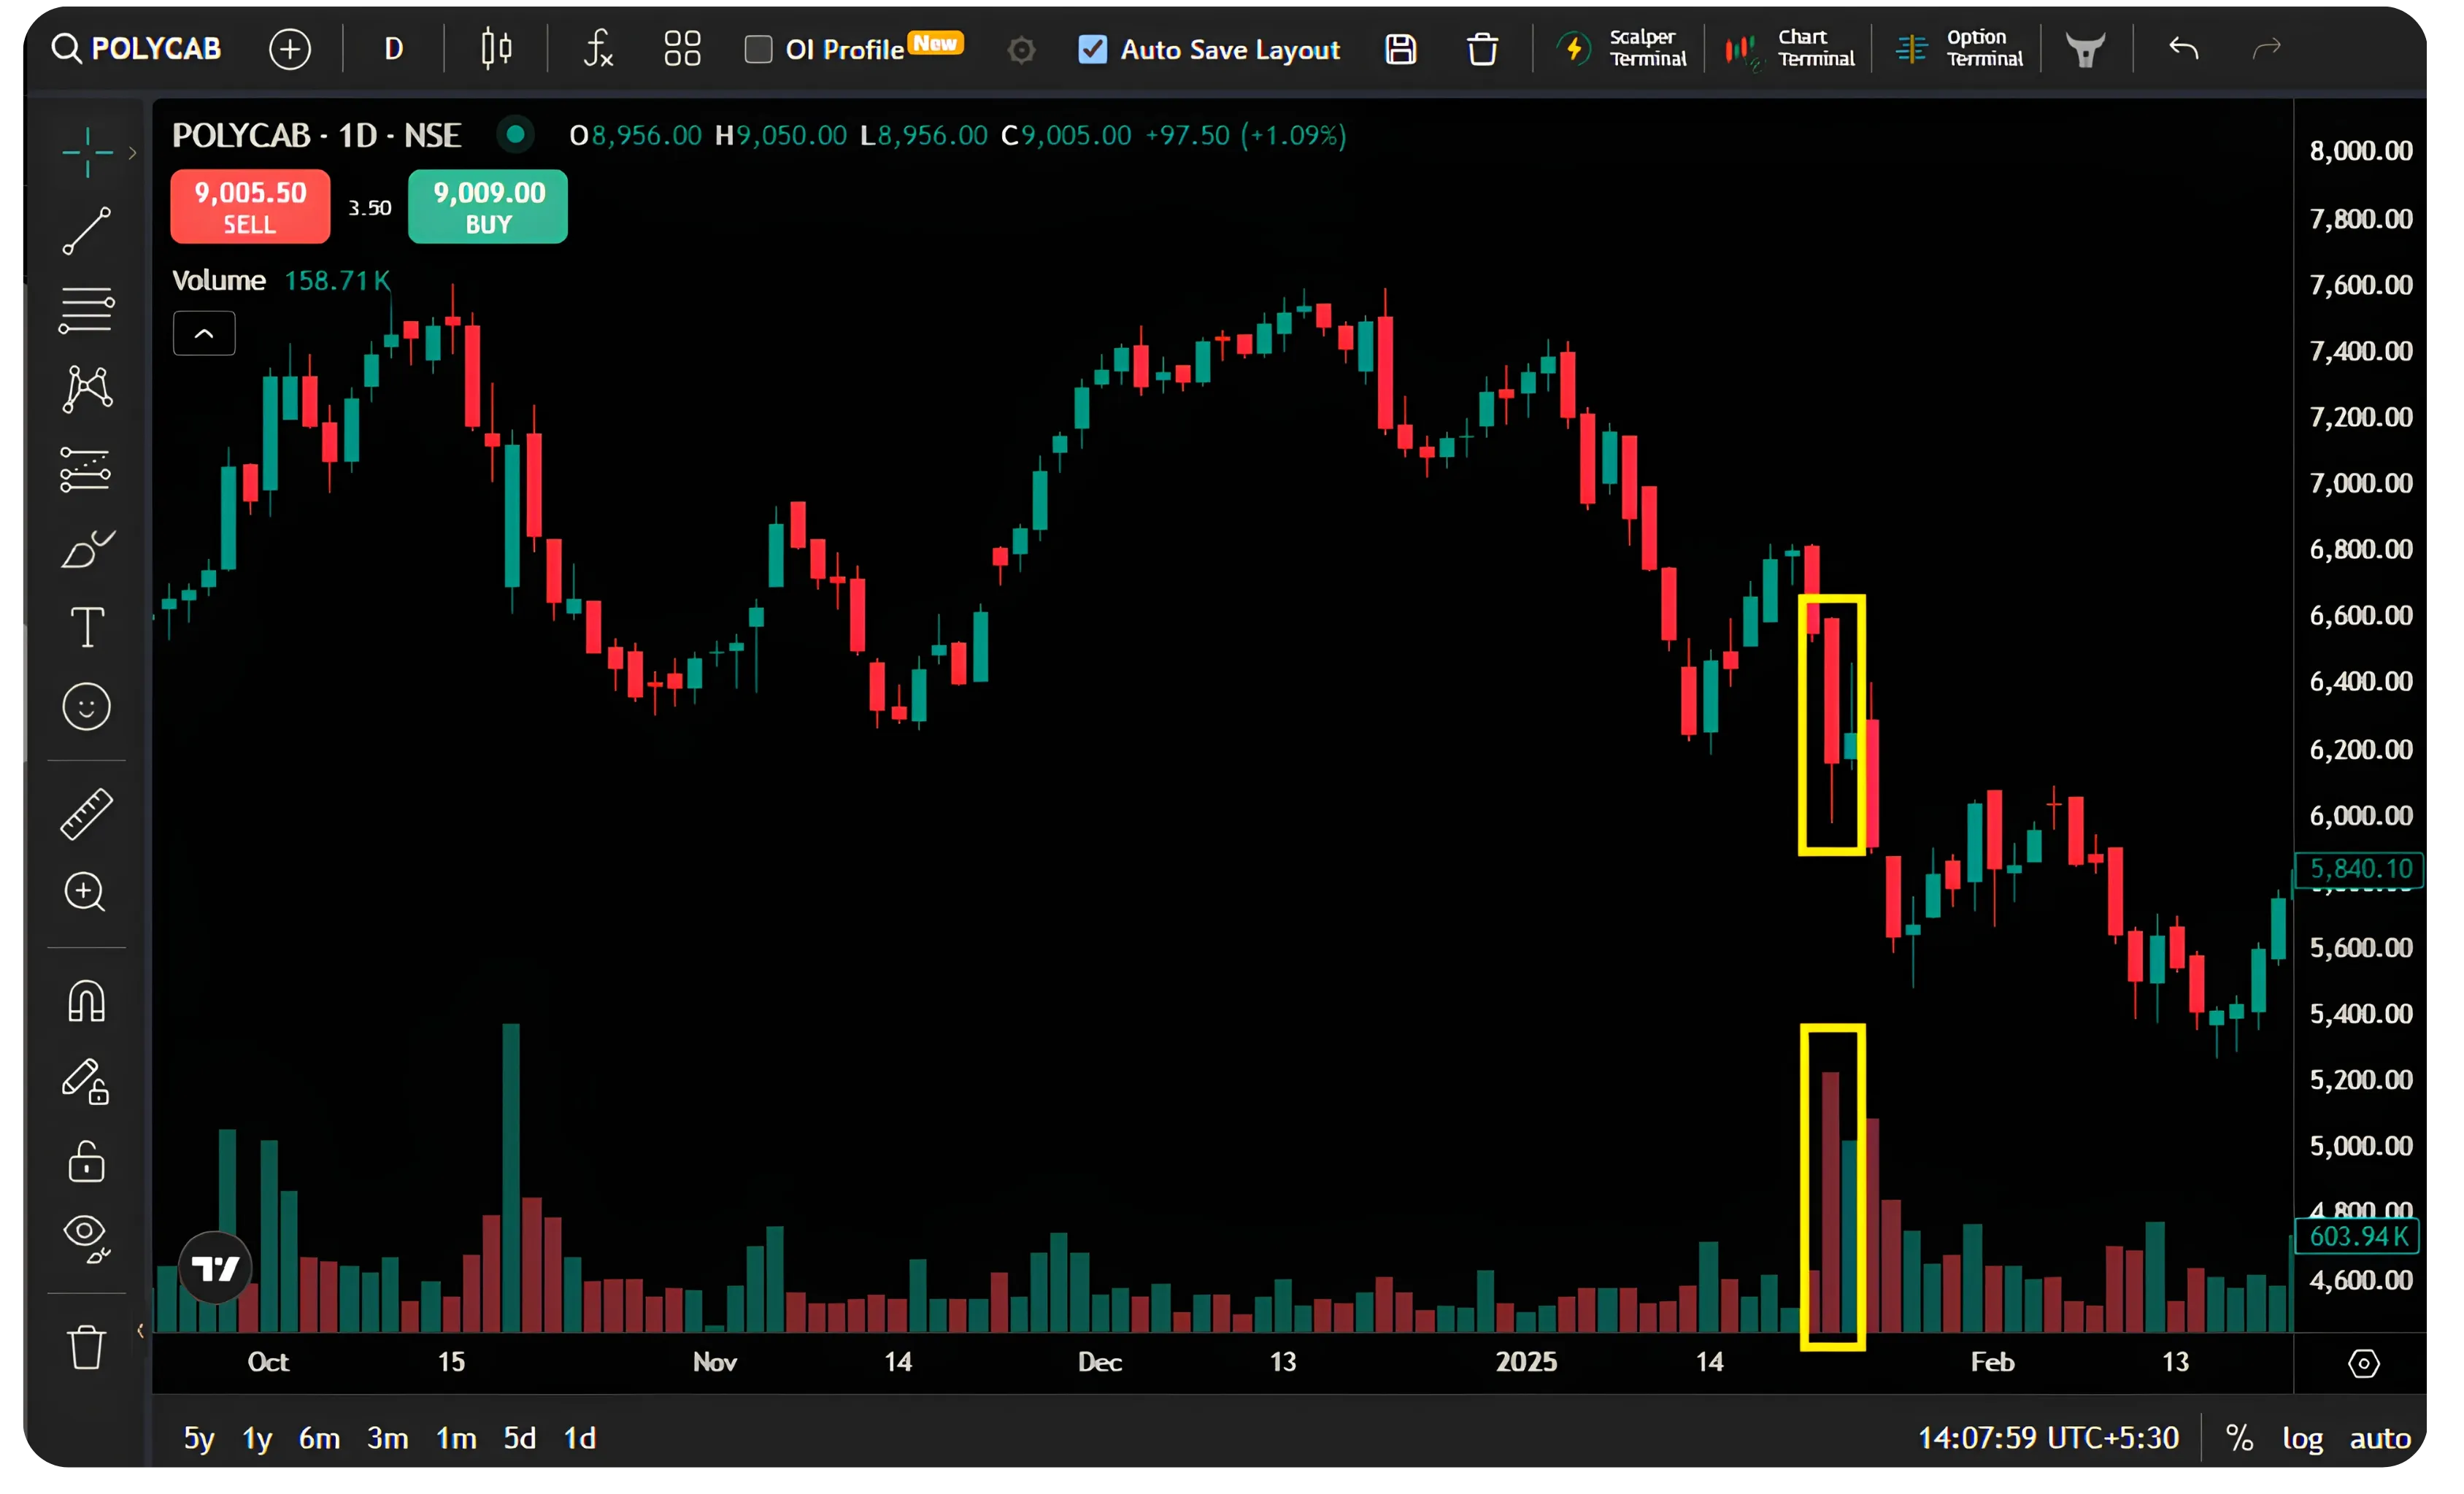
High volume during a fall doesn't always mean heavy selling. Sometimes it does. Sometimes it means the exact opposite. If price falls sharply, volume is extremely high, and the candle closes near its low, sellers are clearly in control.
Learning to distinguish between these two situations is one of the biggest advantages of VSA. (We will explore this in detail in the upcoming blog of this series).
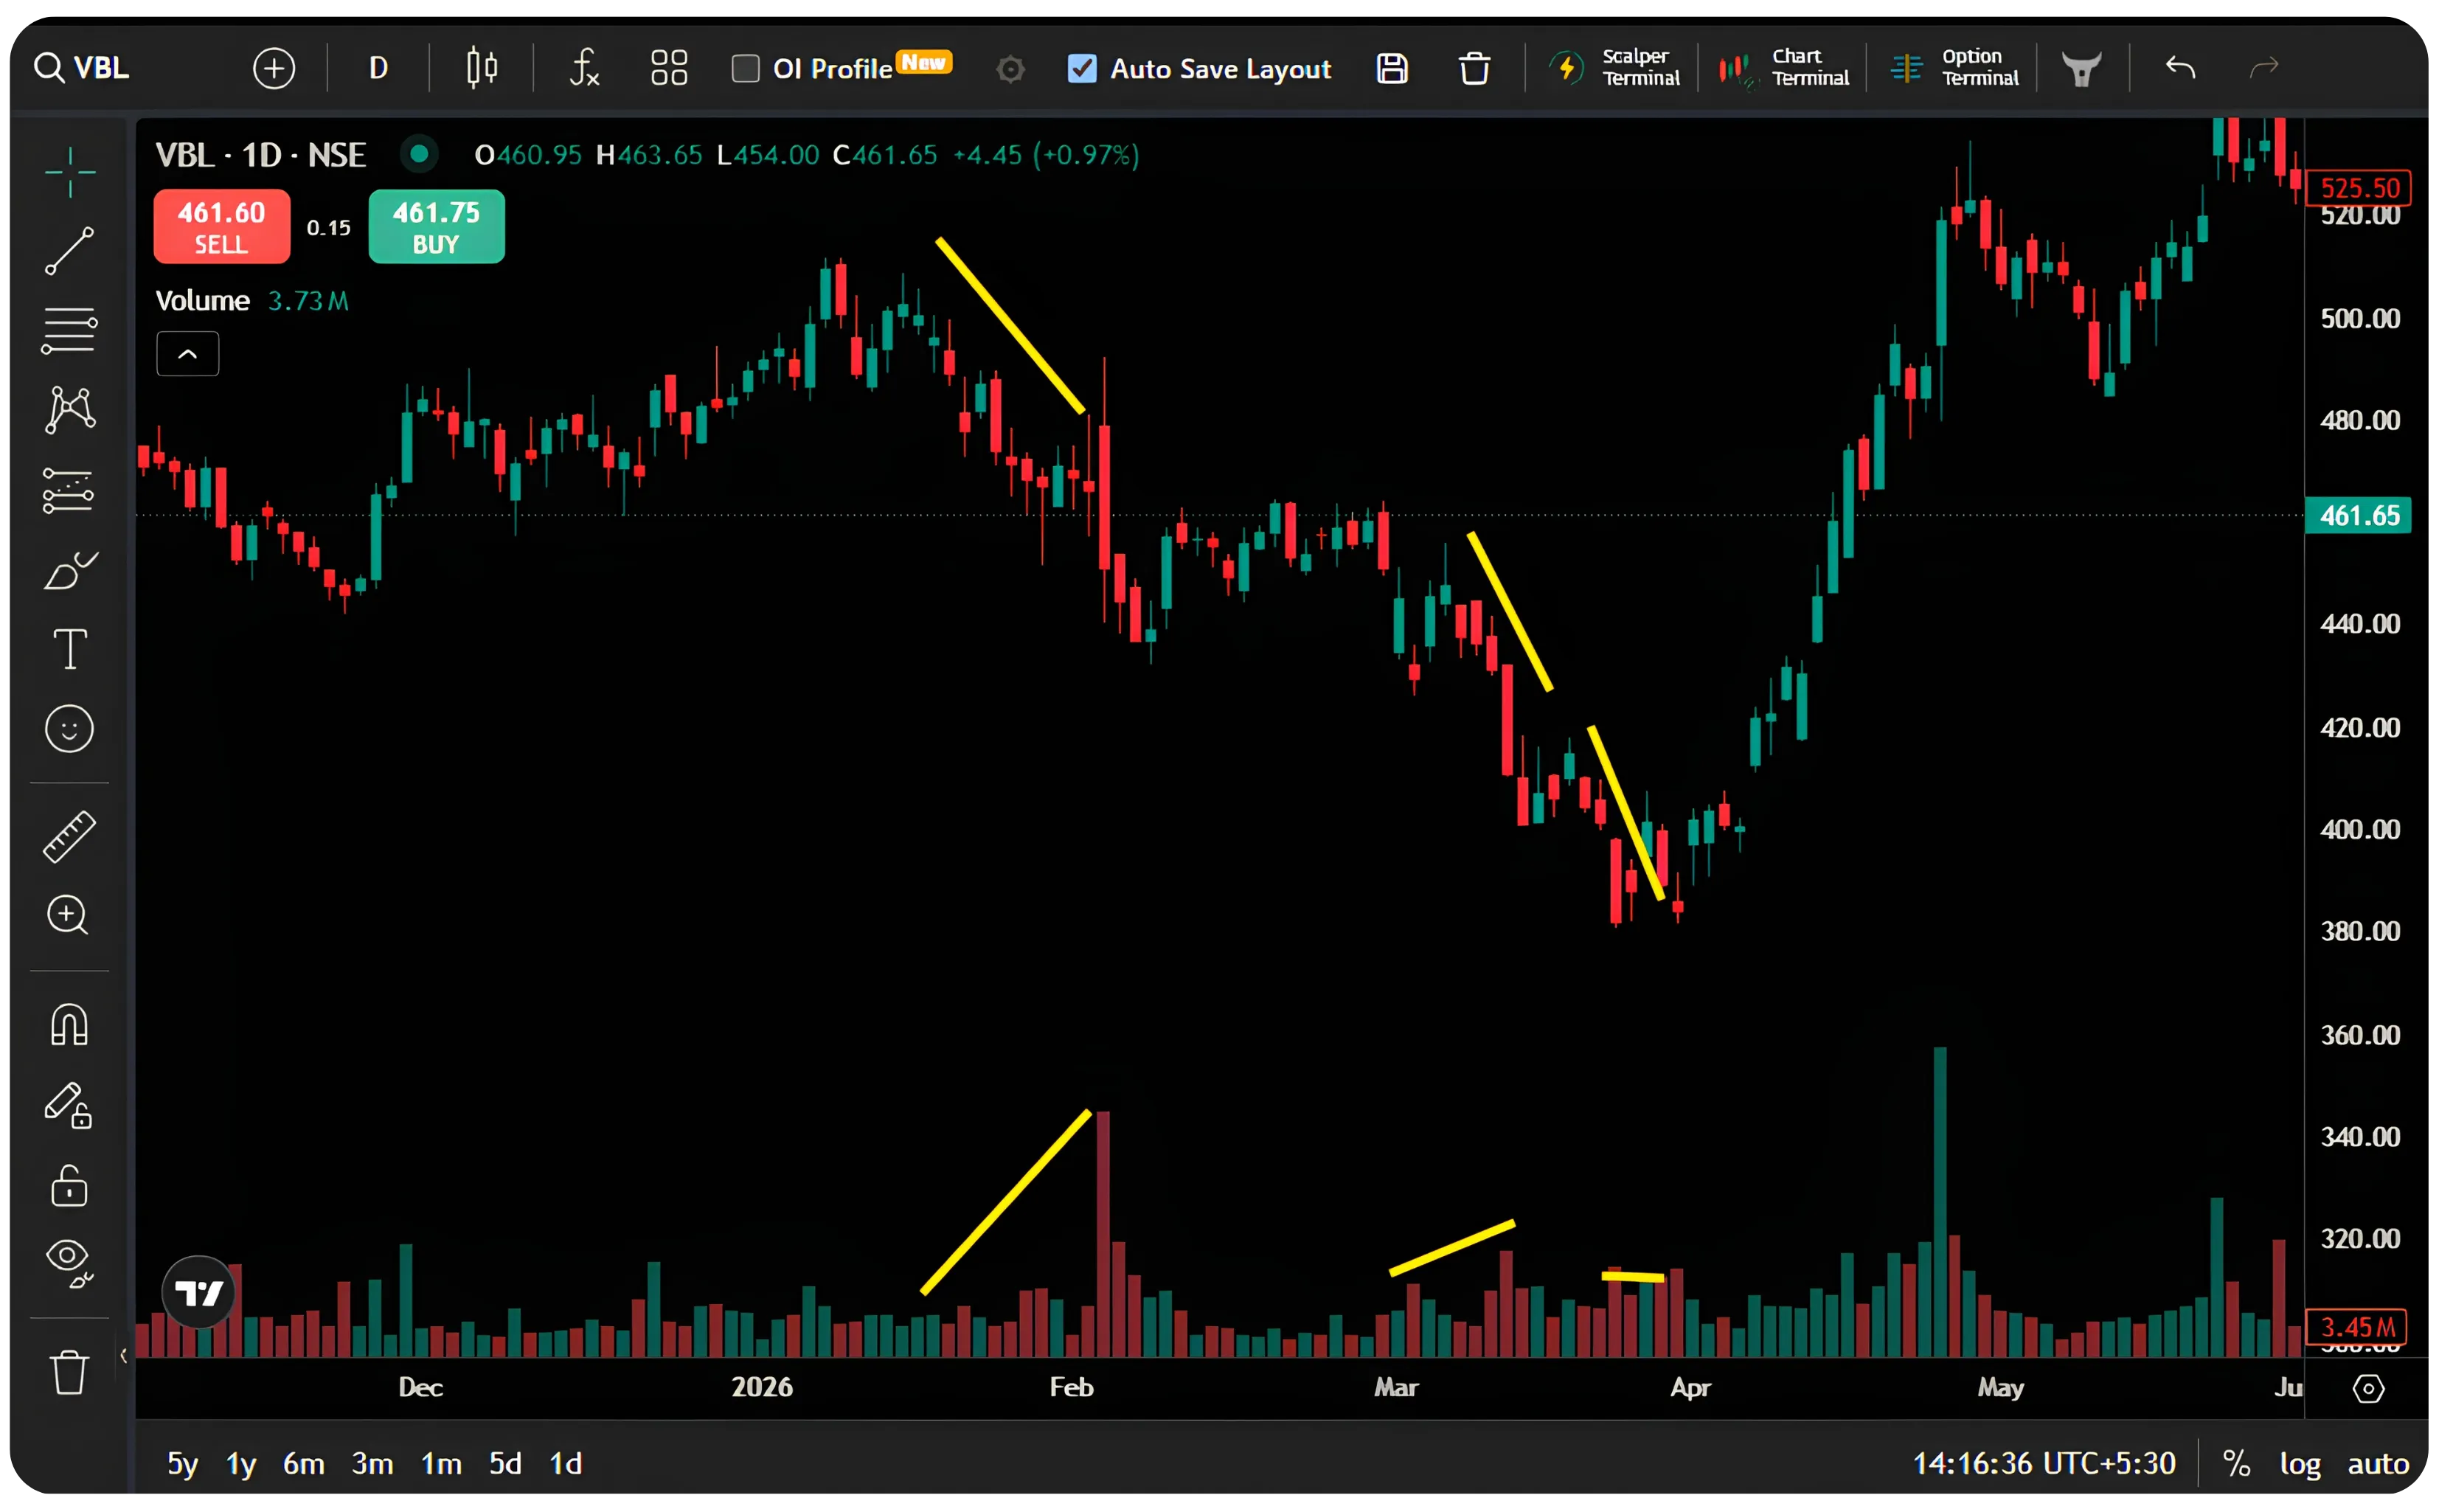
4. Low Volume on a Down Candle
This is one of the most powerful ideas in VSA. Suppose a stock keeps moving lower, but volume keeps getting smaller. At first glance, everything looks bearish. But professionals see something different.
If institutions truly believed prices were going much lower, they'd be selling aggressively, and that would have been visible in high volume. Instead, they are staying away or absorbing the supply…
Why Volume Matters Before Breakouts?
Many traders get excited when price breaks above resistance. But VSA asks one important question:
Did volume confirm the breakout?
A breakout without higher-than-average volume often lacks commitment. It may quickly fail because professional traders never joined the move. On the other hand, when resistance breaks with a clear surge in volume, there's a much better chance that institutions are participating. Price tells you the breakout happened. Volume tells you whether it's likely to last.
Final Thought
Most indicators are built using price. Volume is different. It shows participation. Every major move in the market leaves footprints, and those footprints appear in the volume bars before they become obvious in the headlines.
Learning to read volume won't predict every move, but it will help you separate genuine market strength from temporary excitement. That's a skill every trader should have.
Next in the part….
Accumulation and Distribution: How Smart Money Quietly Builds and Exits Positions
Disclaimer: The information provided in our blogs is for informational purposes only and should not be construed as financial, investment, or trading advice. Trading and investing in the securities market carries risk. Always conduct your own research and consult with a qualified financial advisor before making any investment decisions. Past performance is not indicative of future results. Copyrighted and original content for your trading and investing needs.
© 2026 — Tradejini. All Rights Reserved.