


Have you ever looked at a price chart and wondered if history is quietly repeating itself? In stock trading, one of the key challenges is recognizing whether current market conditions resemble past profitable setups. Traditional technical indicators like RSI or MACD often miss these complex price movements, especially during high market volatility or sudden news events. That's where Super Trend Indicator becomes a game changer. It’s a trend-following indicator and technical analysis tool designed to identify trends, spot buy and sell signals, and help traders manage risk effectively. The Supertrend indicator filters out noise and highlights genuine market trends, giving traders a data-driven perspective for more confident trading strategies and entry and exit points.
History - Supertrend indicator?
The Supertrend indicator, developed by Olivier Seban in 2009, is a widely used popular technical analysis tool for identifying market trend duration and market movements, known for its simplicity and reliability. It integrates the Average True Range (ATR) to measure market volatility and plots a color-coded line directly on the price chart, green line below the price for uptrends and red line above the price for downtrends. This allows traders to quickly recognize trend direction and make informed decisions. Supertrend can be applied across various timeframes and instruments, and the ATR Length and multiplier inputs let users adjust its sensitivity to fit their trading strategy and style
How does it work?
The Supertrend indicator is a trend-following indicator overlay plotted directly on price charts, offering clear buy and sell signals based on price action and volatility. It simplifies trend detection with a single color-changing line, acting as dynamic support or resistance, to highlight trend direction and trend strength. The line is calculated by adjusting the asset’s closing price with the Average True Range (ATR) times a multiplier, reflecting current volatility. When price trades above the line, an uptrend (buy signal) is indicated; price below suggests a downtrend (sell signal). This straightforward approach helps traders identify optimal entry and exit points and manage market risk and risk management effectively.
Formulas and Calculating the Supertrend Indicator
Average True Range (ATR)
The ATR measures how much the stock price moves in a day. It considers the highest, lowest, and closing prices over certain days (usually 14). This gives an idea of the market’s volatility.
Also Read: A Trader’s Introduction to the Bat Patterns
ATR Formula:
ATR = (Current High – Current Low) + (Current High – Previous Close) + (Previous Close – Current Low) ÷ 3
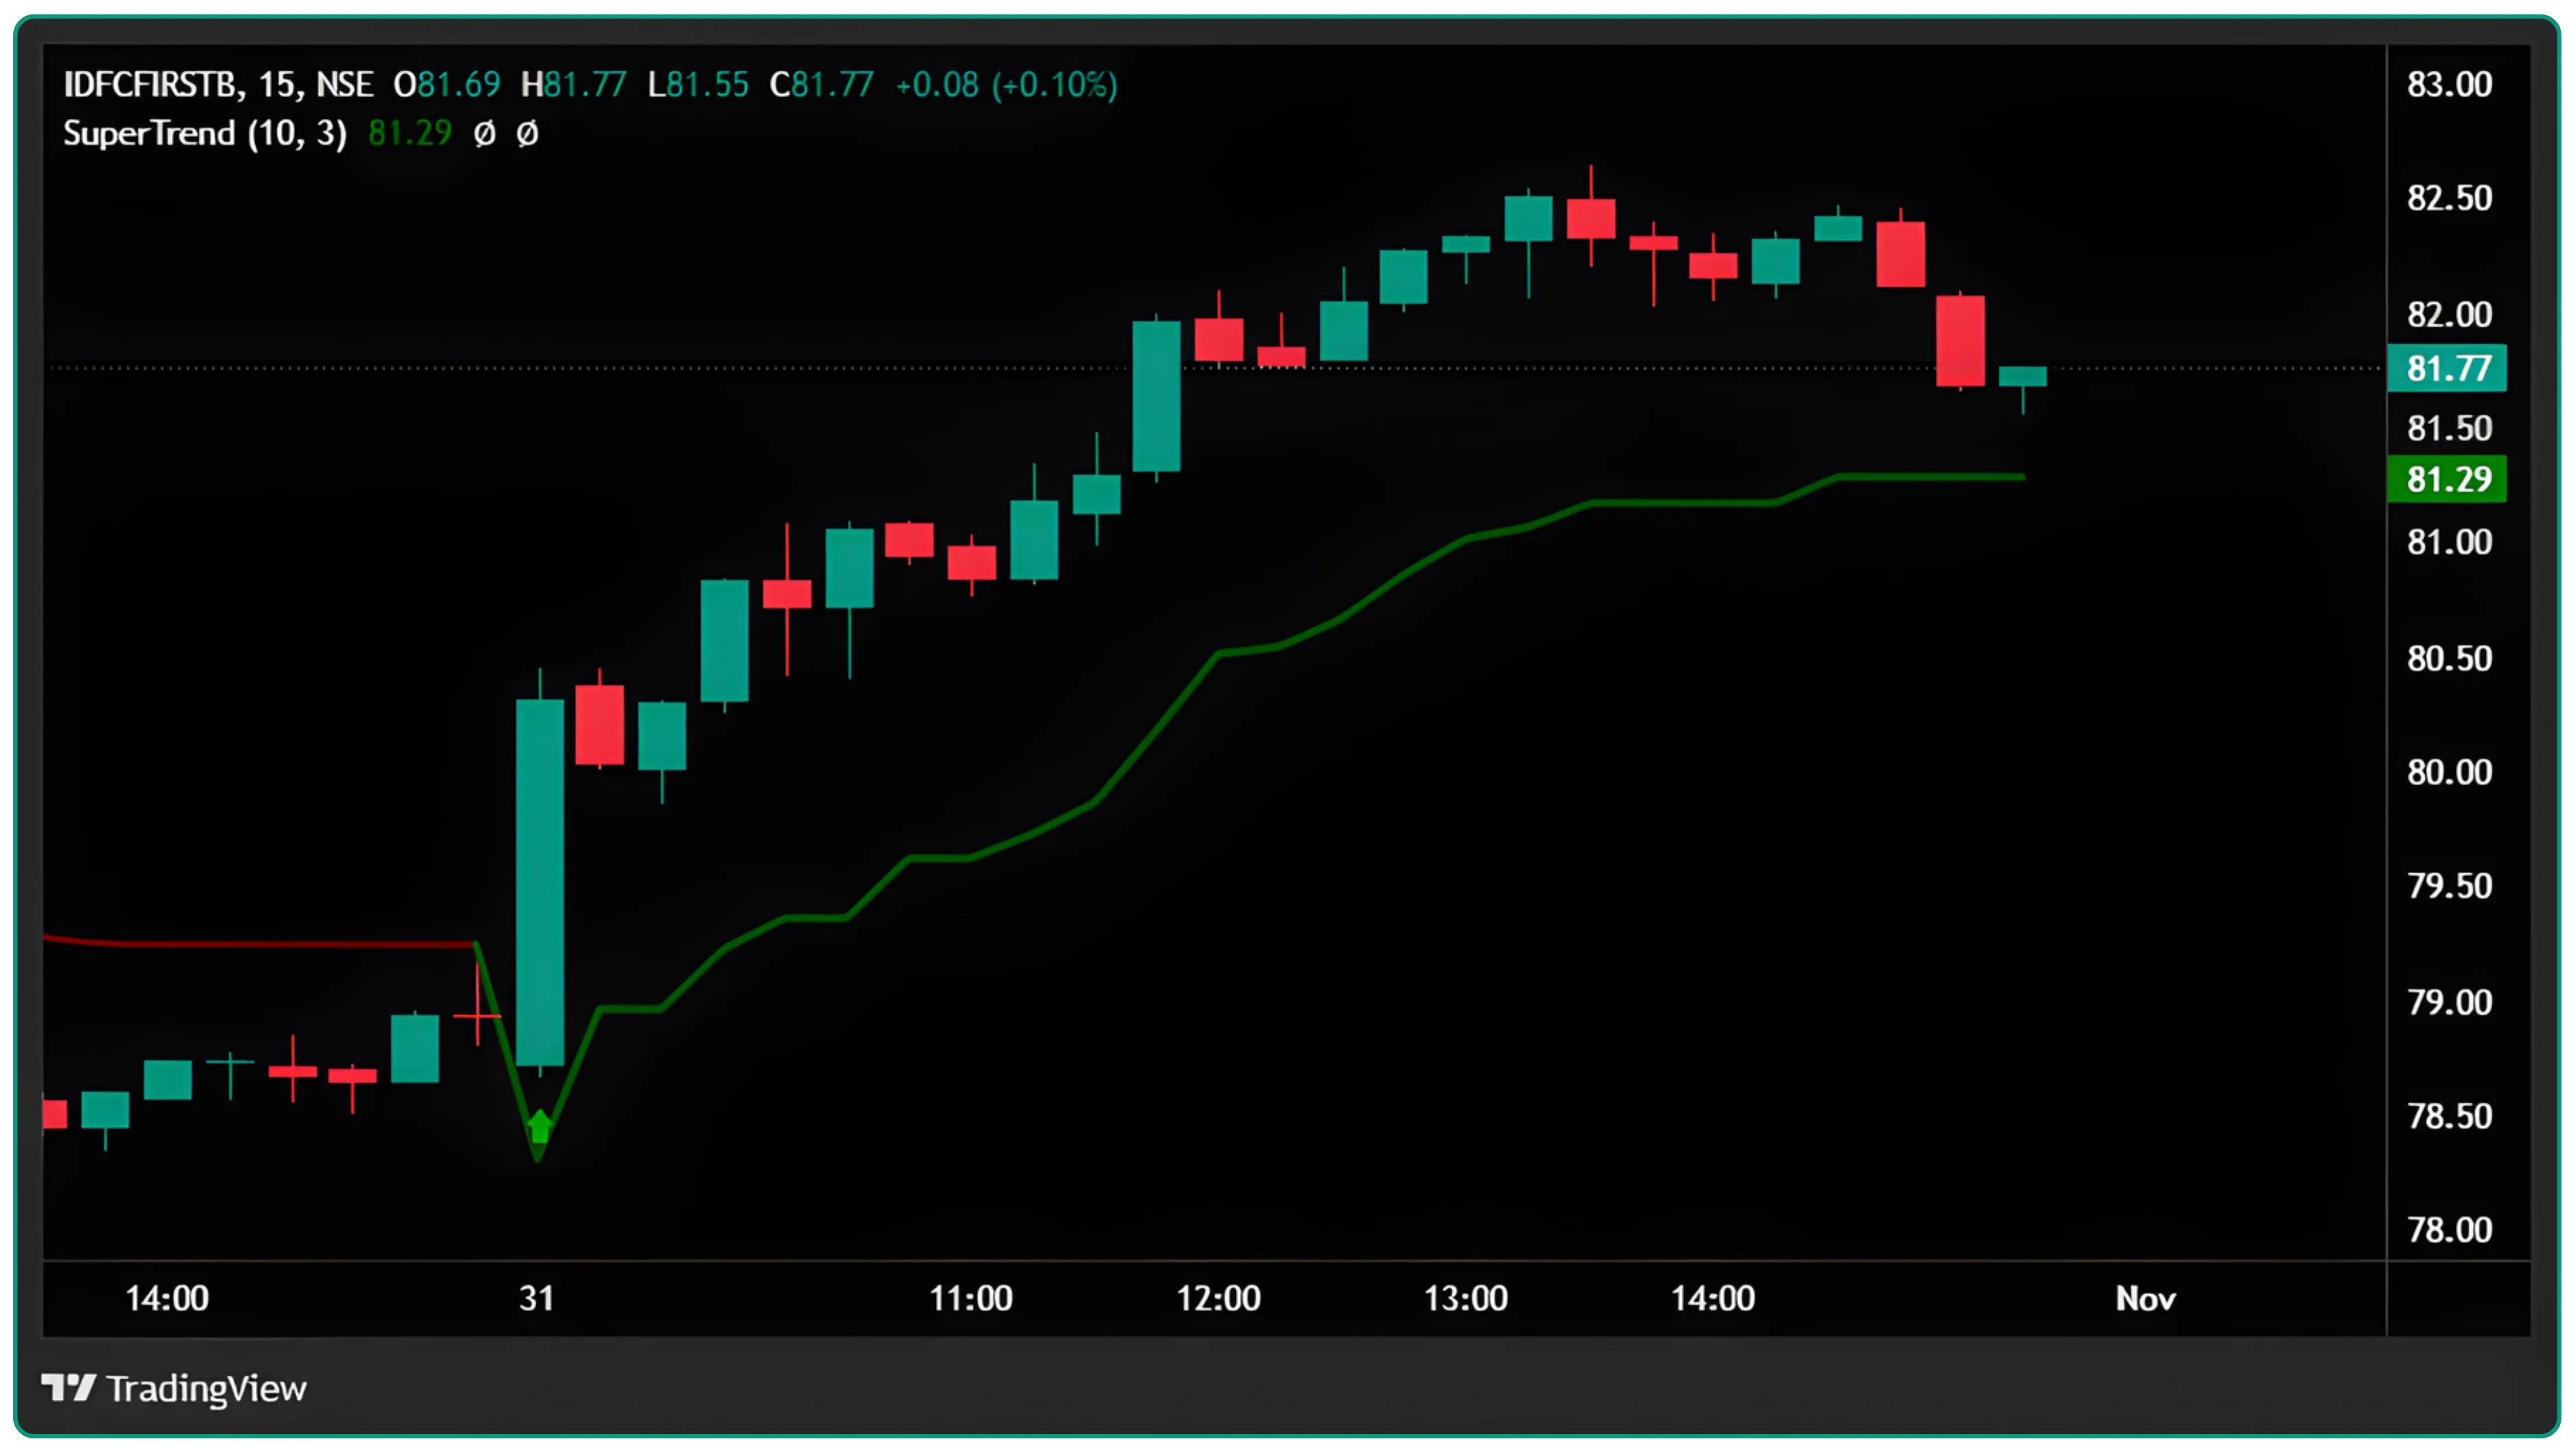
Let’s take IDFC stock of OCT 29,30,31 of 2025, It had the following prices movements:
Day 1: High = ₹79.50, Low = ₹78.12, Close = ₹79.35 Day 2: High = ₹79.92, Low = ₹78.34, Close = ₹78.93 Day 3: High = ₹82.65, Low = ₹78.67, Close = ₹81.77
To calculate the ATR
Day 1 Range = ₹79.50 – ₹78.12 = ₹1.38 Day 2 Range = ₹79.92 – ₹78.34 = ₹1.58 Day 3 Range = ₹82.65 – ₹78.67 = ₹3.98 Add these ranges and divide by 3 (number of days)
ATR = (1.38 + 1.58 + 3.89) ÷ 3 = 2.29 This value represents the average price movement, helping traders understand trends movement and market environments.
Upper and Lower Bands
Using the ATR, the Supertrend Indicator formula calculates two lines called upper and lower bands
Upper Band = Closing Price + (Multiplier × ATR) Lower Band = Closing Price – (Multiplier × ATR) The multiplier is usually 2, but traders can adjust it depending on market conditions and reversal trading strategy.
Example:
Let’s say today’s closing price of XYZ is ₹50,000, and the ATR is ₹300. Using a multiplier of 2: Upper Band = ₹50,000 + (2 × ₹300) = ₹50,600 Lower Band = ₹50,000 – (2 × ₹300) = ₹49,400
If the XYZ price goes above ₹50,600, the Supertrend Indicator turns into a green line, this signals you to buy. If the price drops below ₹49,400, the Supertrend Indicator turns into a red line, this signals you to sell or stay cautious.
This method helps traders identify market trends, manage risk, and react to market reversals effectively.
How to use the SuperTrend Indicator?
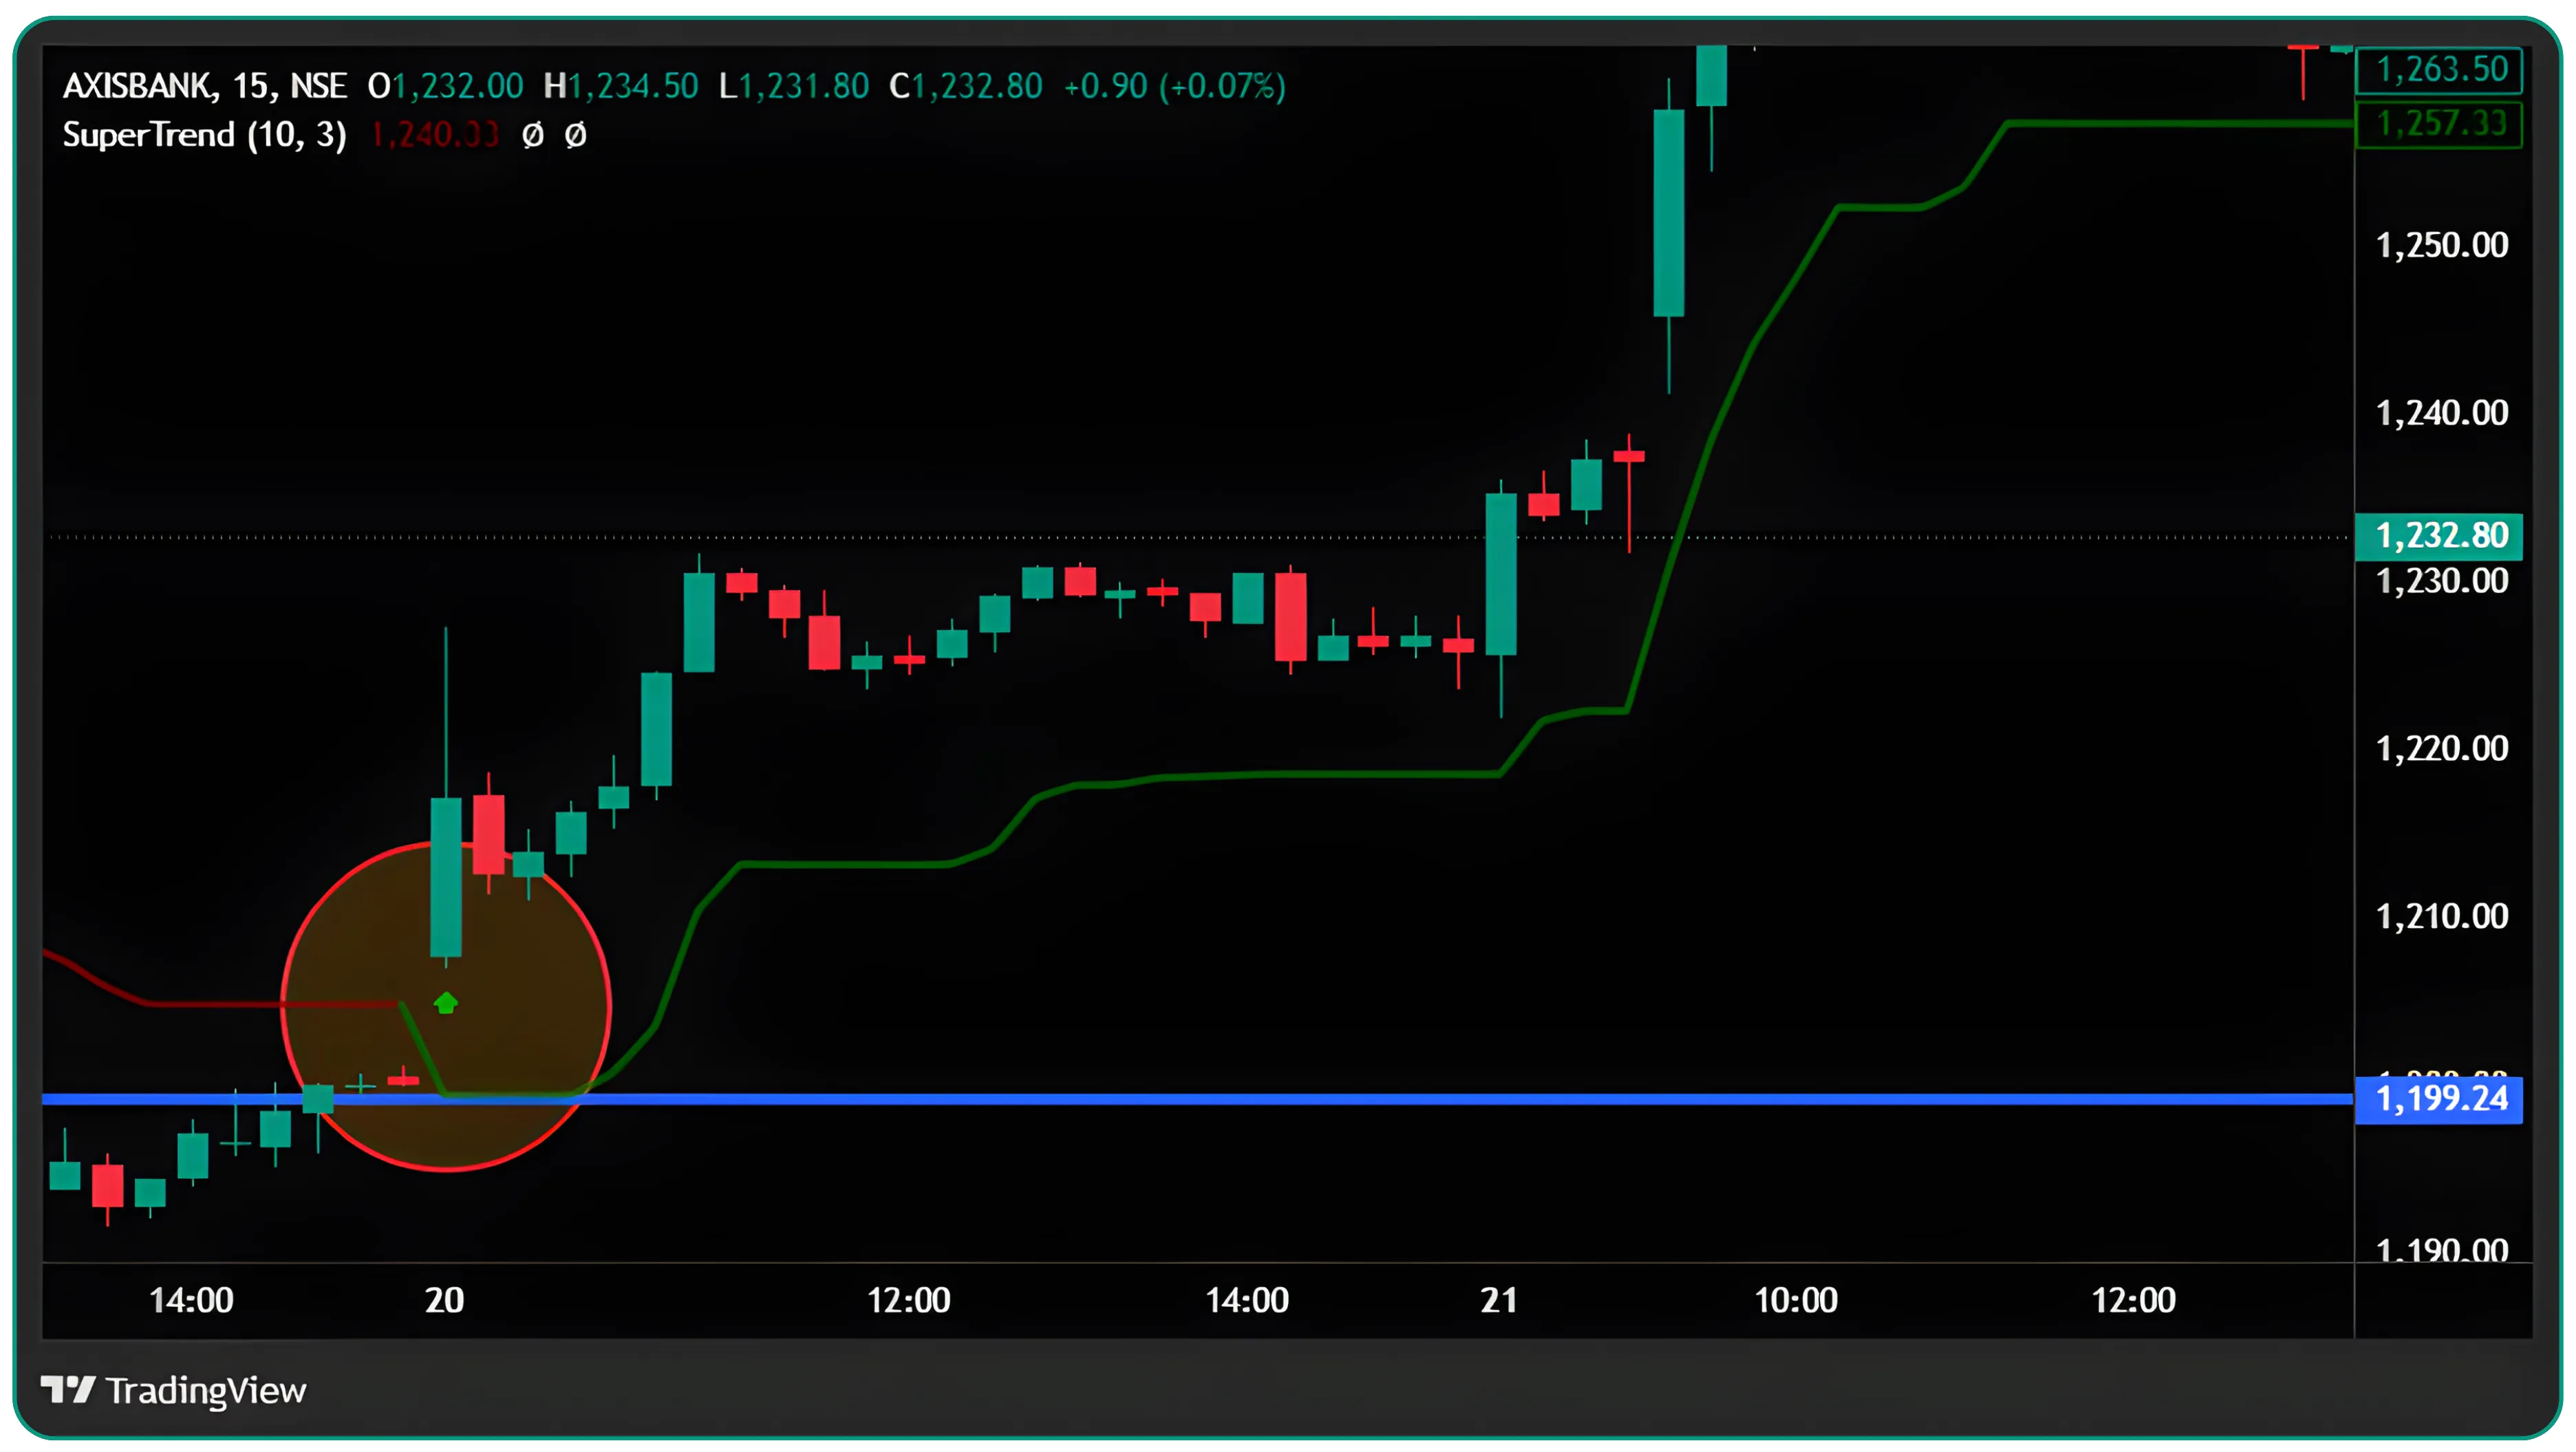
The Supertrend line appears directly on the price chart as a single trend line that changes color based on the trend direction, green when the market is trending upward and red when it is trending downward. When the price is above the Supertrend line (green line below price), it indicates an uptrend. This signals a potential buying opportunity and indicates a prevailing trend. When the price is below the Supertrend line (red line above price), it indicates a downtrend, signaling a potential sell signal.
Timeframes and Markets
This trend-following indicator functions across all timeframes, from 5-minute to daily, and works well for intraday trading, Its accuracy improves on higher timeframes with reduced price fluctuations and false signals. Commonly used intervals include 15-minute, 1-hour, and 1-day charts.
Entry
Enter a long (buy) position when the supertrend indicator turns green, showing a reversal of the current trend. Enter a short (sell) position when it turns red, showing a reversal trading signal toward the downside.
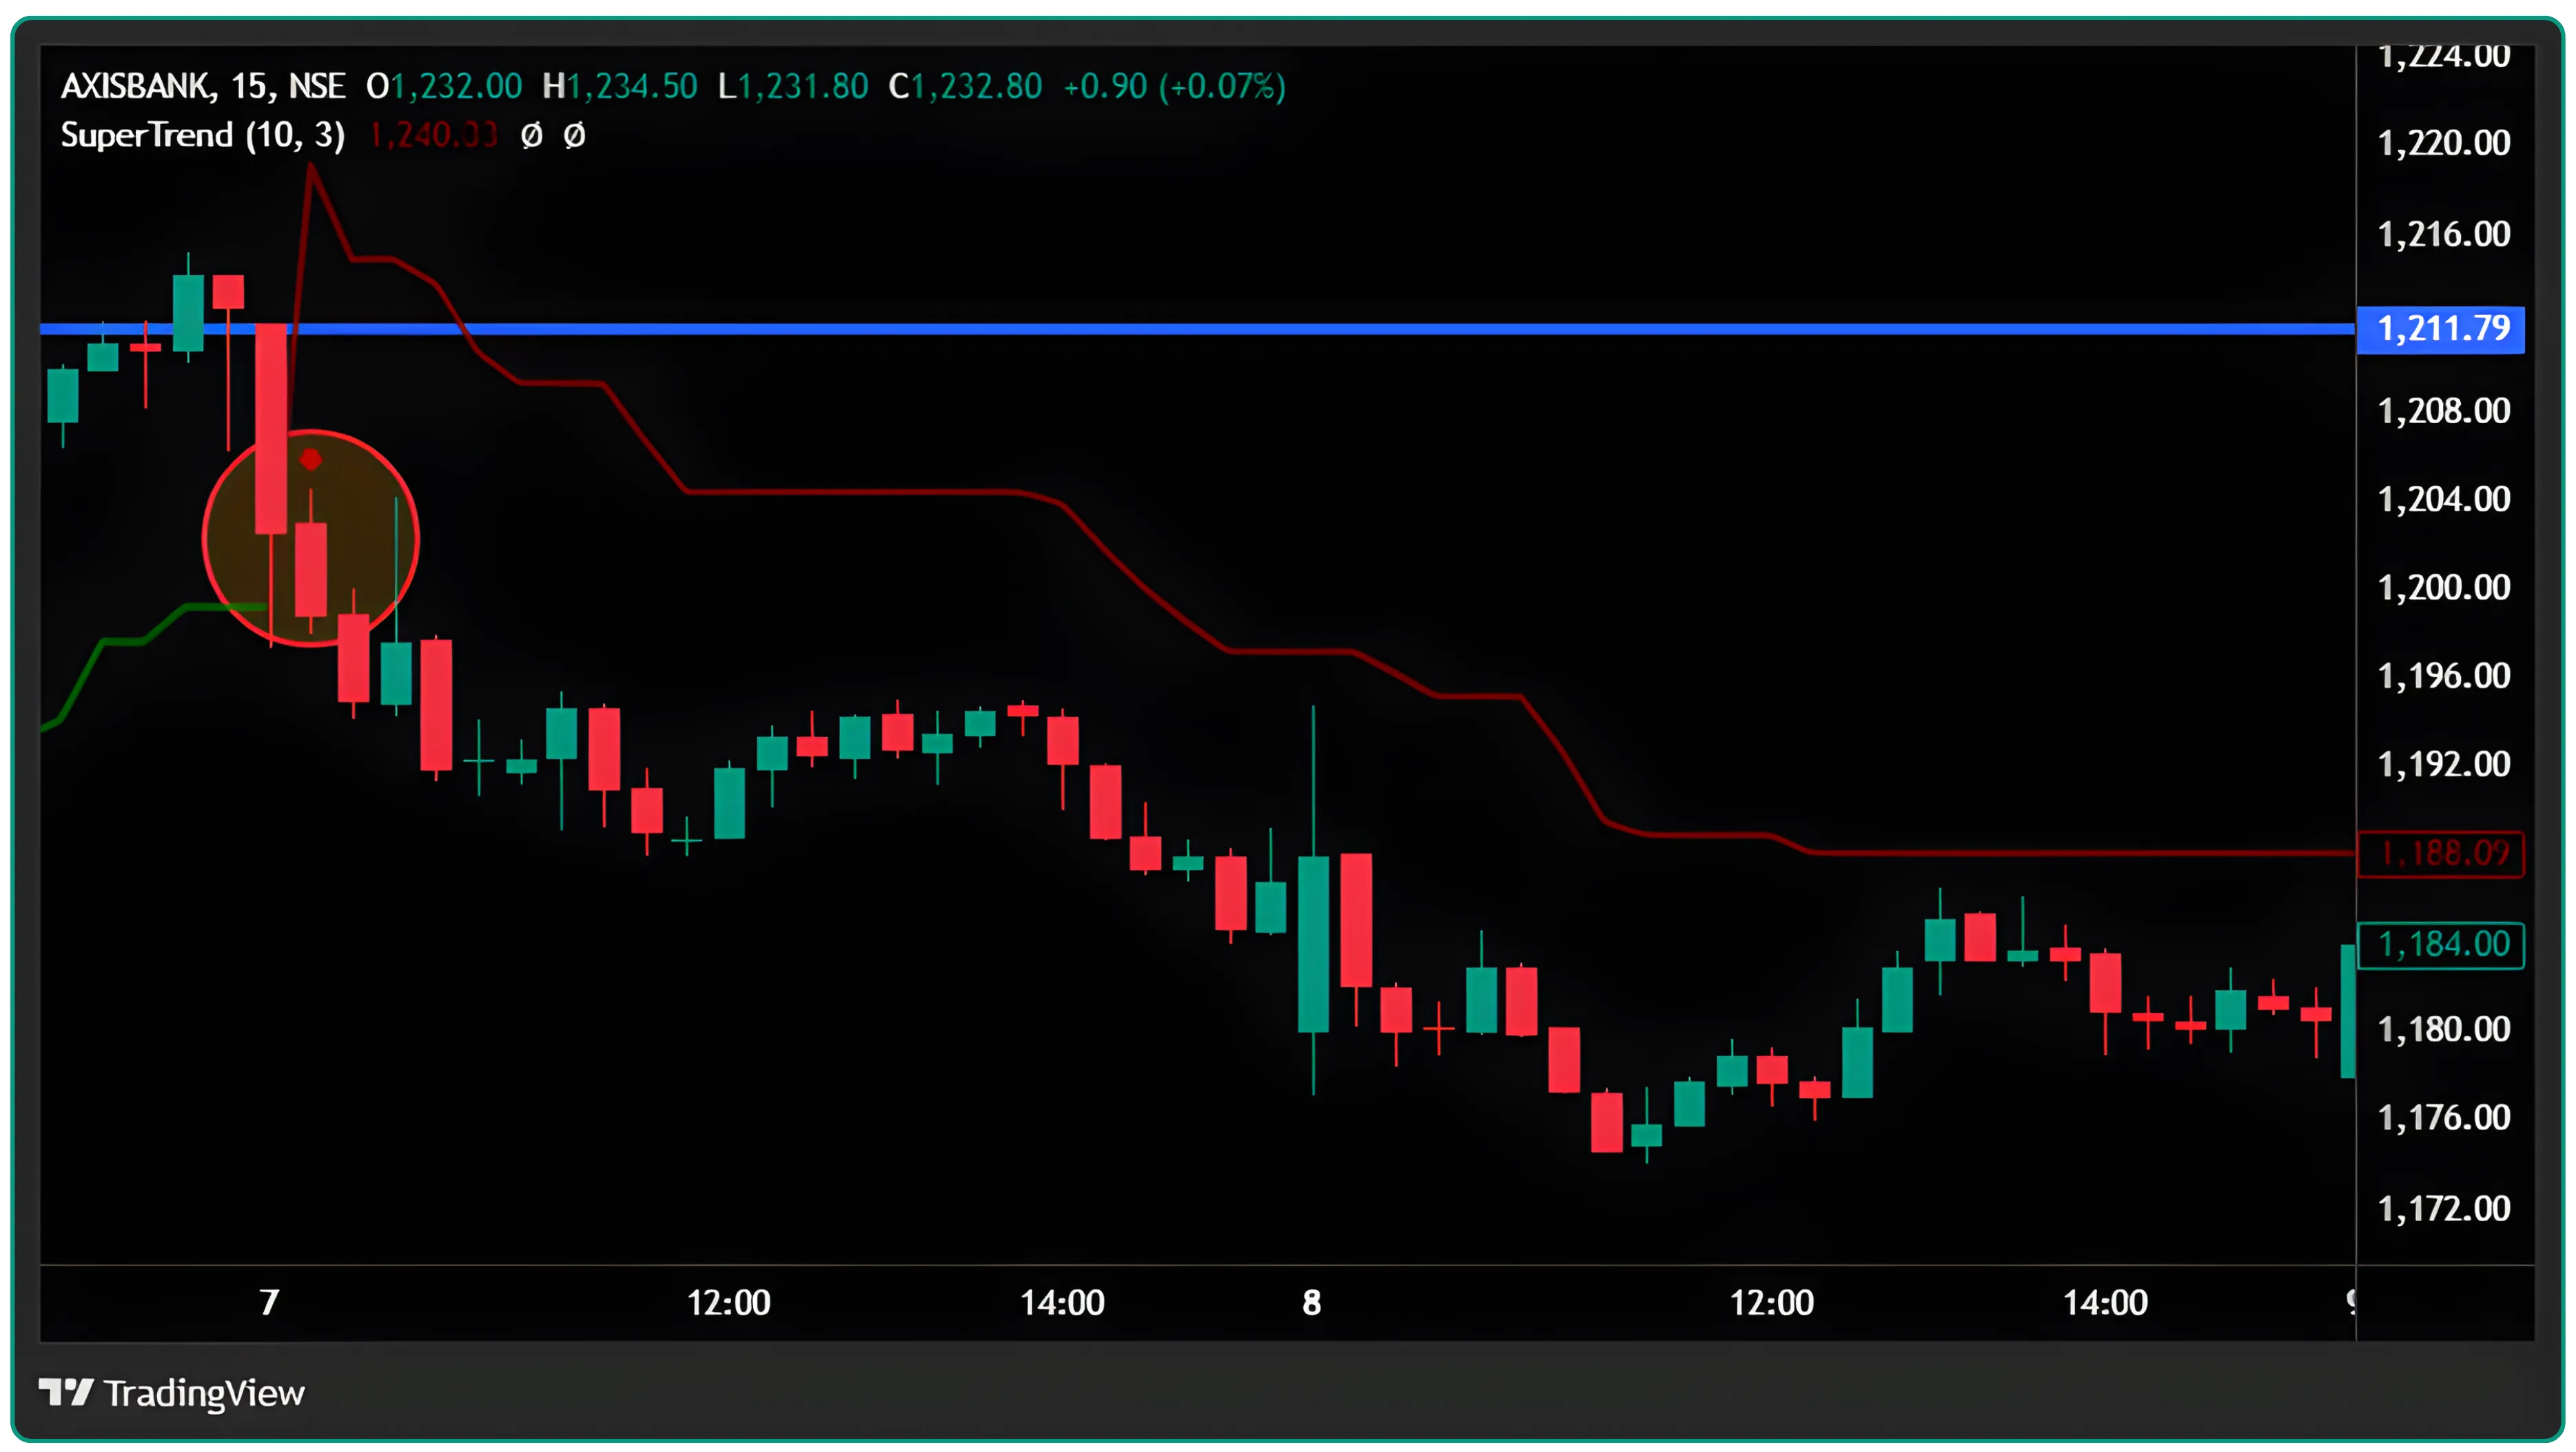
Exit and Stop Loss Placement
Use the Supertrend line as a dynamic support or trailing stop loss level. If in a long trade, a close below the green line suggests exit trade. In a short trade, a close above the red line suggests closing the short position. This helps traders manage risk effectively in trending markets.
Key Drawbacks of the Super Trend Indicator
Whipsaw in Sideways Markets
In choppy or range-bound markets, the indicator flips between buy and sell signals generating false signals.
Lagging Nature
Being a lagging indicator, it reacts after price moves occur, which may cause missed exit points or late entries.
Requires Confirmation
Combine it with other indicators like RSI (relative strength index), moving averages, or MACD for confirmation.
Parameter Sensitivity
The super trend indicator relies on ATR and multiplier settings; improper values can generate false signals
Shows Direction, Not Strength
It highlights trend direction but not trend strength, so traders should use other technical indicators to gauge momentum.
Asset Dependency
Effectiveness varies across financial instruments like forex, commodities, and the securities market.
Disclaimer: The information provided in our blogs is for informational purposes only and should not be construed as financial, investment, or trading advice. Trading and investing in the securities market carries risk. Always conduct your own research and consult with a qualified financial advisor before making any investment decisions. Past performance is not indicative of future results. Copyrighted and original content for your trading and investing needs.
© 2025 — Tradejini. All Rights Reserved.