

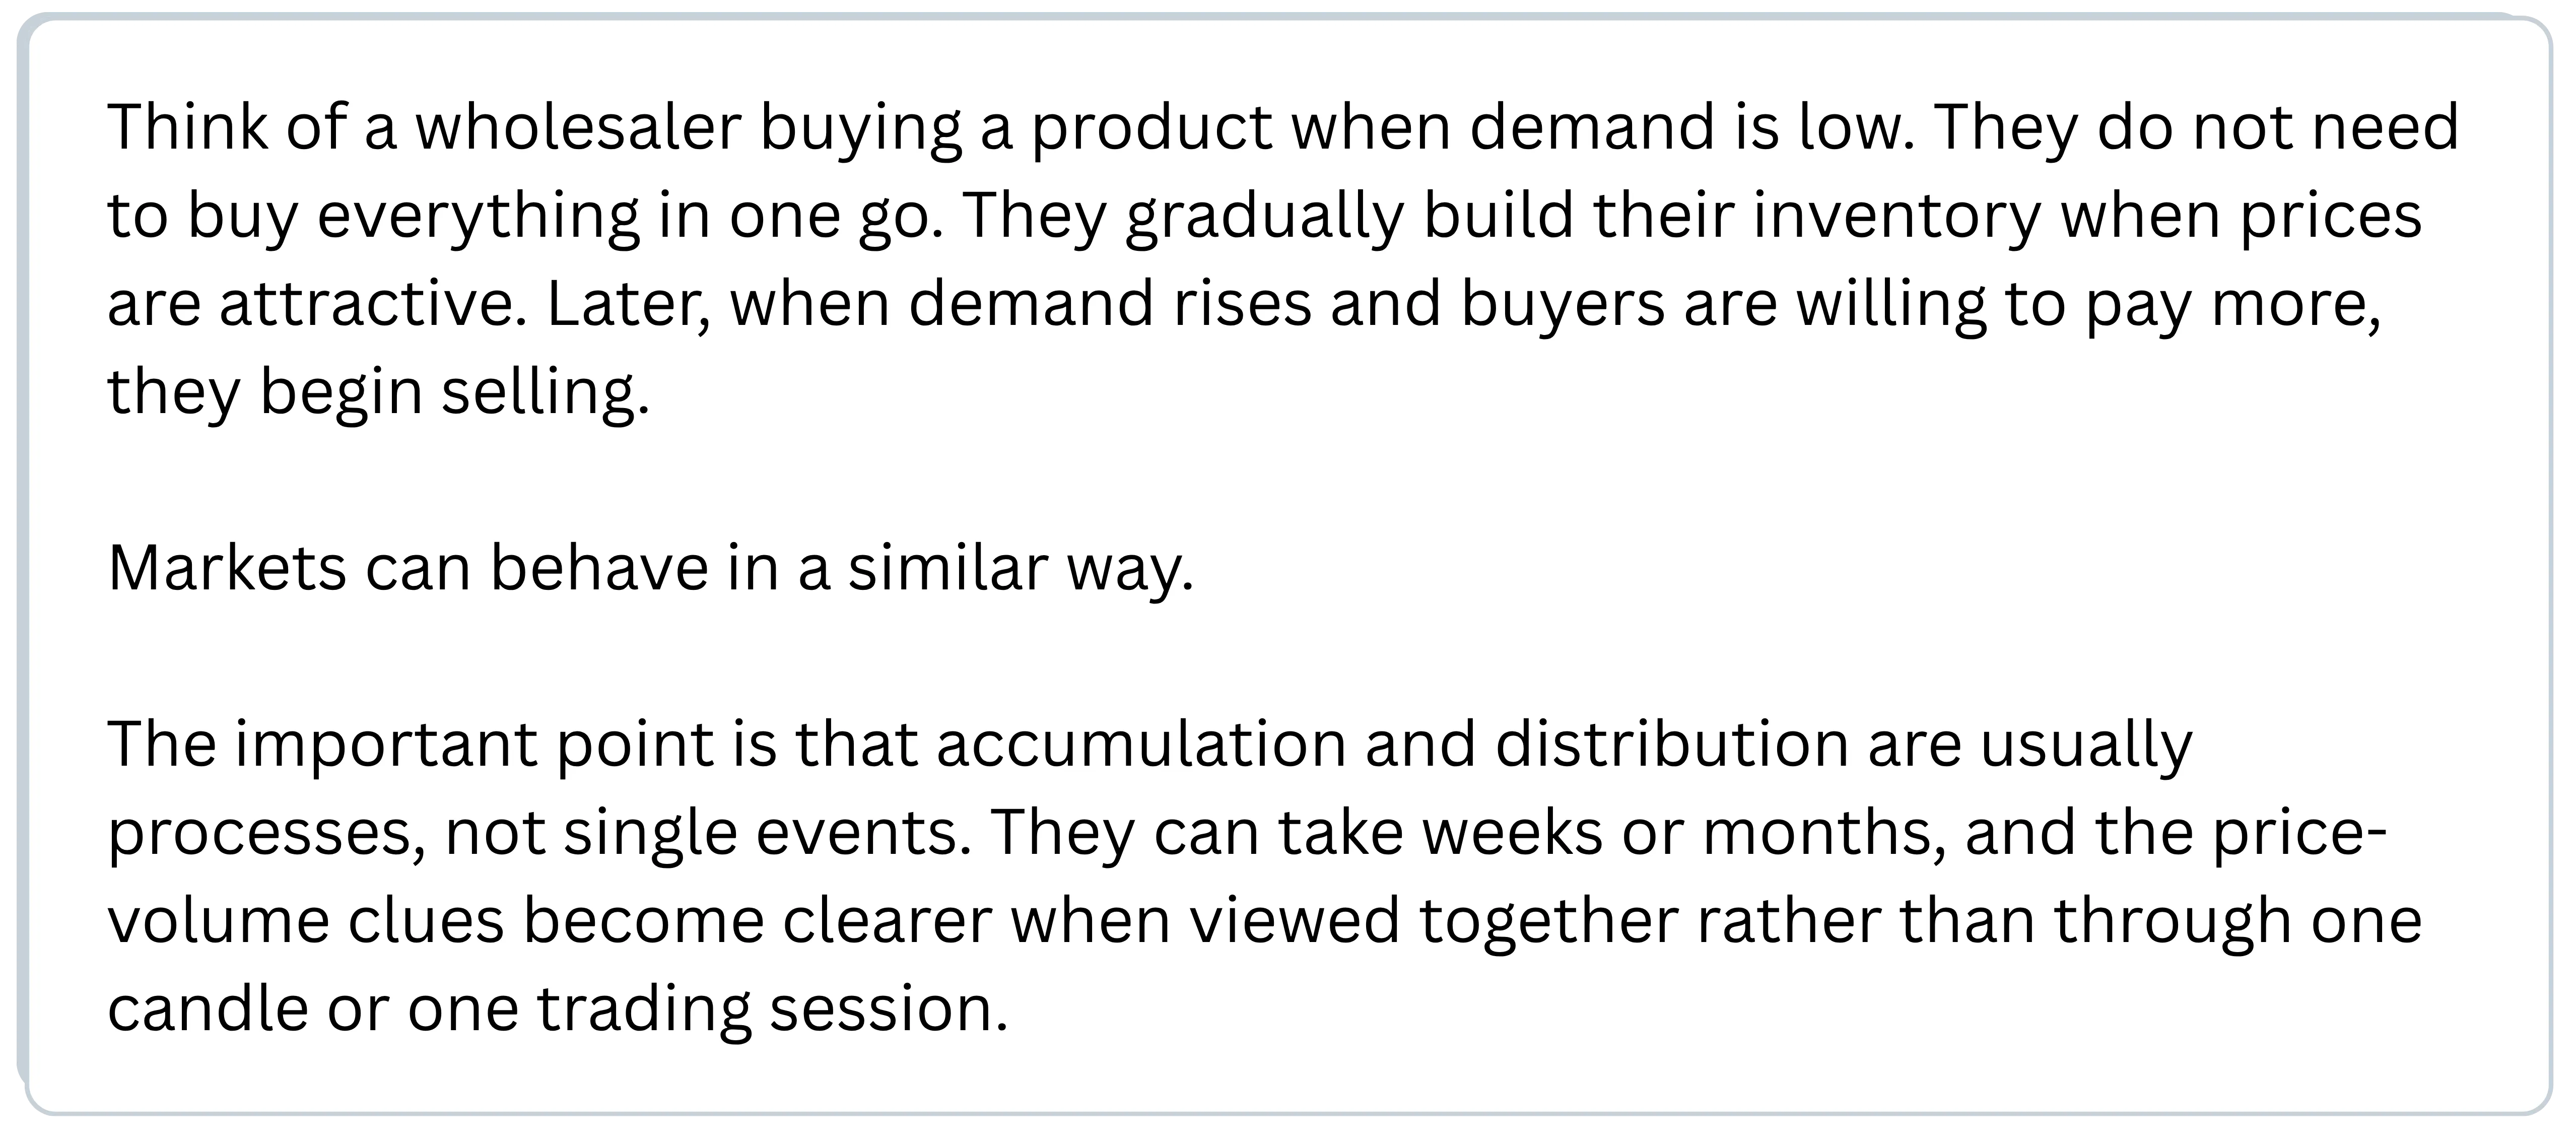
Think of a market cycle like the four seasons of a year. Each phase has its own characteristics, and one eventually gives way to another.
1. Accumulation: A stock moves sideways as larger participants gradually build positions without pushing the price sharply higher.
2. Markup: Once enough supply has been absorbed, demand begins to dominate, and the stock moves into an uptrend.
3. Distribution: After a substantial rise, selling starts appearing as larger participants gradually reduce their positions while demand is still strong.
4. Markdown: When selling eventually overwhelms demand, the stock begins to decline and enters a downtrend.
The Accumulation Phase
Accumulation generally occurs after a period of weakness or decline. Large participants looking to build a sizeable position cannot simply buy everything at once. A large wave of buying could push the price higher, making their own purchases more expensive.
Instead, buying may happen gradually while the stock remains within a relatively narrow trading range.
This is why accumulation can look uninteresting to retail traders. The stock may spend weeks moving between support and resistance with no obvious trend. But underneath that sideways movement, the balance between demand and supply may be changing.
Example
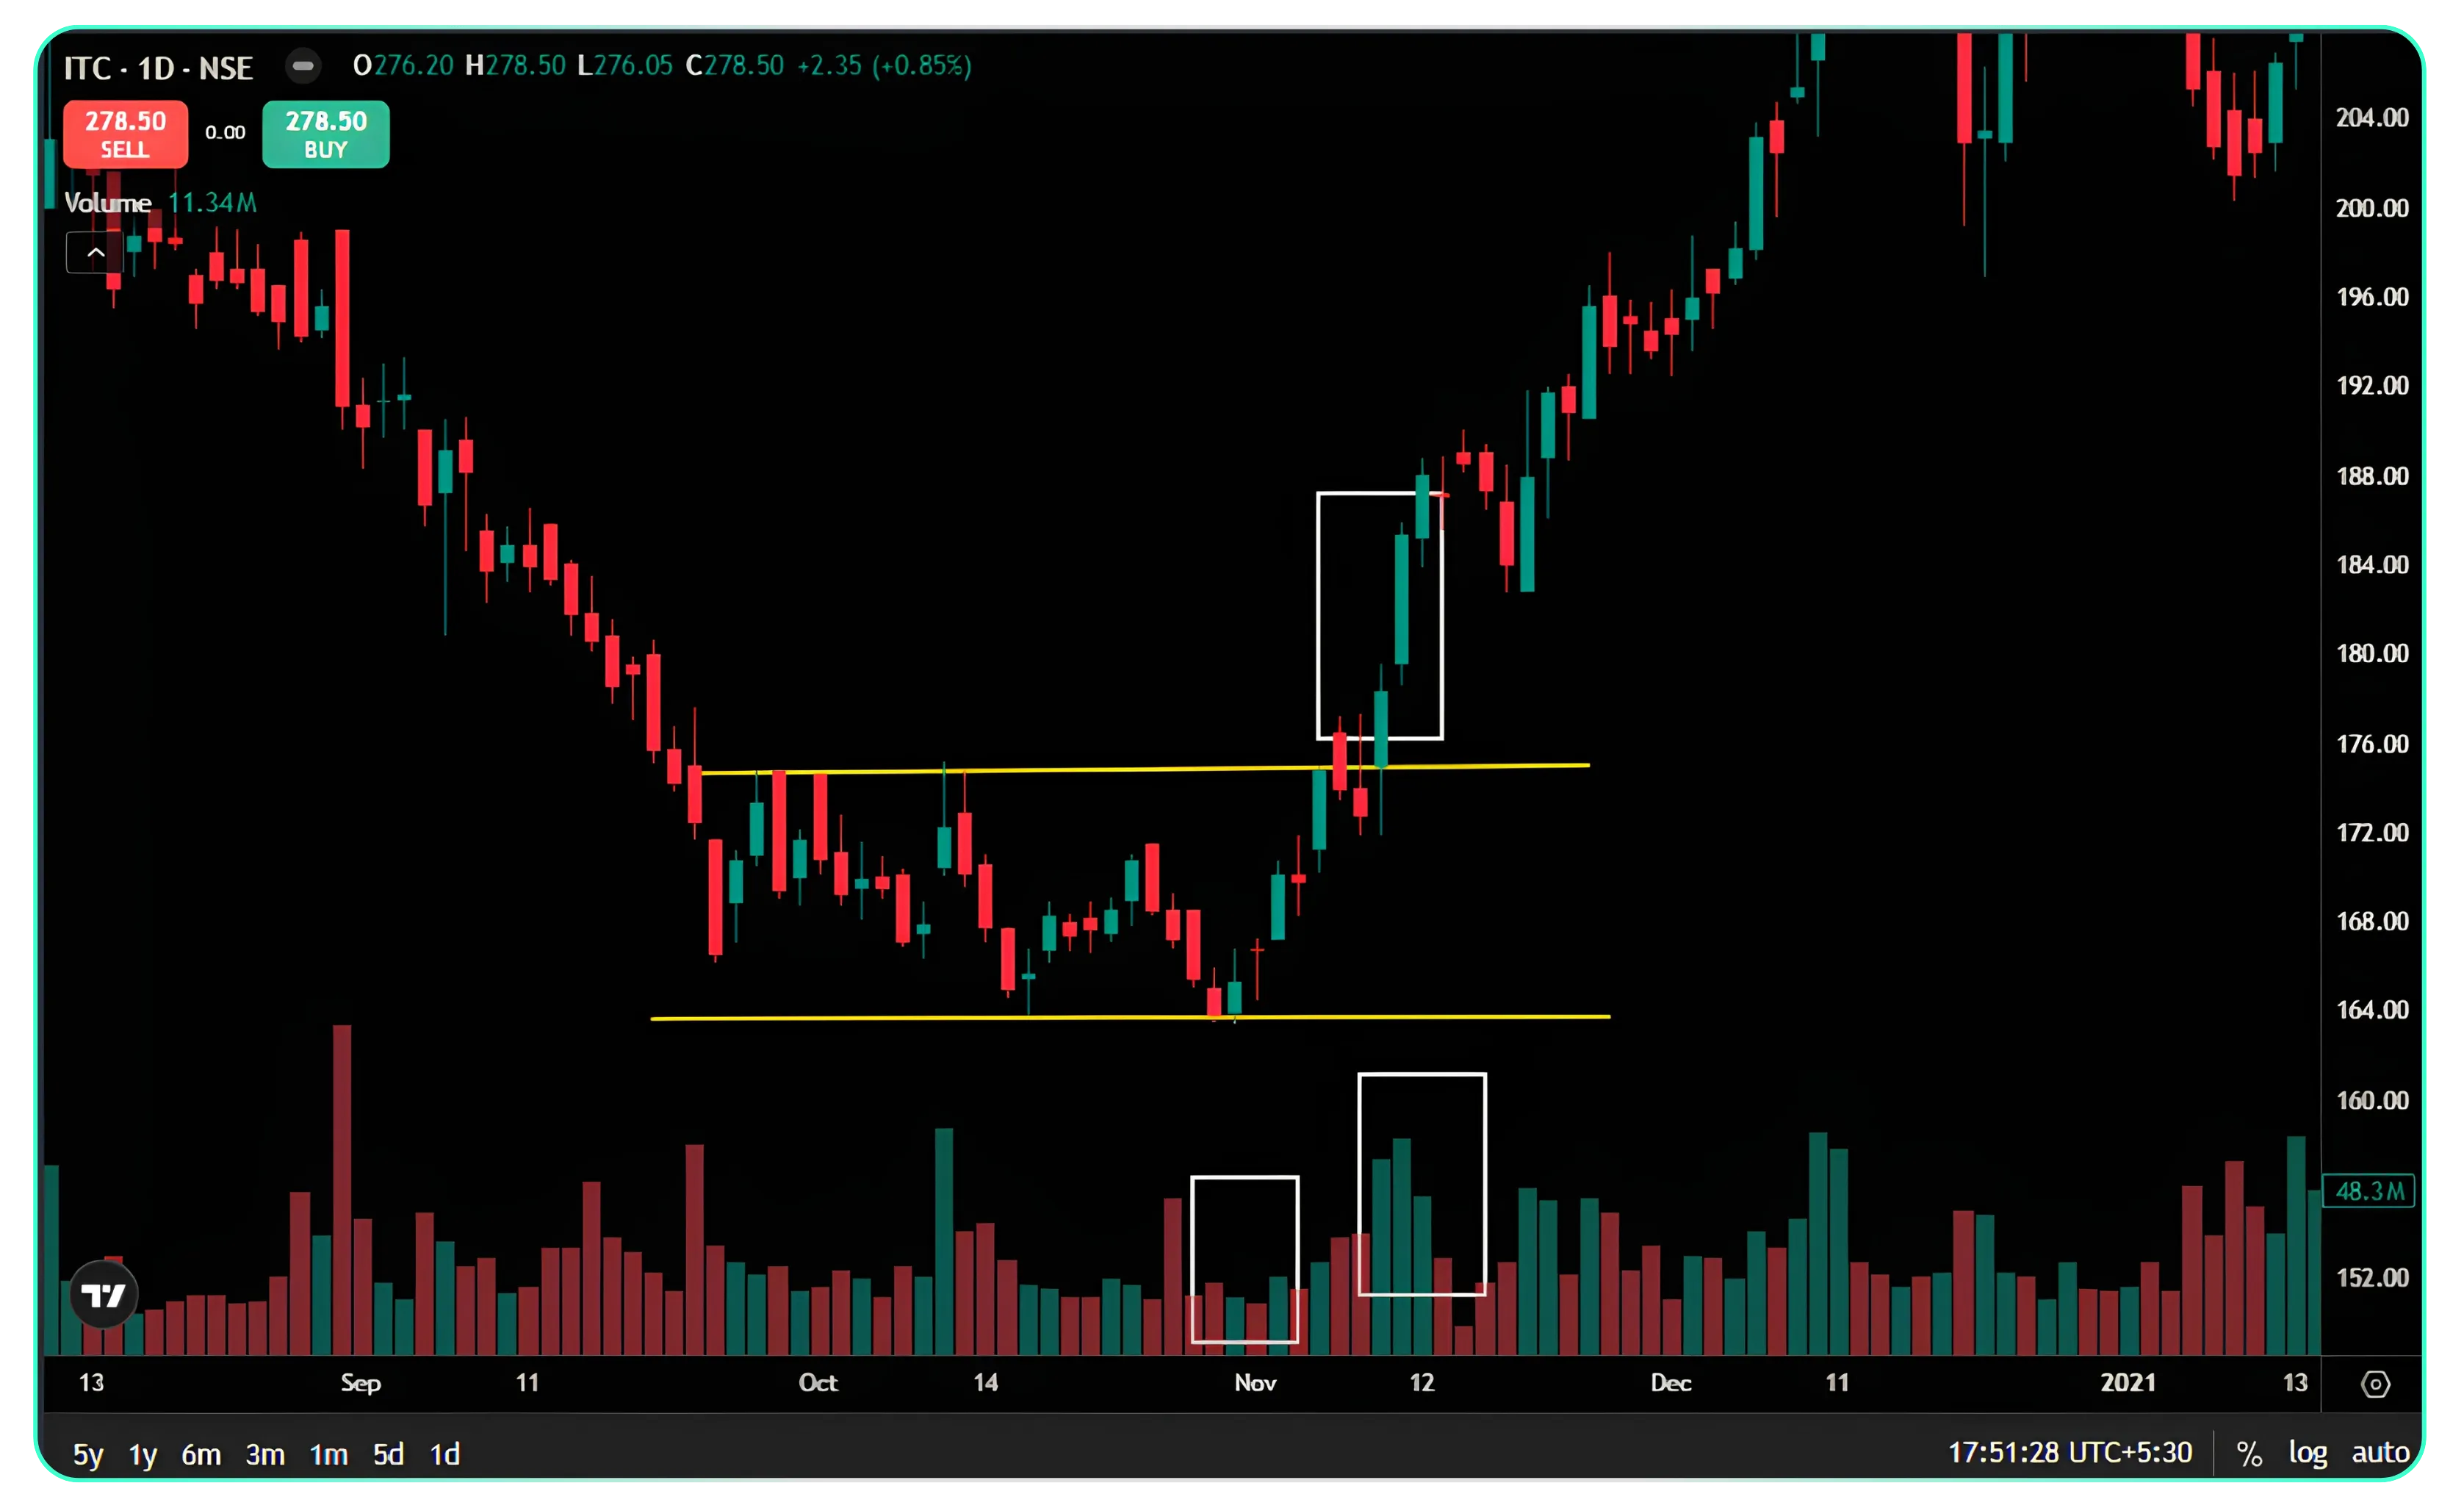
Imagine ITC trading between ₹165 and ₹175 for several months.
Each time the price approaches ₹165, selling appears, but buyers absorb much of that supply. The price does not break significantly lower and eventually returns towards the upper end of the range.
Now imagine that the stock starts falling towards ₹165 again, but the volume on these down-days becomes noticeably lower.
That can be an important VSA clue.
If less volume is required to push the stock lower, it may indicate that selling pressure is drying up. There may simply be fewer sellers left at those prices.
However, low volume by itself does not confirm accumulation. Traders need to look at the price spread, volume, and subsequent price action together.
If demand later becomes stronger and the stock breaks out of the range with convincing volume and price action, the accumulation interpretation becomes more meaningful.
The Distribution Phase
Distribution is essentially the other side of the cycle. After a strong rally, early buyers may want to book profits. But selling a large position requires sufficient demand from other market participants.
This is where distribution can develop. The stock may continue to appear strong because buyers are still active. Good news, strong earnings, positive analyst commentary, or bullish market sentiment can keep demand alive.
Meanwhile, selling pressure may gradually increase. Instead of immediately collapsing, the stock can move sideways near its highs while trading volume remains elevated.
Another Example
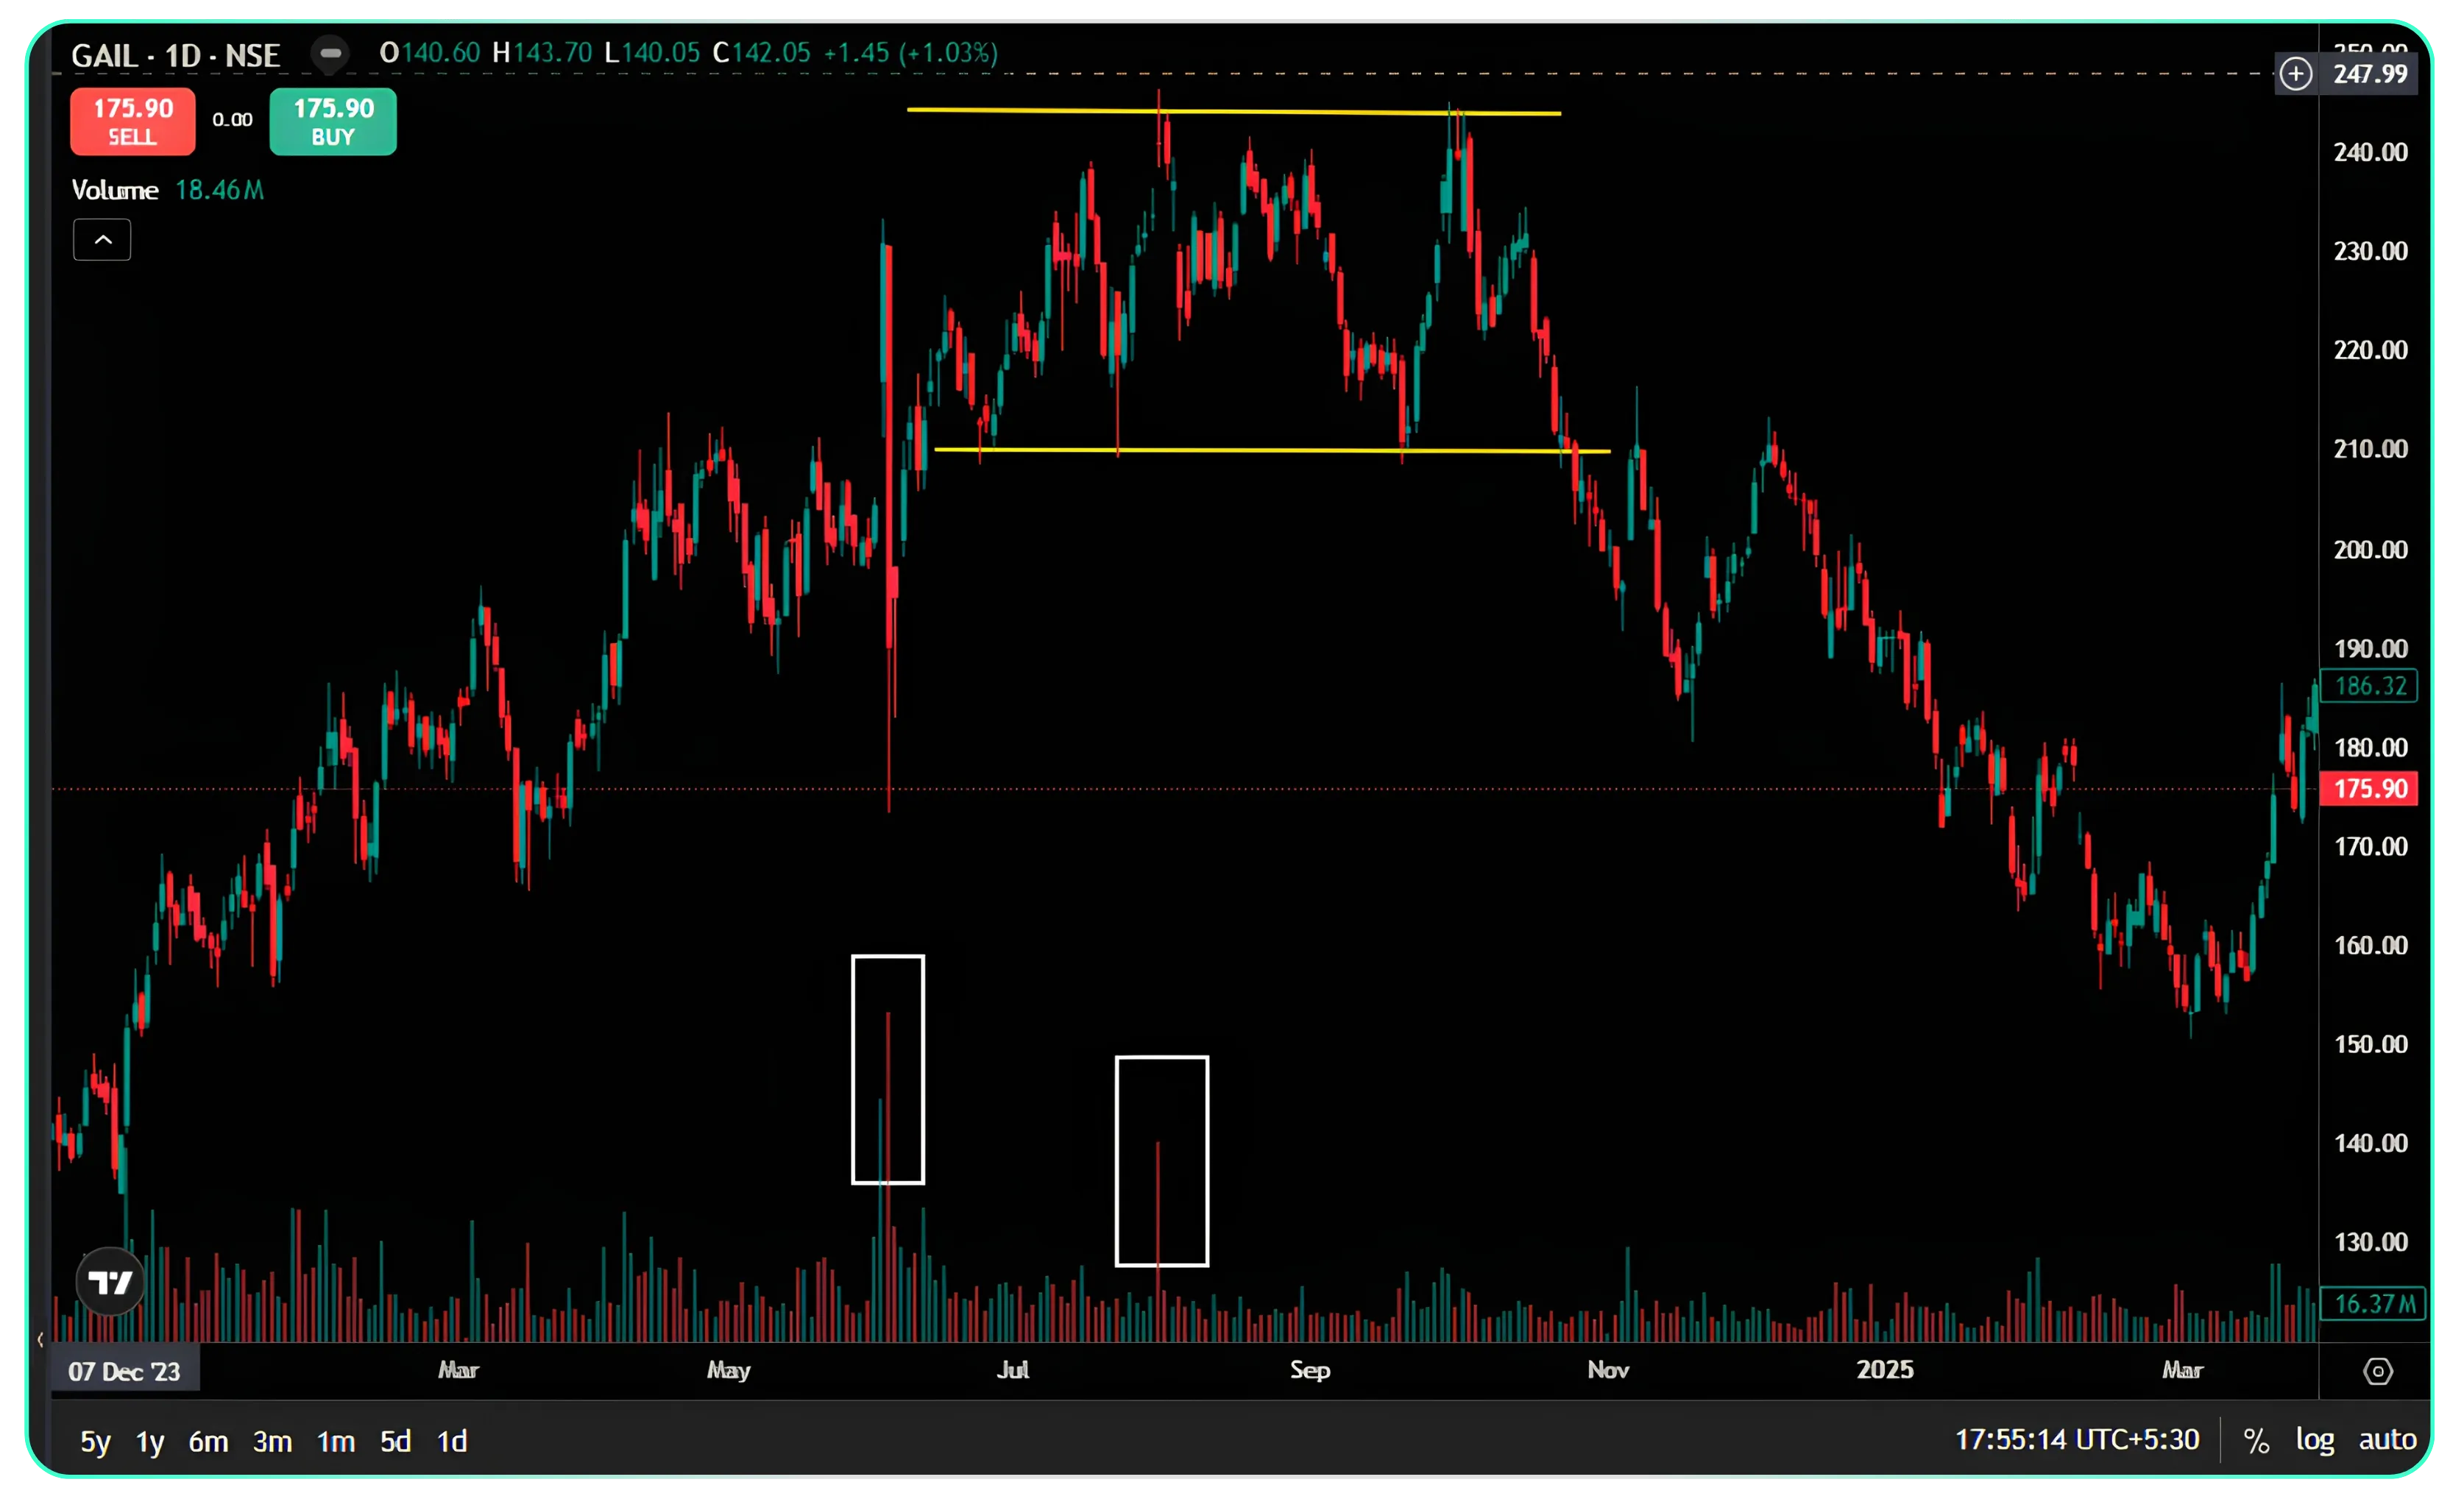
Consider GAIL after a substantial rally. The stock reaches a new high and then begins moving sideways near that level. Trading volume remains unusually high across several sessions, but despite all that activity, the price struggles to make meaningful progress above its previous high.
That combination deserves attention. High volume + limited upward progress can suggest that significant supply is entering the market. It does not automatically mean distribution. The stock could also be undergoing healthy consolidation. The difference becomes clearer through what happens next.
If the stock repeatedly fails to move higher, starts showing weakness, and eventually breaks important support below, the distribution interpretation gains strength. Once demand weakens and selling takes control, the market can transition into the markdown phase.
Why Volume Matters
This is where VSA becomes particularly useful. Price tells you where the market moved. Volume tells you how much activity was behind that move. The spread of the candle tells you how far the price travelled during that activity. Looking at these three together can provide a better understanding of the balance between demand and supply.
For example:
High volume + strong price rise: Demand may be dominant.
High volume + little upward progress: Supply may be entering the market.
Low volume + falling price: Selling pressure may be weakening, depending on where it occurs in the overall structure.
Low volume near support: Could indicate that supply is drying up, particularly if followed by stronger demand.
None of these combinations should be treated as a standalone buy or sell signal. Context matters.
Accumulation vs. Distribution
| Accumulation | Distribution |
|---|---|
| Usually follows a decline | Usually follows a strong rise |
| Price moves sideways near lower levels. | Price moves sideways near higher levels. |
| Selling pressure may gradually dry up. | Supply may gradually increase. |
| Demand begins absorbing available supply. | Supply begins absorbing available demand. |
| Can lead to a markup phase. | Can lead to a markdown phase. |
This is why simply seeing a stock move sideways is not enough. A sideways market near the bottom is not automatically accumulation, and a sideways market near the top is not automatically distribution.
The preceding trend, volume, price spread, support and resistance, and what happens after the range all matter. So Traders! You need to….
Identify the phase before taking a position: Before buying a stock, ask where it is in the larger market cycle. Buying after a long rally without checking for signs of distribution can expose you to unnecessary downside.
Watch for supply drying up: Declining volume on down-bars near important support can be a useful clue that selling pressure is weakening. Look for confirmation through subsequent price action.
Do not let news override price and volume: Positive news can attract buyers even when supply is entering the market. Instead of relying solely on headlines, observe how price reacts to the news and the volume accompanying that move.
Give context more importance than one candle: A single high-volume candle does not tell the entire story. VSA works best when you study a sequence of price and volume behaviour.
Zoom out to the broader market: The same principles can be applied to indices such as the Nifty 50 and Bank Nifty. Understanding the broader market phase can provide useful context when analysing individual stocks.
Next in the series
Reading Candlestick Spreads Alongside Volume: The VSA Method
Disclaimer: The information provided in our blogs is for informational purposes only and should not be construed as financial, investment, or trading advice. Trading and investing in the securities market carries risk. Always conduct your own research and consult with a qualified financial advisor before making any investment decisions. Past performance is not indicative of future results. Copyrighted and original content for your trading and investing needs.
© 2026 — Tradejini. All Rights Reserved.