


Every trader who has spent any time studying charts has heard of support and resistance. The concept is simple enough: price levels where the market previously reversed tend to attract attention when revisited. Former highs become resistance when approached from below; former lows become support when tested from above. What is less commonly understood, especially for those approaching price action for the first time, is how to use this information correctly and how to avoid the traps it sets.
The first and most important application of support and resistance in price action trading is identifying which side of the market is dominant. In any chart, at any time, one party is in control. The way to identify them is straightforward: follow the sequence of highs and lows. If a chart is making higher highs and higher lows, each rally exceeding the previous one, each pullback stopping above the previous pullback's low, the bulls are dominant. If the chart is making lower highs and lower lows, the bears are in control. This sounds obvious, but it has a direct and powerful implication: understanding market dominance in trading in India is not optional. It is the single filter that separates high-probability setups from noise.
Also read: The concept of double pressure and breakout energy
Take HDFC Bank on a session where it has opened above the previous day's close, rallied sharply in the first hour, and pulled back modestly while remaining above the opening range. Every attempt to short this stock, to bet that it will fall is a bet against demonstrated bullish dominance. The bears who try to short at the top of each minor rally are fighting the current. Most of them will be stopped out repeatedly. The price action trader sits on the sidelines from the short side and looks only for pullback entries, because intraday pullback trading in India works best when aligned with the direction of demonstrated pressure.
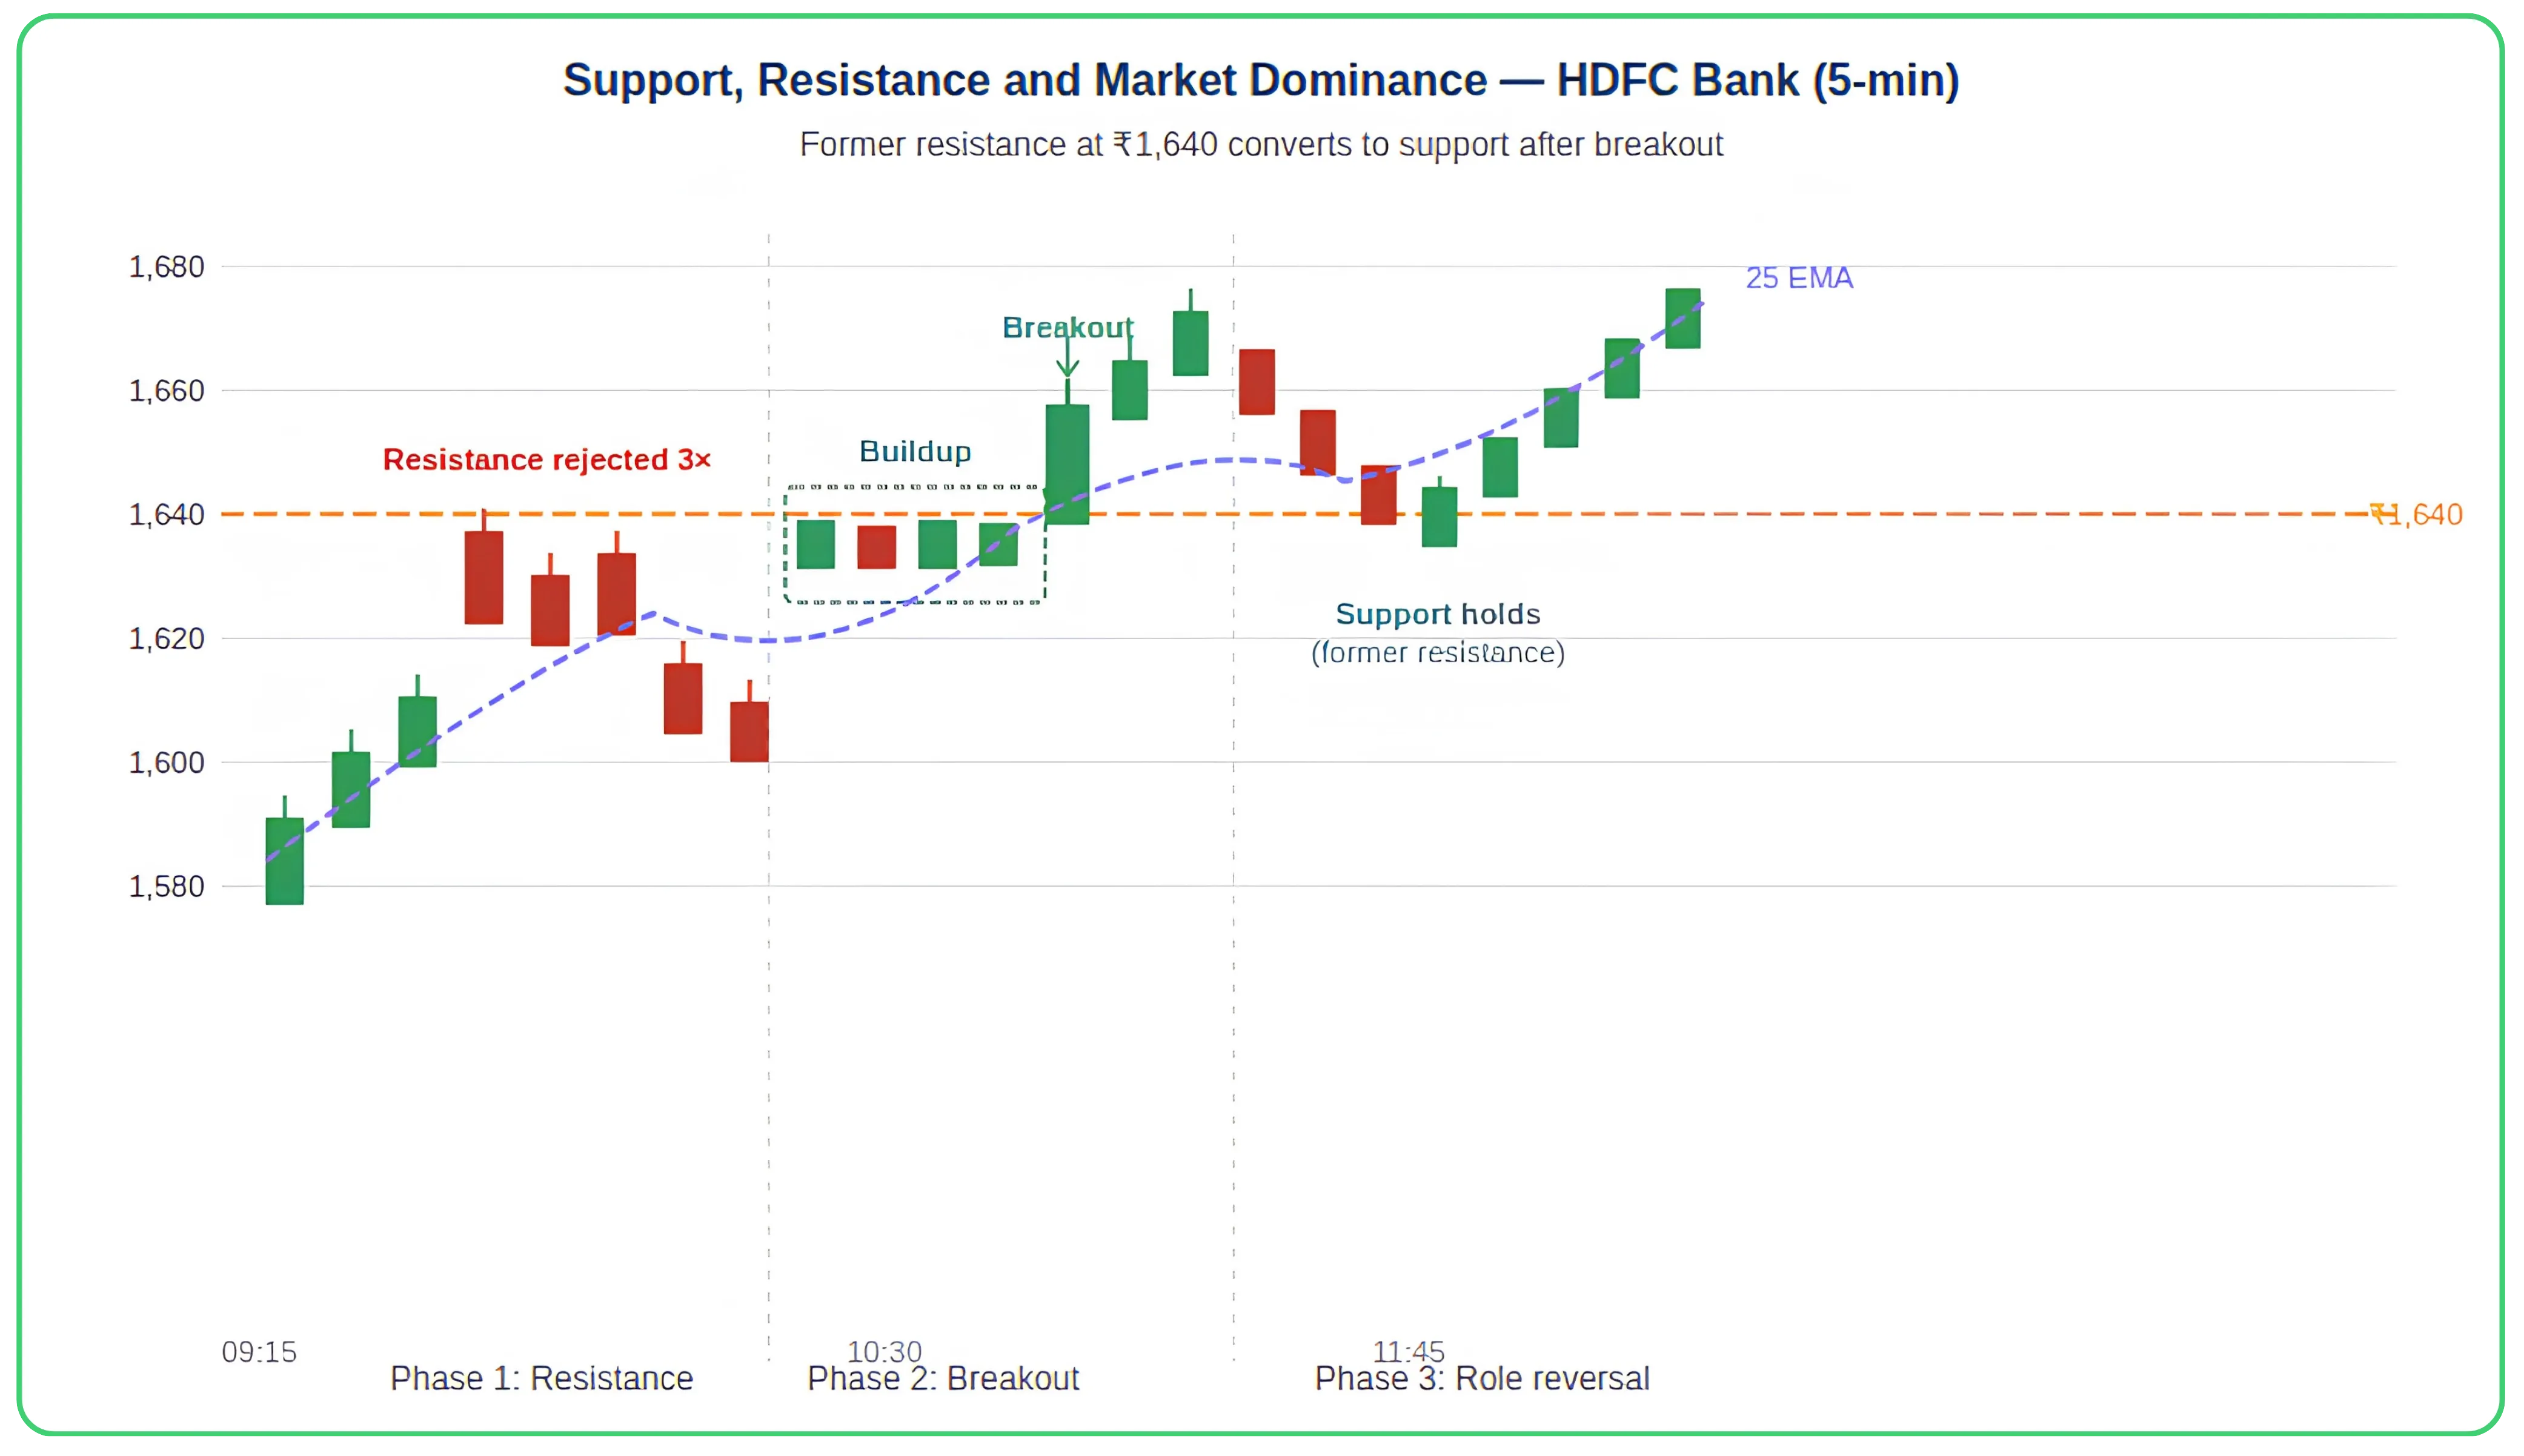
Figure 3.1 — HDFC Bank (5-min): Former resistance at ₹1,640 becomes support after a buildup-driven breakout. The 25 EMA confirms bullish dominance throughout.
The Conversion of Levels
When a resistance level is broken convincingly, when the price clears it, backs away, and then returns to test it from above without falling back through, that former resistance becomes support. This conversion is one of the most reliable and powerful phenomena in all of price action, and the Indian market demonstrates it with beautiful regularity. Consider a stock like Bajaj Finance that has been capped at ₹7,000 stock price for several sessions. When it finally breaks through that level, the ₹7,000 area transforms from a ceiling into a floor. Traders who missed the initial breakout now recognize the value of buying at former resistance, treating the level as a discounted entry rather than a threat. Sellers who are short from below the level are now trapped traders and are looking to exit on any bounce back to their entry points. This combination creates buying pressure at the former resistance, and the level holds.
The practical value of this conversion for the price action trader is significant. It tells him where to look for pullback reversal opportunities, not at arbitrary retracement levels derived from mathematical formulas, but at actual price levels where real money changed hands and real positions were established. Those levels carry psychological weight that no calculated level can replicate.
Also read: Types of Breakouts in the Stock Market
Dominance and the 25 EMA
The 25-period EMA price action is the single indicator used in this methodology, and its role is specific: it is a visual representation of recent dominance. When price is consistently trading above a rising 25 EMA, the bulls are in control. When price is consistently below a falling 25 EMA, the bears have the advantage. The average is not used to generate buy and sell signals in the traditional sense, it is not crossed to trigger entries. Instead, it provides three pieces of information that are genuinely useful.
First, it tells you whether a pullback has run far enough. In a bullish trend on Nifty 50 futures, a pullback that brings the price back to the 25 EMA without violating it is a healthy correction, the kind that sets up a valid reversal trade. A pullback that cuts aggressively through the average and leaves it behind suggests something more significant is happening, and caution is warranted. Second, the average acts as a layer of dynamic support or resistance. Entries taken near the 25 EMA have a natural safety zone, if the price retreats back through it significantly, the trade has likely failed and should be exited at the stop loss with a small, controlled loss" . Third, it helps identify the squeeze: when price and the 25 EMA converge at a pattern boundary simultaneously, the pre-breakout tension is at its maximum, and the resulting move tends to be powerful.
Disclaimer: The information provided in our blogs is for informational purposes only and should not be construed as financial, investment, or trading advice. Trading and investing in the securities market carries risk. Always conduct your own research and consult with a qualified financial advisor before making any investment decisions. Past performance is not indicative of future results. Copyrighted and original content for your trading and investing needs.
© 2026 — Tradejini. All Rights Reserved.


