


Not all breakouts are created equal. This is perhaps the single most important practical insight in price action trading, and it is the one that most retail traders in India never fully internalise. They see a stock break above a resistance level and they buy. They see it break below a support level and they sell. They do this consistently and they consistently lose money, because a significant proportion of all apparent breakouts are, in fact, traps.
There are three categories of break, and learning to distinguish between them before acting is the core skill of this entire methodology.
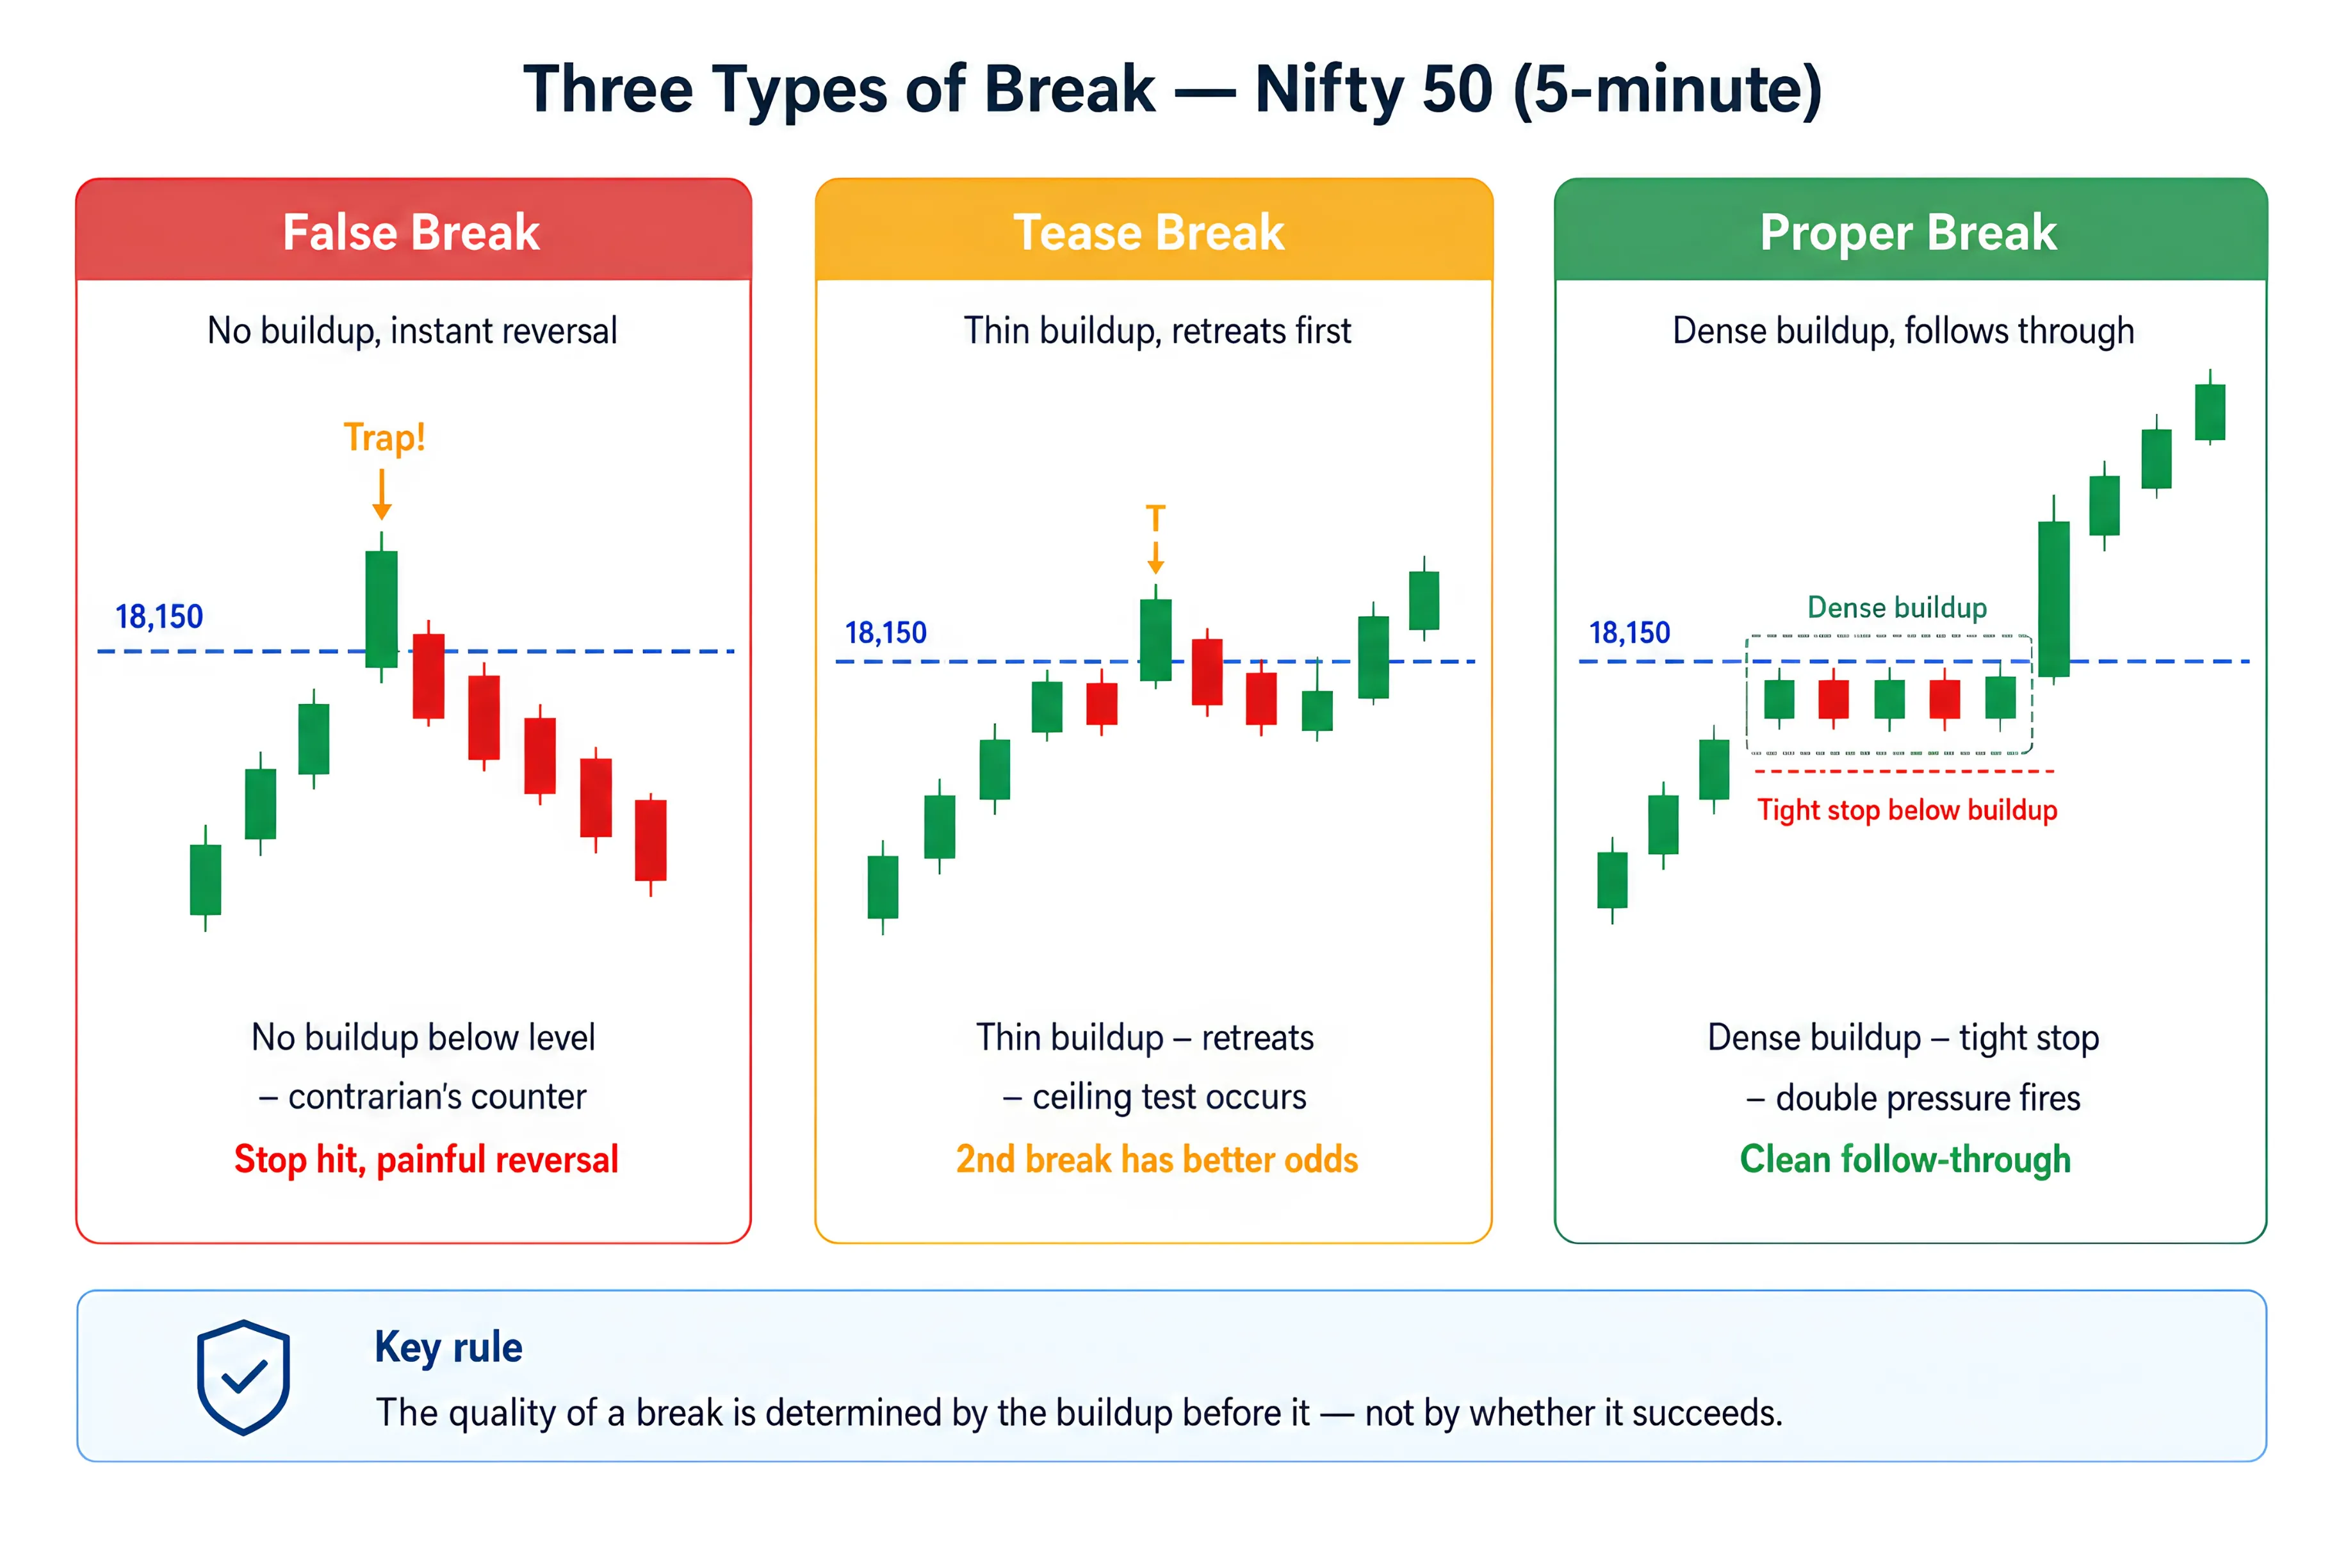
Figure 4.1 — Nifty 50 (5-min): Three breakouts from the same level, three completely different outcomes — determined entirely by the quality of buildup before each event.
The False Break Trap
A false break is exactly what it sounds like: the price crosses a key level, briefly trades on the other side, and then reverses sharply back through it. For anyone who entered on the break, the reversal is immediate and painful. False breaks are not random, they are systematically engineered by the market's dynamics. When a breakout lacks buildup, there are no trapped positions on the other side to generate double pressure. The contrarian traders, those who make their living fading poor-quality breaks recognise the absence of buildup and act immediately against the break. Their selling into a bull break, or buying into a bear break, creates the reversal.
In the Indian market, false break traps are especially common in Bank Nifty around key levels like ₹44,000 or ₹45,000. These round numbers attract enormous attention. As the price approaches them, retail traders begin to anticipate the breakout and position early. The market then breaks through the level briefly, just far enough to trigger the stops of the contrarians who were fading it, before reversing aggressively as the initial buyers have no reinforcements. The retail traders who bought the break are left holding a losing position as the price falls back below the level they just paid for.
*This type of false breakout Nifty Bank Nifty behaviour is frequently observed around psychological levels where retail participation is highest. A classic Bank Nifty breakout trap often begins with an apparent breakout that attracts buyers before reversing sharply.
The Tease Break
A tease break is subtler and more dangerous than a false break, because it contains enough elements of a proper setup to lure in experienced traders as well as novices. In a tease break, there is some buildup at the pattern boundary, enough to be encouraging, but not enough to generate the full weight of double pressure required for sustained follow-through. The price breaks out, moves a small distance in the intended direction, and then retreats. It does not always fail completely; often the price returns to test the broken level from the other side before ultimately succeeding on a second attempt.
Missed part 3? Read here: Reading Support, Resistance & Market Dominance
The Proper Break
A proper break stems from dense, clearly visible buildup directly at the pattern boundary. In a five-minute chart of Nifty 50 futures, this looks like four to eight consecutive bars trading in a tight range just below a key level, with each bar testing the level and being pushed back, but not falling away holding firm, building tension. This type of breakout tight range behaviour often signals increasing pressure beneath resistance. When the break finally comes, it emerges from this tight cluster, and the stop can be placed just below the lowest point of the buildup. The risk on the trade is small and precisely defined. The potential reward driven by the double pressure that the trapped positions generate is large.
The visual difference between a tease break and a proper break is something that takes time to train the eye to see. Study a hundred examples on Infosys, Nifty 50, and TCS charts. Look for the clusters and breakout squeeze pattern formations, and evaluate the density of the buildup relative to the height of the pattern. Over time, traders become better at identifying false break vs proper break setups and recognising when genuine breakout confirmation India is present. This skill is particularly useful when analysing Nifty 50 breakout patterns and conducting intraday technical analysis India across liquid stocks and indices. Eventually, the distinction becomes almost automatic. You will glance at a setup and immediately know whether it has the weight and structure required to follow through or whether it is more likely to become another failed breakout.
So, open your Tradejini account and access the charts, tools, and market data you need to identify high-quality breakout setups with confidence.
Disclaimer: The information provided in our blogs is for informational purposes only and should not be construed as financial, investment, or trading advice. Trading and investing in the securities market carries risk. Always conduct your own research and consult with a qualified financial advisor before making any investment decisions. Past performance is not indicative of future results. Copyrighted and original content for your trading and investing needs.
© 2026 — Tradejini. All Rights Reserved.