
From intraday moves on the Nifty to multi-year consolidation breakouts, understanding how breakouts work is essential for traders and investors alike. In the Indian markets, breakouts are typically classified based on timeframe and price structure, with added influence from local factors like earnings cycles, policy events, and institutional activity.
For breakout for beginners India, the resistance breakout is often the best starting point, as it involves clearly visible price levels and straightforward volume-based confirmation signals.
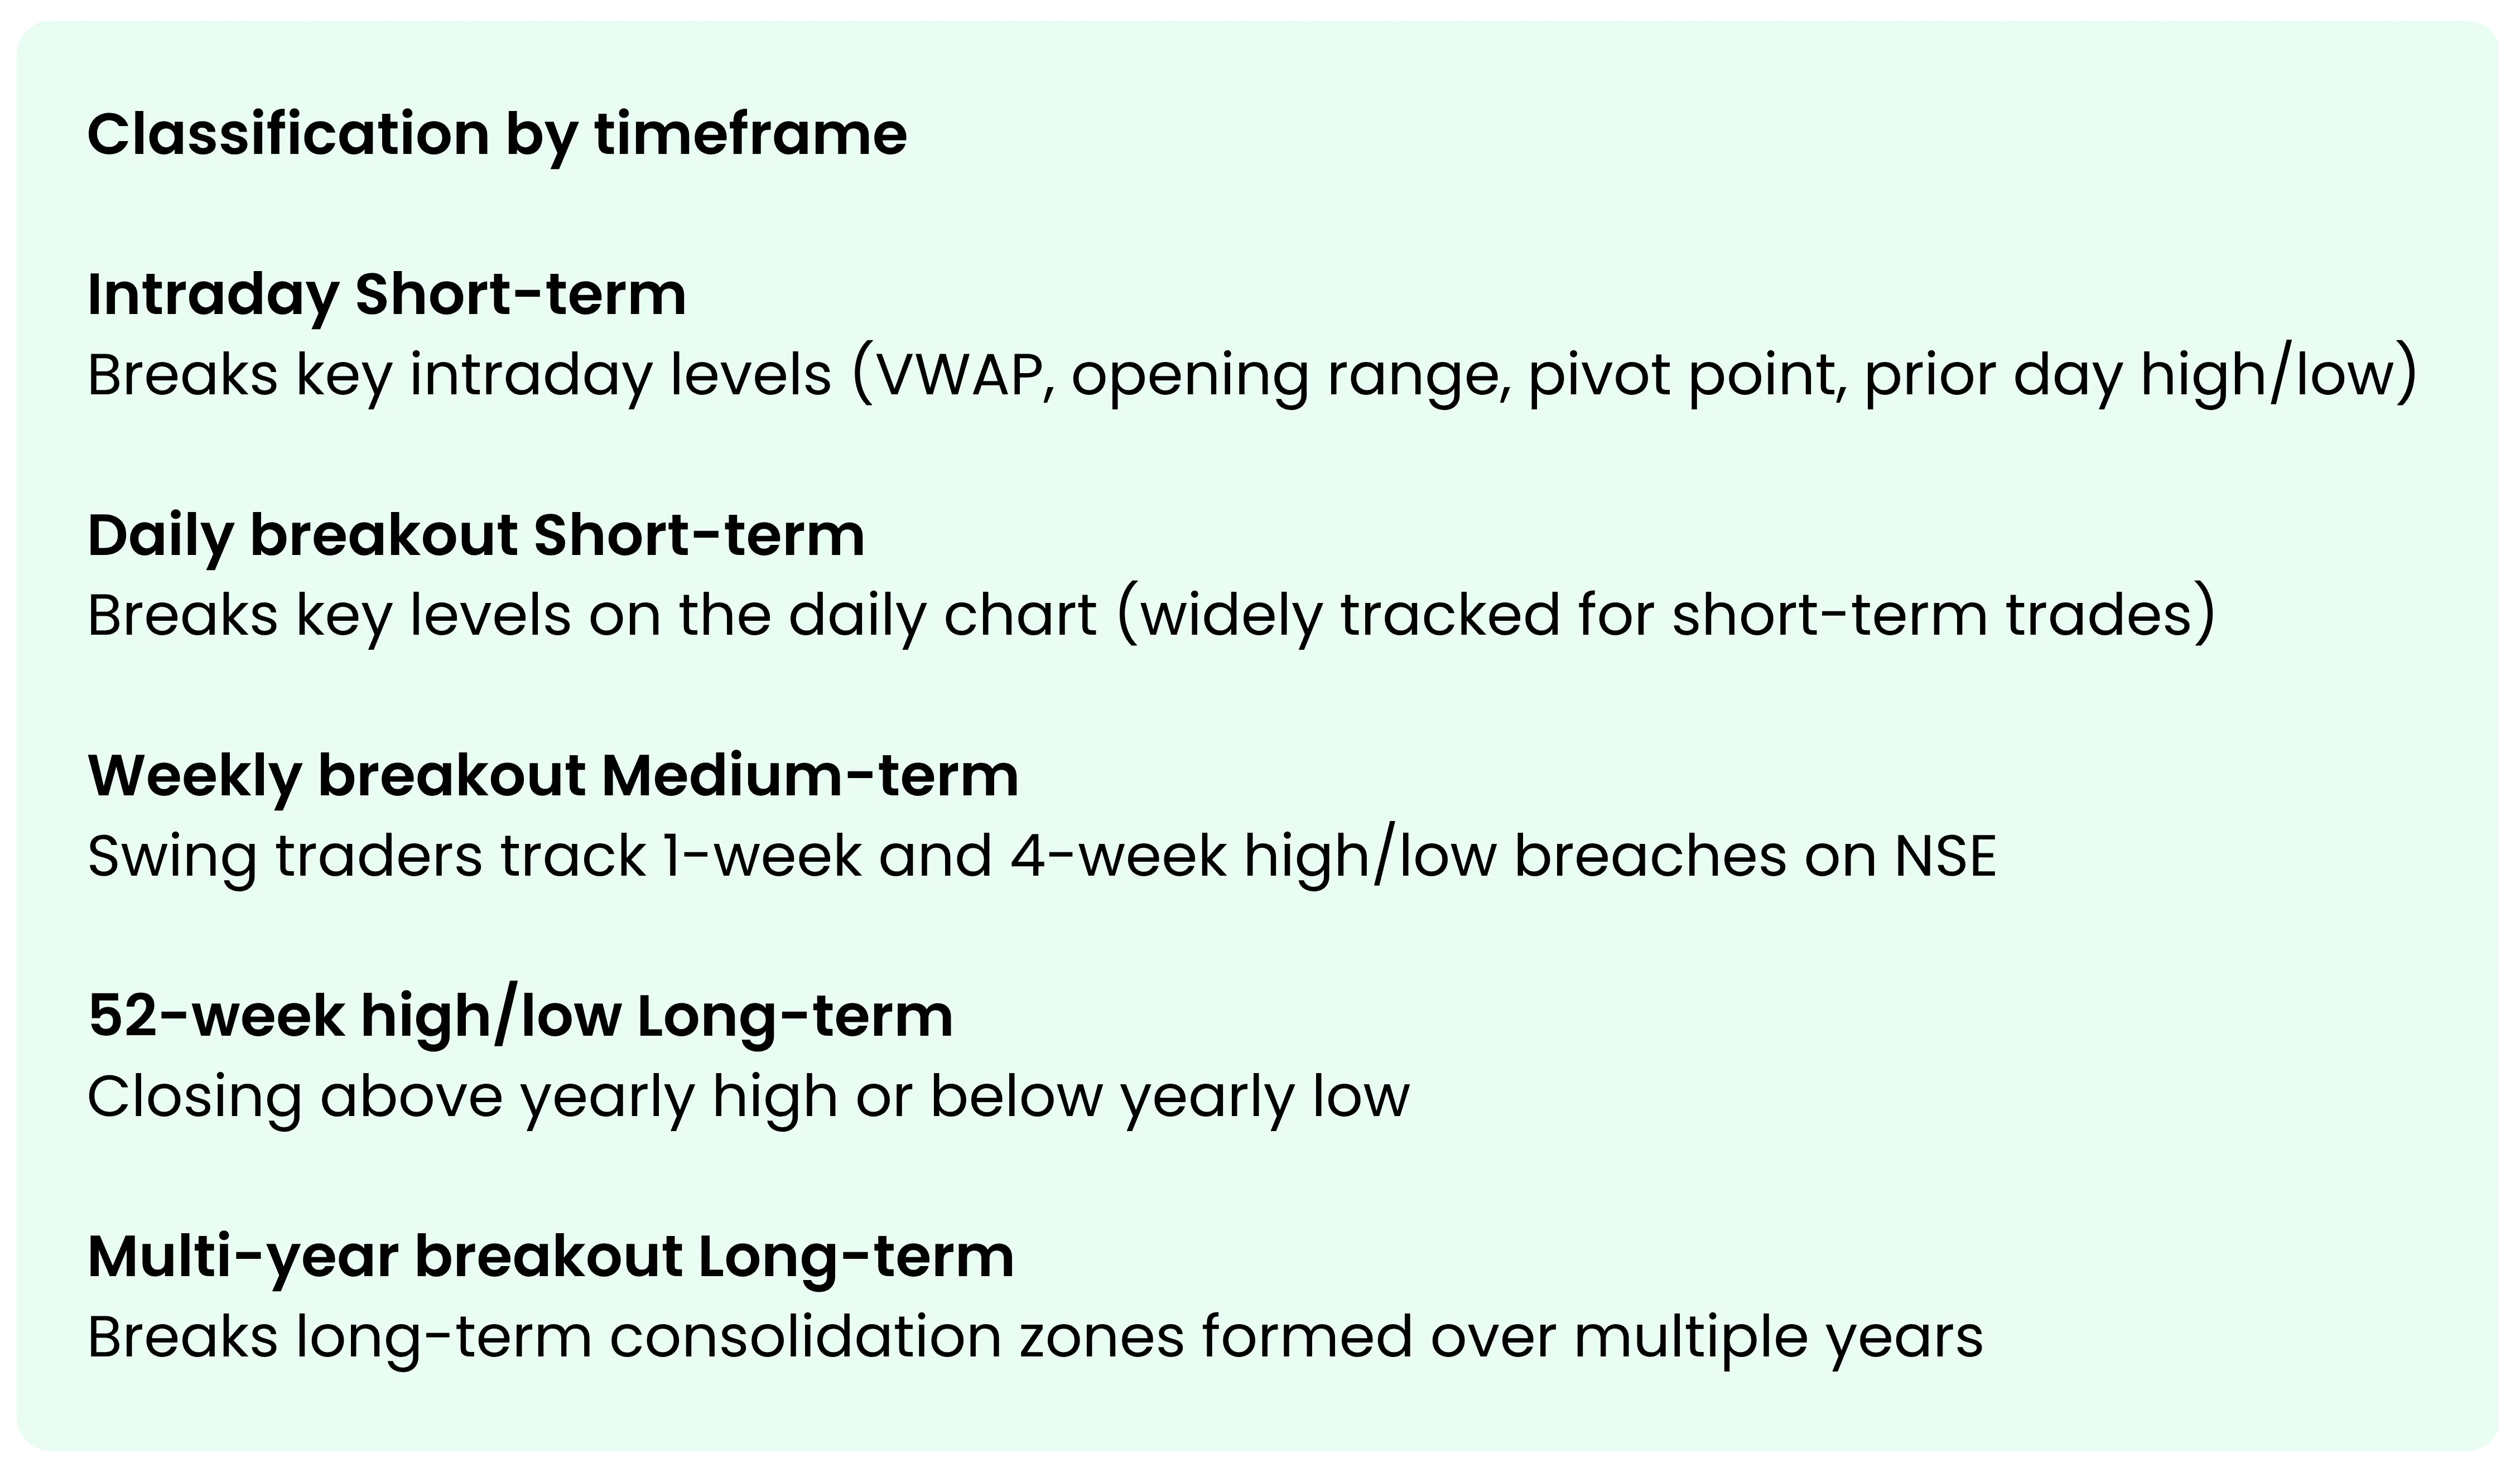
How Breakouts Are Classified
| By Structure | By Timeframe |
|---|---|
| Breakouts are defined by the price pattern or level being breached, such as resistance zones, trendlines, or chart formations. |
Intraday, daily, weekly, and 52-week breakouts are commonly tracked. A breakout is more reliable when price sustains and closes above the level, but closing confirmation is not mandatory, as intraday traders often act on real-time price moves without waiting for a close. |
Types of Breakouts
1. Resistance Breakout (Upside Breakout)
Bullish
This is the most widely tracked breakout in Indian markets. It occurs when price moves above a clearly defined resistance level with strong volume. For example, if a stock trades between ₹100 and ₹110 for weeks and then closes above ₹110 with increased participation, it signals a potential bullish move. Traders often project targets by adding the range of the consolidation to the breakout level.
A particularly significant variant is the All-Time High (ATH) breakout, where a stock breaks above its lifetime high with no prior overhead resistance. These are actively tracked on platforms like Tradejini, and are considered high-conviction setups because no supply overhang exists above the breakout level.
2. Support Breakdown (Downside Breakout)
Bearish
A support breakdown happens when price falls below a key support level with conviction. This is commonly used to identify weakness in stocks and indices. As with upside breakouts, volume plays a critical role. Breakdowns without breakout volume confirmation are often unreliable.
3. Trendline Breakout
Directional
This occurs when price breaks a trendline connecting higher lows (bullish) or lower highs (bearish). Trendline breakouts are widely used by both intraday and swing traders in India. Many traders prefer confirmation near the closing session to ensure the move sustains before taking positions.
For swing trading, trendline breakouts and weekly chart pattern breakouts are generally considered among the most effective setups, as they align with medium-term momentum and offer manageable risk-reward ratios.
New investors? Start with us
4. Chart Pattern Breakout
Bullish / Bearish
Breakouts from established chart patterns such as:
- Ascending and descending triangles
- Flags and pennants
- Cup and handle
- Double top/bottom
- Head and shoulders
In Indian markets, flag and pennant breakouts following earnings results are particularly common. Stocks in sectors like IT and pharma often form tight consolidation patterns post-results before breaking out in the direction of the larger trend.
5. Gap Breakout (Event-Driven)
High Volatility
Not all gaps qualify as breakouts. A gap becomes meaningful only when it clears a key level and sustains beyond it.A gap breakout occurs when price opens above a resistance level (or below support) due to a strong trigger, but not all gaps lead to valid breakouts. Many gaps tend to get filled, and a breakout is considered meaningful only when the price sustains beyond the level with follow-through.
6. Circuit Limit Moves
High Risk / Illiquidity Factor
Indian markets have price bands (2%, 5%, 10%, 20%) to control volatility. Stocks hitting upper circuits indicate strong demand but often reflect illiquidity and lack of sellers rather than true price discovery. Circuit moves are not reliable breakout signals and should be viewed as a market behaviour or risk factor, especially in small-cap stocks. In the F&O segment, circuit filters do not apply to futures, which can diverge from the underlying during such phases, creating basis risk.
7. Moving Average Breakout / Golden Cross
Trend Confirmation
When price moves above key moving averages (like 50-day or 200-day), or when a 50-day moving average crosses above the 200-day (Golden Cross), it signals strengthening trend momentum. These are typically used as confirmation indicators, rather than standalone breakout triggers.
The inverse, a 50-day moving average crossing below the 200-day (Death Cross), is similarly tracked as a bearish signal.
8. False Breakout (Fakeout)
Risk
A false breakout occurs when price moves above a key resistance level, which may include prior swing highs, round numbers, moving averages, or any technically significant level, but fails to sustain and quickly reverses. In volatile periods such as budget days or policy announcements, fakeouts are more frequent. This often traps traders who enter early.
Common signs of a false breakout:
- Weak or low volume
- Long wicks with no strong close
- Failure to hold above the breakout level on a closing basis
A classic Indian example: Nifty 50 briefly breached 18,600 during intraday trade in early 2023 on multiple occasions but failed to close above it convincingly, trapping long positions before reversing lower. Waiting for a daily close above the level would have avoided the trap.
To use pivot points for intraday breakout trading India, traders calculate daily pivot levels before market open and watch for price to breach R1 or R2 with volume expansion, using these pre-defined levels as both targets and stop-loss references.
Key Confirmation Factors in Indian Markets
Regardless of the type of breakout, most traders rely on a few core principles to validate the move. Closing confirmation is considered more reliable than intraday price spikes. Strong volume expansion helps confirm the strength of the breakout, ideally, breakout day volume should be noticeably higher than the 10-day or 20-day average volume. Many traders also wait for a retest of the breakout level to enter with better risk control. In addition, alignment across higher timeframes, such as daily and weekly charts, improves conviction.
Open interest (OI) data is another India-specific confirmation tool for stocks with derivatives. A breakout accompanied by rising OI suggests fresh positions are being built, but this is not always bullish. Rising OI can indicate either long buildup or short buildup, depending on price movement. Therefore, OI should always be interpreted along with price action. Flat or falling OI during a breakout can indicate short covering rather than genuine directional conviction, and may not sustain.
Institutional activity, often referred to as FII and DII flows in India, can further influence the strength and sustainability of breakout moves, especially in large-cap stocks. Days where both FIIs and DIIs are net buyers tend to produce cleaner breakouts with better follow-through.
Start your smart investing on CubePlus and take control of your financial goals.
Disclaimer: The information provided in our blogs is for informational purposes only and should not be construed as financial, investment, or trading advice. Trading and investing in the securities market carries risk. Always conduct your own research and consult with a qualified financial advisor before making any investment decisions. Past performance is not indicative of future results. Copyrighted and original content for your trading and investing needs.
© 2026 — Tradejini. All Rights Reserved.


