


Ever wondered if there is a way to instantly spot when a stock might be overbought or oversold? The answer is Bollinger Bands. Introduced by John Bollinger in the 1980s, this powerful technical analysis tool adapts to market volatility, helping traders identify potential entry and exit points. In Tradejini’s CubePlus, Bollinger Bands are built right into the platform, so you can track price swings in real time, sell signals often emerge near the upper band, while buy opportunities appear near the lower band.
How Bollinger Bands work
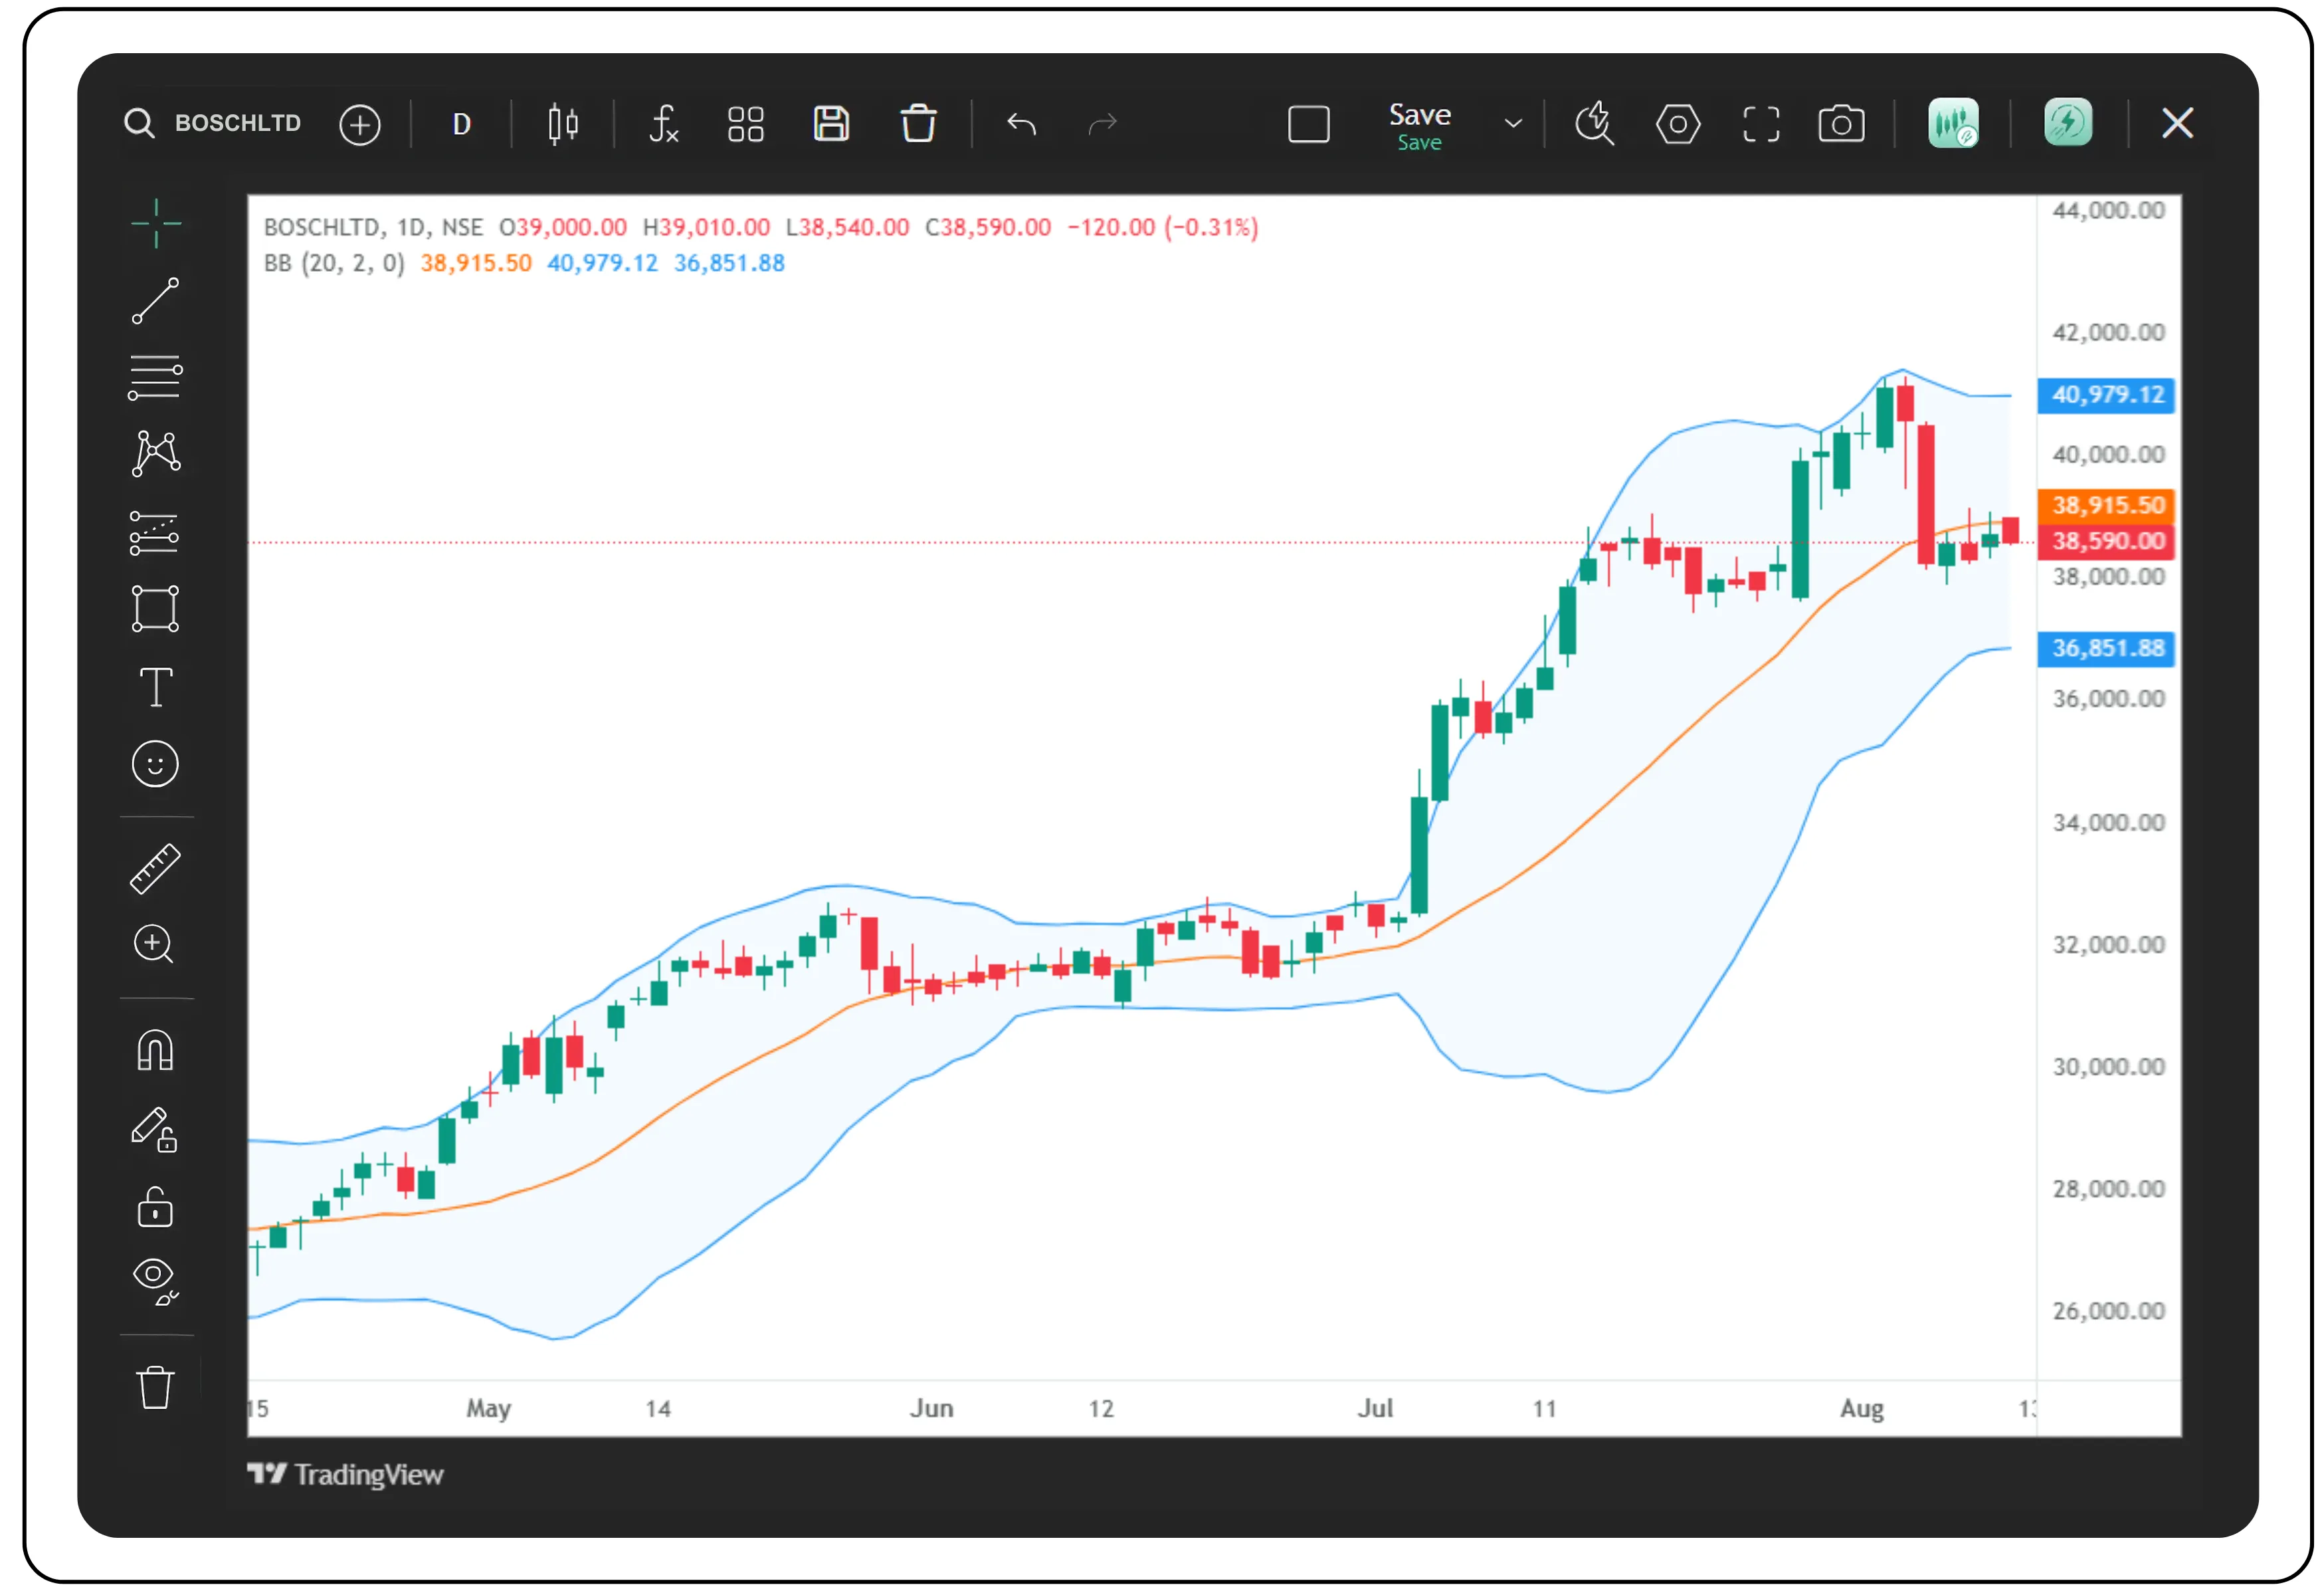
Bollinger Bands take traditional Moving Average, a step further by plotting a moving average along with upper band and lower band based on standard deviation.
Middle band: A moving average (commonly a 20-period Simple Moving Average for intermediate-term analysis). In CubePlus, you can easily adjust the Length.
Upper band: Middle Band + (Multiplier × standard deviation). CubePlus lets you change the Multiplier to widen or narrow the bands, adapting the indicator to your preferred sensitivity.
Lower band: Middle Band − (Multiplier × standard deviation).
Bollinger Bands in CubePlus aren’t just a static indicator, they are a flexible tool you can tune precisely to your trading style.
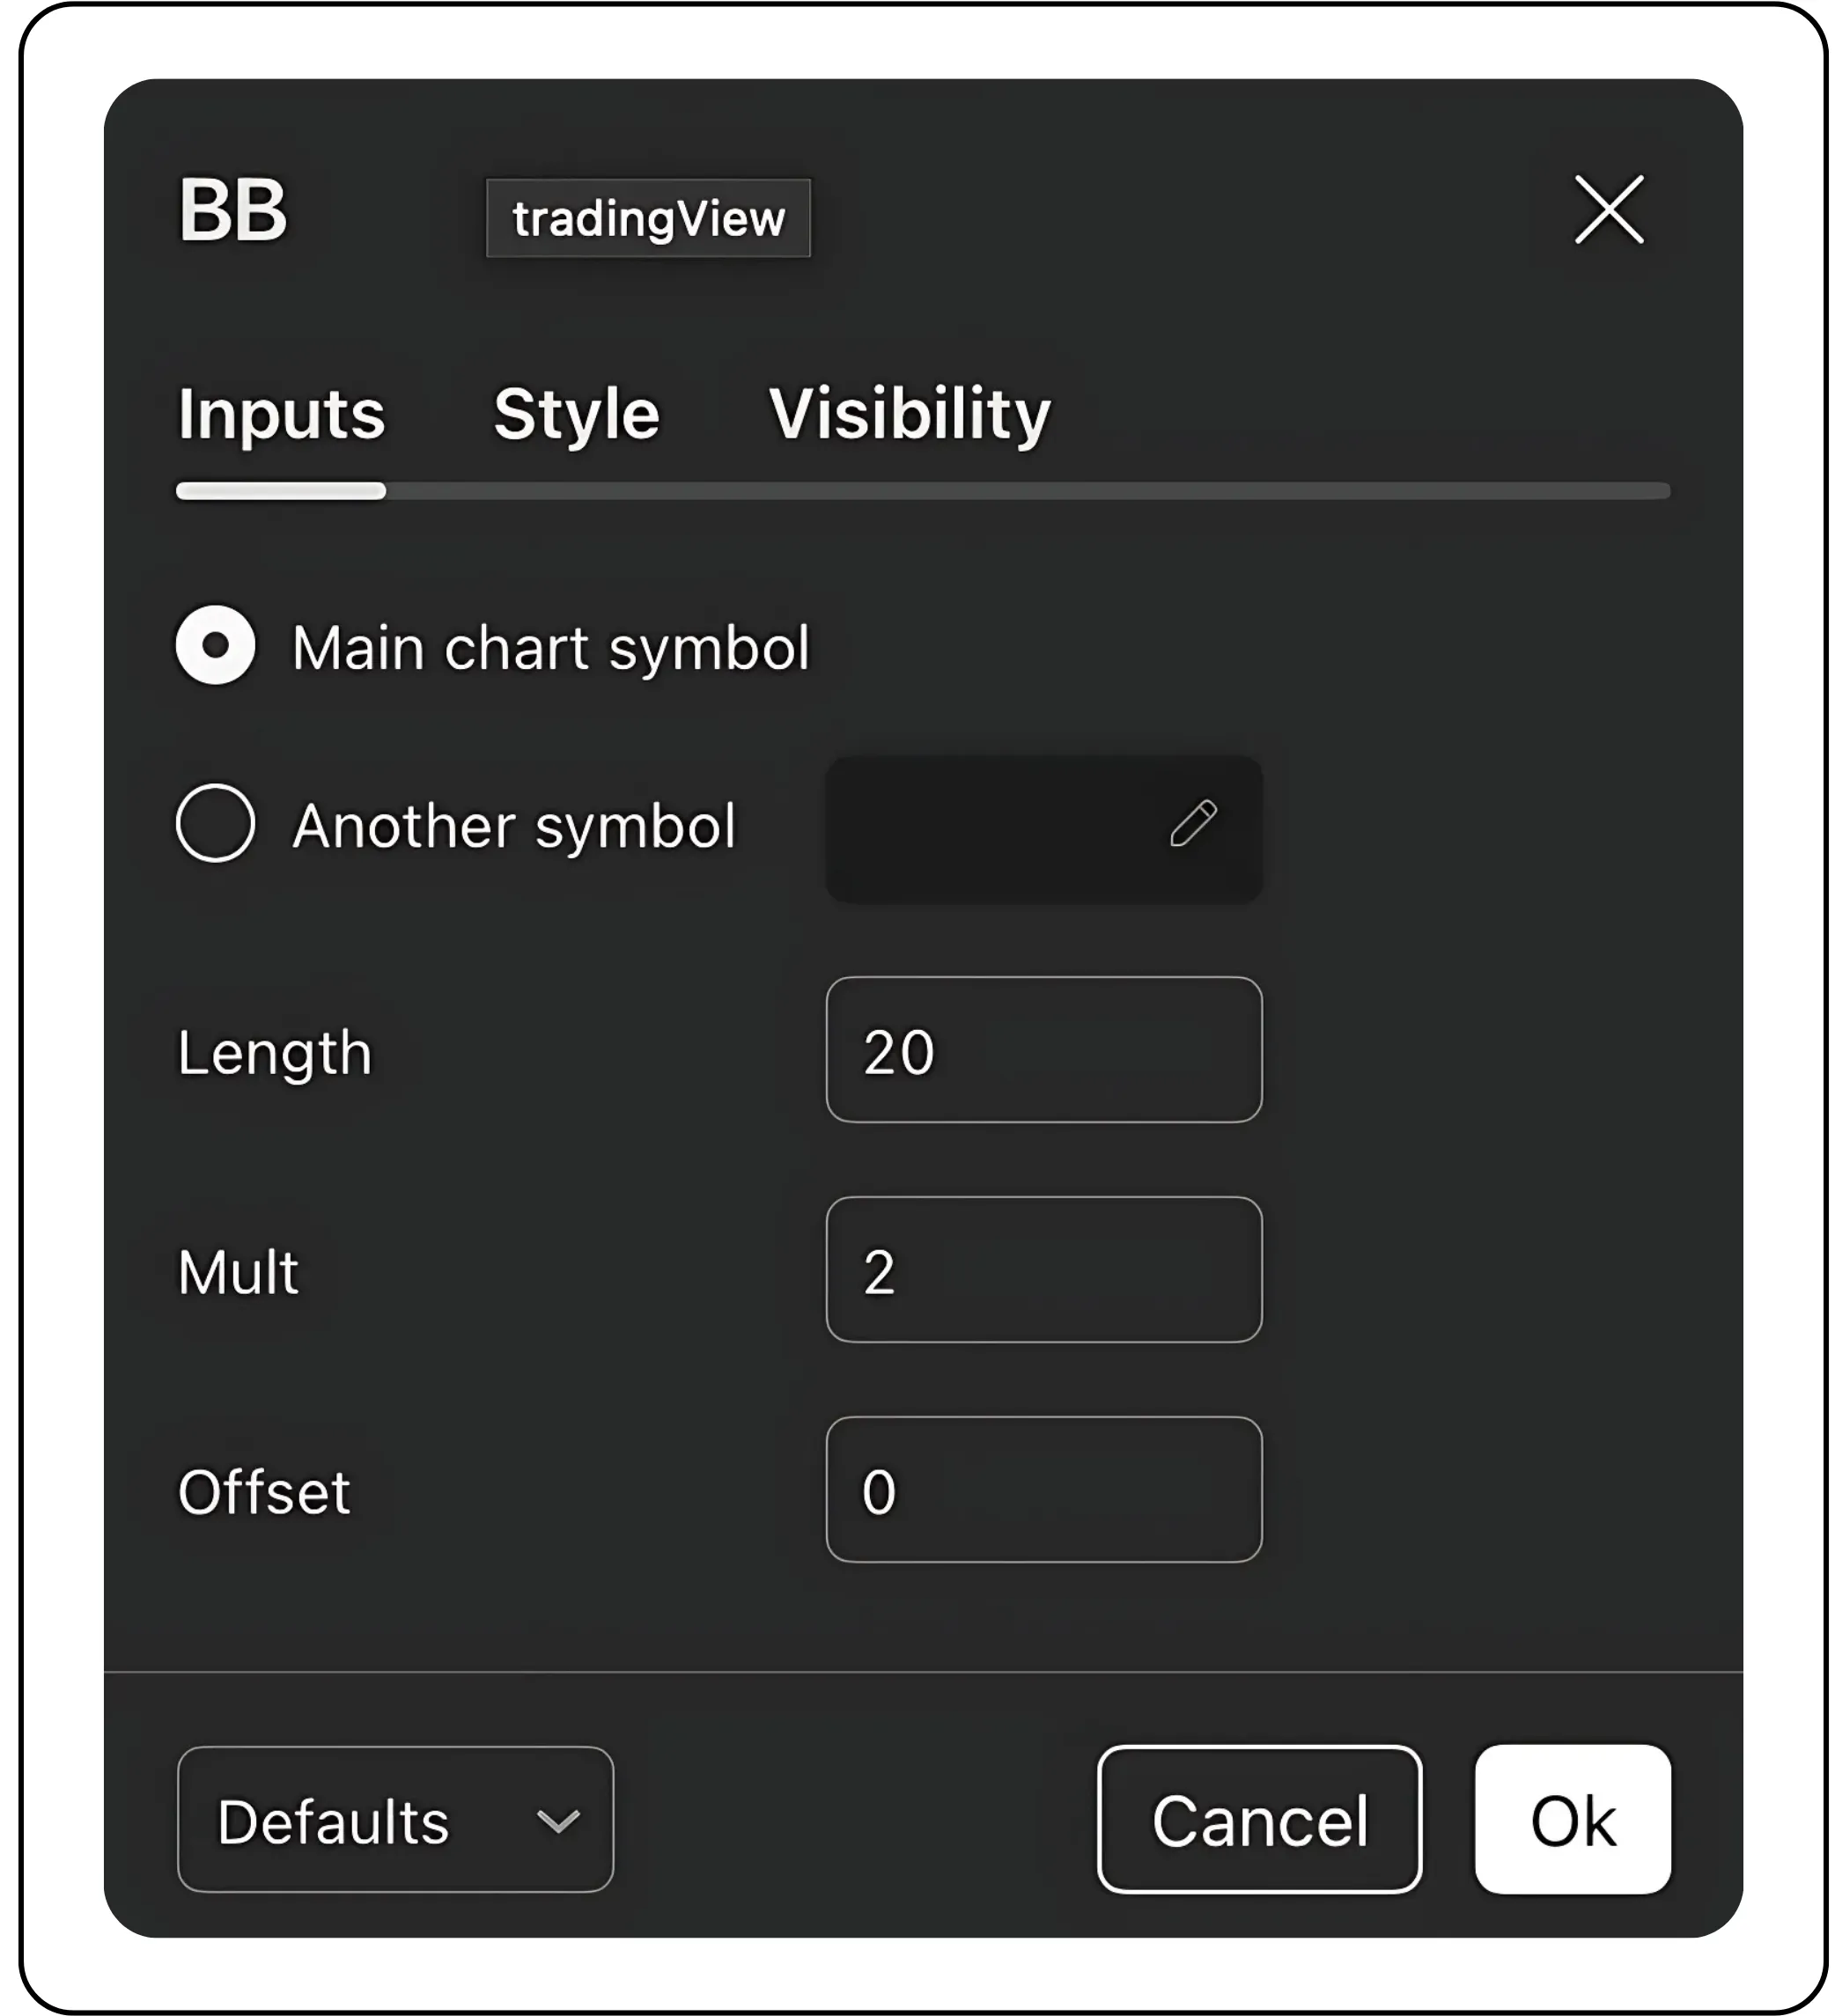
Using the Inputs tab, you can:
- Select any Length, Multiplier, and even add an Offset.
- Customize the look of each band colour, line style, and background shading in the Style tab.
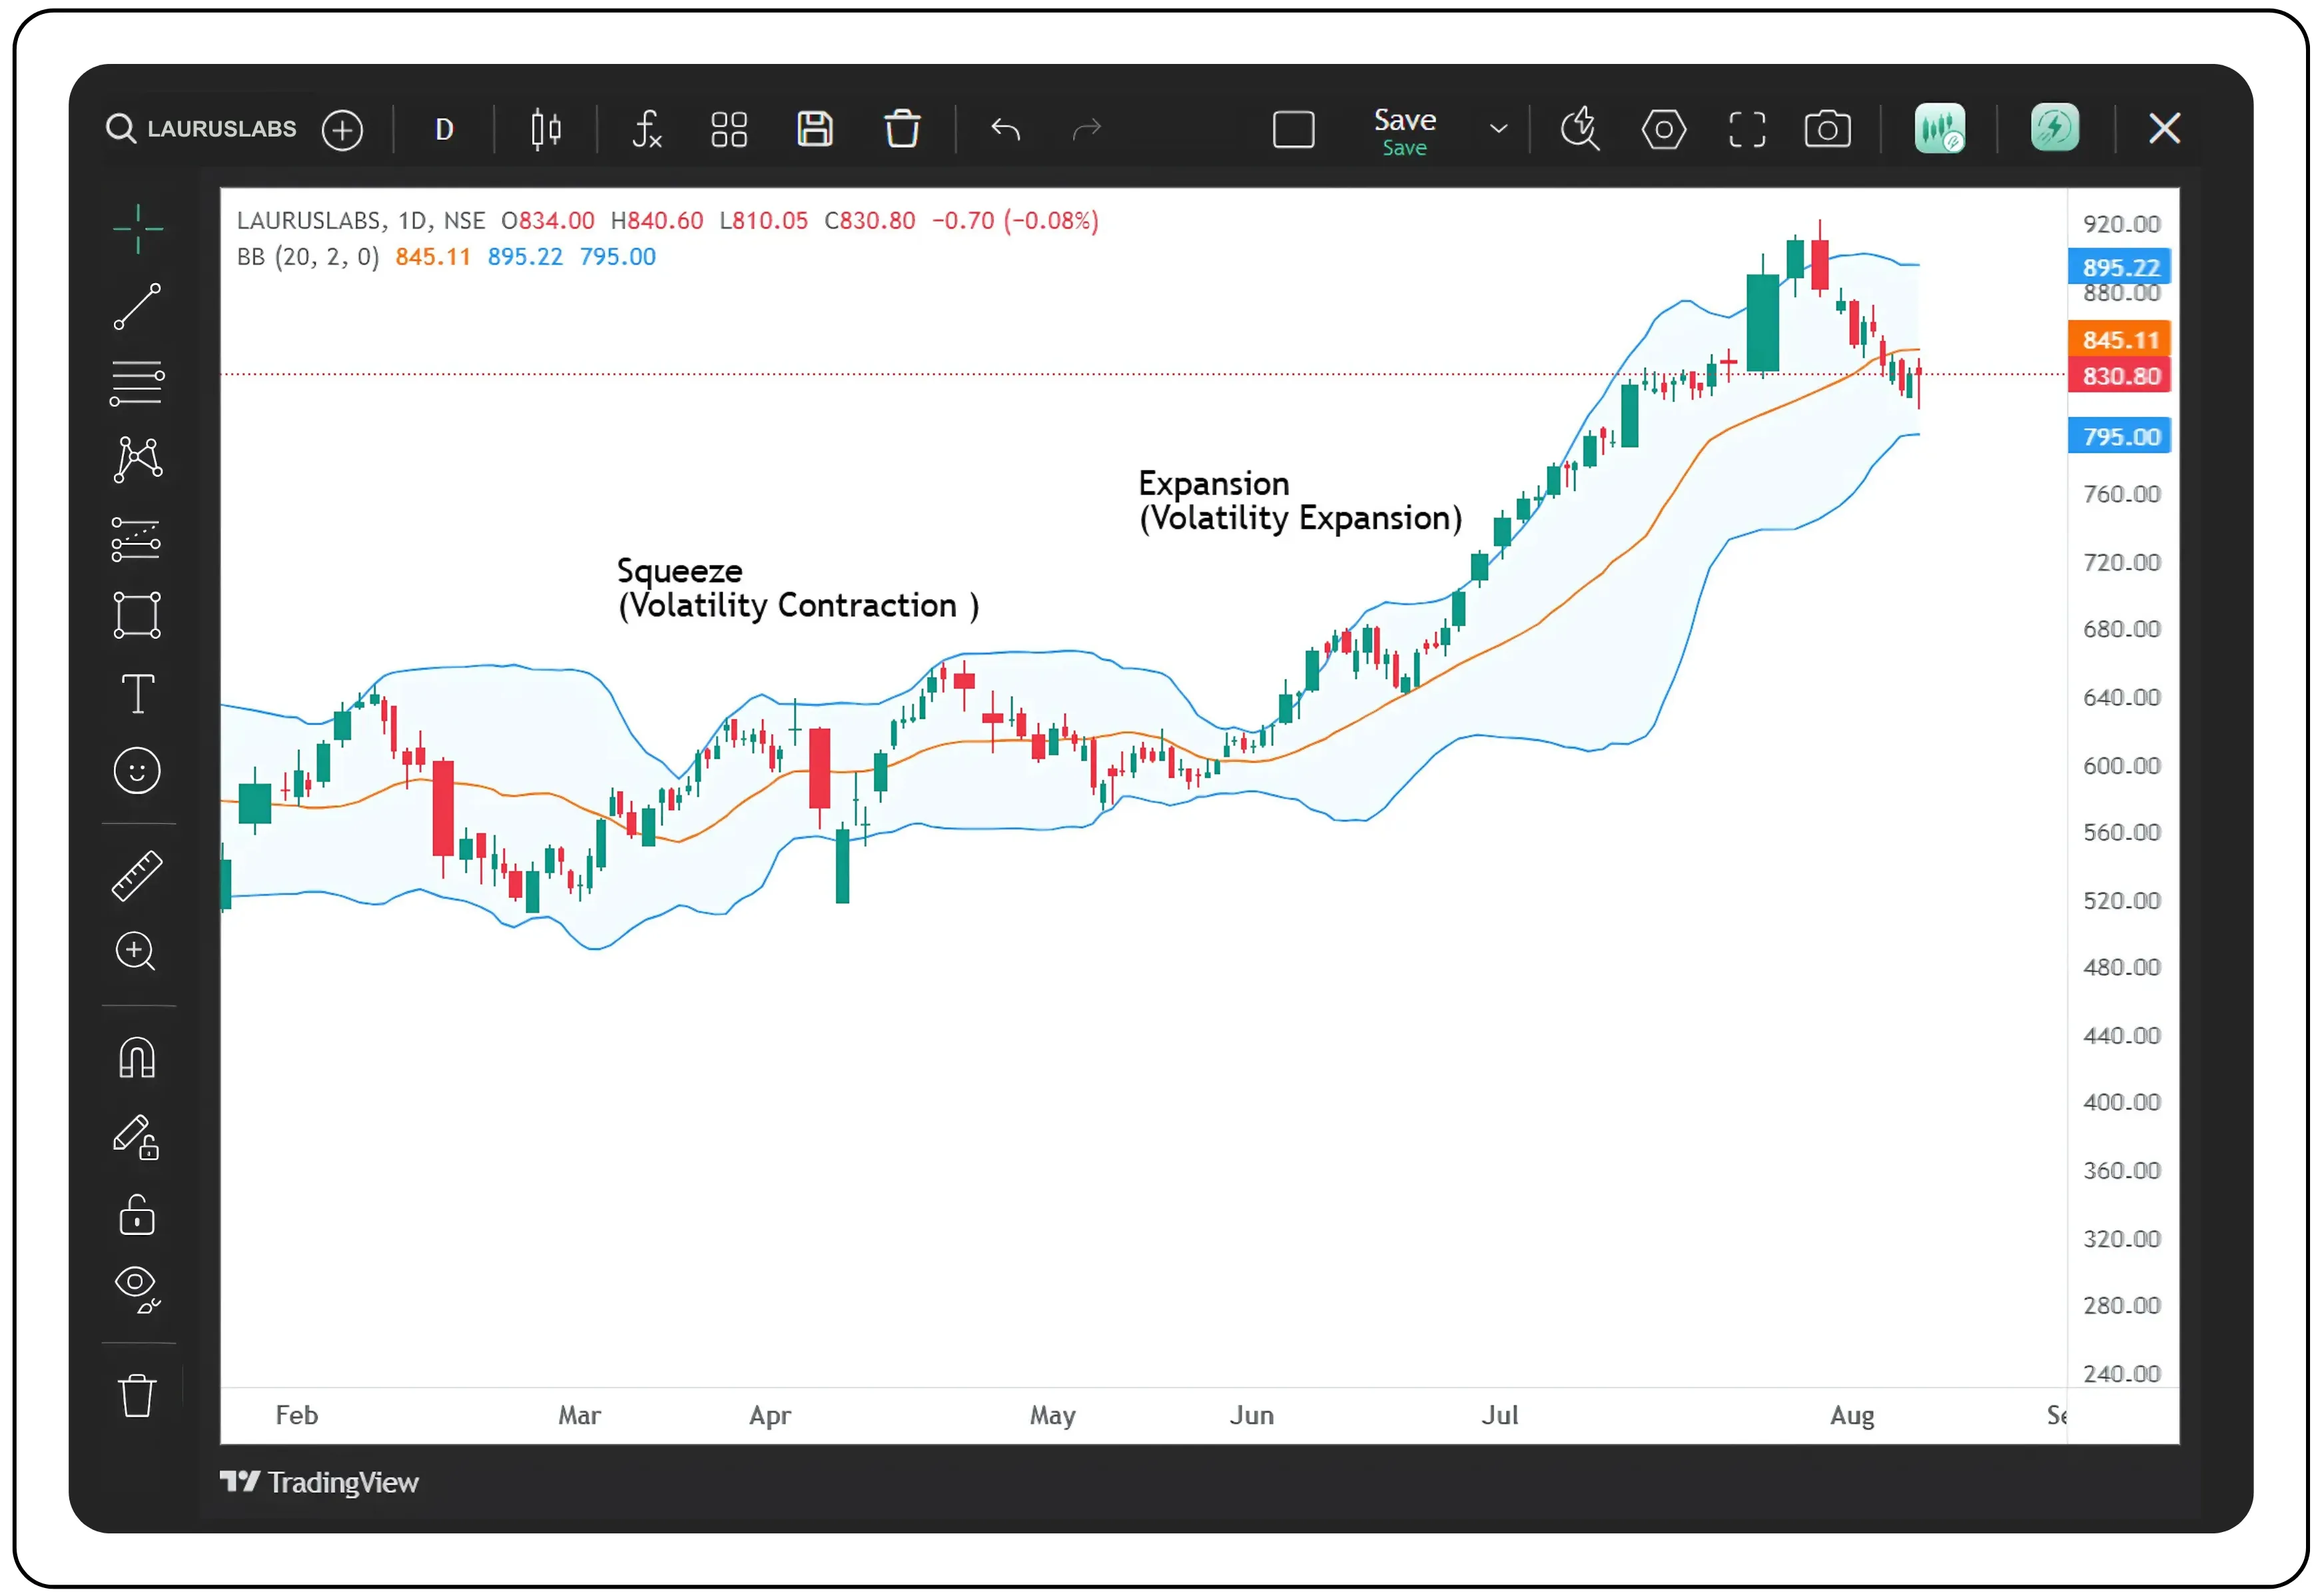
Why Bands widen of shrink
In Bollinger Bands, the distance between the upper and lower bands is based on standard deviation. When bands widen, it means the standard deviation is increasing, indicating higher volatility and larger price swings.
Conversely, when bands narrow, the standard deviation decreases, signalling lower volatility and more subdued price movement.
This dynamic adjustment allows Bollinger Bands to automatically expand during active markets and contract during quieter periods, helping traders visually assess changes in market conditions.
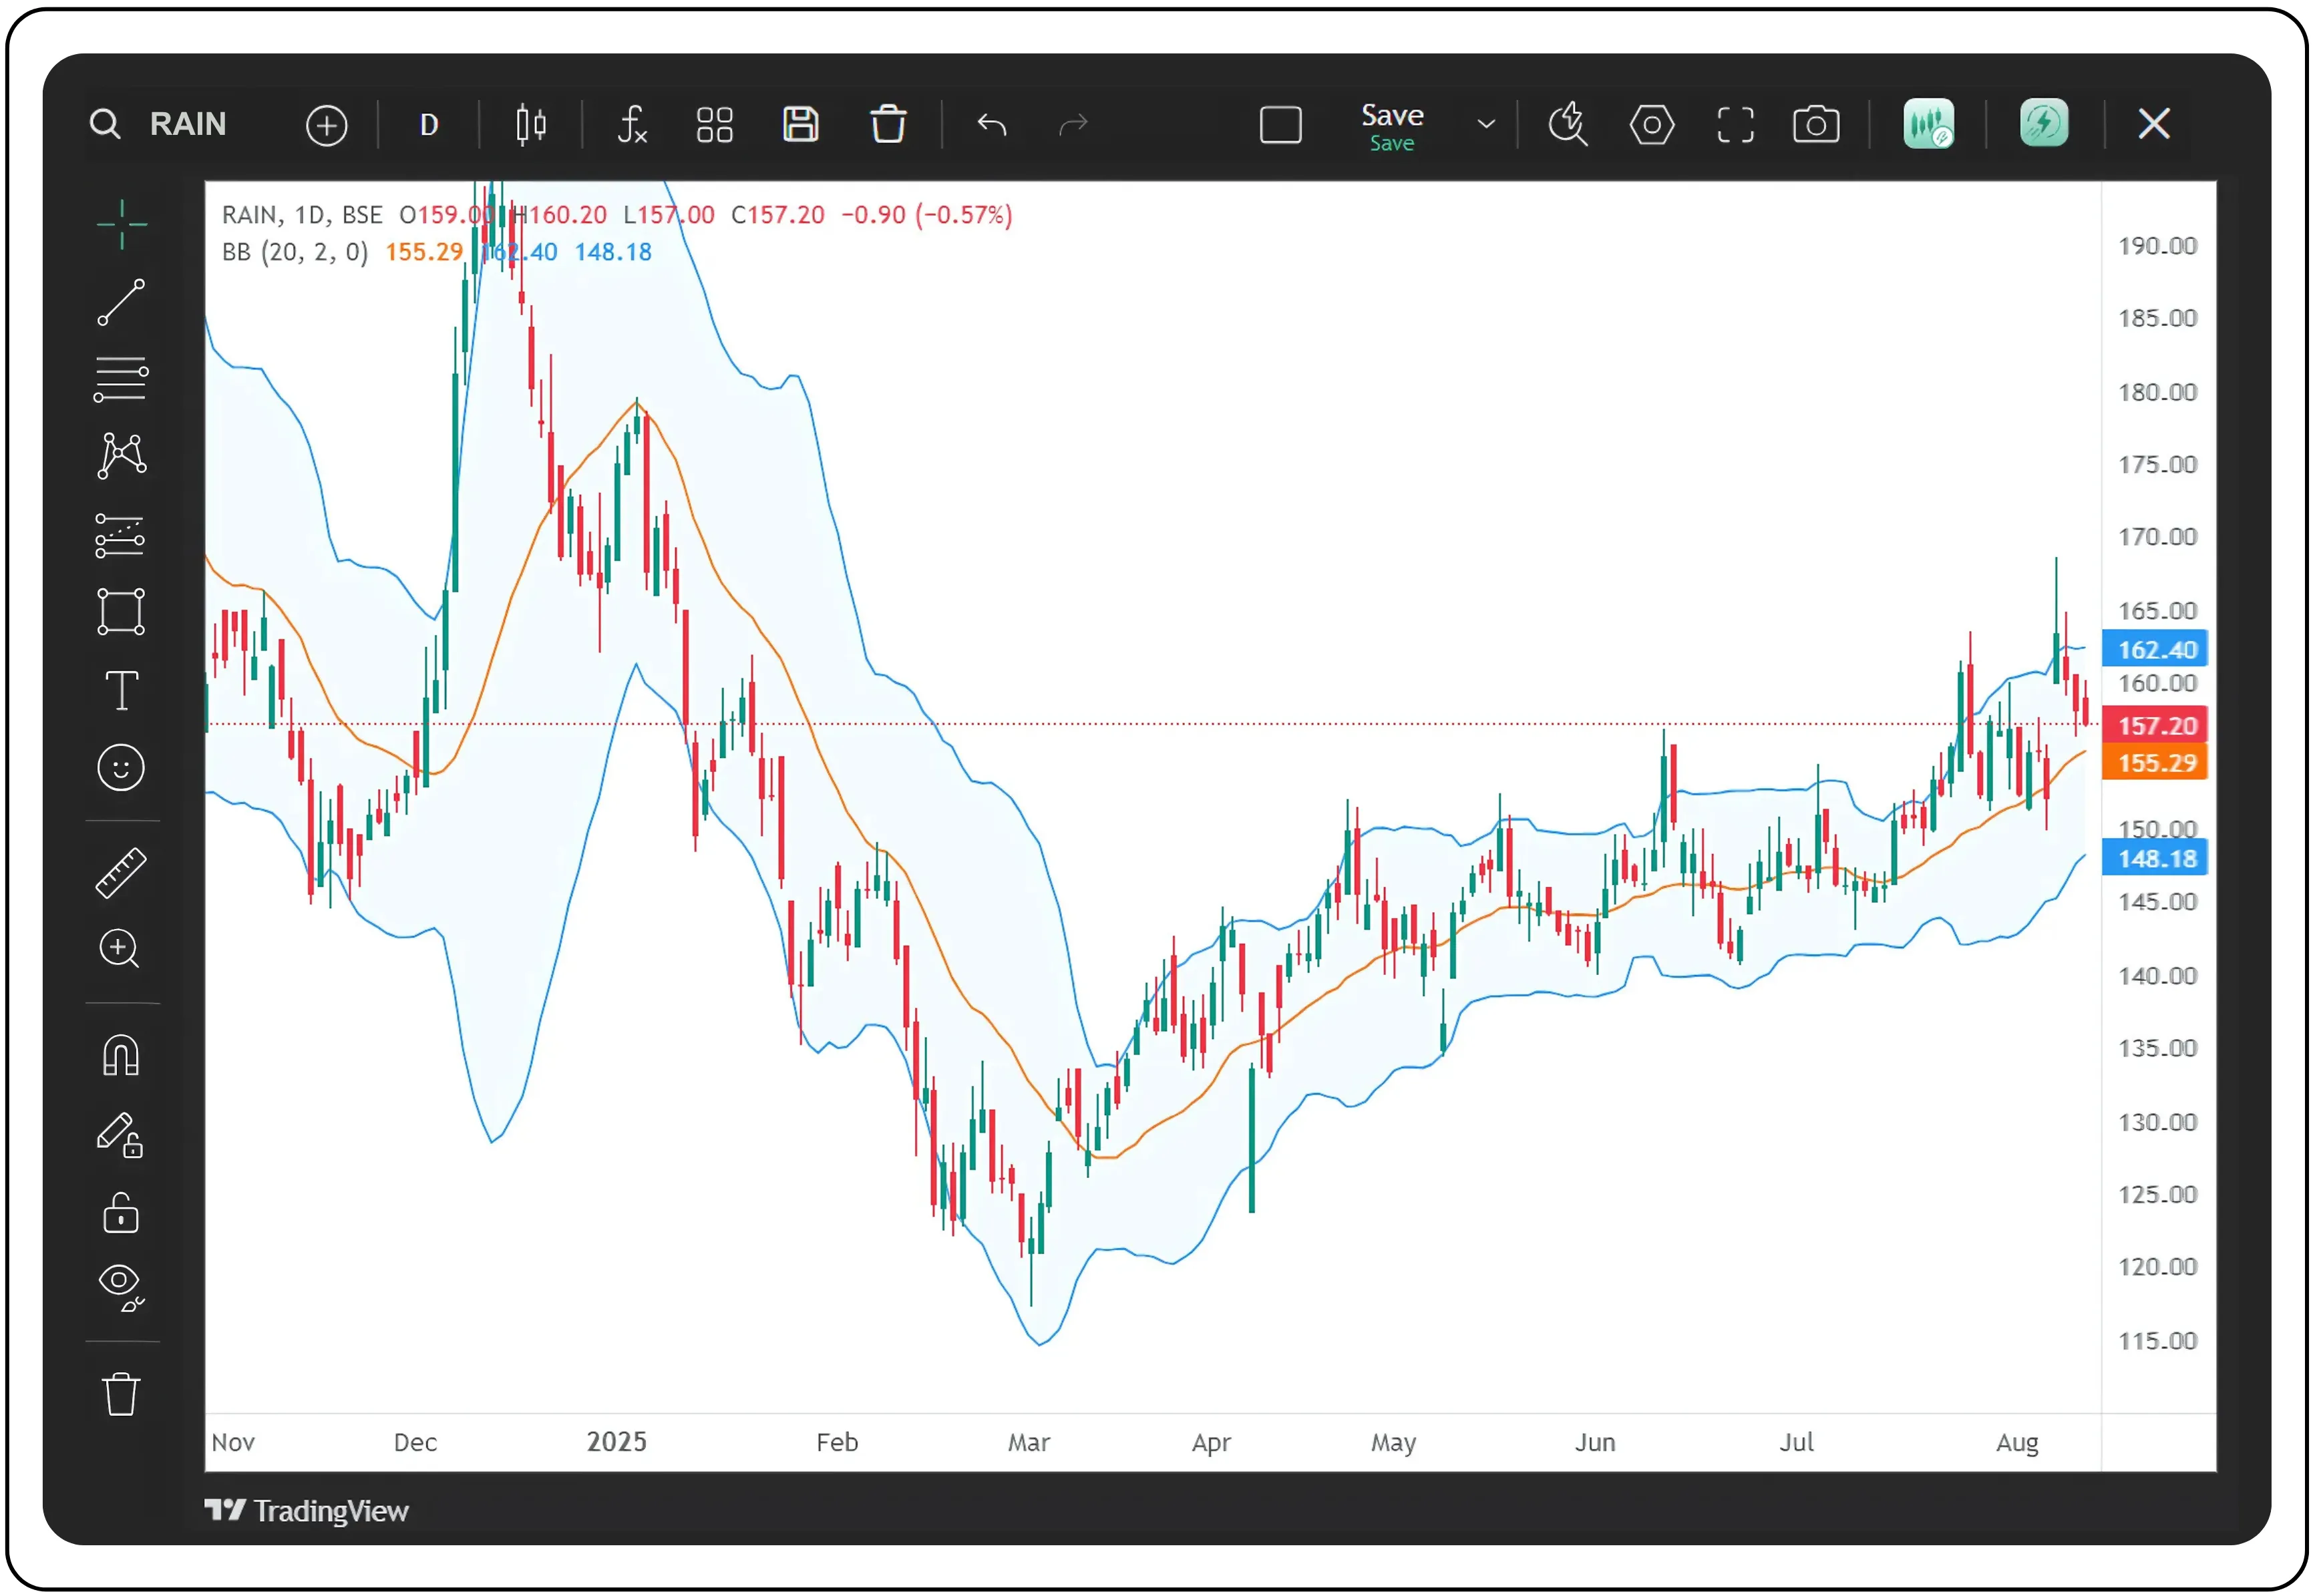
Interpretation
In Bollinger Bands analysis, prices typically stay within the upper and lower bands, and their position within this range helps traders gauge market sentiment. When the price is within or near the upper band, it signals strength, as buyers are pushing the market toward the higher volatility boundary. Conversely, when the price is within or near the lower band, it indicates weakness, as selling pressure is driving the market toward the lower boundary. This positioning serves as a quick visual cue for identifying bullish or bearish market conditions.
Convergence/Divergence
In Bollinger Bands analysis, convergence and divergence describe how price movement within the bands relates to the strength or weakness of the current trend.
Divergence occurs when price action moves contrary to the trend’s expected behaviour, for example, when prices are rising but remain in the lower band, or when prices are falling yet stay in the upper band. This suggests the trend is losing momentum and may reverse.
Convergence, on the other hand, happens when price movement aligns with the trend’s direction, such as prices rising within the upper band or falling within the lower band, indicating that the trend is healthy and likely to continue. Essentially, convergence confirms the prevailing trend’s strength, while divergence signals potential weakness or reversal.
Rising prices in the lower band or falling prices in the upper band → divergence (trend weakening).
Rising prices in the upper band or falling prices in the lower band → convergence (trend confirming).
Also Read: Explore Open = High and Open = Low Stocks with Ease on Tradejini CubePlus
Key trading signals
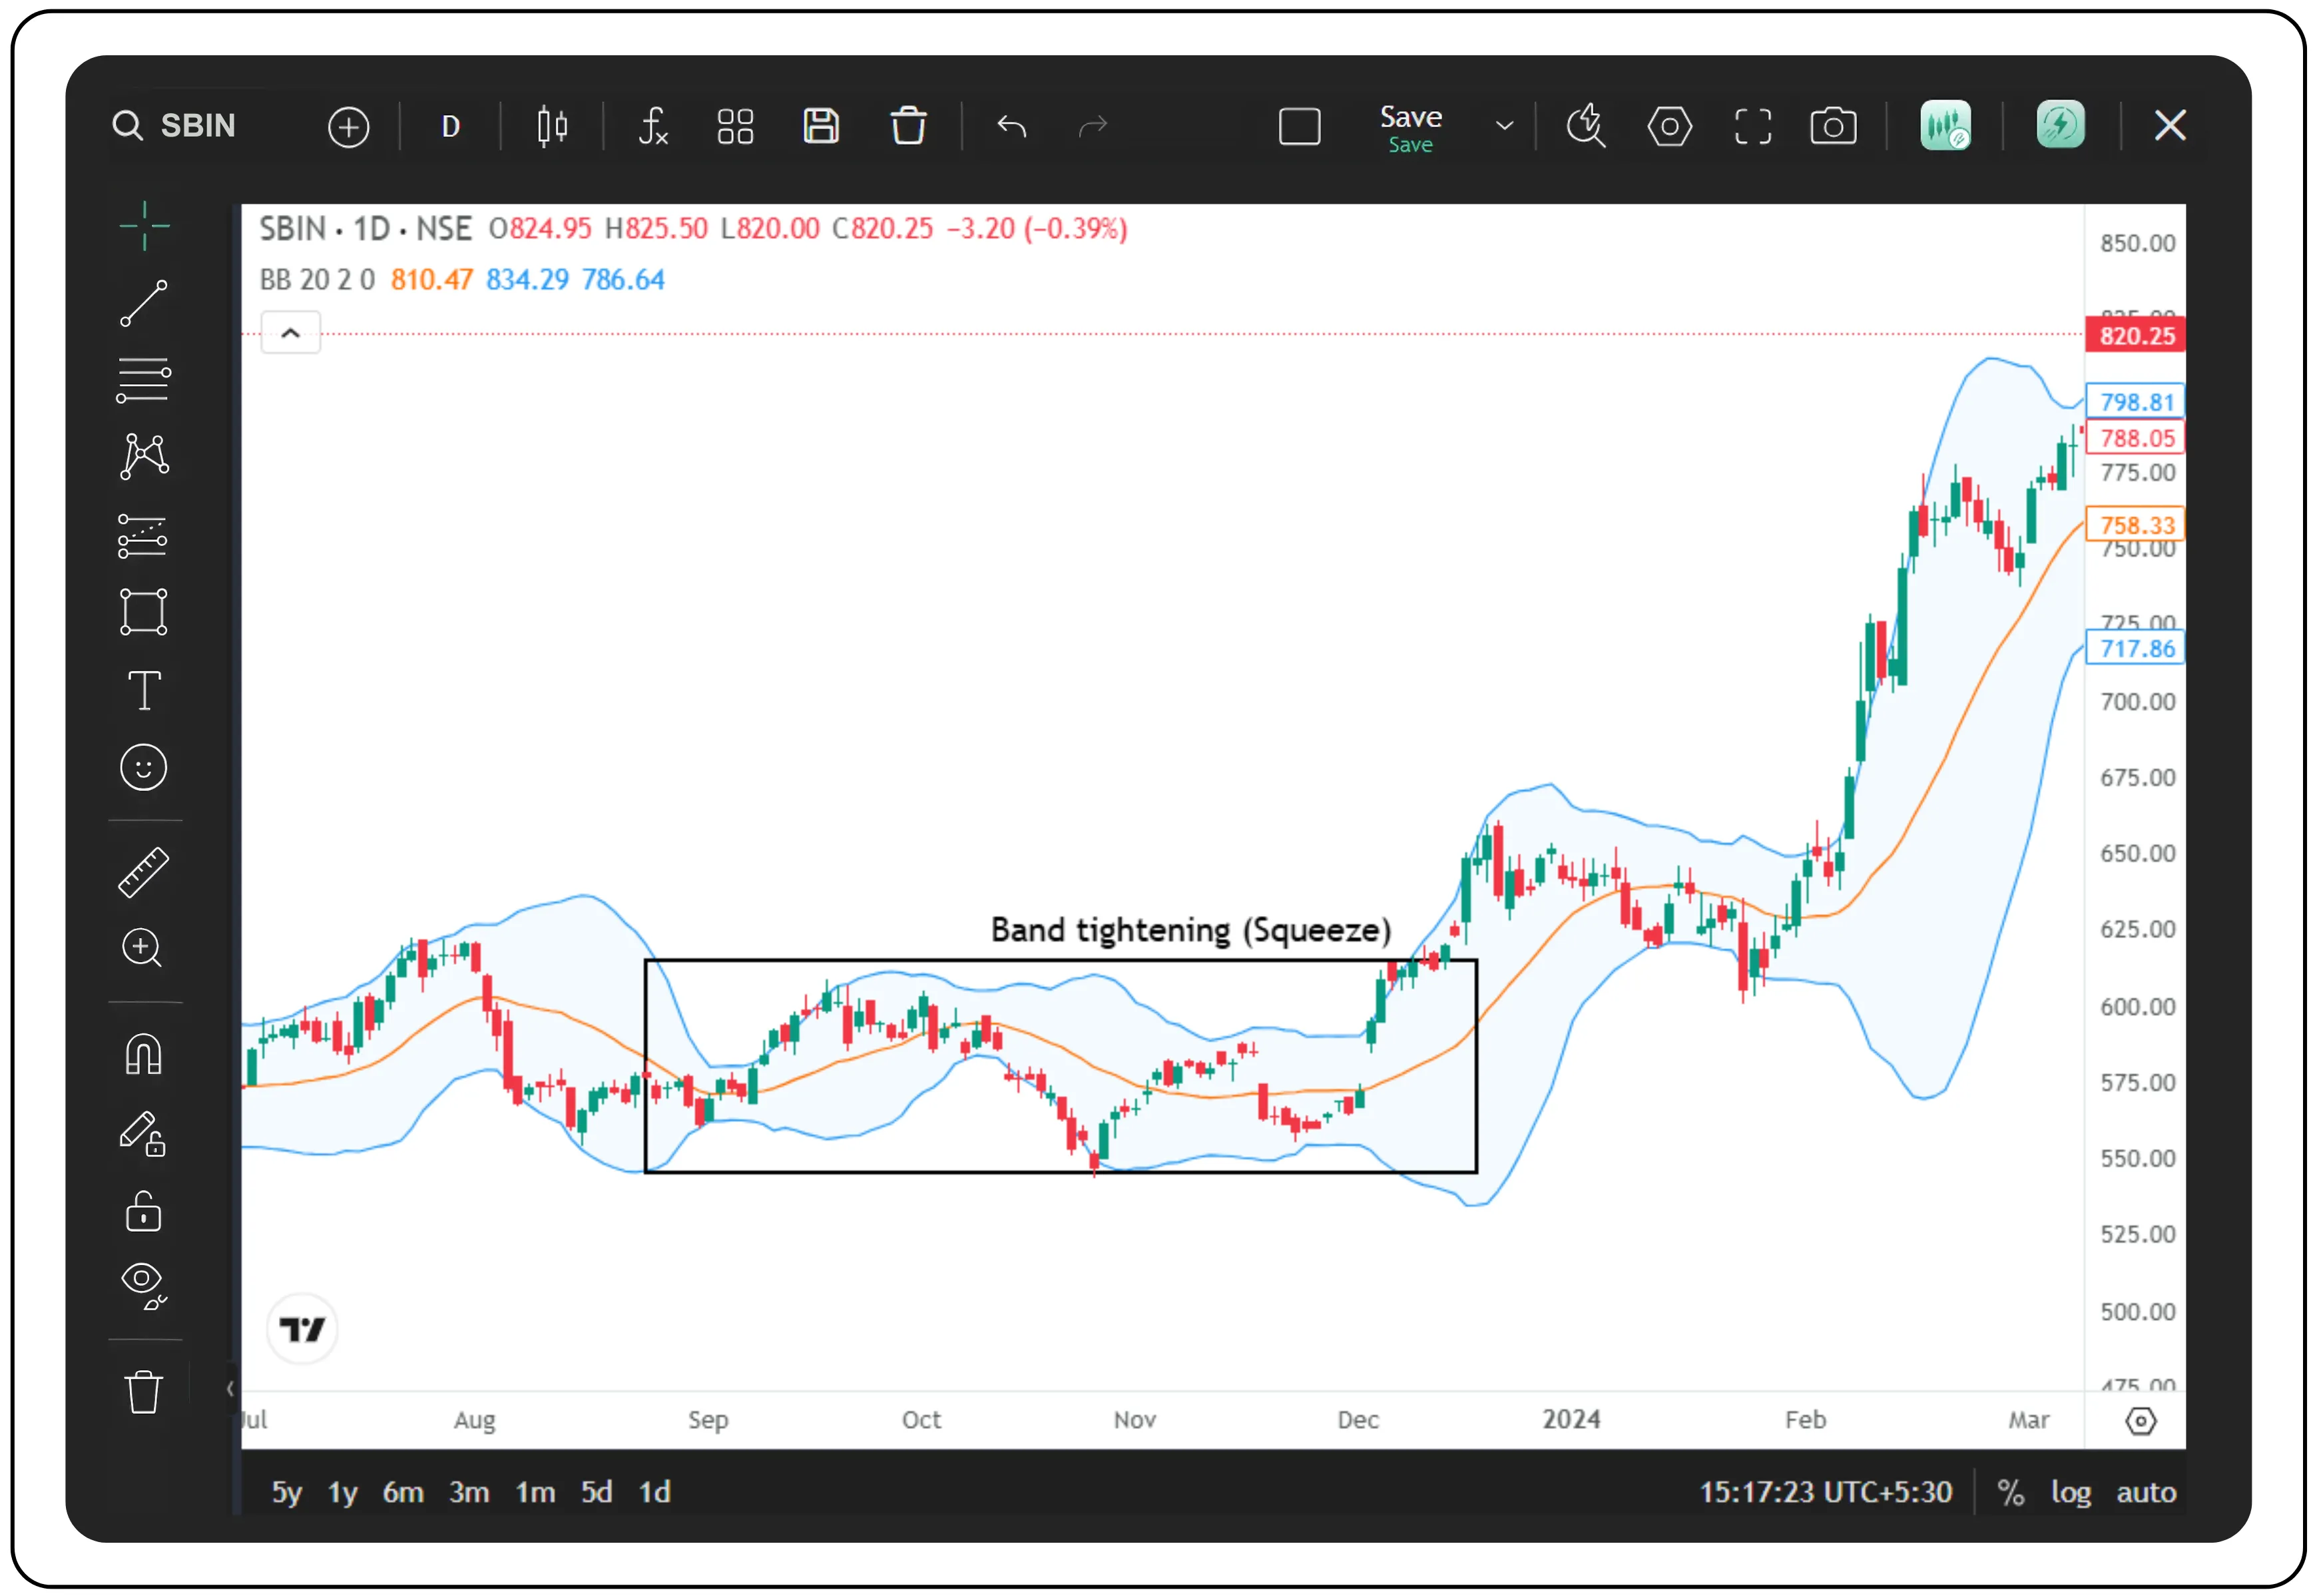
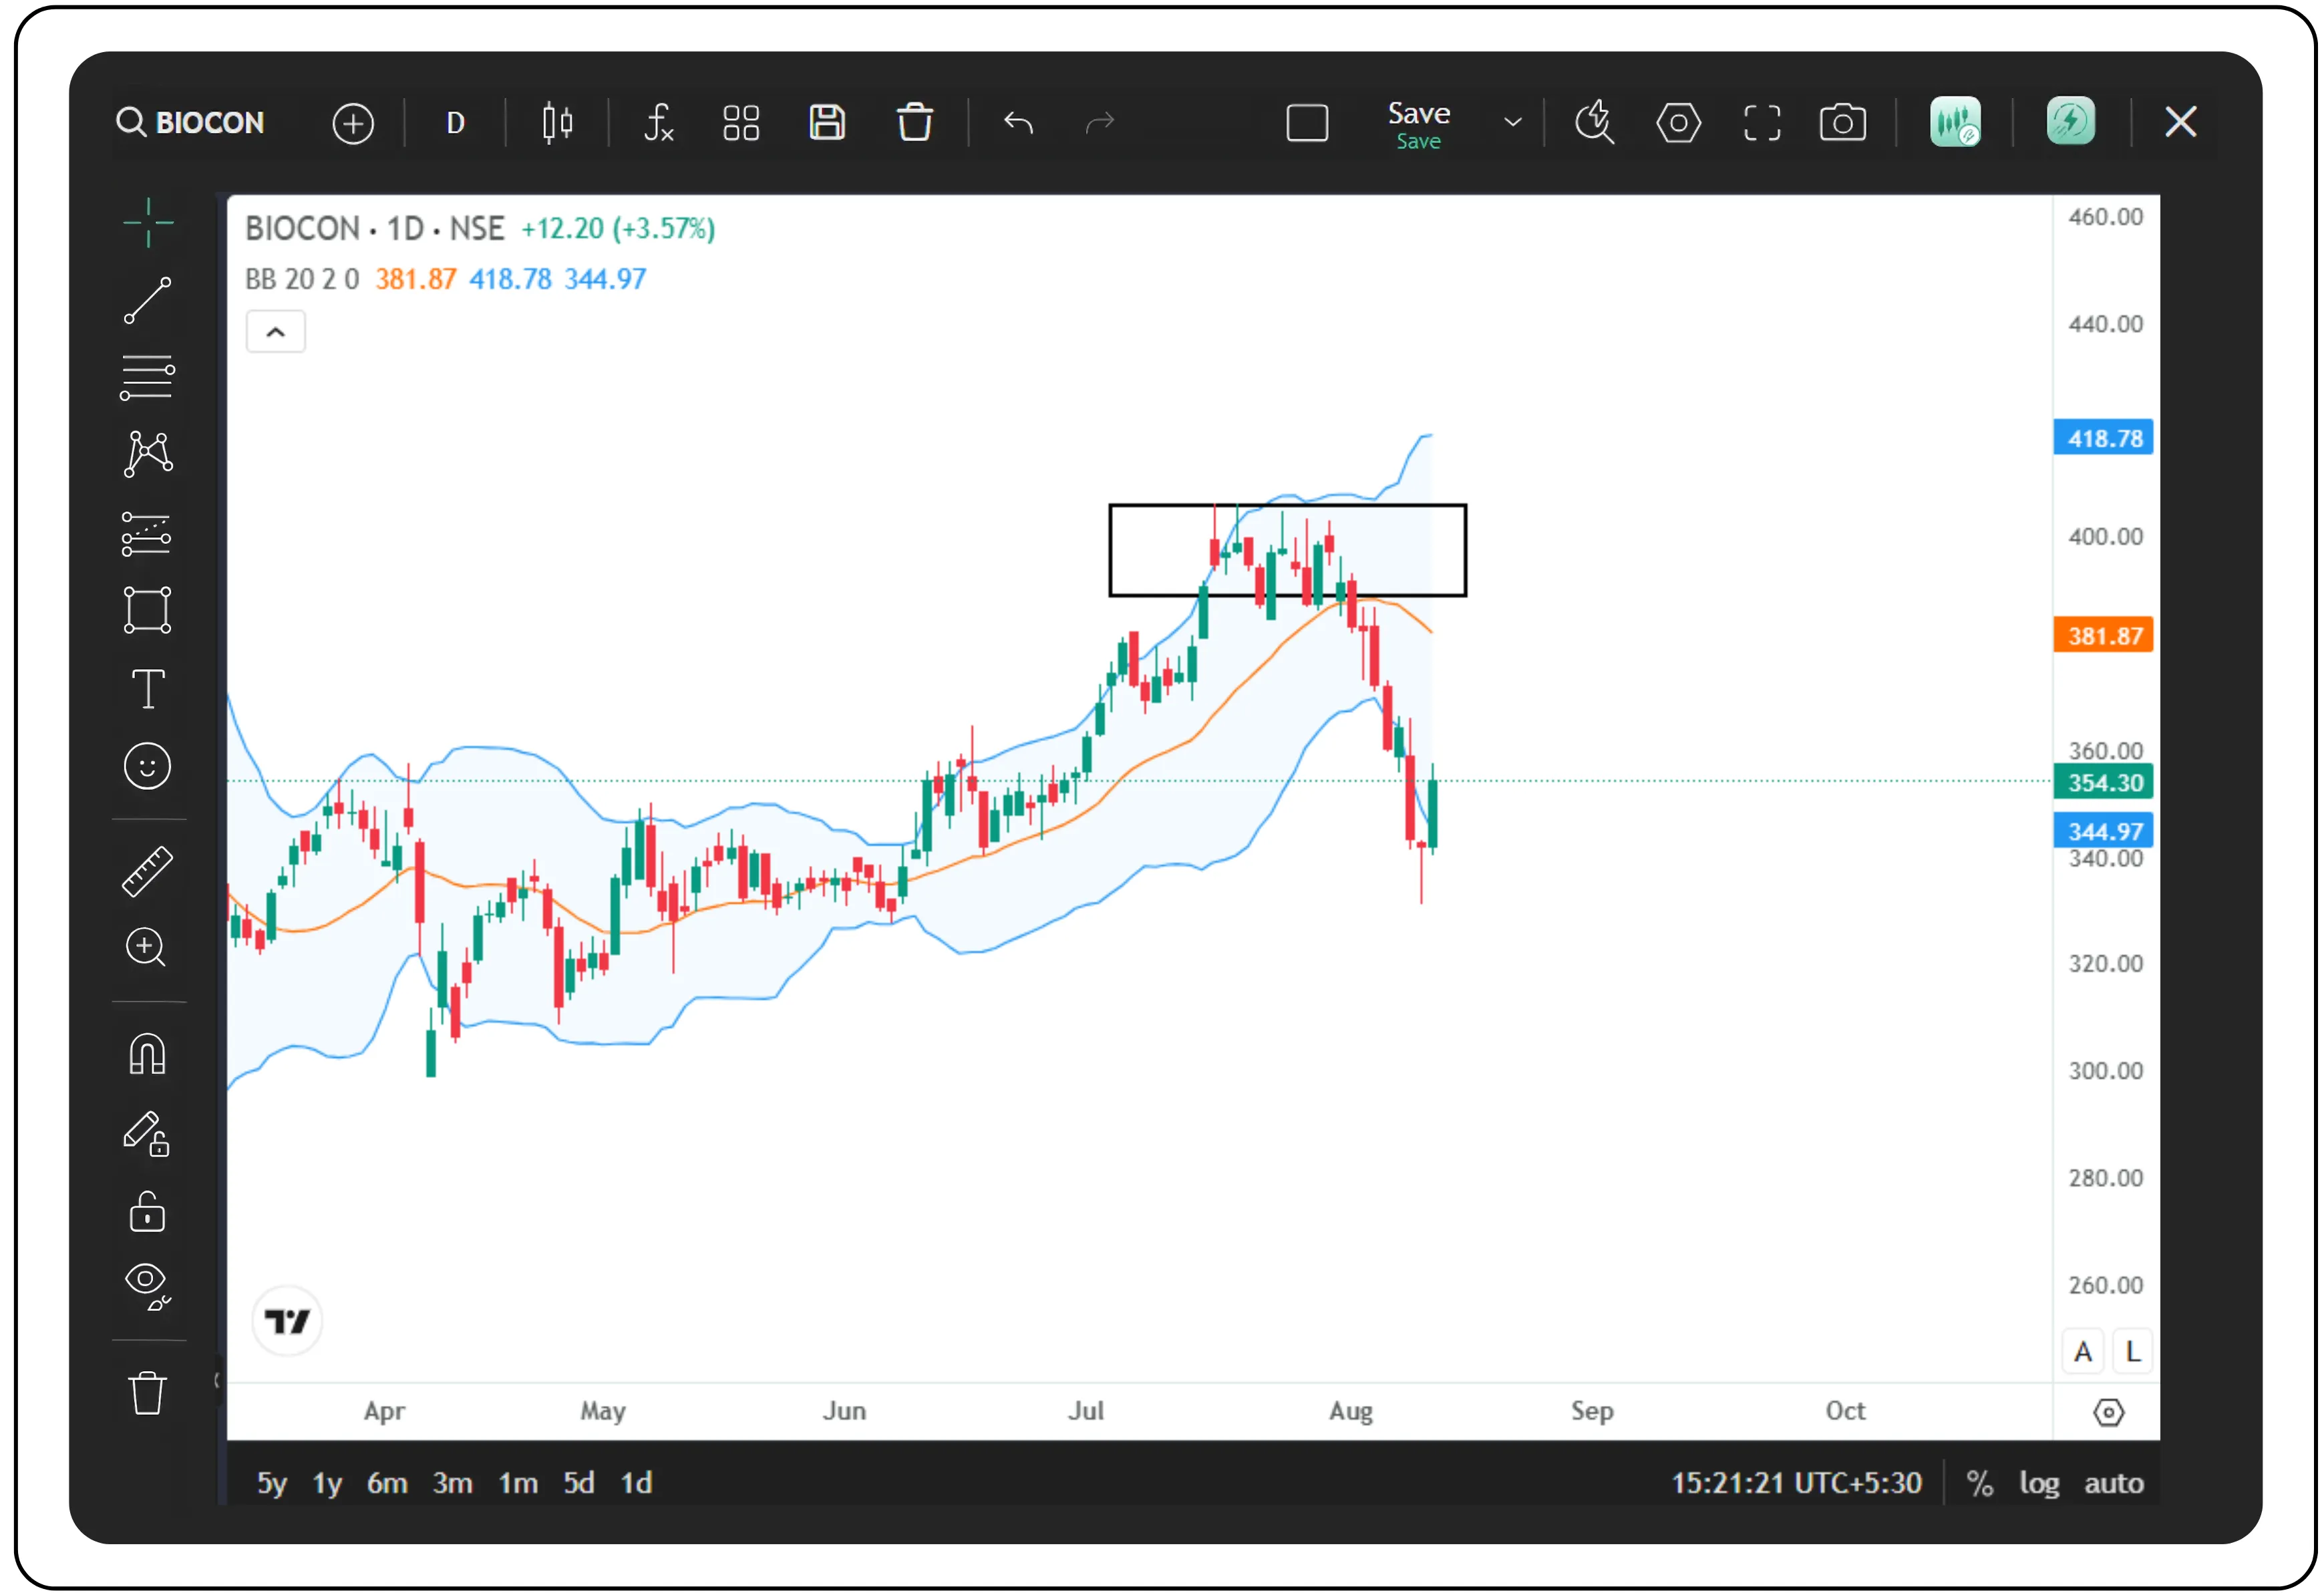
Band tightening (Squeeze) In Bollinger Bands, band tightening, also known as a squeeze, occurs when the upper and lower bands move closer together due to a drop in volatility. This narrowing signals that the market is in a period of consolidation, with price trading in a relatively tight range. According to John Bollinger’s observations, such squeezes often precede sharp price movements, though the direction of the breakout, upward or downward, is not indicated by the squeeze itself. Traders watch for this setup because once volatility contracts significantly, a strong directional move is likely to follow as the market “releases” the built-up pressure.
Price breaking a band
In Bollinger Bands analysis, a price breaking a band refers to a candlestick closing outside the upper or lower band, indicating strong momentum in that direction. When the price closes above the upper band, it often signals that bullish strength is likely to continue; conversely, when it closes below the lower band, it suggests ongoing bearish momentum.
This is because breaking through the volatility boundary shows that the current trend has enough force to push beyond normal price fluctuations, making a continuation of the trend more probable. However, traders typically confirm the signal with other indicators or patterns to avoid false breakouts.
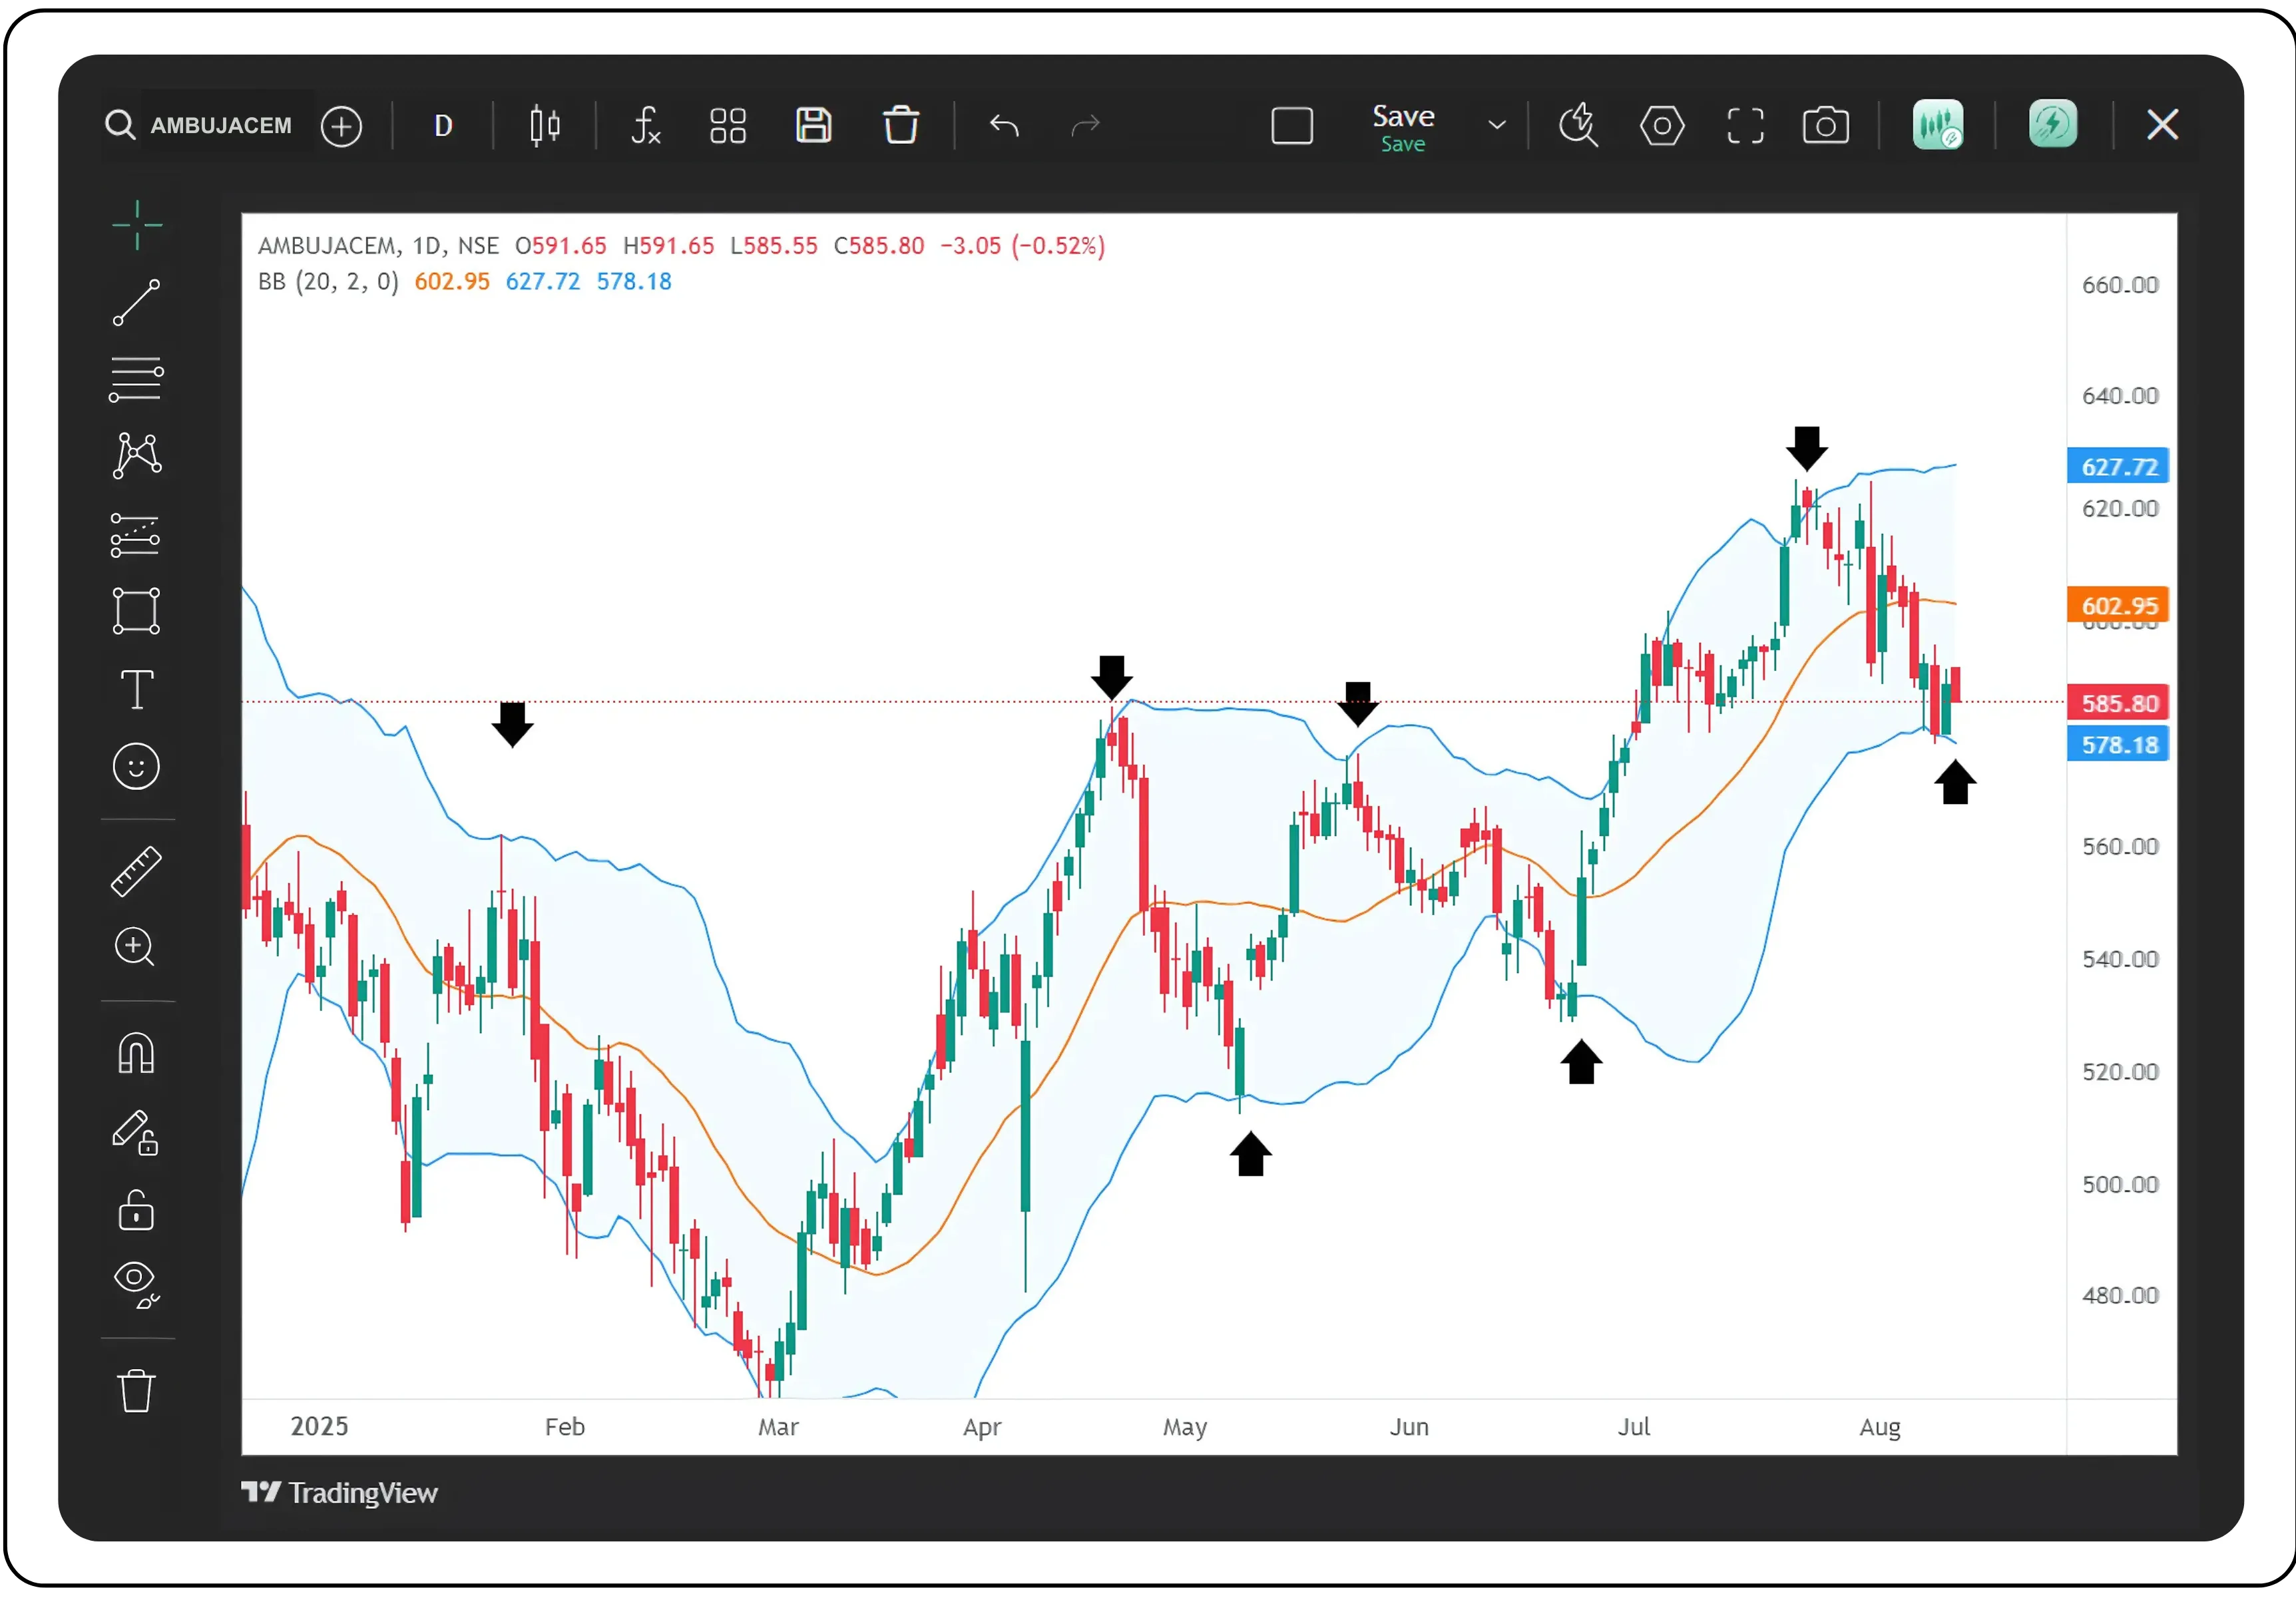
Reversal signals
In Bollinger Bands analysis, a potential trend reversal is often signalled when a top or bottom forms outside the bands and is followed by another top or bottom inside the bands. For instance, if a price peak appears above the upper band indicating strong bullish momentum, but the next peak forms inside the band at a lower level, it suggests weakening buying pressure and the possibility of a downward reversal. Likewise, if a price trough forms below the lower band but the next trough occurs inside the band at a higher level, it indicates fading selling pressure and the chance of an upward reversal. This pattern works because it captures the loss of momentum after an extreme move, which often precedes a shift in trend direction.
Band-to-Band movement
Band-to-band movement in Bollinger Bands refers to the tendency of price, once it reverses from one band, to travel toward the opposite band, offering traders a way to project near-term price targets. For example, if Stock XYZ has a 20-day simple moving average (SMA) with bands at ₹95 (lower), ₹100 (middle), and ₹105 (upper), and the price bounces from ₹96 near the lower band, this bounce signals bullish momentum. As the price climbs above the SMA and continues rising, the opposite band, in this case ₹105, becomes a realistic target. Similarly, if the price reverses from the upper band and breaks below the SMA, the lower band becomes the likely target. This movement works because the bands represent volatility boundaries, and a decisive move away from one boundary often carries enough momentum to test the other, especially in range-bound or moderately trending markets.
Bollinger Bands are more than just a technical indicator; they are a powerful tool that helps traders confidently handle the ups and downs of the market. By using the flexibility of Bollinger Bands on Tradejini’s CubePlus platform, you can adjust the indicator to fit your trading style, spot important market signs, and make smart choices. Whether you want to use a volatility squeeze, find reversals, or predict price targets through band-to-band movements, Bollinger Bands provide a strong framework for understanding how the market works. Start exploring Bollinger Bands on CubePlus now to discover new ways to improve your trading strategy with precision and insight.
Also Read: Ichimoku cloud a clearer way to read the market
Disclaimer: The information provided in our blogs is for informational purposes only and should not be construed as financial, investment, or trading advice. Trading and investing in the securities market carries risk. Always conduct your own research and consult with a qualified financial advisor before making any investment decisions. Past performance is not indicative of future results. Copyrighted and original content for your trading and investing needs.
© 2025 — Tradejini. All Rights Reserved.