


Some of the best intraday trades come from setups where momentum is obvious from the very first candle. That’s exactly what the Open = High and Open = Low strategies offer; early signals of potential reversals or breakouts, helping traders time entries better and manage risk more effectively.
With CubePlus, Tradejini users can access these setups in real-time. The app scans live market data, filters stocks by index (like NIFTY 50 or MIDCAP), and highlights those that opened exactly at their intraday high or low; classic signs of bearish or bullish intent. Key trading metrics such as LTP, price change, volume, and traded value are also shown to help assess momentum and liquidity instantly. These setups are a proven momentum trading strategy that helps you trade the momentum as it unfolds right from the market open.
Where to find It on CubePlus
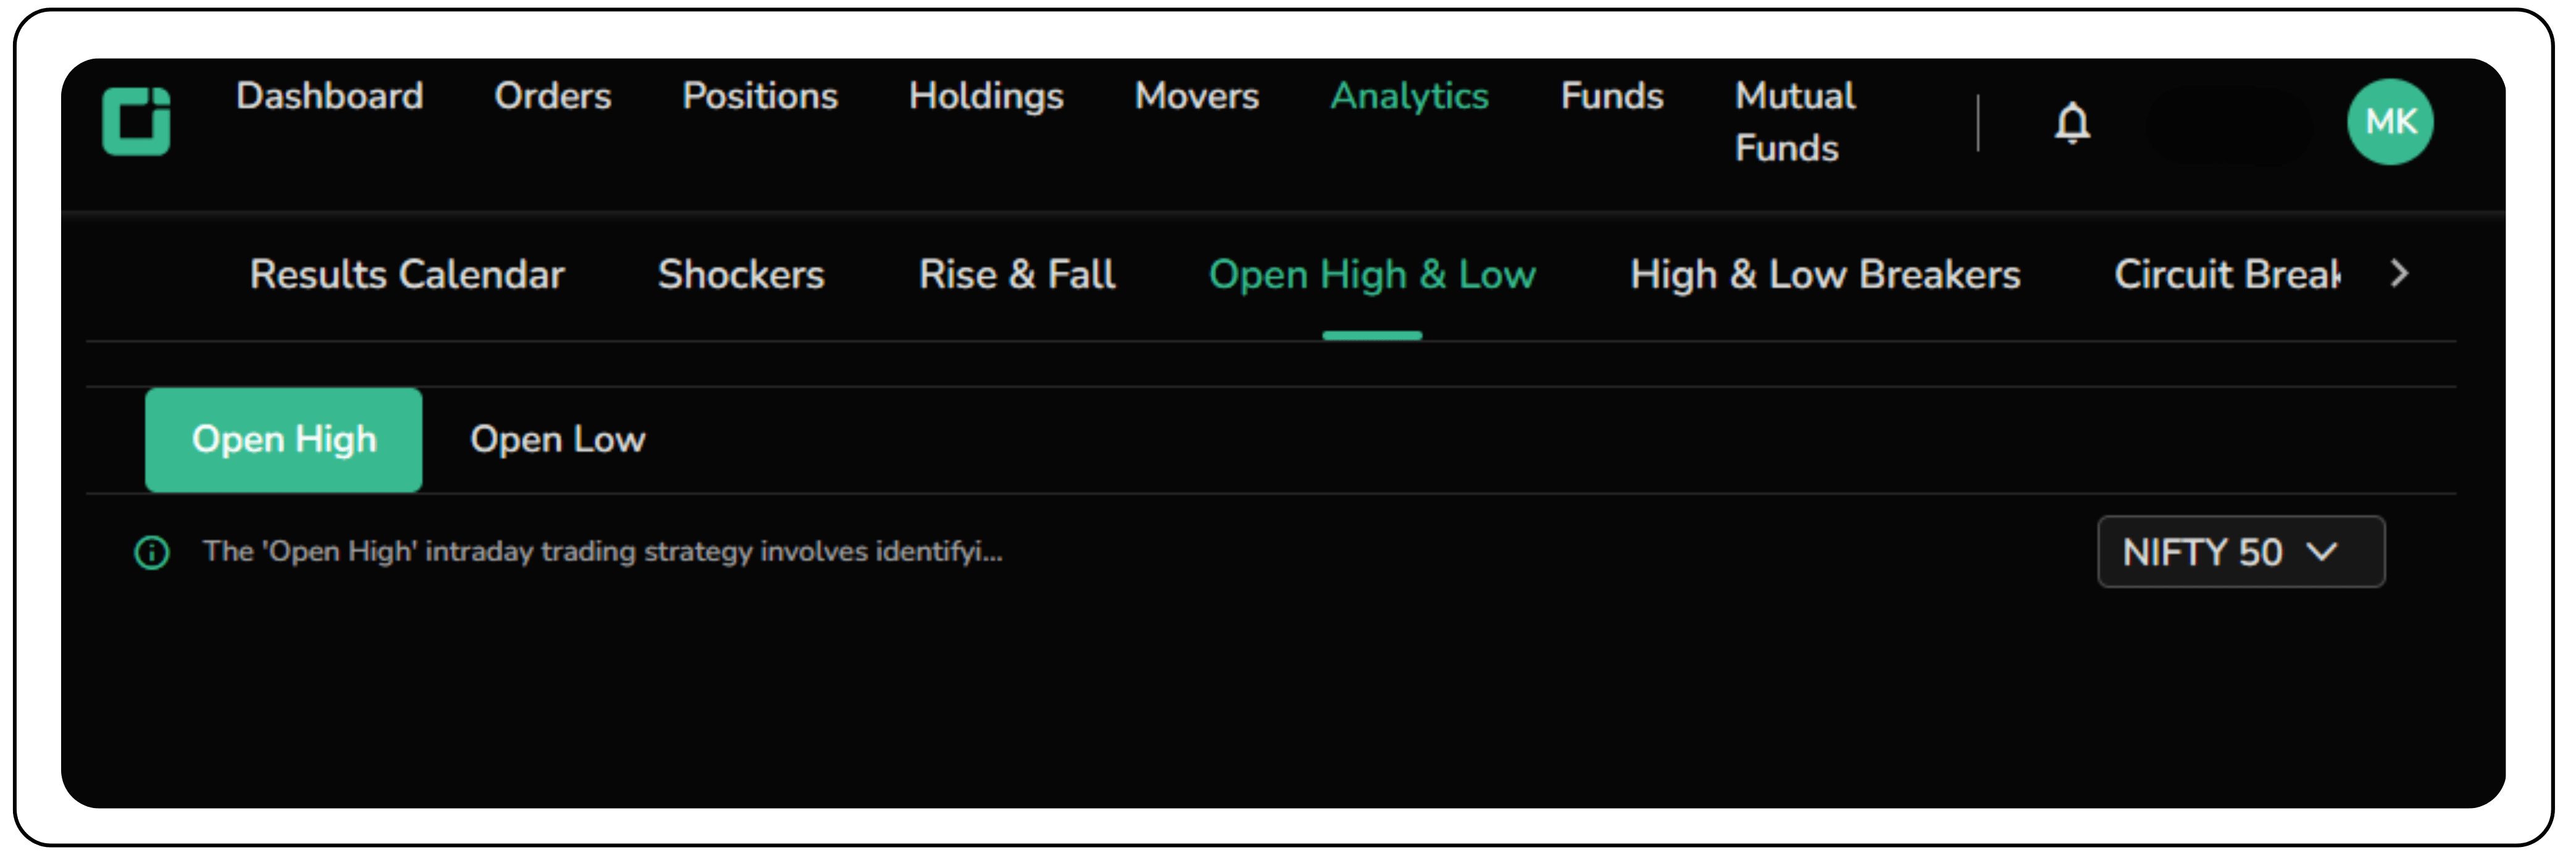
- Go to the Analytics tab on the top menu
- Click on Open High & Low
- Toggle between Open High (bearish) and Open Low (bullish) setups
- Use the index filter to focus on specific stock universes
The layout is intuitive, and whether you're a beginner or an active day trader, spotting trade-ready setups takes just a few clicks. From there, you can combine these signals with pivot points, volume, and price action to build trades the way top professionals do. You can filter for high momentum stocks for intraday trading within your preferred index for more targeted setups.
How to trade ‘Open = High’ bearish setups on Tradejini’s CubePlus app
Just as bullish traders benefit from the Open = Low strategy, bearish or short-sellers can take advantage of the Open = High setup using the CubePlus. The app intelligently filters out stocks that have opened at their intraday high, indicating potential weakness and a higher probability of downward movement throughout the day.
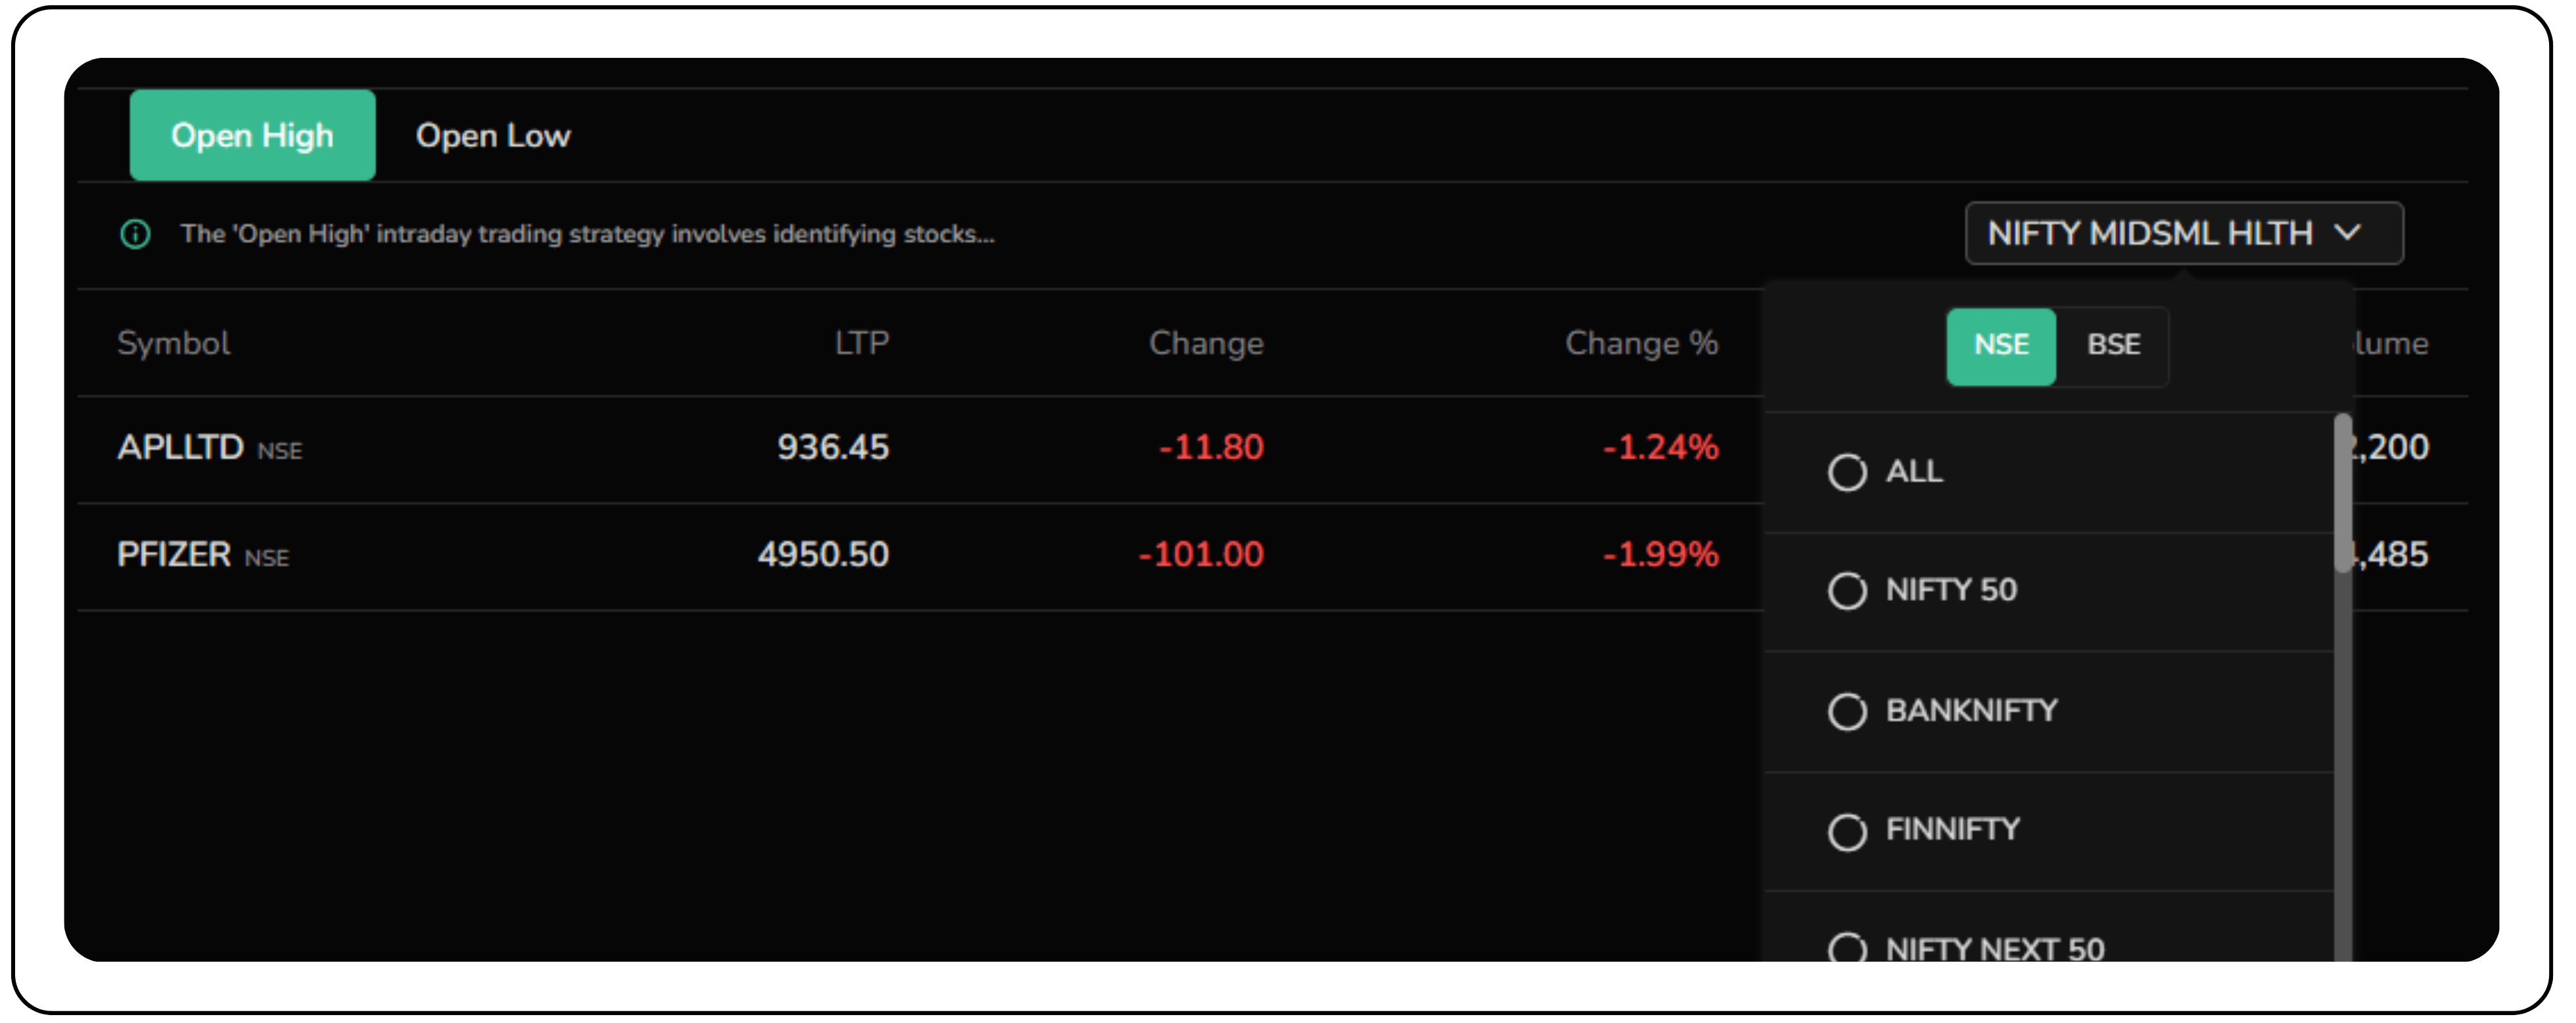
In the image, stocks like APL Ltd and Pfizer, both part of the Nifty MidSmall Healthcare index, appear under the Open High tab. These stocks faced selling pressure right after the market opened, and their prices reflect that:
- APL Ltd is down ₹12.85 (−1.35%)
- Pfizer is down ₹85.00 (−1.68%)
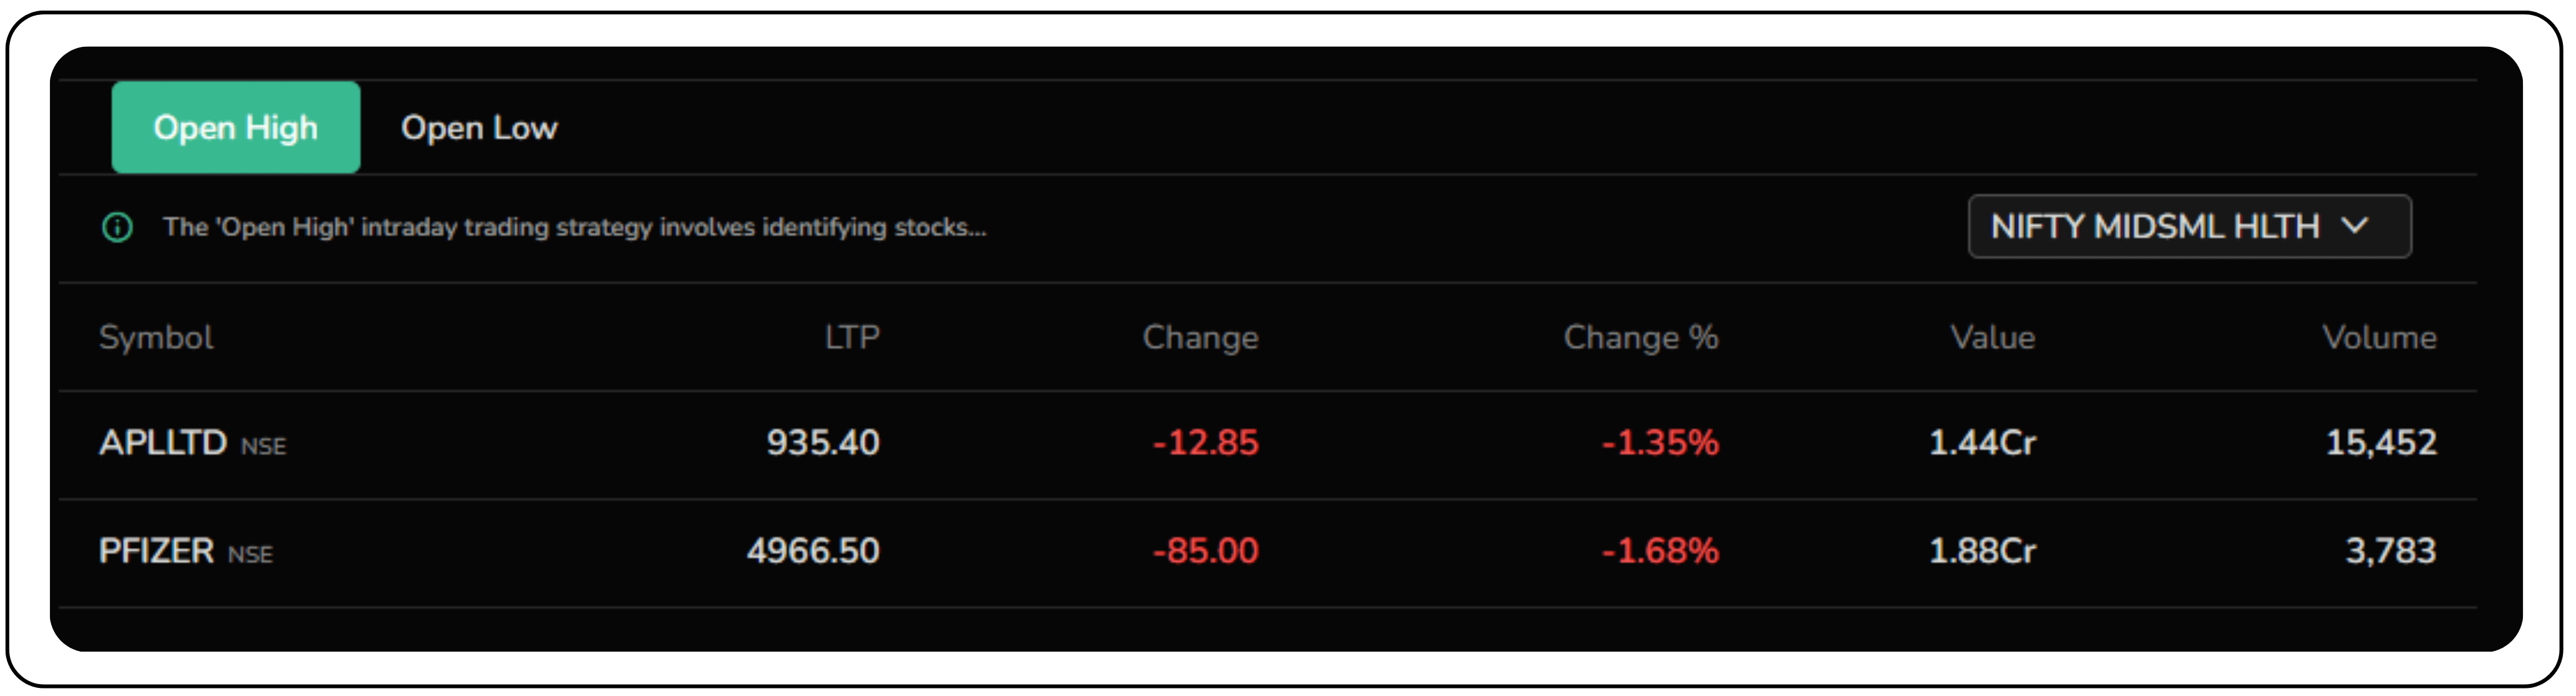
This kind of price action supports the Open = High bearish setup, where early highs often mark the start of a downward trend. When combined with other momentum indicators like RSI or MACD, the Open = High setup can help validate bearish entries.
Using pivot points to trade the Open = High setup on APL Ltd with CubePlus
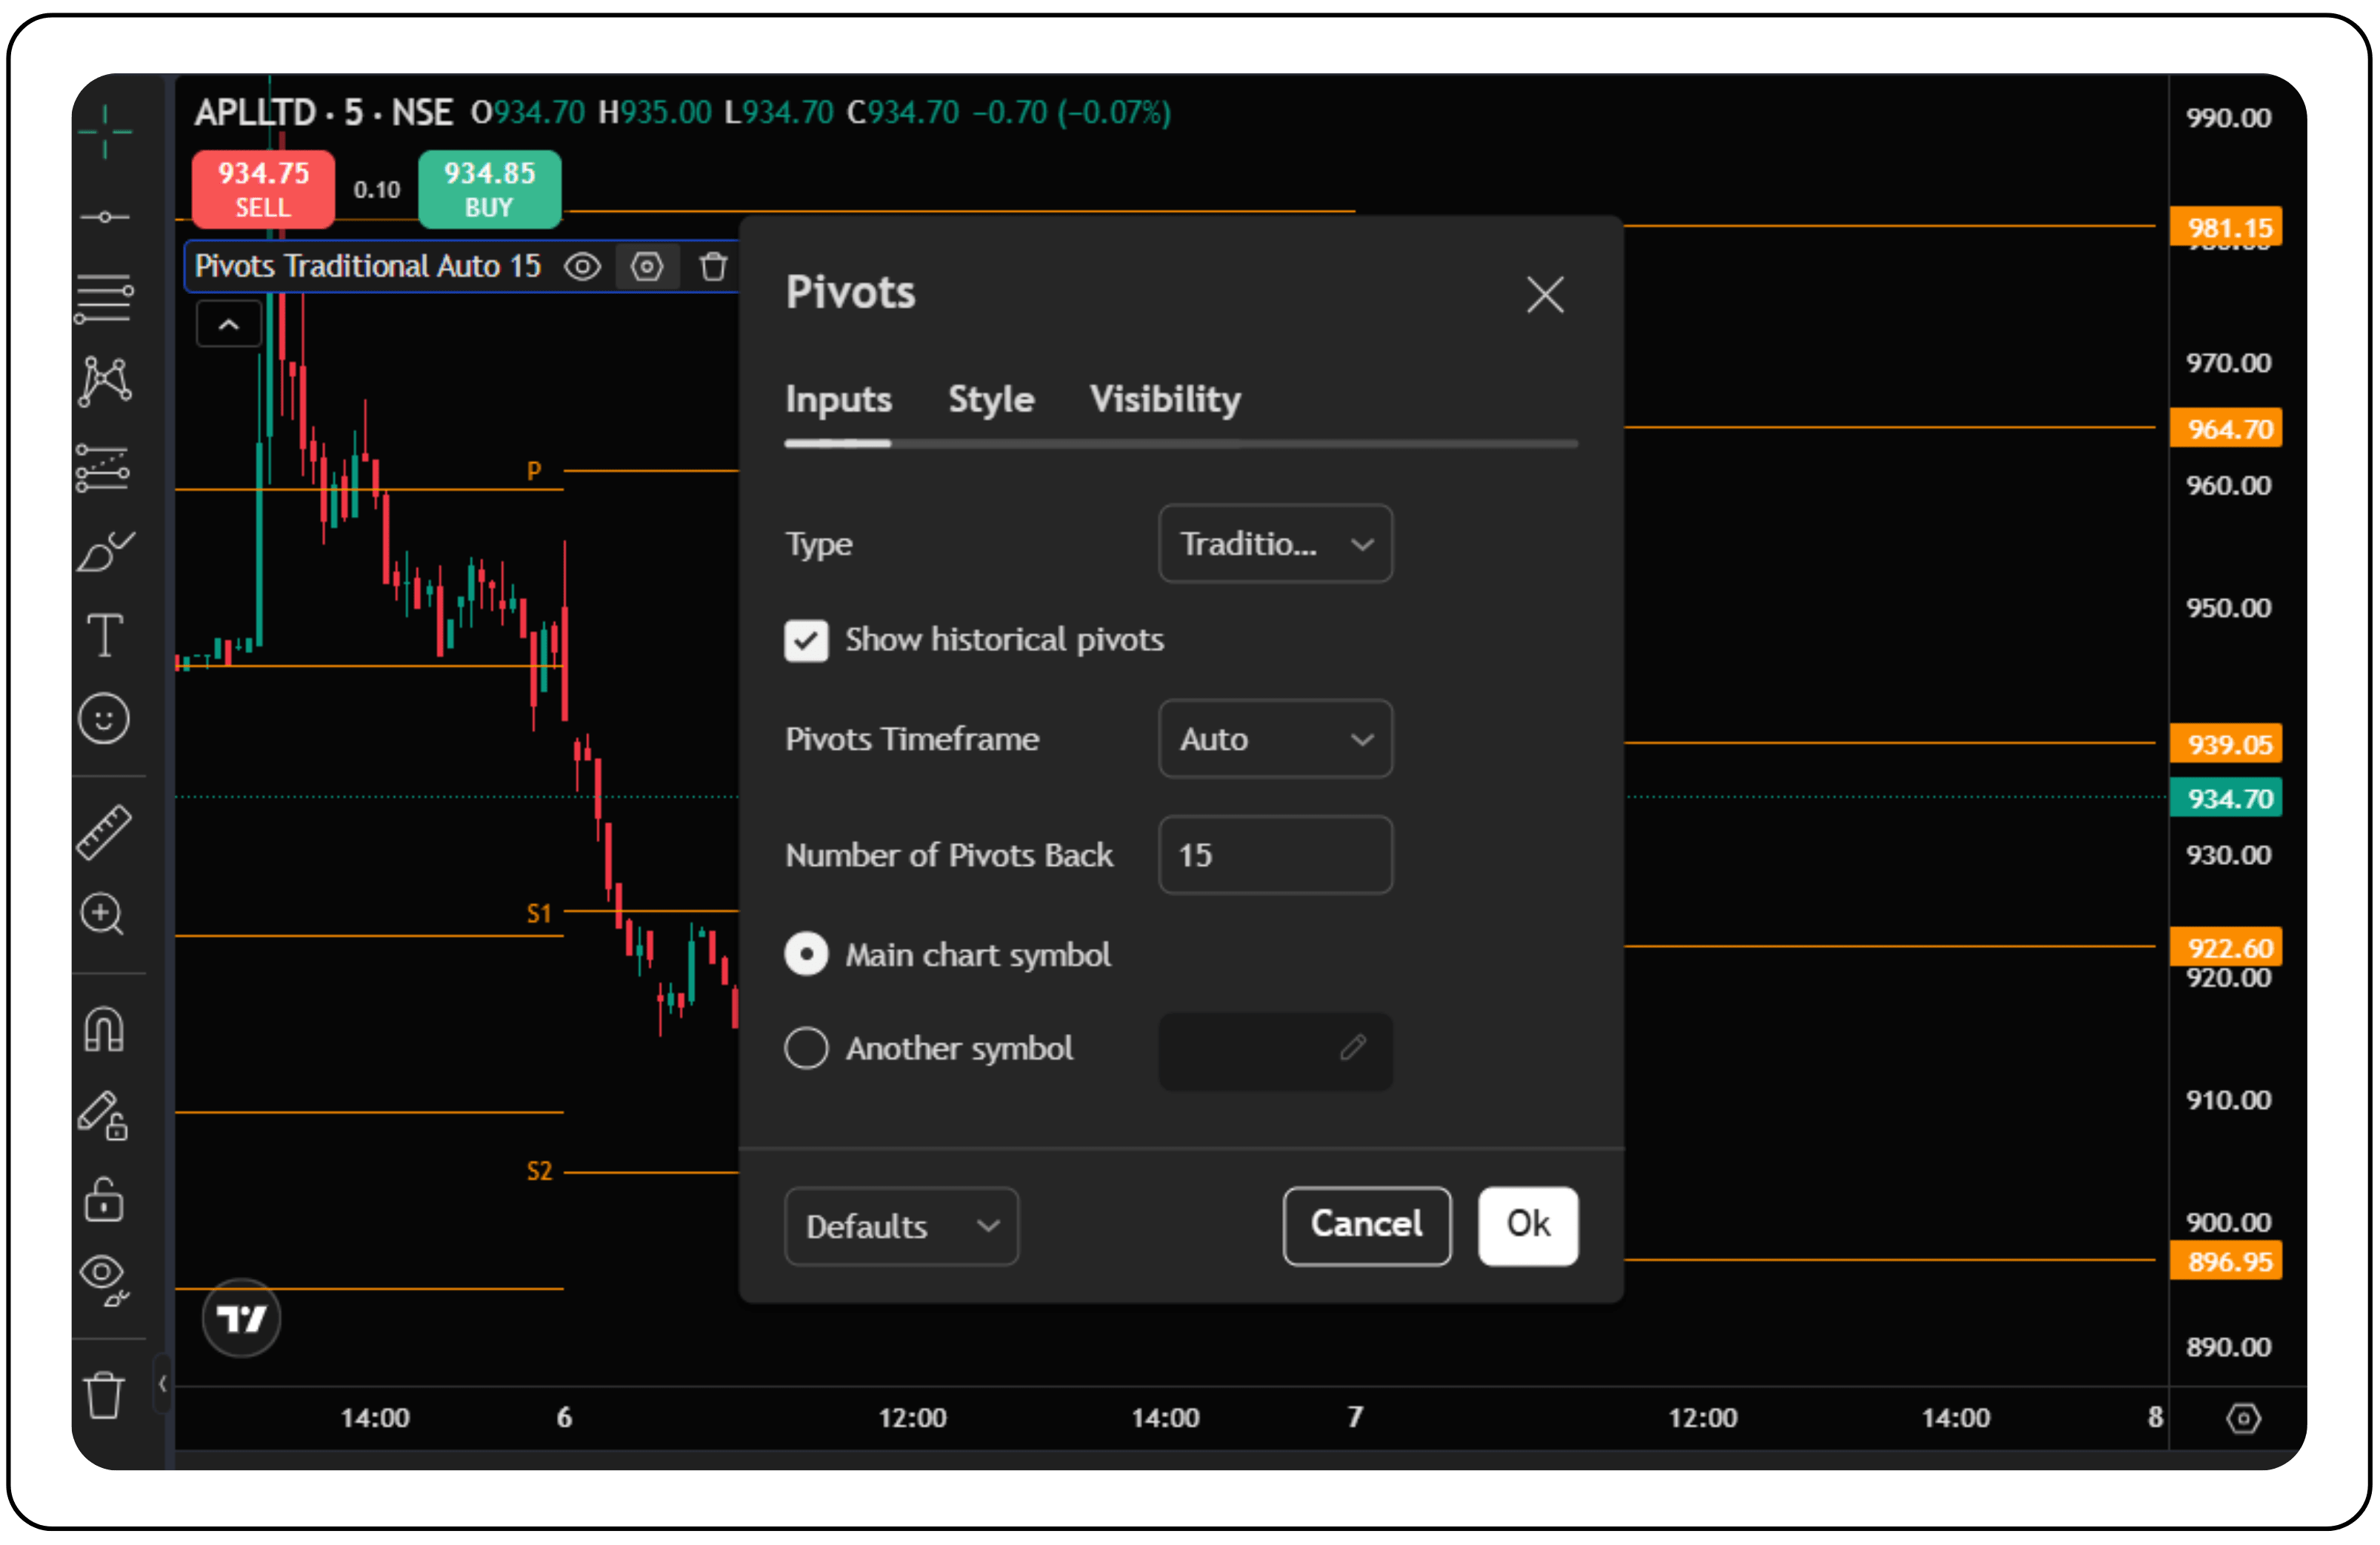
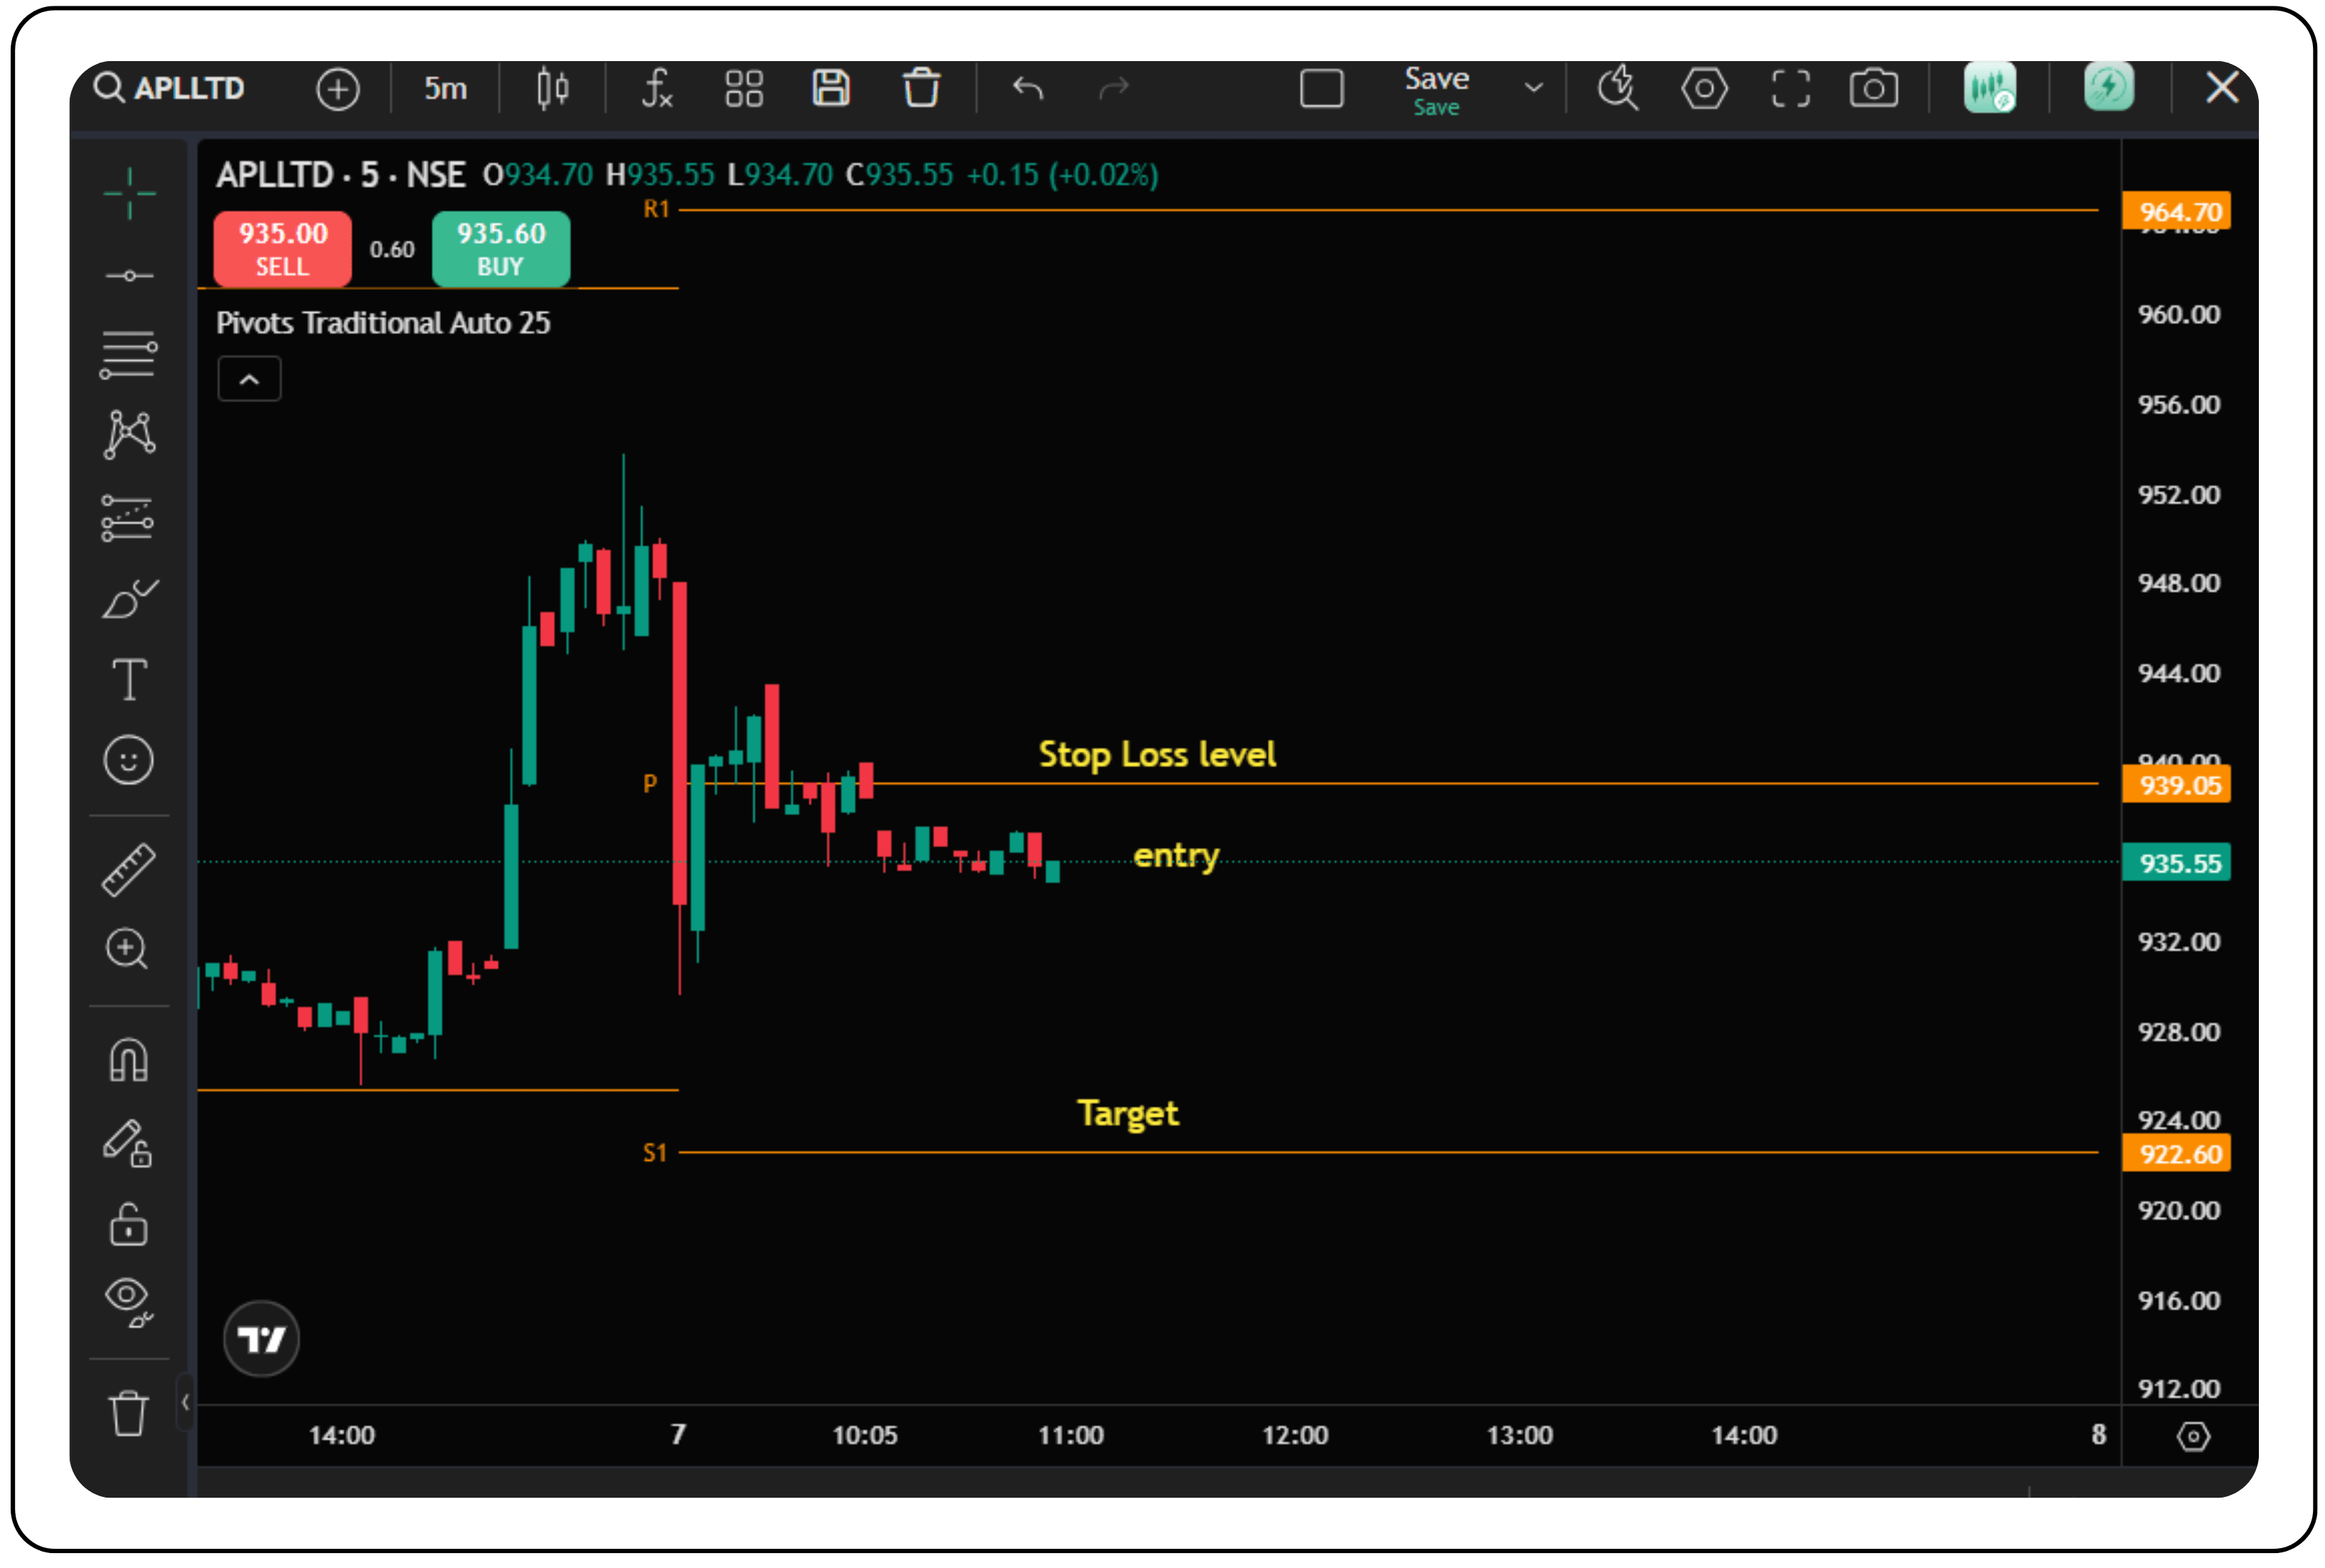
In the 5-minute chart of APL Ltd (NSE), the stock shows a clean Open = High pattern, often a reliable bearish signal, especially when the opening price aligns with a resistance level and selling begins right after. When combined with pivot points, the setup gains more context. With CubePlus, intraday traders can easily spot these levels and plan their short trades more confidently.
The setup explained:
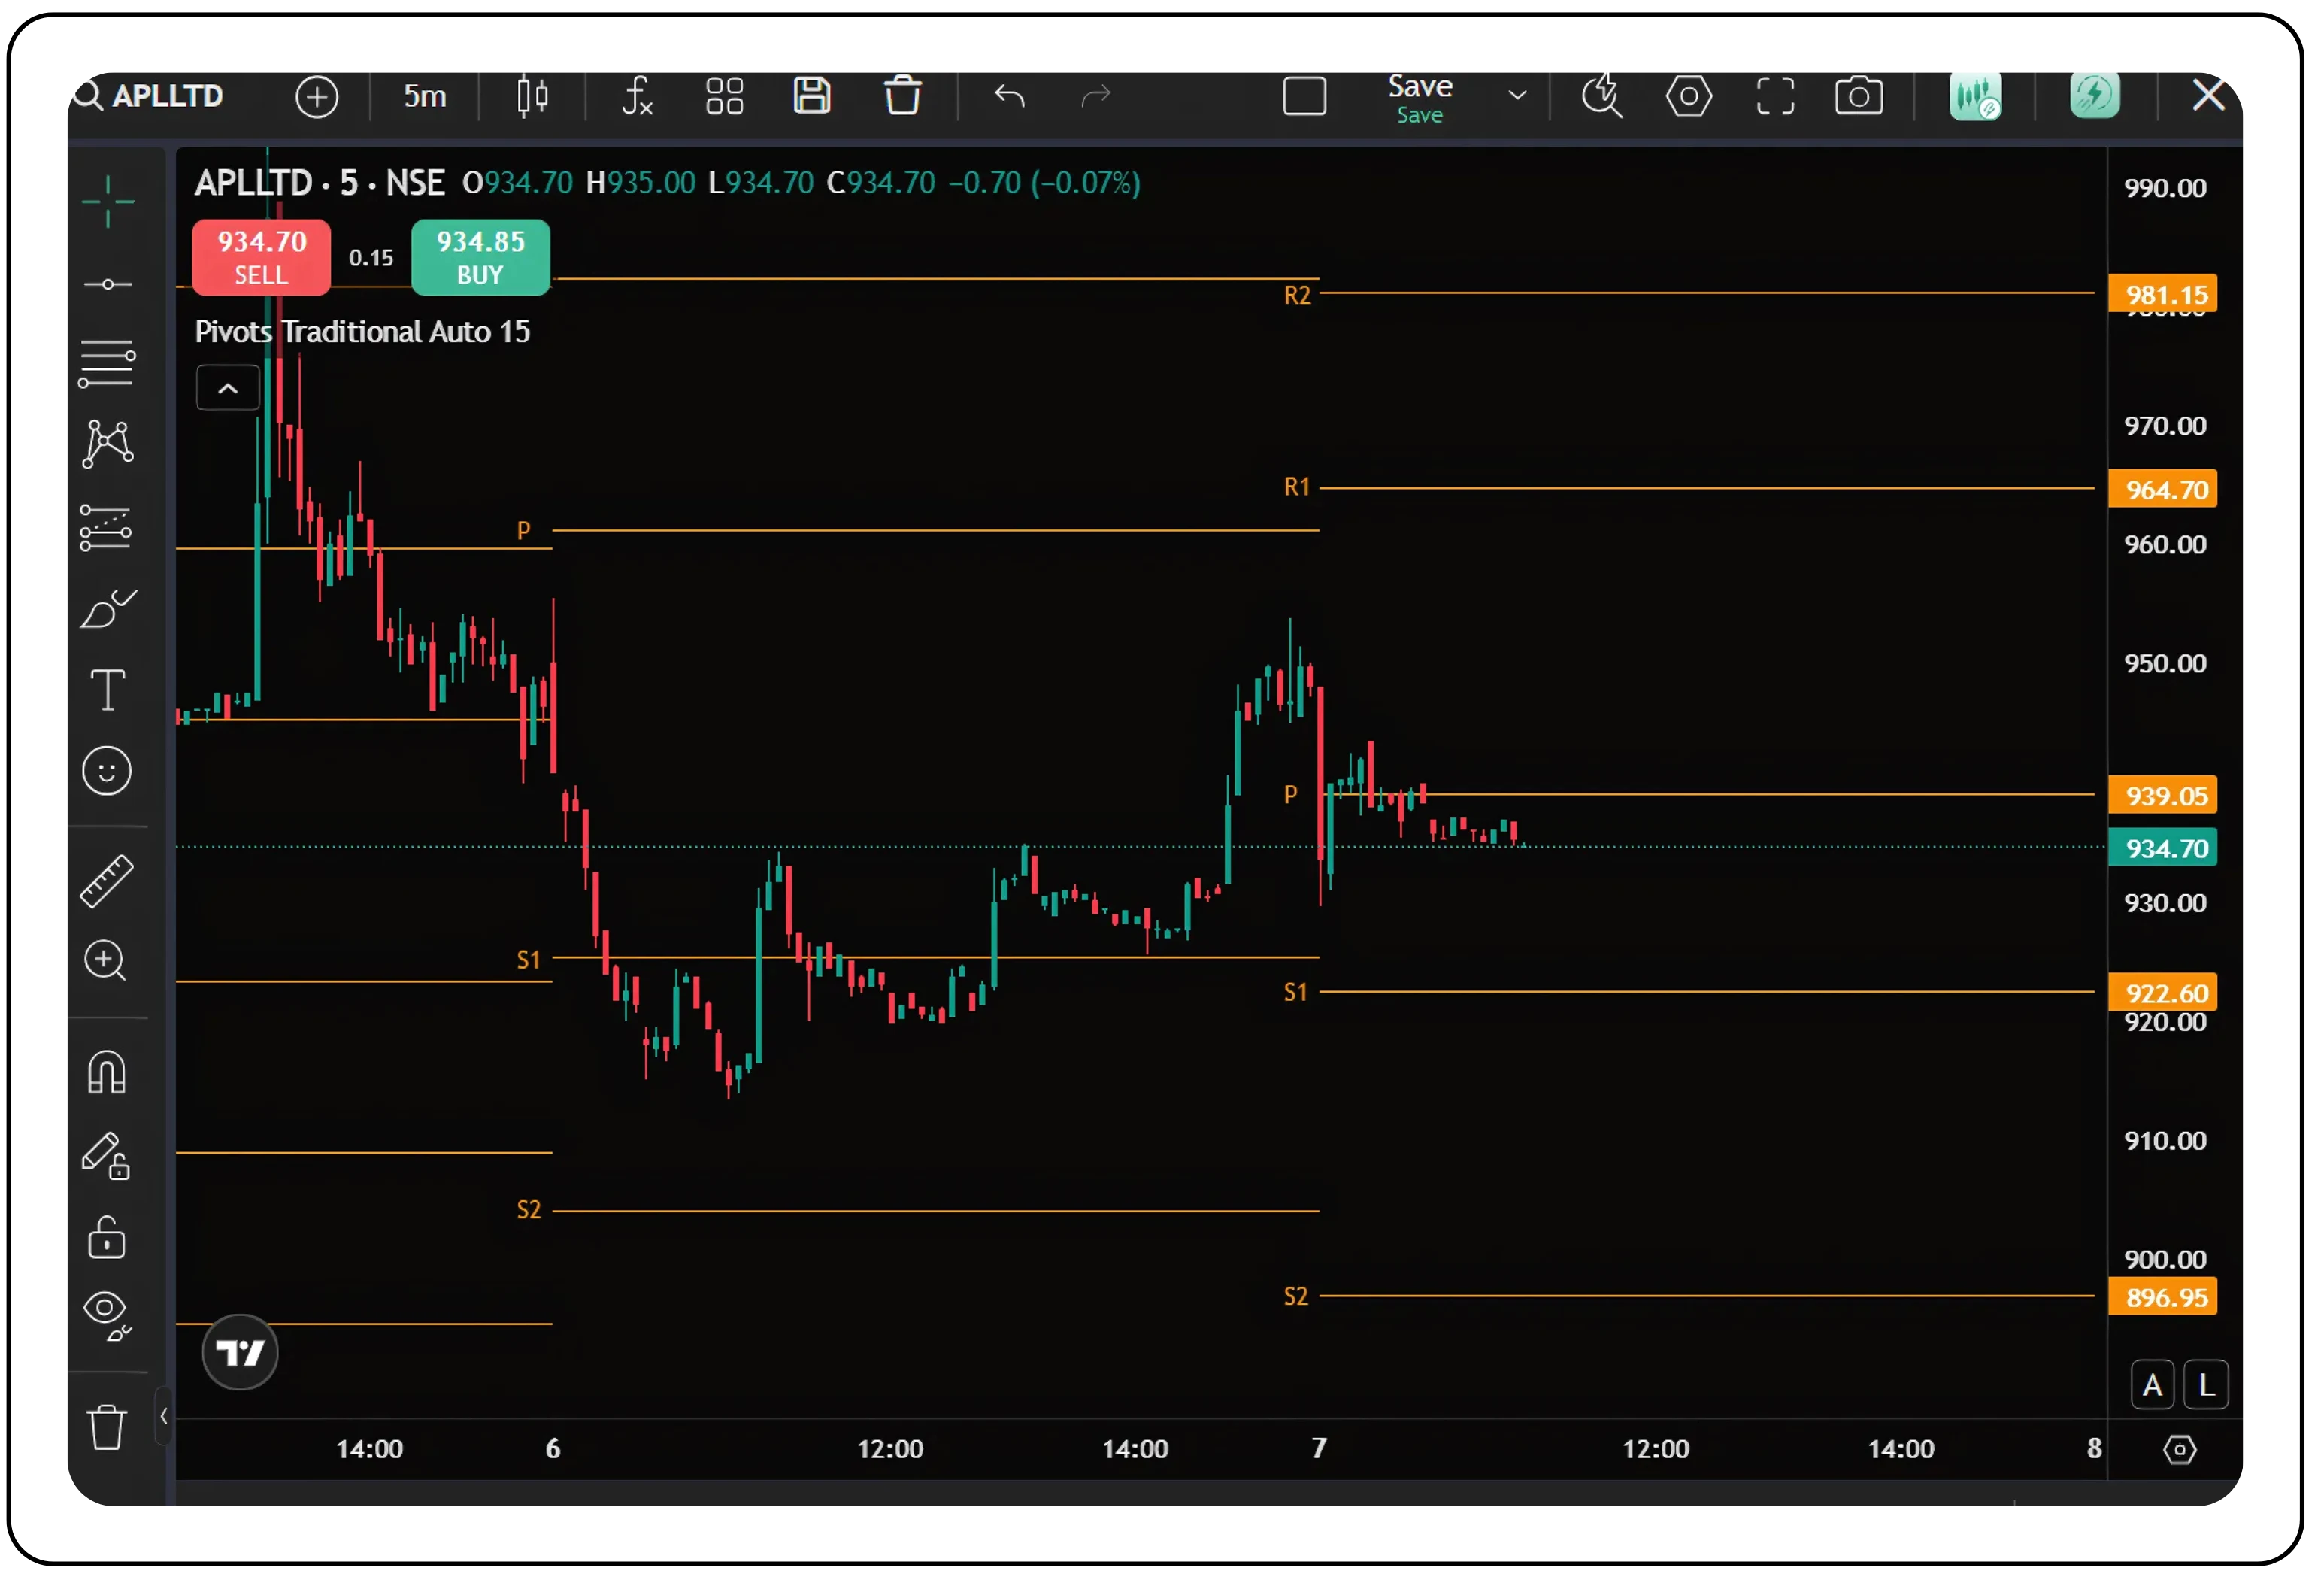
APL Ltd opened right at the high of ₹935 and was immediately rejected near the pivot level at ₹939.05. As selling kicked in, the price broke below the Pivot (P) and moved toward Support 1 (S1) at ₹922.60, eventually drifting closer to Support 2 (S2) at ₹896.95.
This kind of price action signals strong selling pressure, an ideal scenario for traders looking to short after a weak open.
Also read:
The CubePlus Guide to Mutual Fund Investing
Understanding and trading the Open = Low bullish setup like the pros
The Open = Low pattern is a classic intraday signal that points to strong buying interest from the very first candle. It works best when combined with volume spikes and pivot-level confirmations, giving traders a high-probability setup.
Here’s what defines an Open = Low setup:
- The stock opens at the lowest price of the day
- No sellers are willing to go below the open
- Buyers step in early, pushing prices higher
- The signal strengthens when the stock breaks above key levels like the pivot point or resistance zones
This is the kind of setup seasoned traders love; clear intent, early confirmation, and a defined risk-reward.
Tradejini clients can easily track Open = Low intraday setups using the CubePlus app, which offers a clean interface and real-time data filters. Just head to the Open Low tab under the intraday strategies section. The app automatically scans stocks from selected indices (like Nifty MidSmall Healthcare) and highlights those that opened at their intraday low, a signal many traders associate with early bullish momentum.
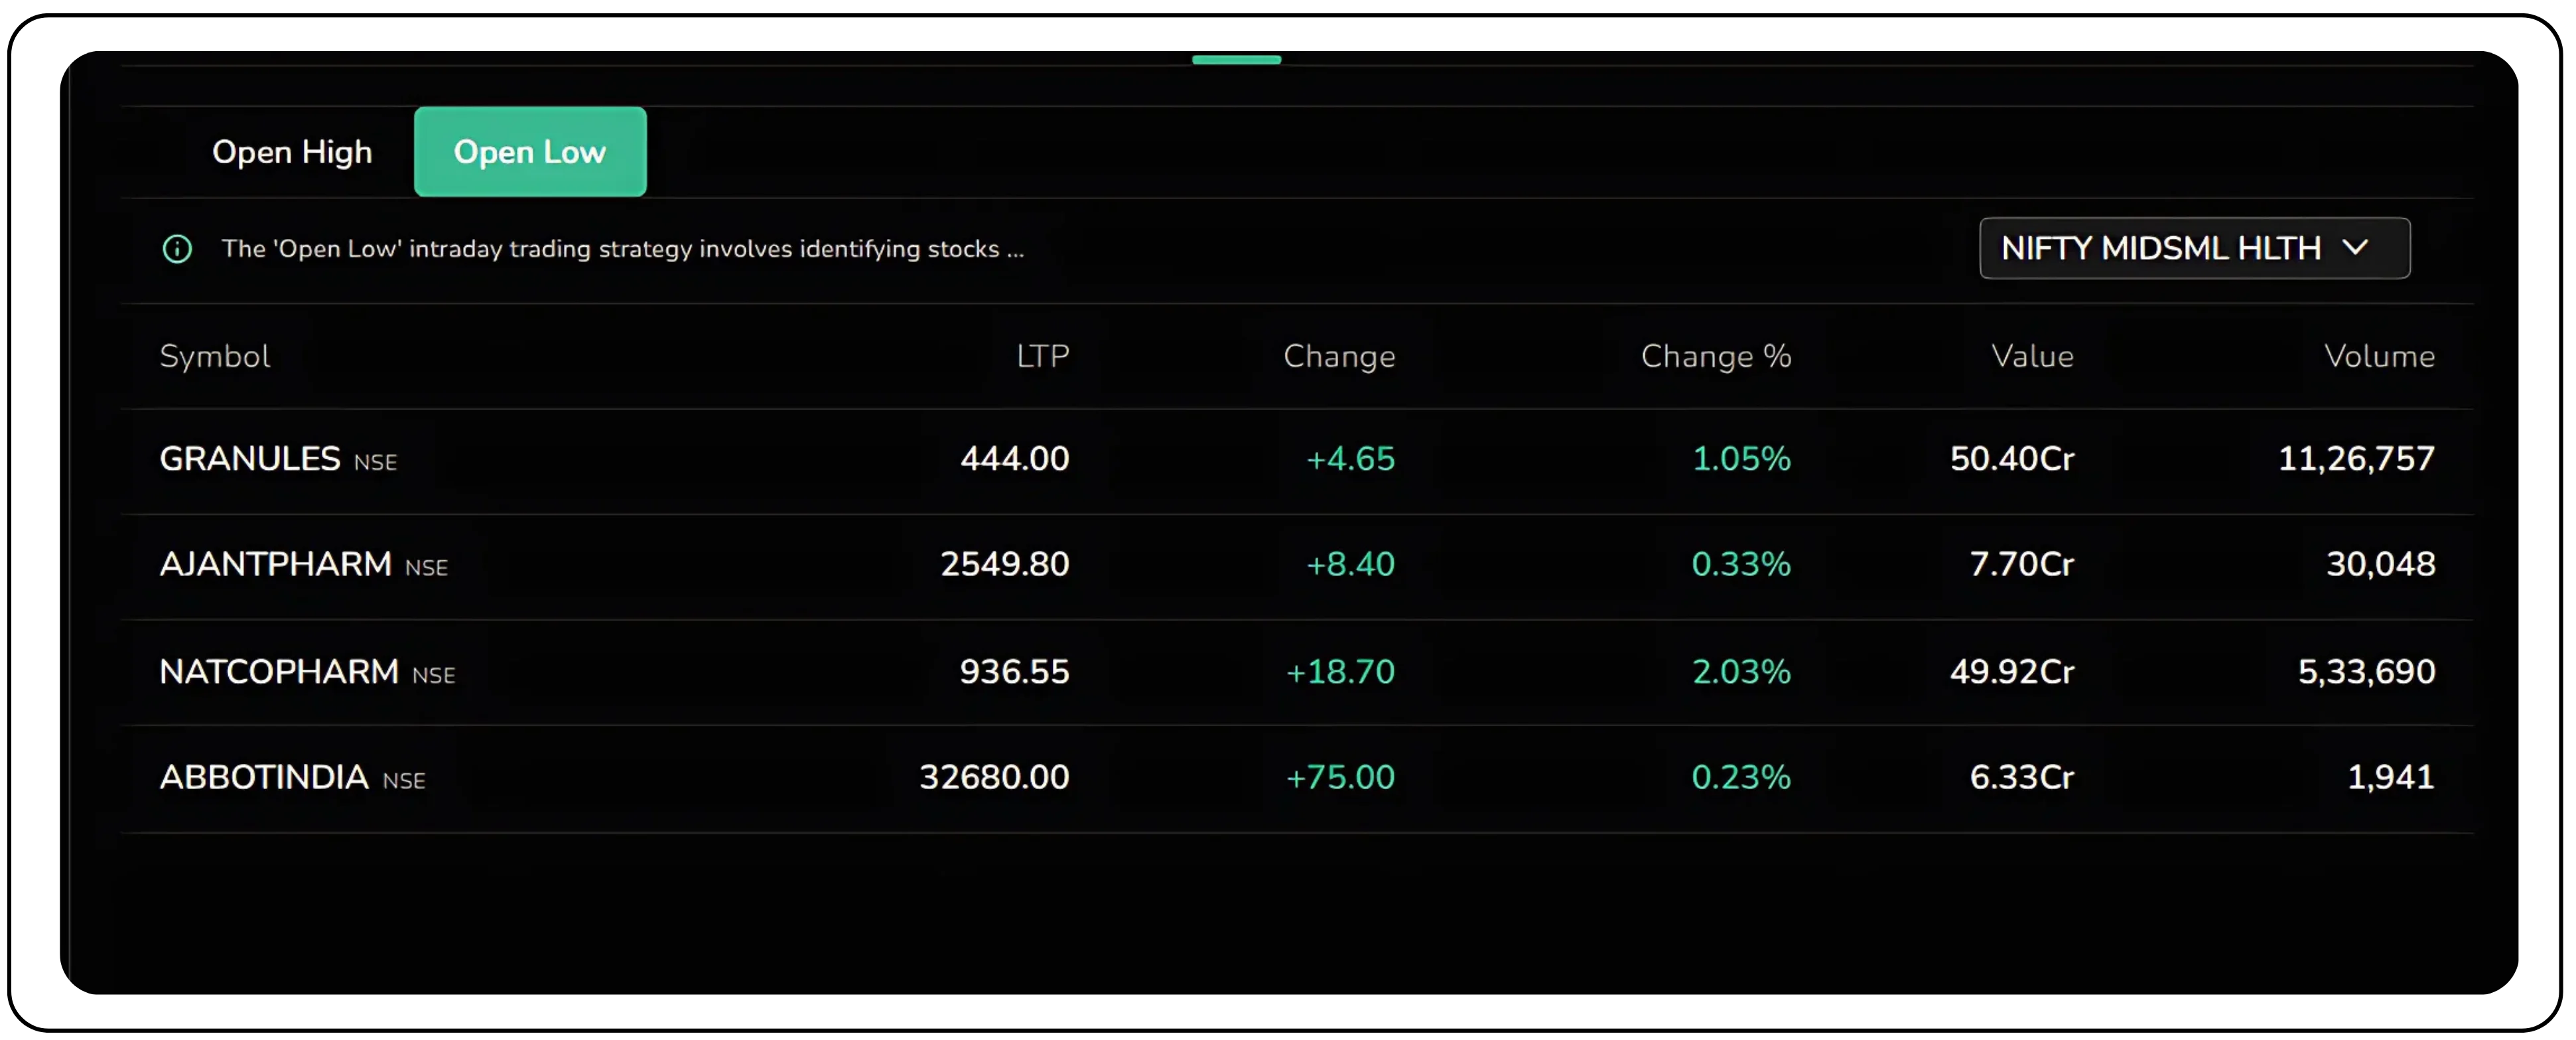
Each stock, such as Granules, Ajanta Pharma, Natco Pharma, and Abbott India—is displayed with key trading metrics: LTP, price and percentage change, traded value (₹ Cr), and volume. This makes it easy to assess which names have momentum and enough liquidity to trade confidently. By combining the Open = Low setup with pivot points, you create a momentum strategy that works across both manual and automated execution.
Trading the Open = Low (bullish setup) with pivot points and CubePlus API
To execute the Open = Low strategy using pivot points, like in the 5-minute chart of Granules with traditional pivots.
Here’s a breakdown of how seasoned traders would approach it. This mirrors the methods of traders like Mark Minervini, Paul Tudor Jones, and sharp price-action scalpers.
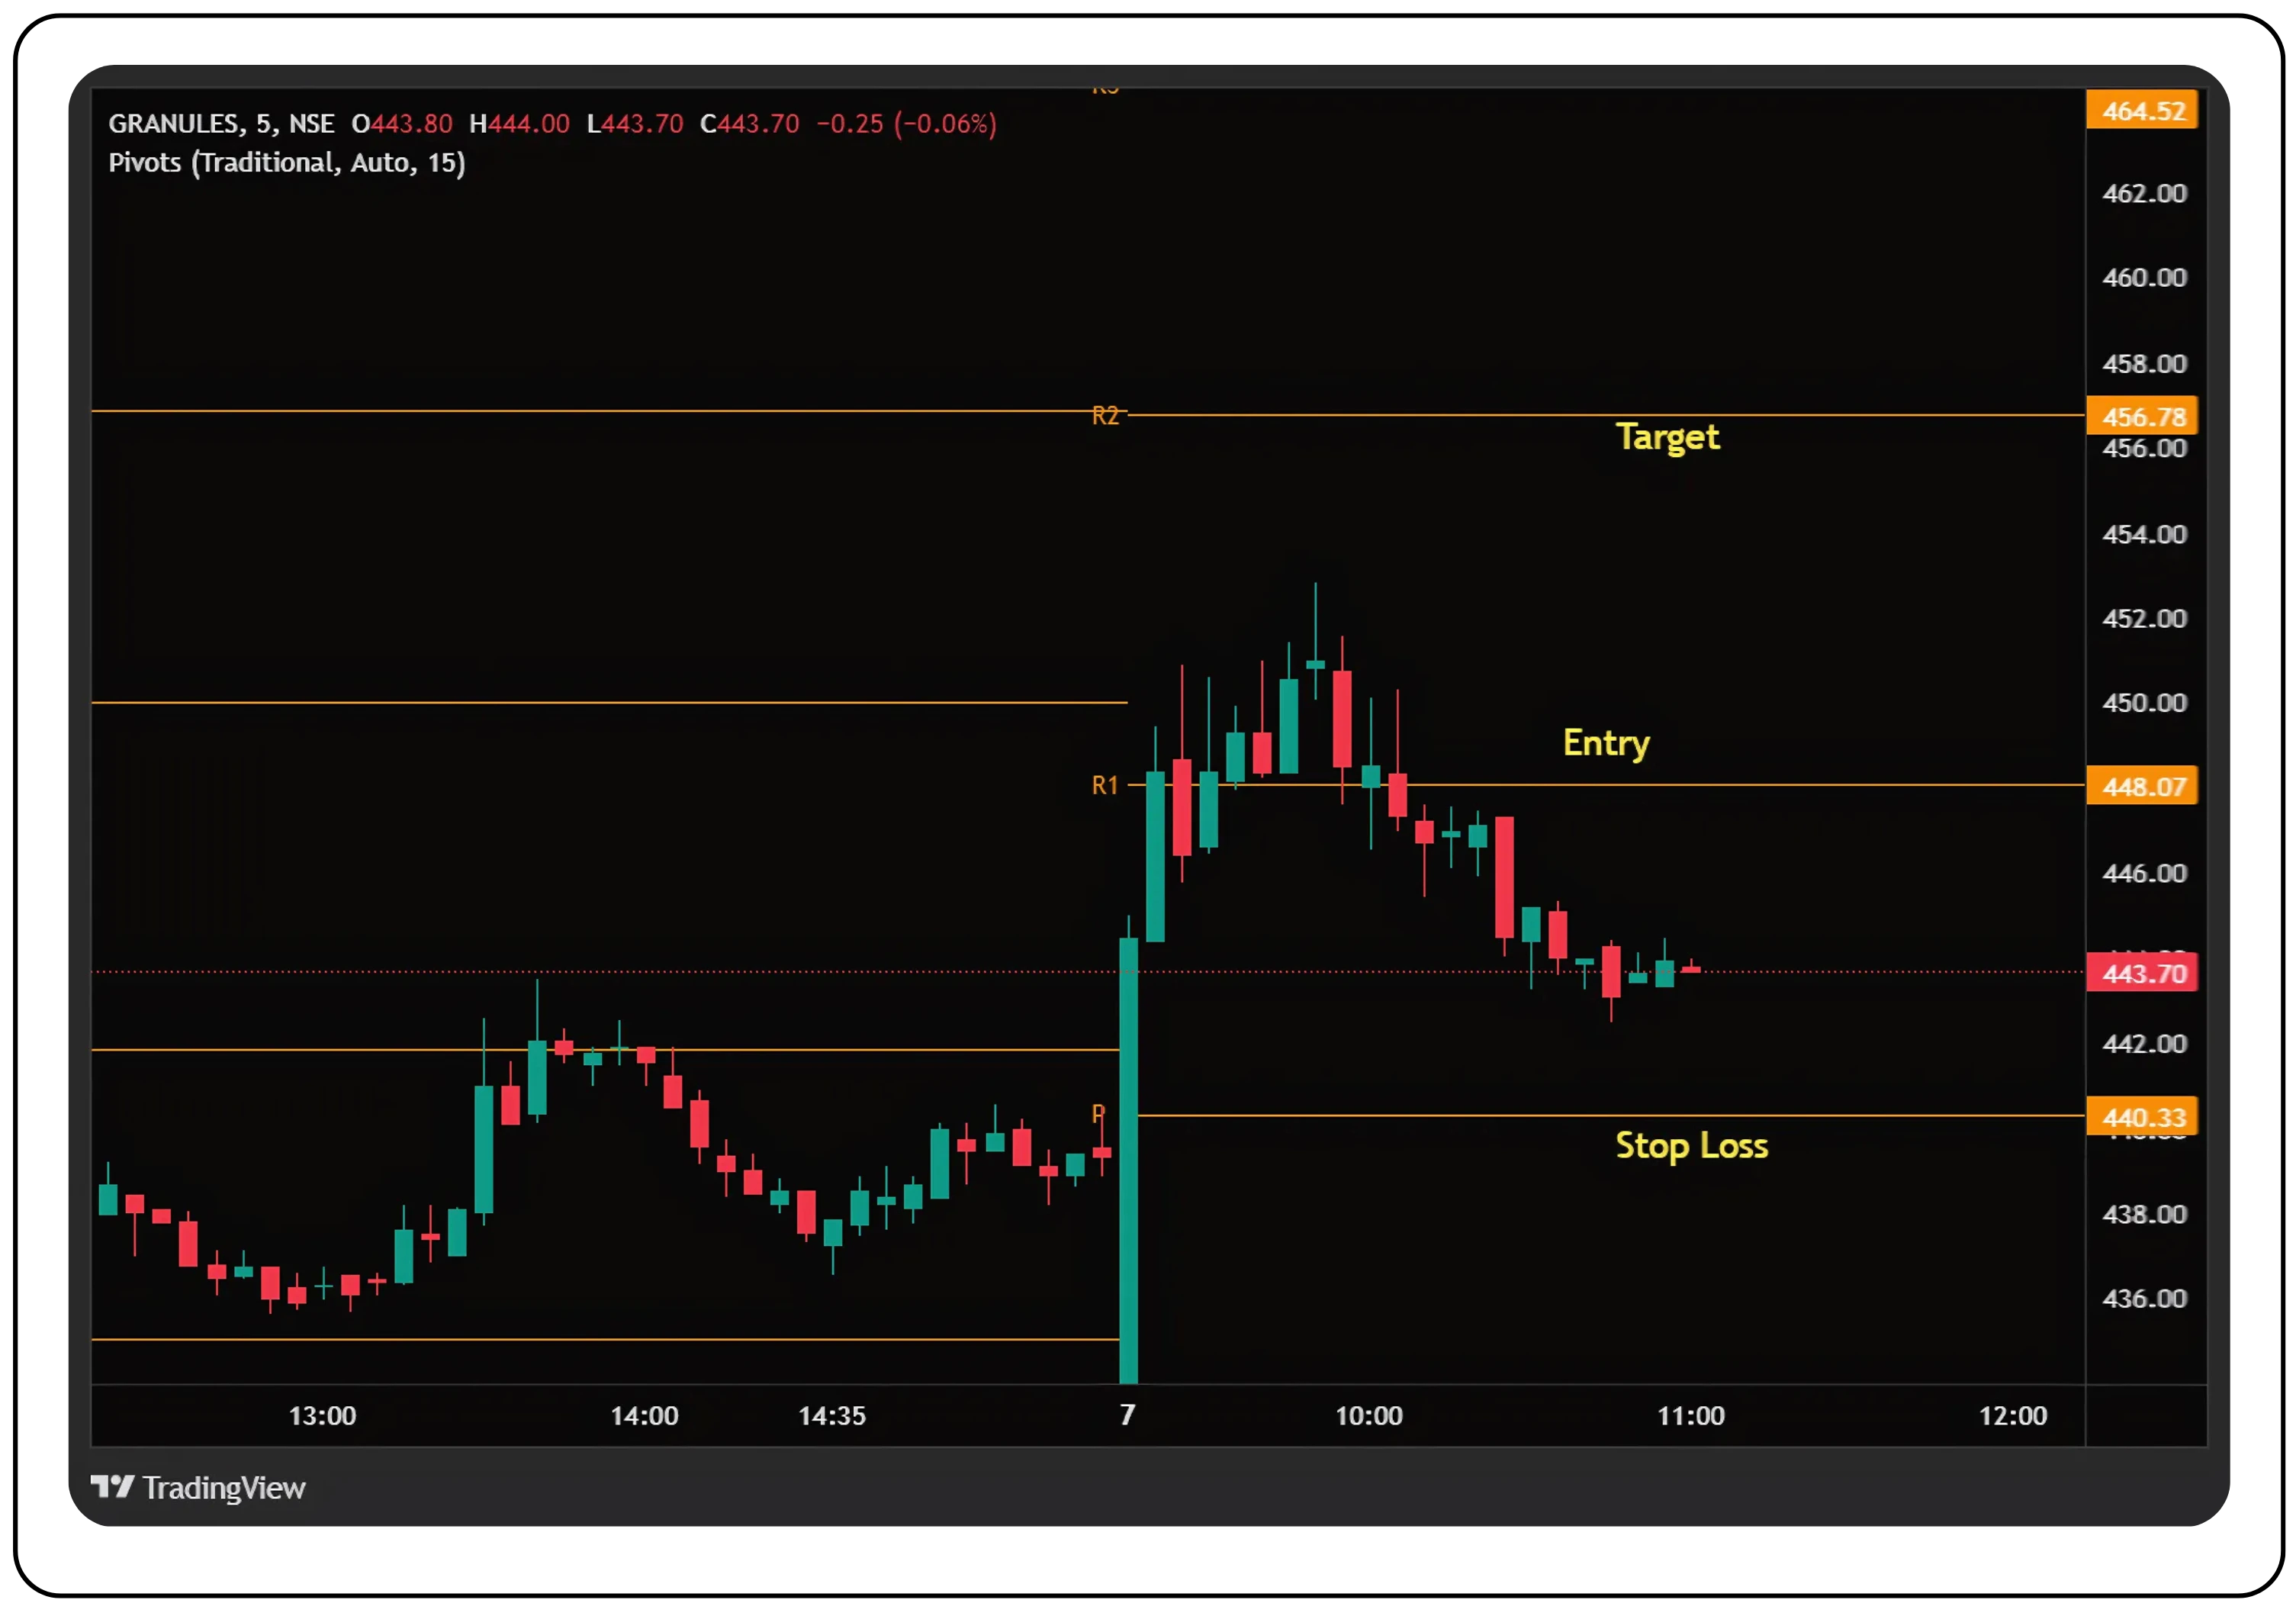
Understanding Granules’ chart setup:
Key levels:
- Entry: ₹448.07 (R1)
- Stop Loss: ₹440.33 (Pivot Point)
- Target: ₹456.78 (R2)
What happened:
On August 7, Granules opened at ₹443.80, which was also the day’s low; triggering an Open = Low bullish setup. The price broke above R1 (₹448.07), signaling strong upward momentum.
However, the breakout didn’t hold. Price failed to sustain above R1, showing that while the initial signal was valid, momentum faded, highlighting the importance of managing risk and not chasing moves without confirmation.
Also Read:
Intraday Trading with Bracket Orders on Tradejini CubePlus
How successful traders use Open = Low with pivot levels
Mark Minervini’s approach
Minervini, known for his sharp entries and momentum-driven strategies, wouldn’t jump into a trade just because the stock opened at its low. Even with an Open = Low setup, he’d wait for confirmation, a strong candle closing above a key resistance, like R1, with rising volume. In this case, that means a clean break and hold above ₹448.07. Once that happens, he might start building a position gradually, adding on strength as the trade moves toward R2 (₹456.78) or beyond. His stop loss would typically sit just below the pivot (₹440.33) or the low of the confirmation candle. It’s all about validating the trend and managing risk tightly—hallmarks of his method.
Paul Tudor Jones’ perspective
Jones is all about risk first, reward second. He had to look at this trade through the lens of risk-to-reward. Entry at ₹448, stop at ₹440.33, and a target of ₹456.78 means risking ₹7.67 for a potential gain of ₹8.78, a 1.14:1 ratio. That’s below his typical threshold of 2:1. So, he'd probably pass on this setup or wait for a better entry point, maybe after a retracement, to tilt the odds in his favour. For Jones, capital preservation and asymmetric payoff are non-negotiable.
Price Action Intraday Scalper
This trader plays it fast and tight. Once Open = Low is validated, they enter aggressively at the high of the first 5-minute candle or on a break-and-retest of R1 (₹448.07). Their stop is tight, either just below the breakout candle or the pivot. Profits are booked in stages: partial exits near R2 (₹456.78), with the rest trailed as long as momentum holds. The focus here is speed, precision, and quick decision-making.
Wrapping it up
The Open = High / Open = Low feature on CubePlus isn’t just a scanner—it’s a smart starting point for building high-probability intraday trades. Whether you’re a trend follower like Minervini, a risk-focused strategist like Tudor Jones, or a nimble scalper using pure price action, this setup gives you clear intent from the market right at the open.
By combining these signals with pivot points, volume, and proper risk management, you move from guesswork to structured execution. And with CubePlus delivering real-time data and intuitive filters, spotting and acting on these setups becomes faster and more informed.
Bottom line: Open = High and Open = Low are simple ideas, but in the hands of a disciplined trader, they can be powerful tools.
Sign up on CubePlus, spot your next Open = High or Open = Low setup, and let the platform handle the heavy lifting while you focus on executing with confidence. Happy trading!
© 2025 — Tradejini. All Rights Reserved.