


Reading a technical chart can often be challenging, especially when you are trying to identify genuine trends in a data-heavy market. The Ichimoku Cloud indicator helps cut through that confusion by combining trend direction, momentum, and support or resistance levels into a single visual.
It’s an all-in-one tool that layers multiple pieces of price information on one chart. While it may appear crowded at first glance, understanding what each line and the cloud represent turns it into a highly practical aid for technical analysis and market interpretation.
What is the Ichimoku cloud indicator?
The Ichimoku Kinko Hyo Cloud, developed in Japan, was designed to give traders a quick, comprehensive view of market momentum, trend direction, and potential support or resistance. It works particularly well in trending markets, using five lines and a shaded area that together present a complete market picture. There’s no need to memorize formulas, the key lies in interpreting what these elements reveal in real time.
Let’s break down the components of the Ichimoku Cloud in simple terms.
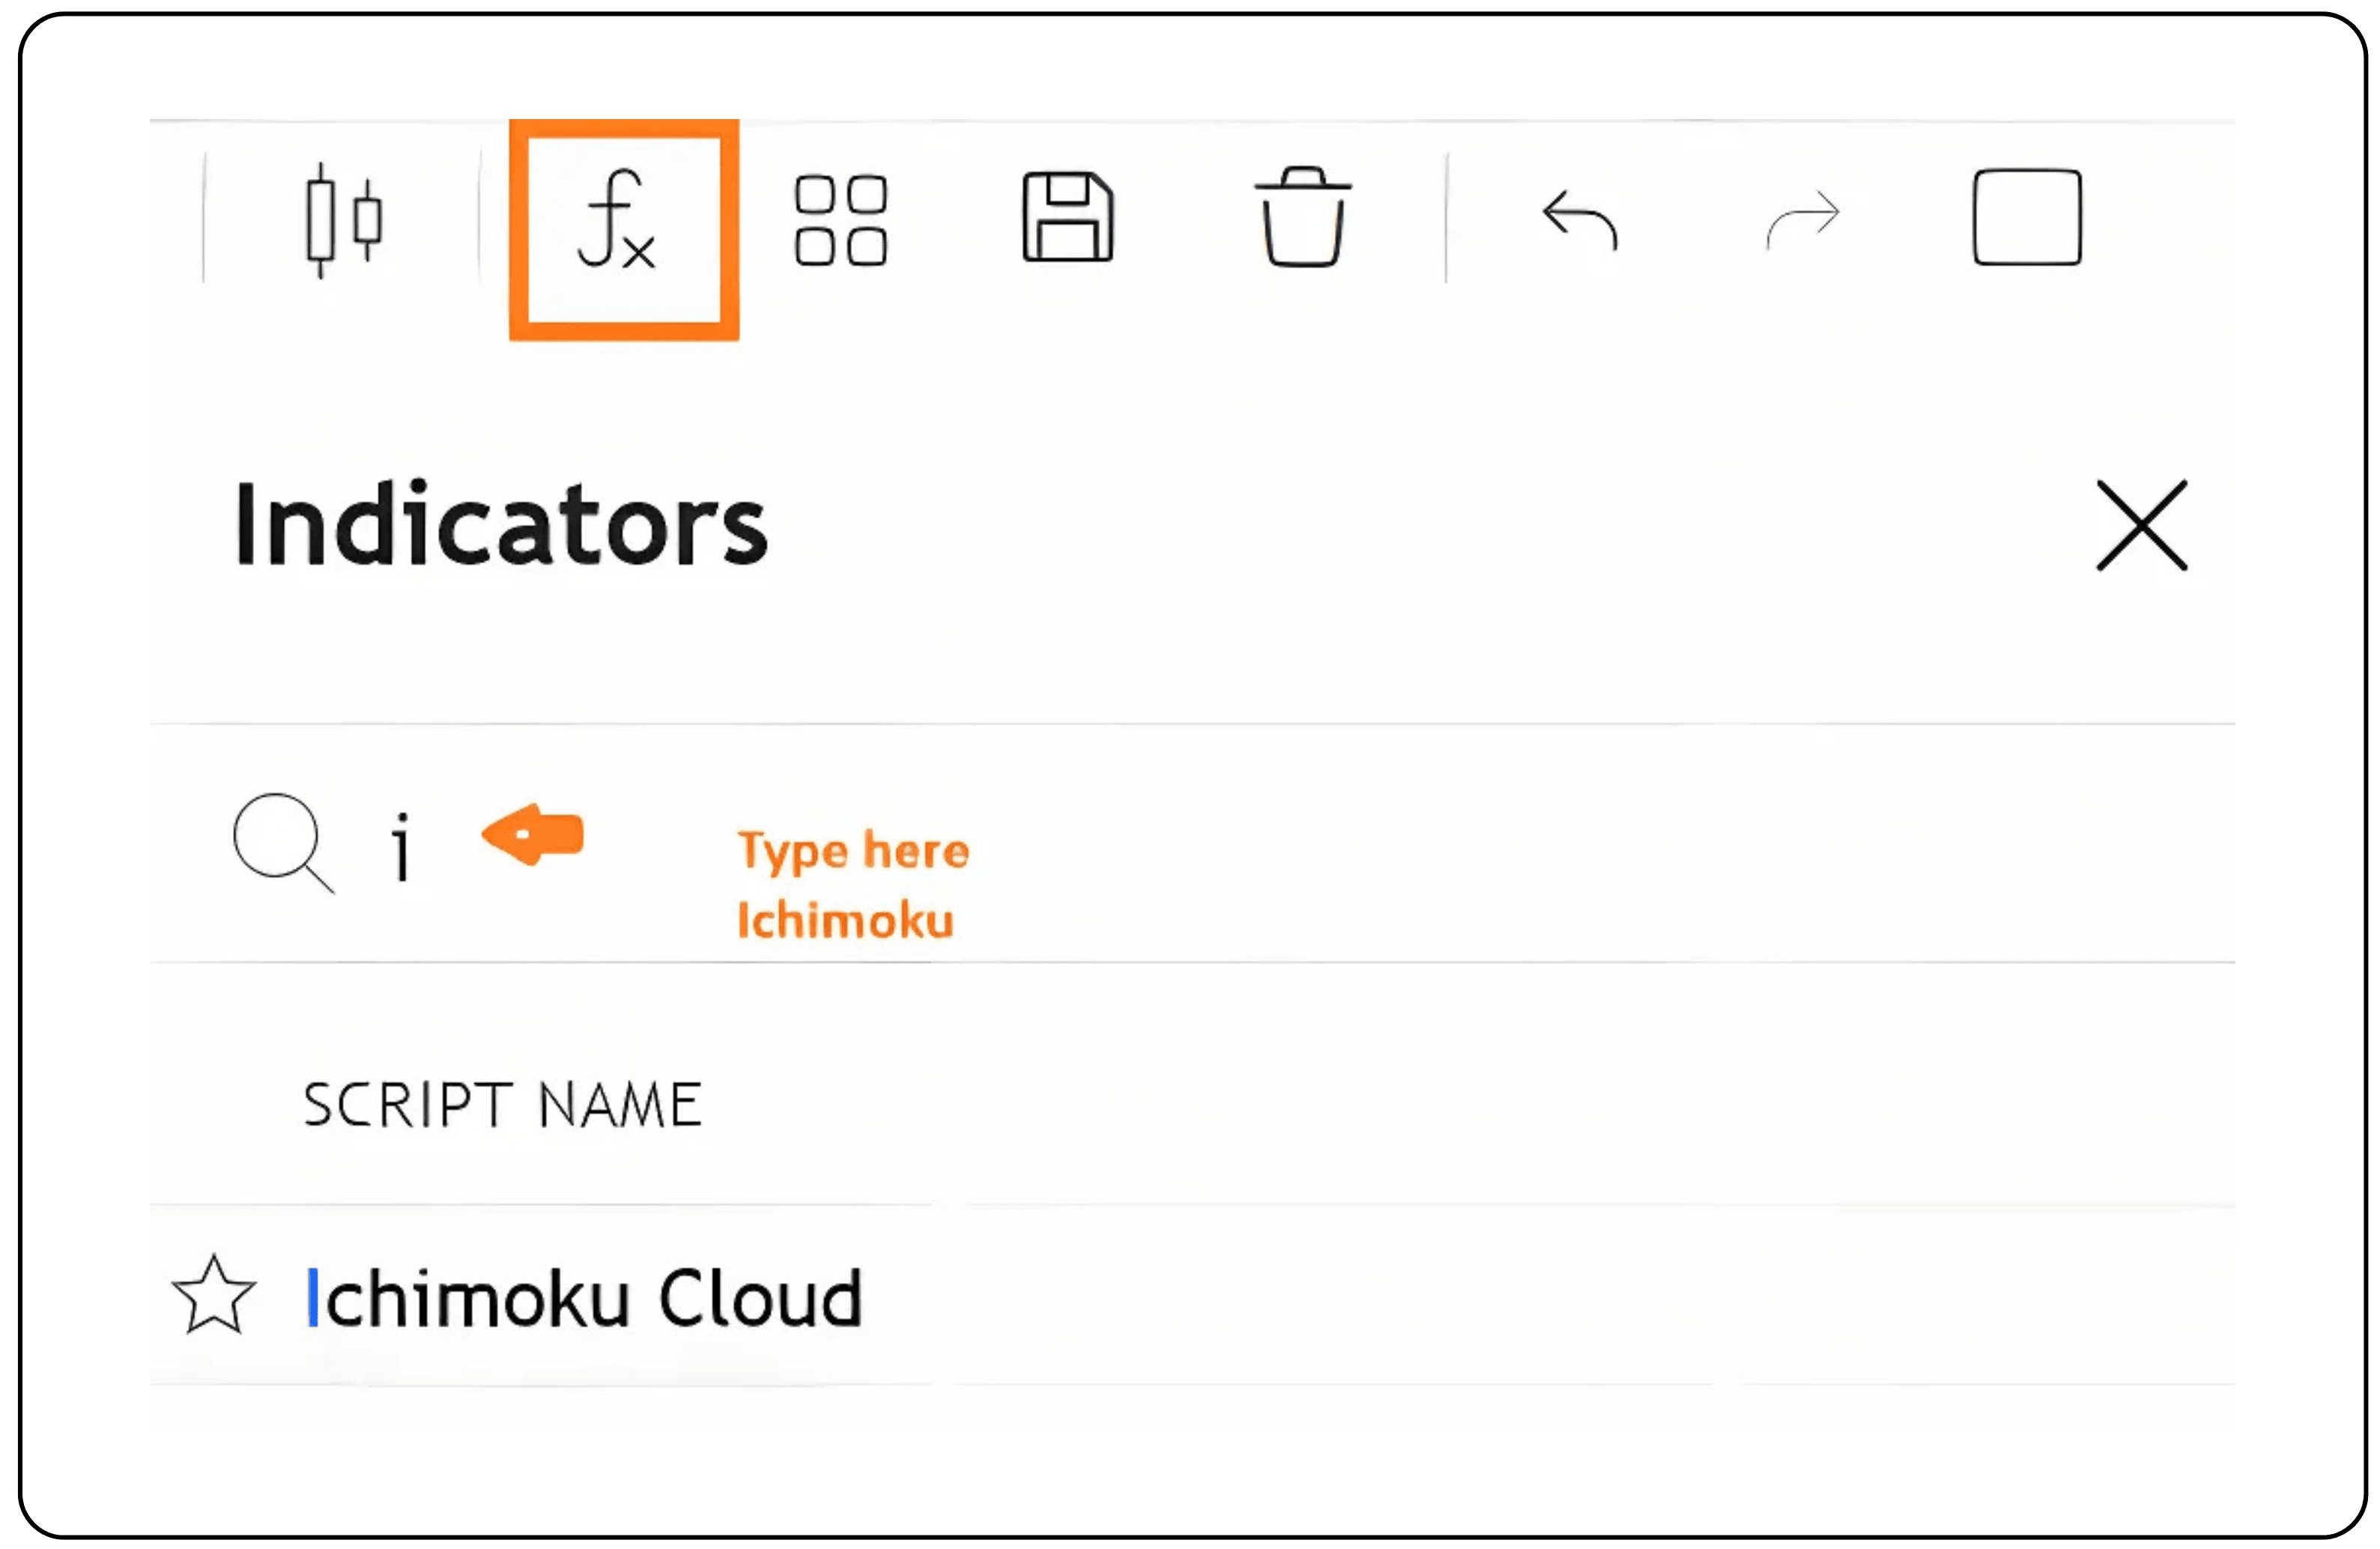
How to apply an indicator in CubePlus?
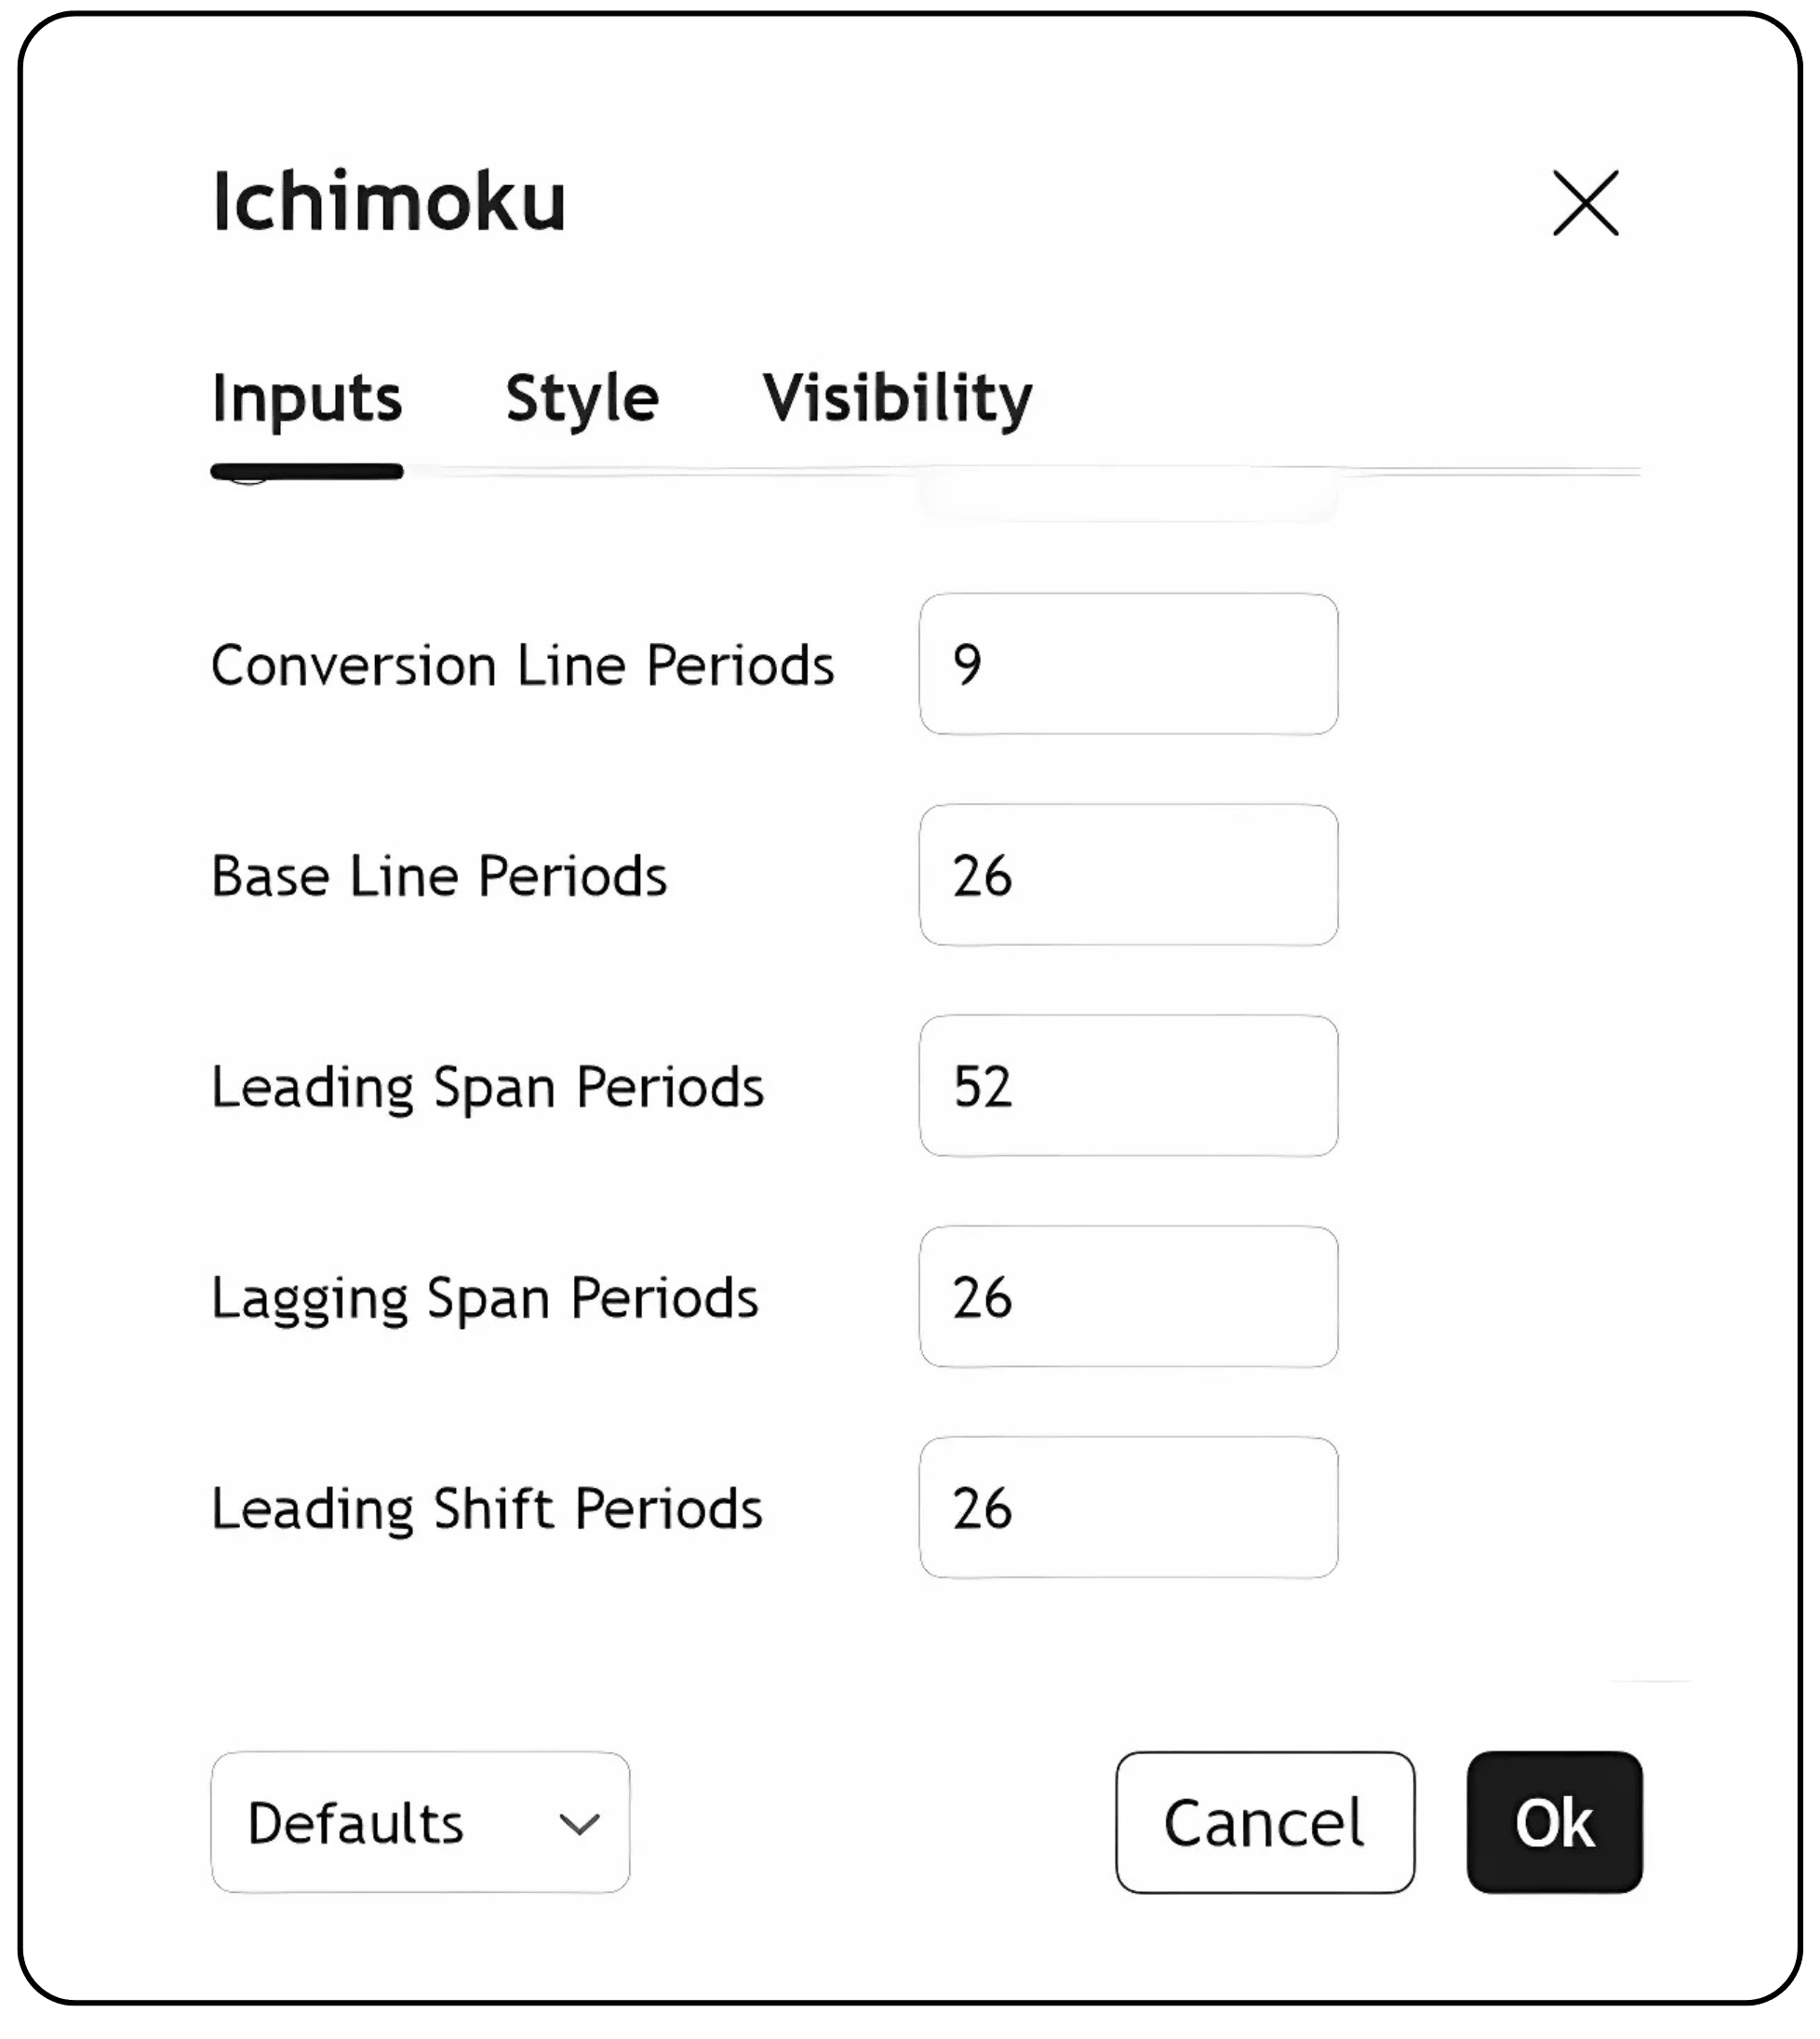
Below are the default settings for the indicator.
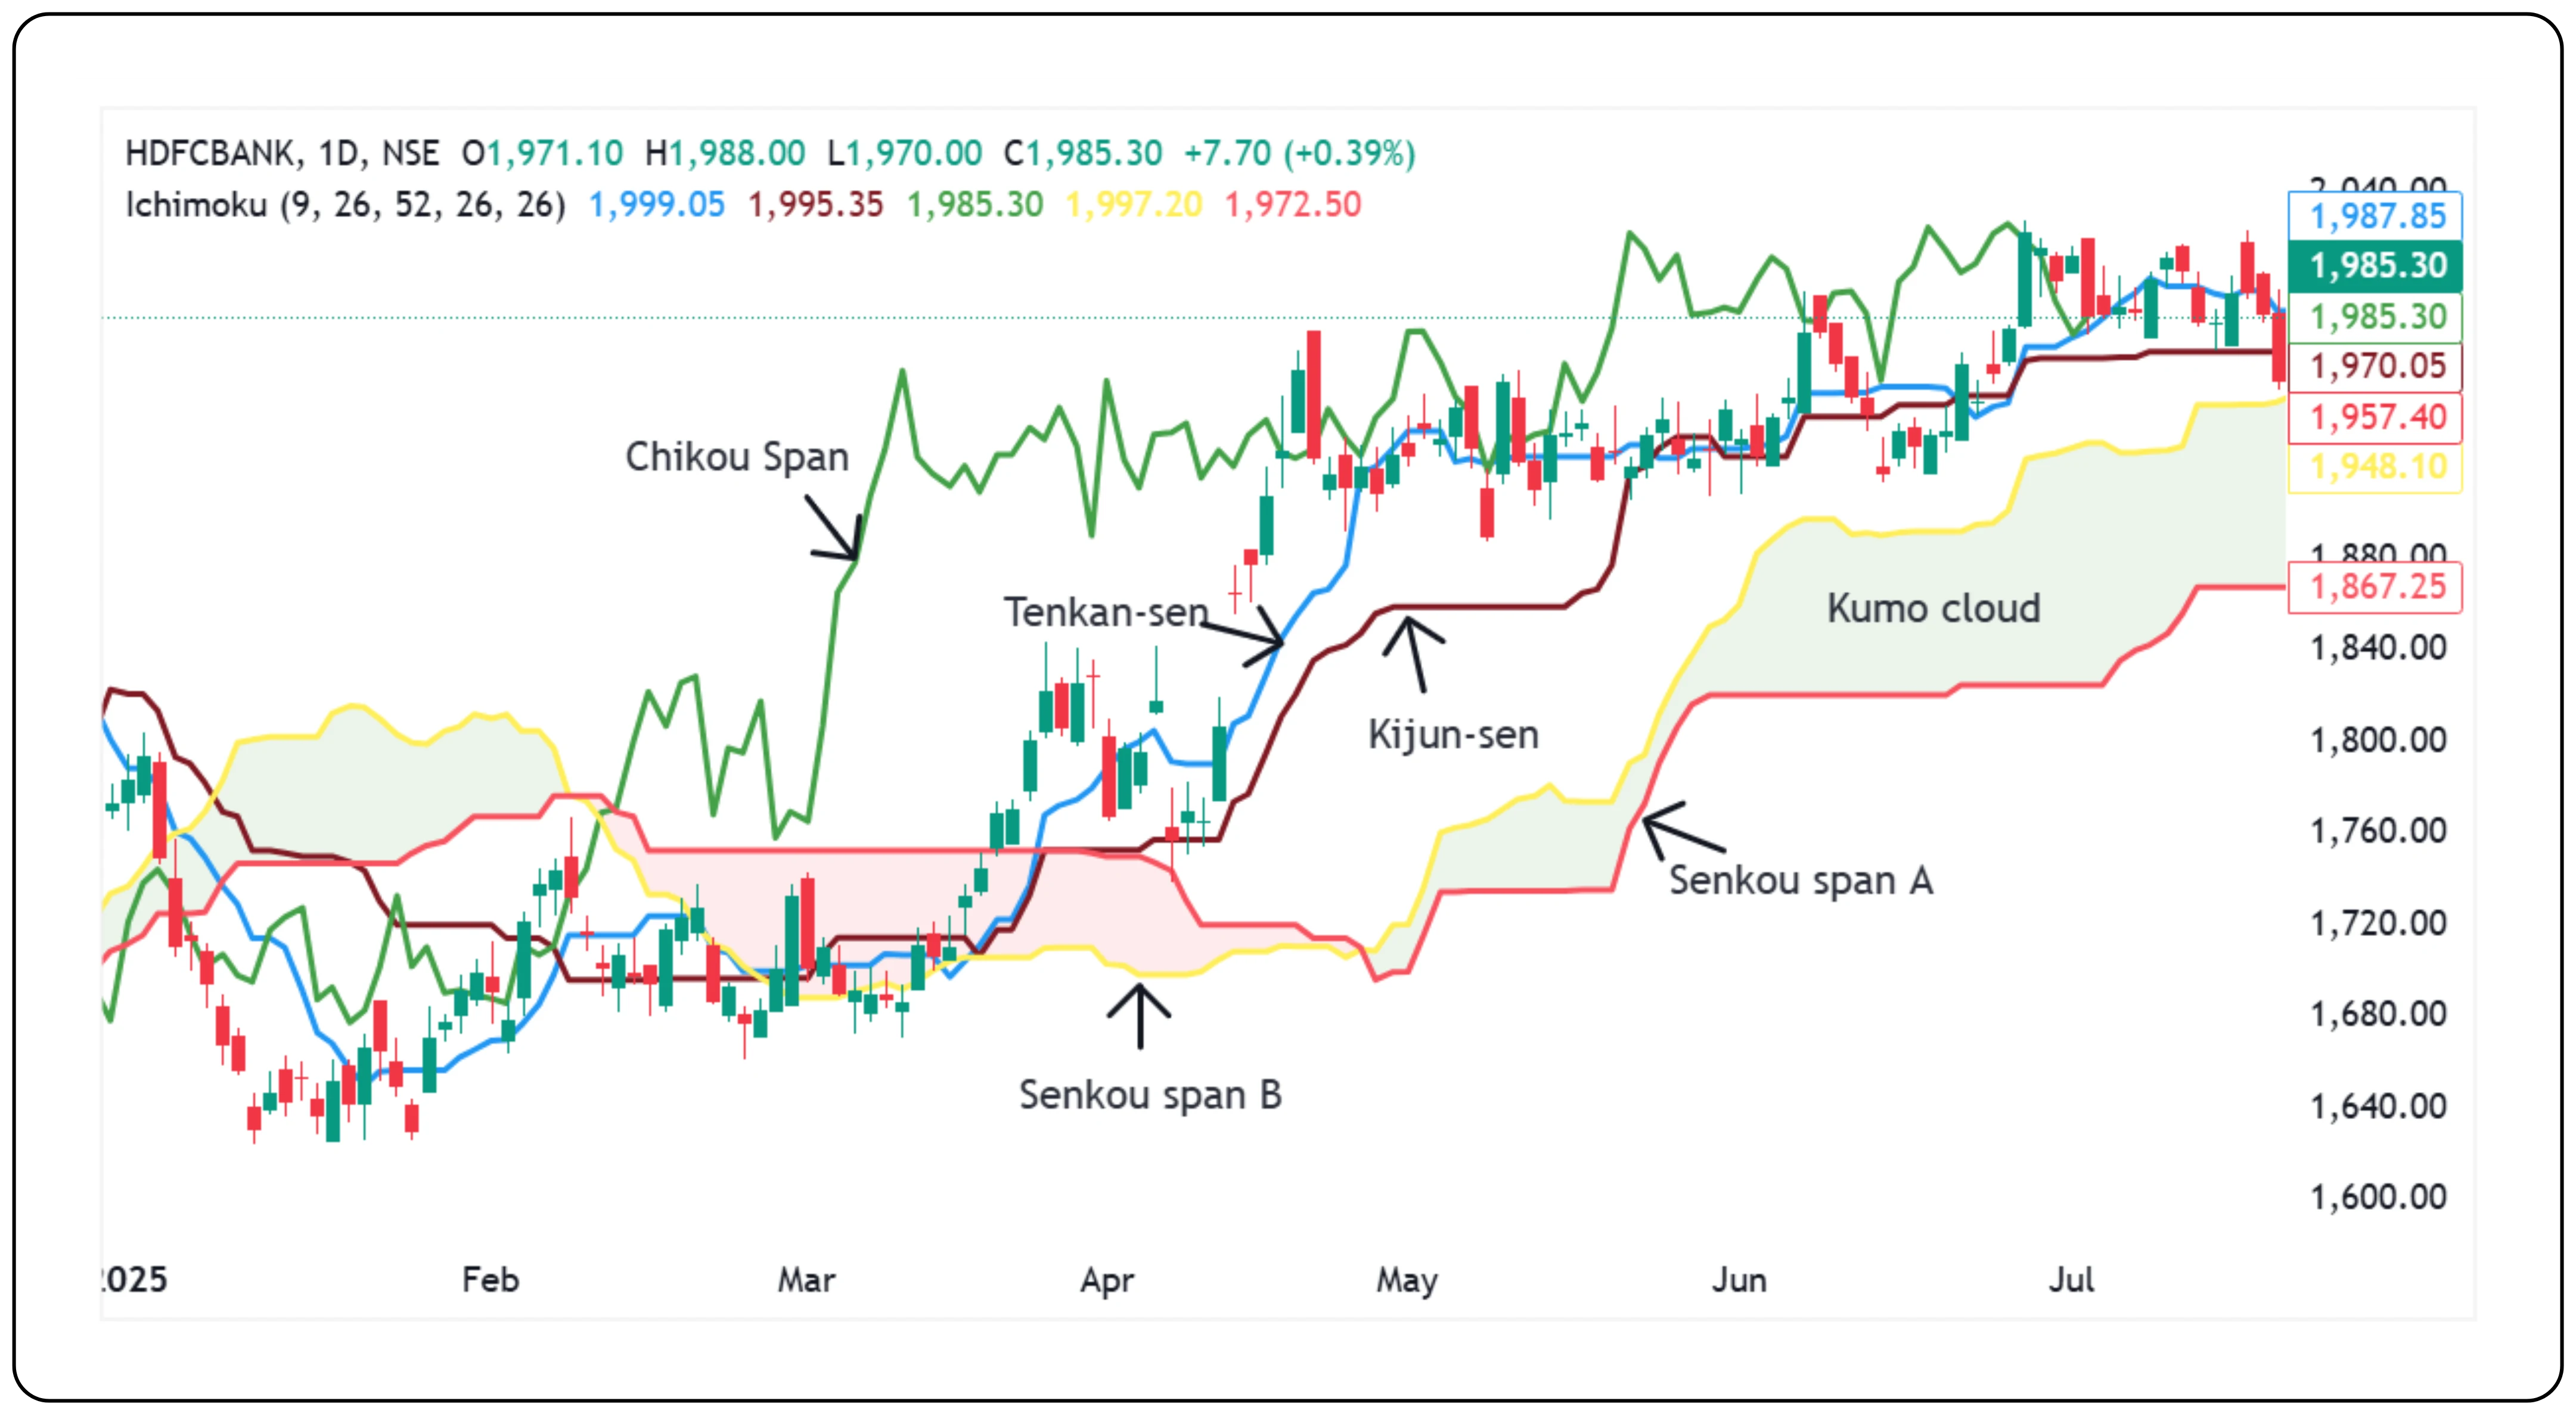
Breakdown of the Ichimoku Indicator
| Ichimoku Component | What It Represents | Field in Settings |
|---|---|---|
| Tenkan-Sen | Measures short-term price direction using the past 9 periods. Shows early trend shifts. | Conversion Line Periods |
| Kijun-Sen | Tracks medium-term trend using 26 periods. Often acts as support or resistance. | Baseline Periods |
| Senkou Span B | Look at the past 52 periods to define one edge of the cloud. Moves slower, shows trend depth. | Leading Span Periods |
| Chikou Span | Plots the closing price 26 periods back. Helps see how current price compares to the past. | Lagging Span Periods B |
| Senkou Span A (projected forward) | Forms the other edge of the cloud using Tenkan and Kijun averages. Predictive in nature. | Leading Shift Periods |
| Kumo Cloud | The shaded region reflects market bias. Highlights current and future support/resistance zones. | Not a user-set field |
Tenkan-sen (Conversion line-blue line)
The Tenkan-Sen, or conversion line, is the fastest line in the Ichimoku Cloud indicator. It uses the last 9 periods to track short-term momentum. If the price is above the Tenkan-Sen, buyers are likely in control. If it falls below, it may suggest a shift in momentum.
A sharp upward or downward move signals strength in that direction, while a flat line often indicates a pause or range-bound market.
Also read:
The First Stock I Ever Bought And What It Taught Me
Kijun-sen ( Base line -brown line)
The Kijun-Sen, or base line, is slower and steadier. It calculates its value over the last 26 periods, offering a more stable reference for overall market balance.
When the price crosses above the Kijun-Sen, it may signal growing strength. If it moves below, it can be an early warning. Price often pulls back to this line before continuing its trend, making it a useful support or resistance level.
It is calculated as:
Kijun-sen = (Highest High over the past 26 periods + Lowest Low over the past 26 periods) ÷ 2
Senkou span B (Leading Span Periods - Yellow line)
Senkou Span B is slower than Span A and uses a broader historical range. It looks at the highest high and lowest low over the past 52 periods, then projects it forward by 26 periods.
Because of this longer timeframe, it does not react quickly. But that also means it offers a reliable sense of long-term strength. When the cloud formed by Span B is thick, the trend is usually strong. A thin cloud, on the other hand, may hint at indecision.
Senkou span A ( Leading Shift B- Pink line)
Senkou Span A is the average of the Tenkan-Sen and Kijun-Sen, but what matters more is how it works. It is projected 26 periods into the future and forms one edge of the cloud. It reflects a blend of recent and medium-term trends.
If the price stays above this line, the market tone is positive. A drop below may indicate weakness or a potential reversal.
Chikou Span ( Lagging Span A Green line)
The Chikou Span gives a unique way to confirm the trend. It plots today’s price, but shifted back 26 periods. This helps compare the current price to the price action from a few weeks ago.
If the Chikou Span is above past price candles, it supports the idea of a strong uptrend. If it is below, the sellers are likely in control.
This line is especially useful in technical analysis chart setups when you want to double-check if a breakout is real or just a quick spike.
Kumo cloud
The space between Span A and Span B creates the Kumo Cloud, the shaded area you see on the chart. This is the heart of the Ichimoku Kinko Hyo Cloud.
When the price is above the cloud, the market is considered to be in an uptrend. When it is below, the trend is likely bearish. If the price is stuck inside the cloud, it usually signals sideways movement or uncertainty.
A Kumo Twist happens when Span A crosses Span B or the other way around. This can be an early clue that the trend might shift direction. If the cloud is thin during this twist, it usually means the market is still figuring itself out.
When all elements align
The Ichimoku cloud strategy becomes more powerful when everything works together:
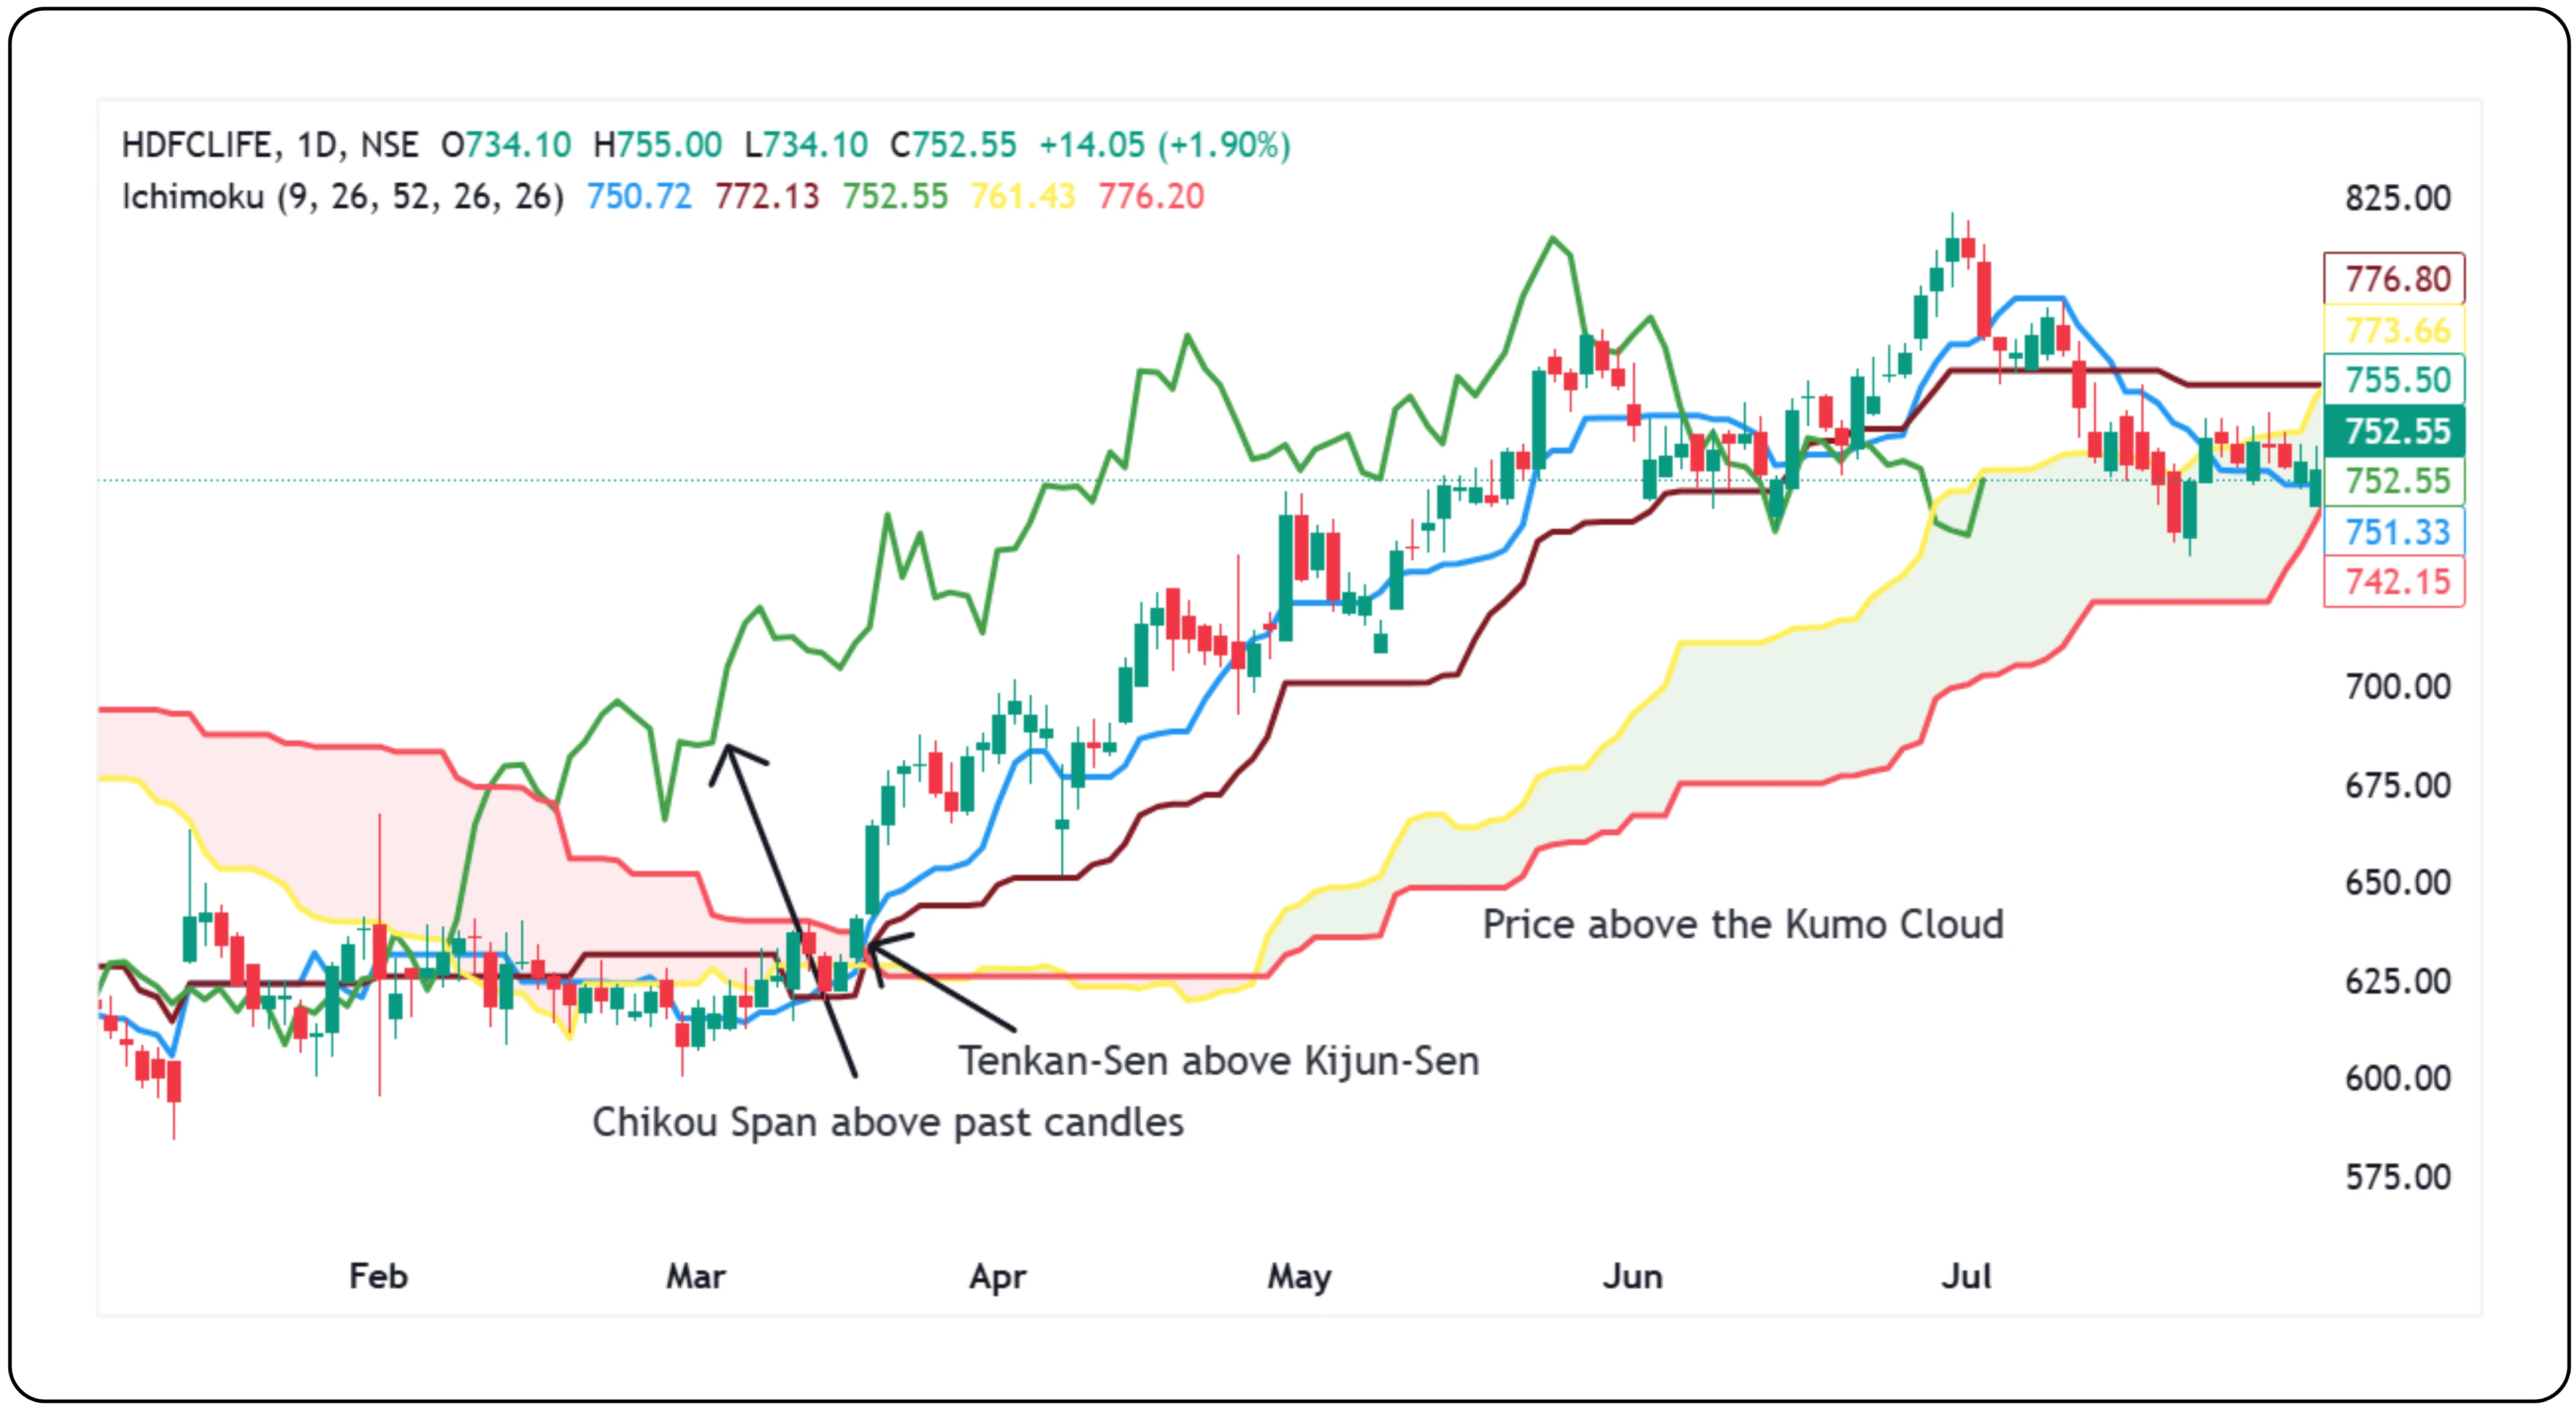
- Price above the Kumo Cloud
- Tenkan-Sen above Kijun-Sen
- Chikou Span (Lagging Line) is above the price candles
This setup often signals a strong uptrend. In the opposite case, when price is below the cloud and the fast lines are below the slow ones, you might be looking at a sustained downtrend.
This kind of alignment gives you clarity and confidence during technical chart analysis.
Example: On 20 March 2025, HDFC Life triggered a bullish Ichimoku signal — price moved above the Kumo Cloud, Tenkan-Sen crossed above Kijun-Sen, and Chikou Span rose above past candles. This confirmed strong upward momentum and a likely continuation of the trend.
How to avoid false signals
Like any indicator, the Ichimoku cloud indicator can give mixed signals, especially during sideways markets. Here is how to stay cautious:
| Checkpoint | What to Watch |
|---|---|
| Momentum | Price should clearly break away from the cloud, not just hover near it |
| Line Direction | Tenkan-Sen should stay above Kijun-Sen in bullish setups and below it in bearish setups |
| Timeframe Harmony | Confirm the signal on higher timeframes too. A daily signal that matches the hourly chart is stronger |
Adding other tools like basic trendlines, volume, or support-resistance levels can help confirm what the Ichimoku cloud indicator is showing.
Example: On INFY’s chart, a bullish signal appeared as price broke above the cloud with Tenkan-Sen crossing Kijun-Sen. However, the move failed due to low volume and resistance near previous highs showing the importance of confirmation.
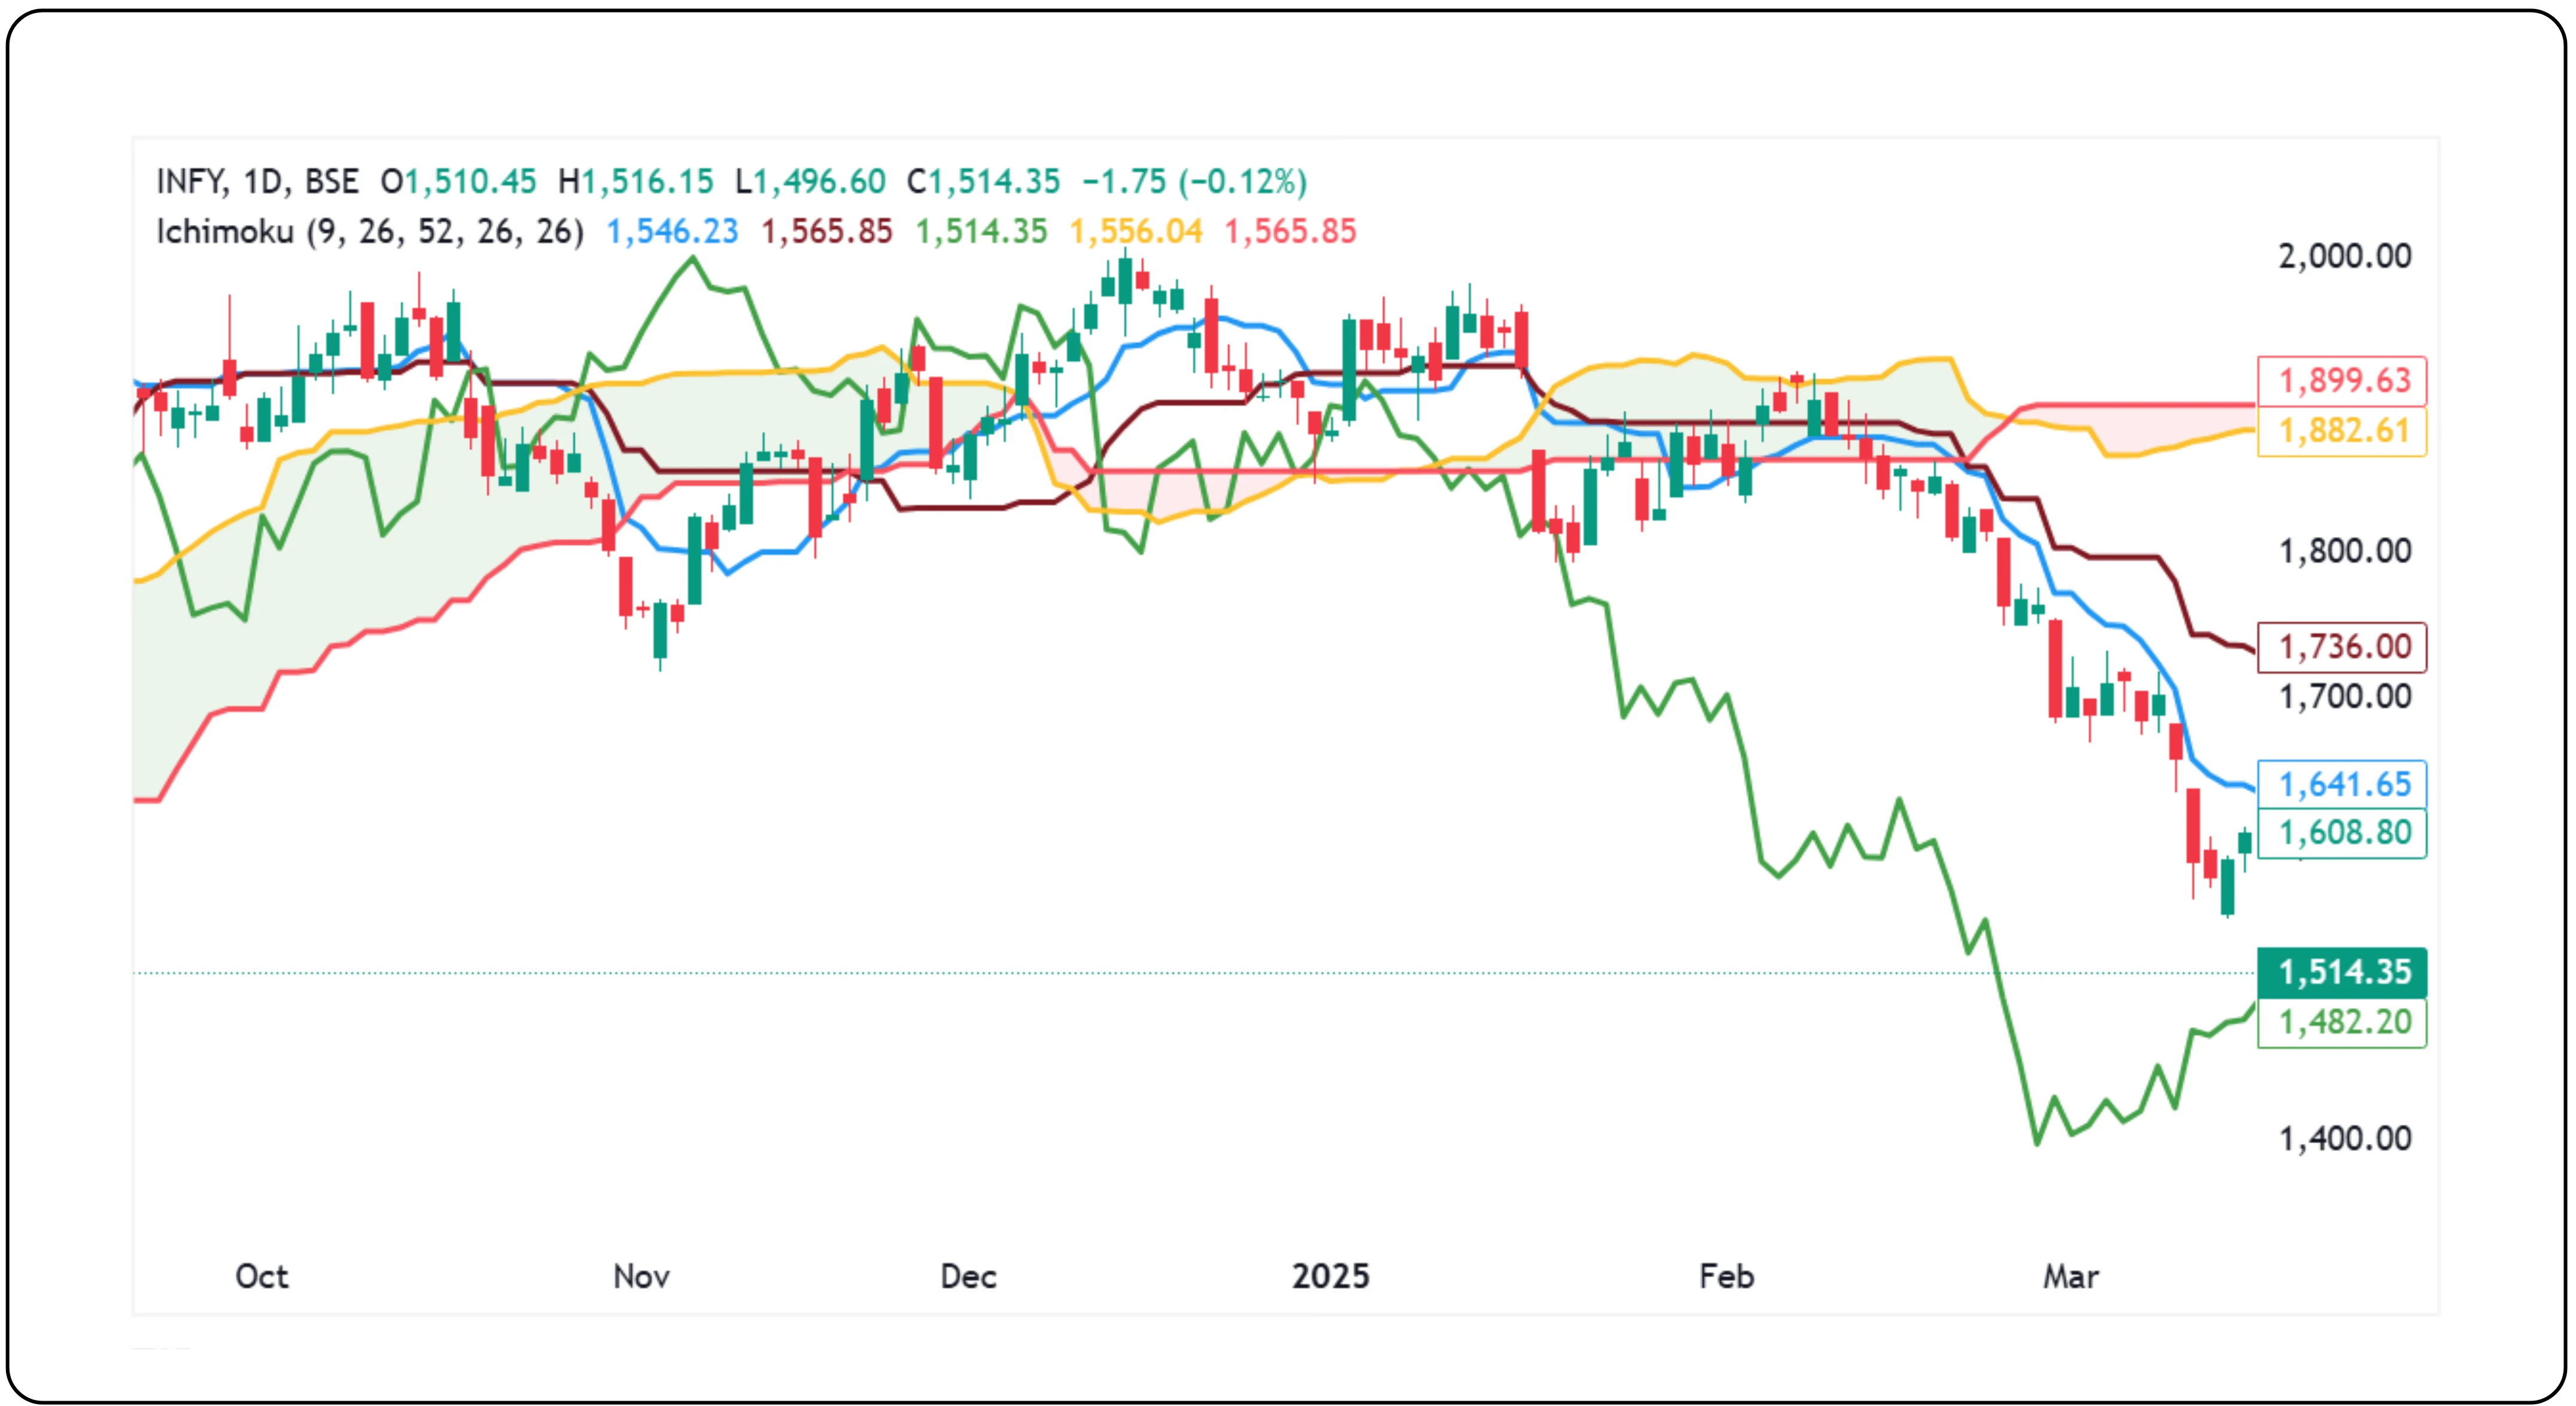
Chart speaks a perfect entry? Track the move ahead
NIFTY 50 as on 06th August 2025 breaks below the cloud and also slipped below a critical level watch the price reaction.
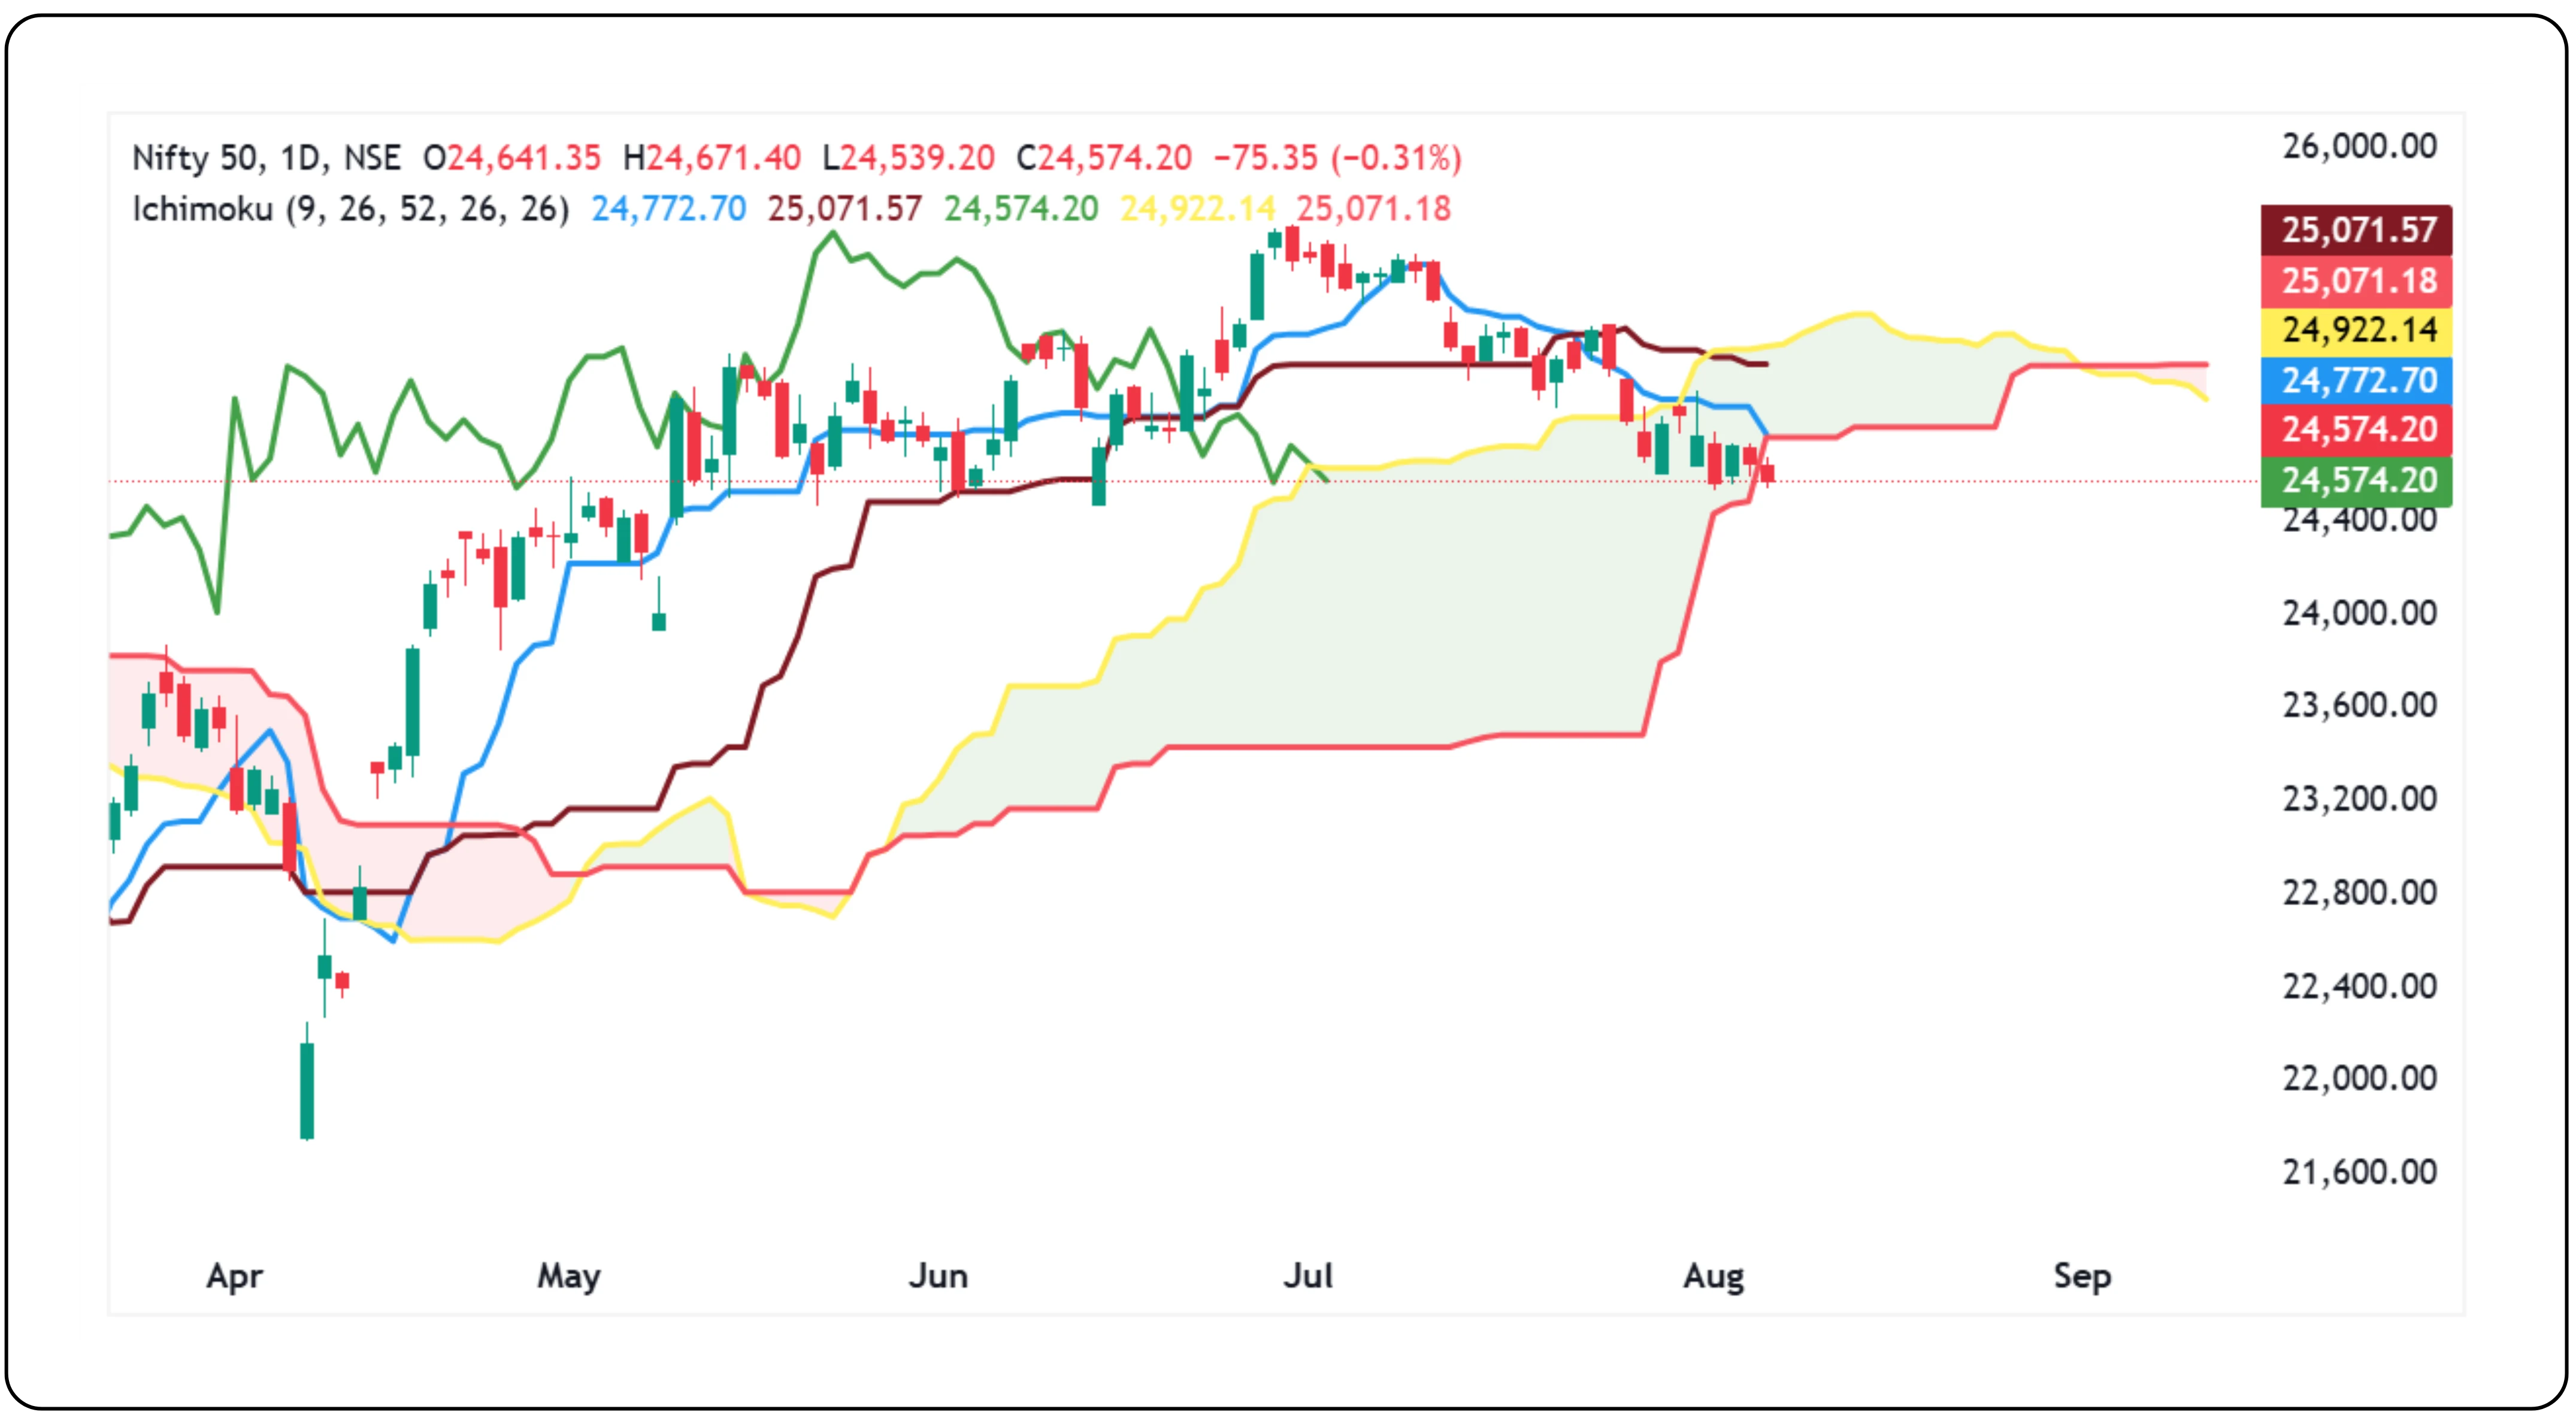
- Price has broken below the Ichimoku Cloud
Confirmed trend weakness. The cloud acted as last support and now flipped to resistance. - Chikou Span is below price candles
Confirms bearish momentum. Current price is lower than it was 26 days ago. - Kijun-sen (Base Line) has flattened
Signals loss of trend strength. Price failing to stay above it adds to the bearish case. - Future Kumo is narrow and red
Limited bullish cushion. Momentum favors sellers. - Key Level: 24,569
If this breakdown sustains below 24,500, we could see a quick slide toward the 24,000 zone. Ichimoku doesn't predict but it reveals. And right now, it's revealing weakness.
Also read:
Bearish and Bullish Setups in Head and Shoulders
Seeing the market clearly with Ichimoku cloud strategy
The Ichimoku Cloud strategy gives you more than just entry or exit points. It gives you structure. It shows you where the market stands, what has happened, and what may lie ahead. That is what makes it such a powerful part of technical analysis.
For beginners, start by watching how price reacts to the cloud. Over time, you’ll move from memorising rules to reading market sentiment naturally. Used with patience and clarity, it can become one of the most insightful tools in your trading journey.
Disclaimer: The information provided in our blogs is for informational purposes only and should not be construed as financial, investment, or trading advice. Trading and investing in the securities market carries risk. Always conduct your own research and consult with a qualified financial advisor before making any investment decisions. Past performance is not indicative of future results. Copyrighted and original content for your trading and investing needs.
© 2025 — Tradejini. All Rights Reserved.