


Every options trader has a moment where a strategy looks perfect on paper but behaves very differently once real market volatility enters the picture. The NxtOption Simulator was built for exactly that gap. It lets you walk a strategy through actual historical price action, minute by minute, to see how your P&L, Greeks, and payoff profile respond before a single rupee is committed to the market.
NxtOption is a product of Tradejini, and the simulator is part of a broader suite of options trading tools India traders can access directly through the platform. As an options simulation platform built specifically for Indian markets, it covers Nifty, BankNifty, Sensex, and a wide range of individual stocks. For anyone exploring options trading in India, the simulator provides a structured, data-backed environment that closely mirrors live market conditions without any financial exposure.
For options trading beginners in India, the simulator is particularly valuable because it removes the need to open a live position just to understand how a strategy behaves. Learning how to practice options trading in India no longer requires paper trades kept manually in a spreadsheet; the simulator automates the process and replays real price data so the feedback is grounded in market reality.
1 Getting Started
The Simulator Dashboard
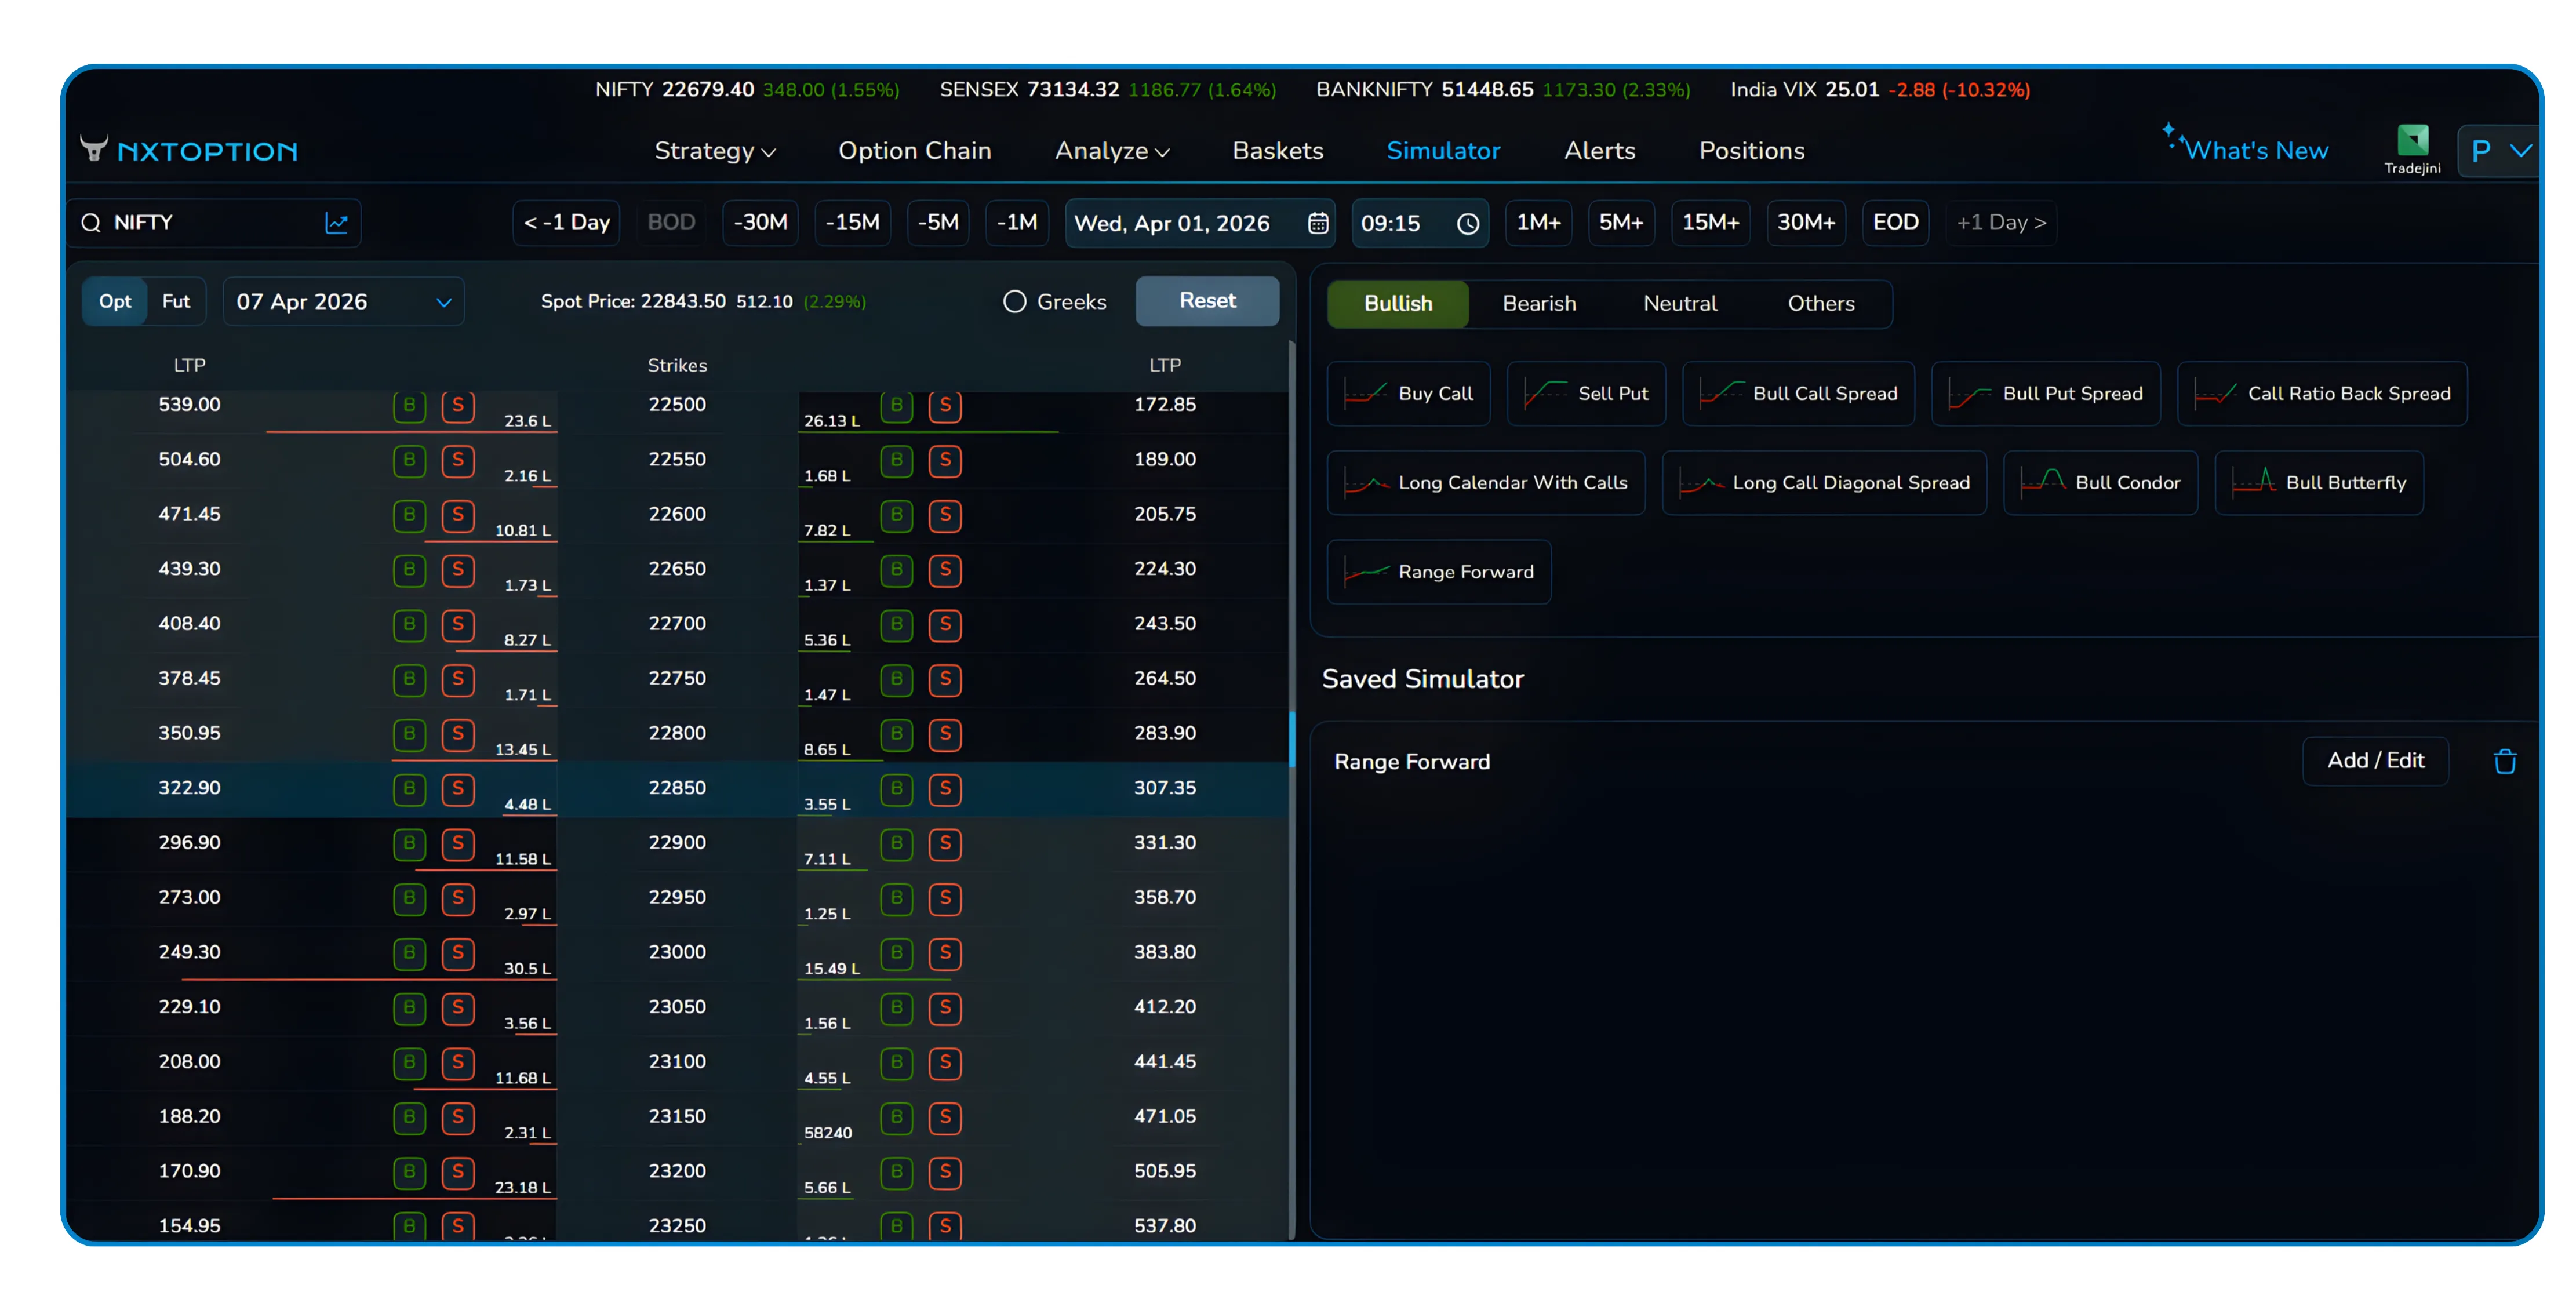
When you land on the Simulator from the NxtOption navigation bar, you are greeted with a full option chain for Nifty by default. The dashboard is designed to feel familiar to anyone who works with an option chain regularly, which means there is no separate learning curve for the interface itself.
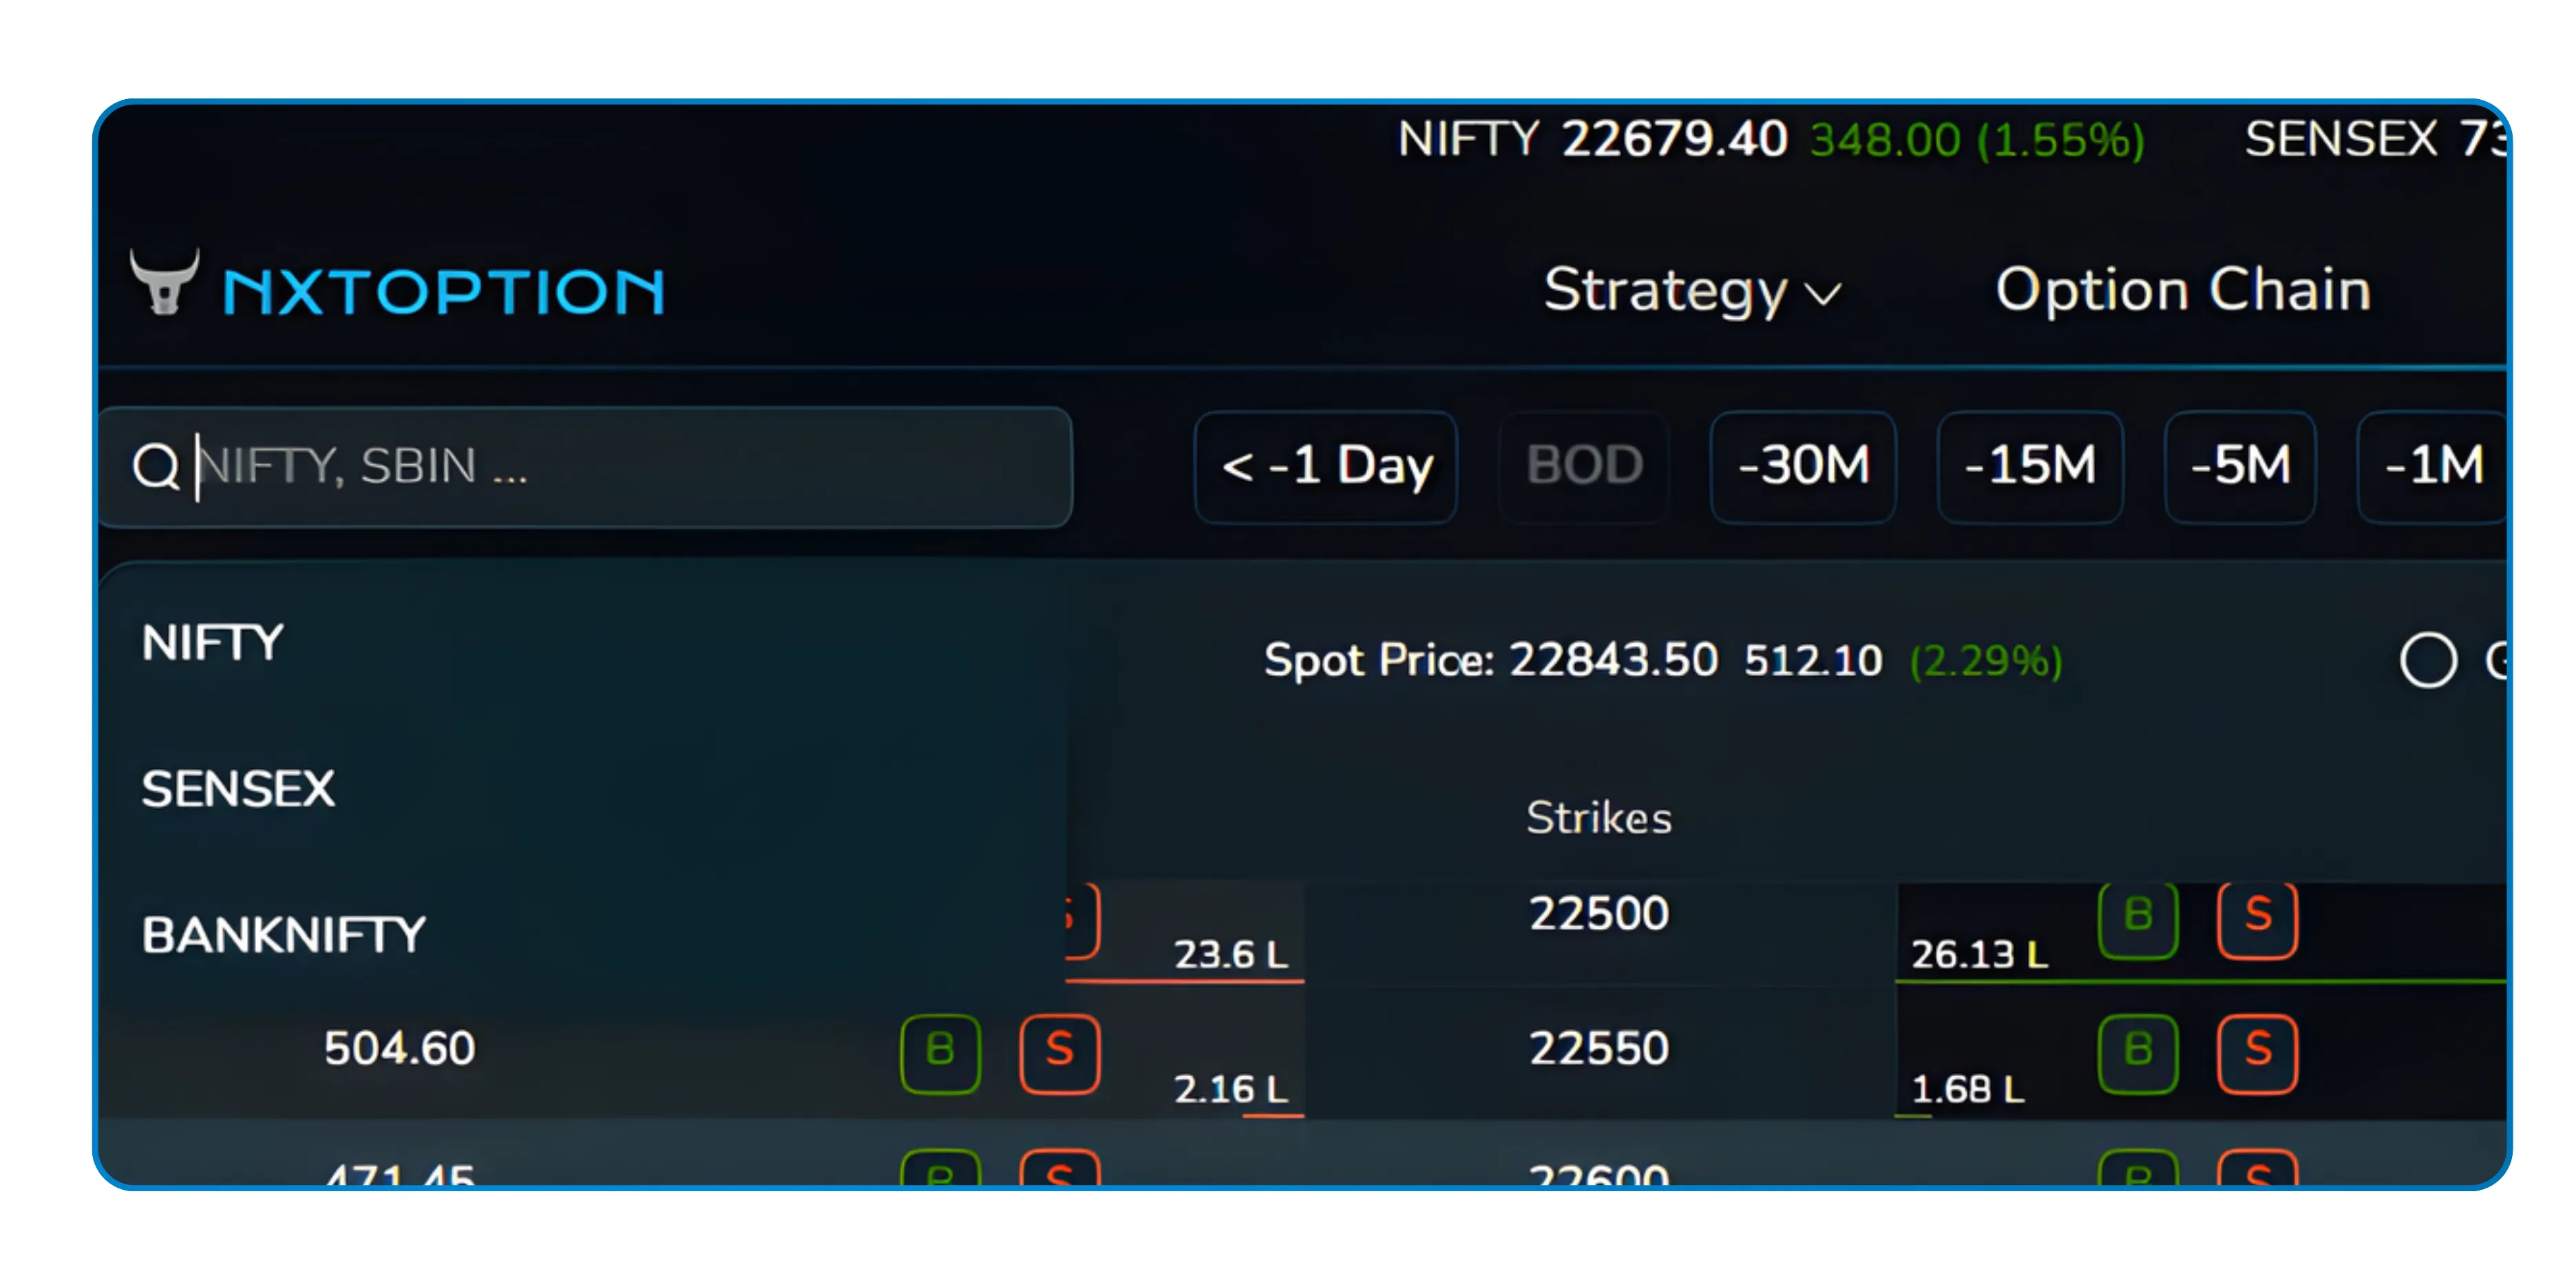
The search bar at the top left lets you switch from Nifty to any other index or stock you want to simulate. Whether you are testing a strategy on BankNifty, Sensex, or a specific large-cap equity, the same workflow applies universally.
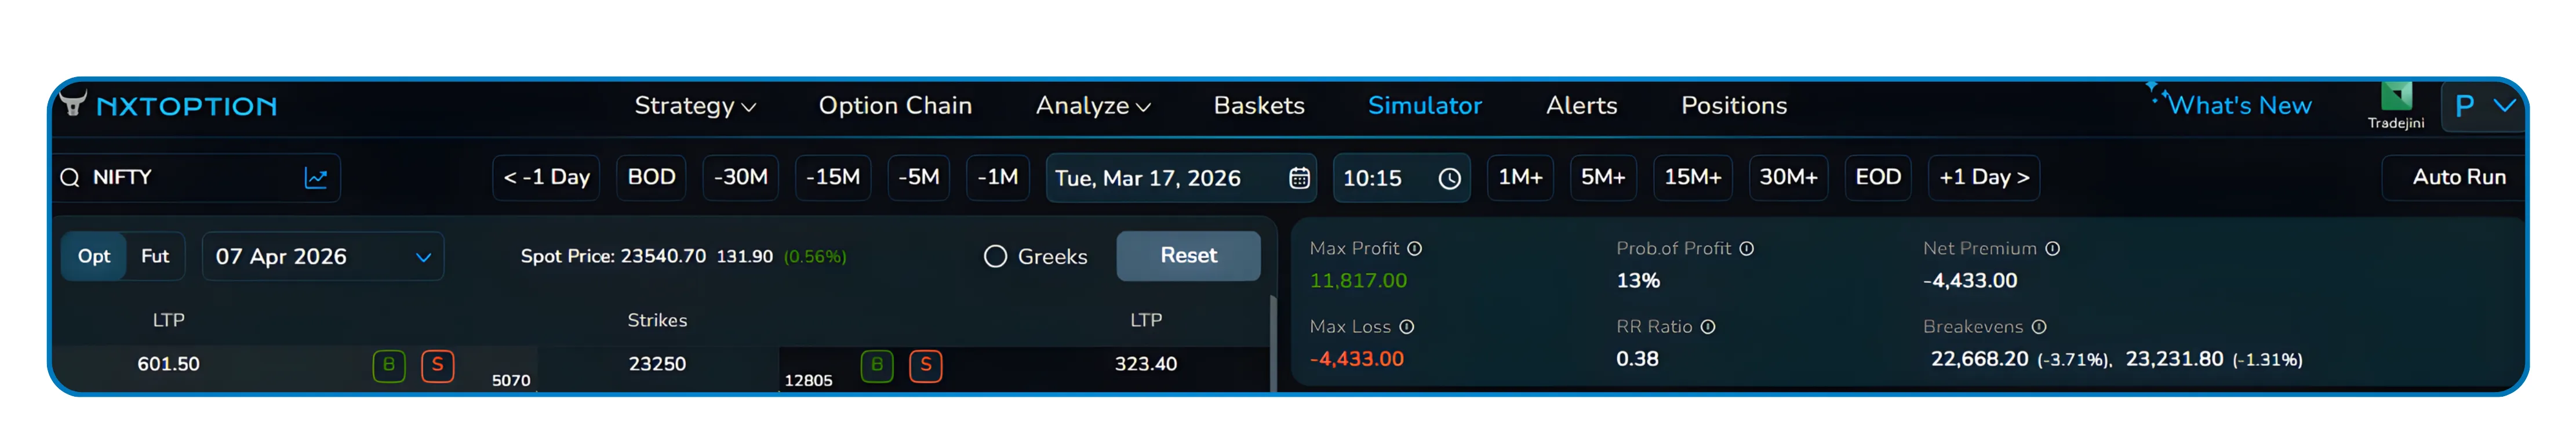
The Simulator is accessible directly from the main navigation bar under the "Simulator" tab, sitting alongside Strategy, Option Chain, Analyze, Baskets, Alerts, and Positions.
The option chain displayed mirrors what you would see in live trading, showing LTP values, strike prices, and Buy/Sell action buttons on both the call and put sides. The header also surfaces live index values for Nifty, Sensex, BankNifty, and India VIX, so you always know the macro context of the period you are simulating.
2 Navigation Controls
Moving Through Time
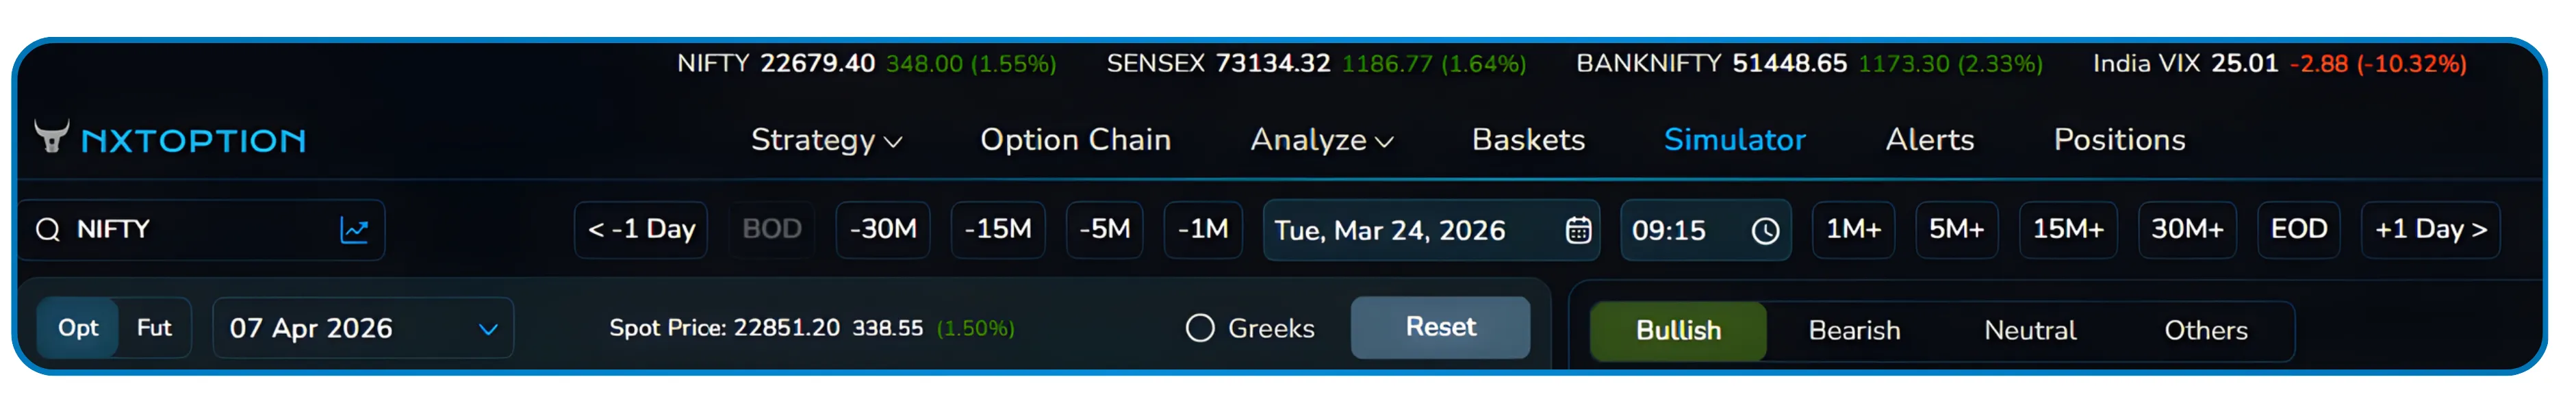
At the top of the option chain, a row of time navigation controls gives you precise control over when in history you are looking. This is one of the most practical aspects of the Simulator: you are not just loading a static snapshot. You can move through the market frame by frame.
Go Back
-1M, -5M, -15M, -30M, -1 Day
Move Forward
+1M, +5M, +15M, +30M, +1 Day
Jump to Start
BOD (Beginning of Day)
Jump to End
EOD (End of Day)
Clicking the minus buttons steps the market backward in 1-minute, 5-minute, or larger increments depending on your choice. The plus variants move forward by the same intervals. If you want to jump directly to the open or close of a session, the BOD and EOD shortcuts take you there instantly.
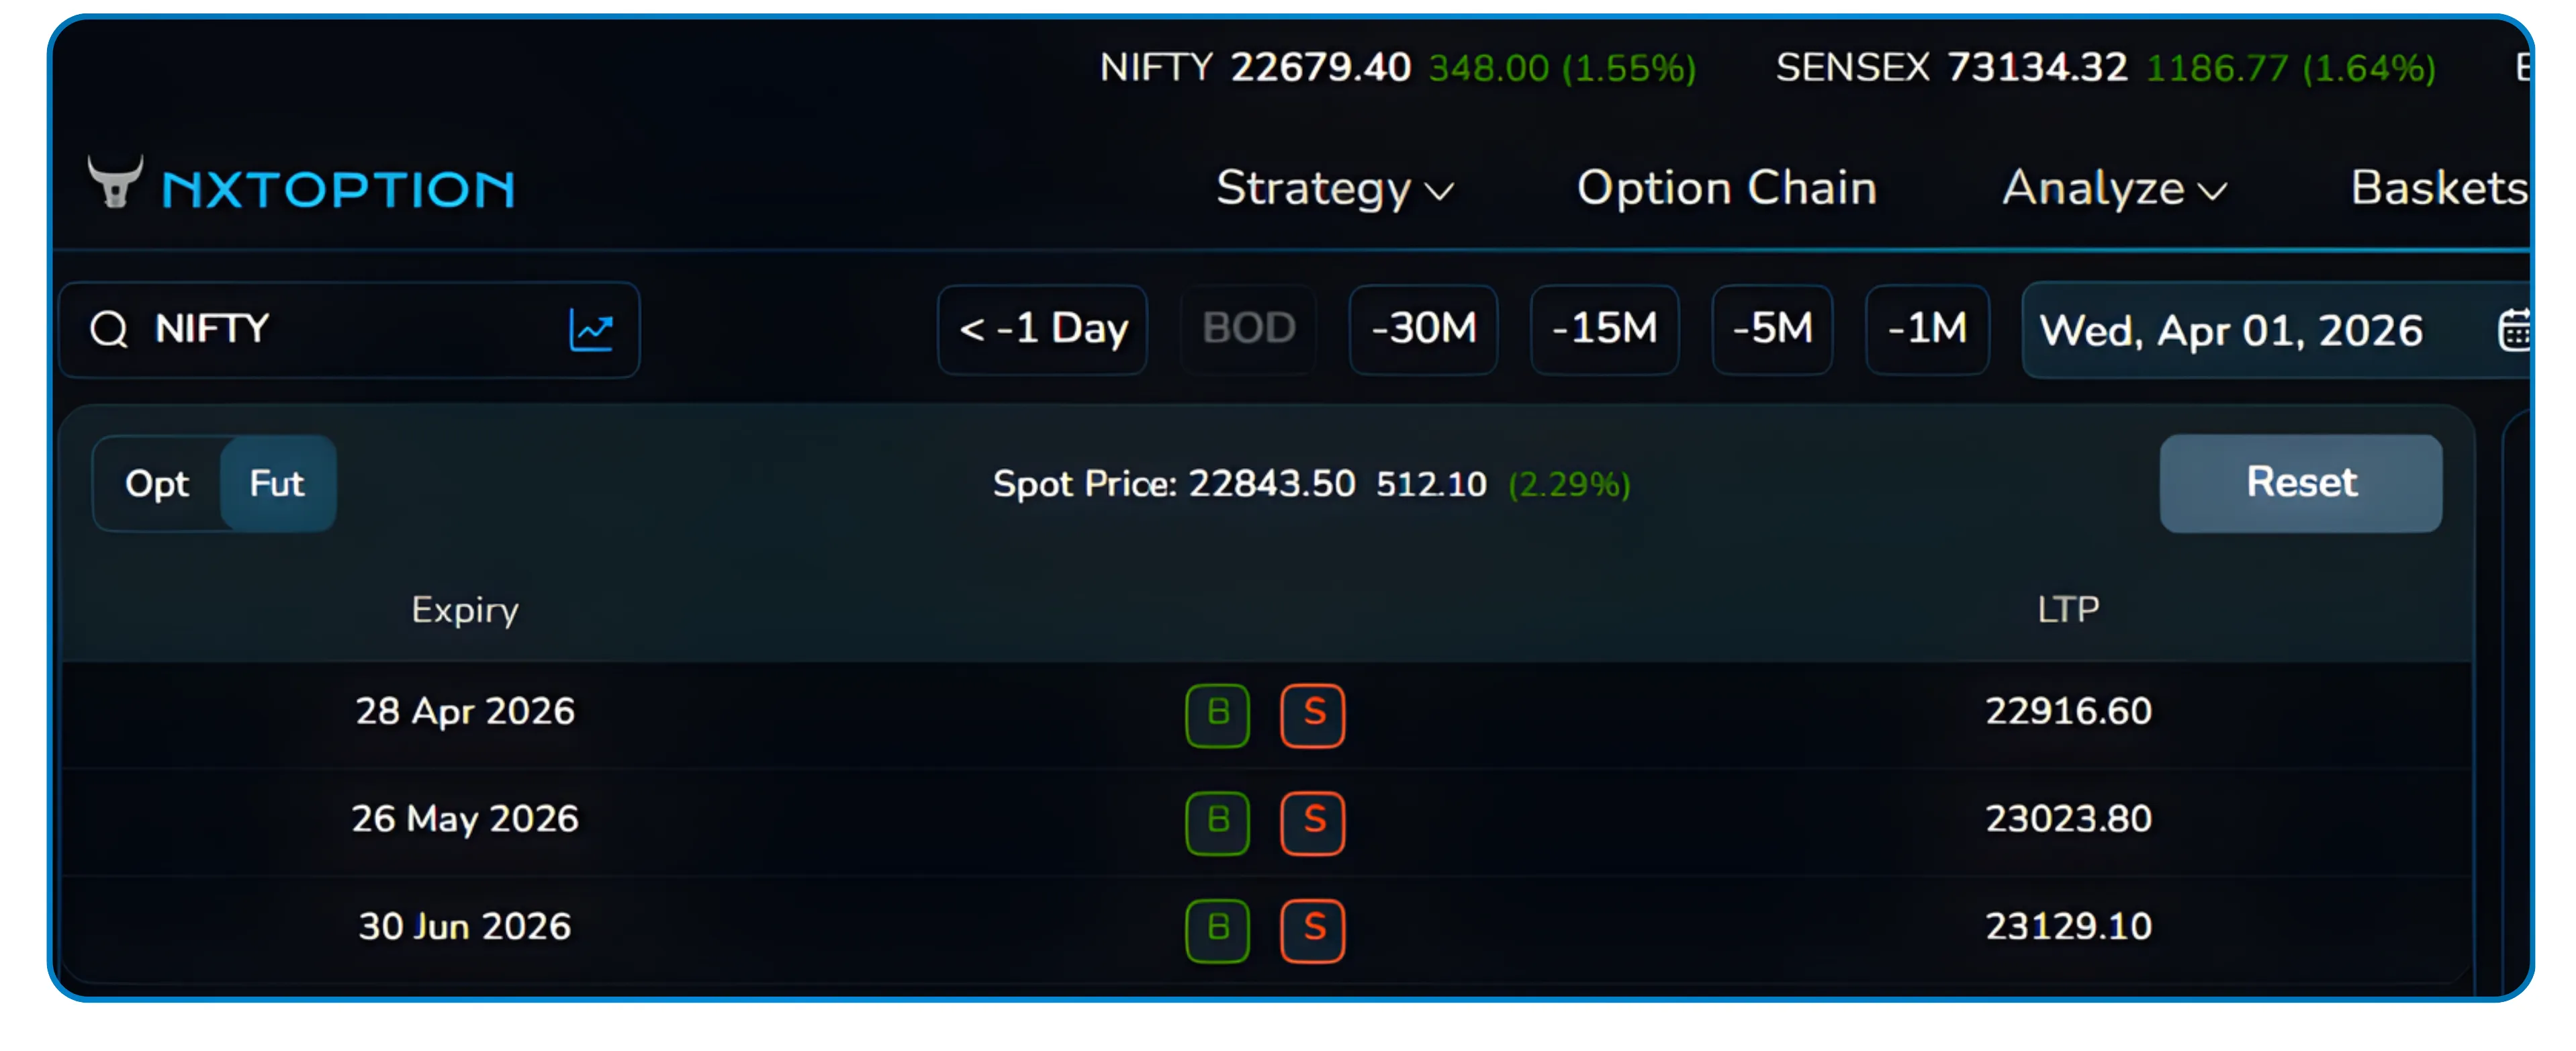
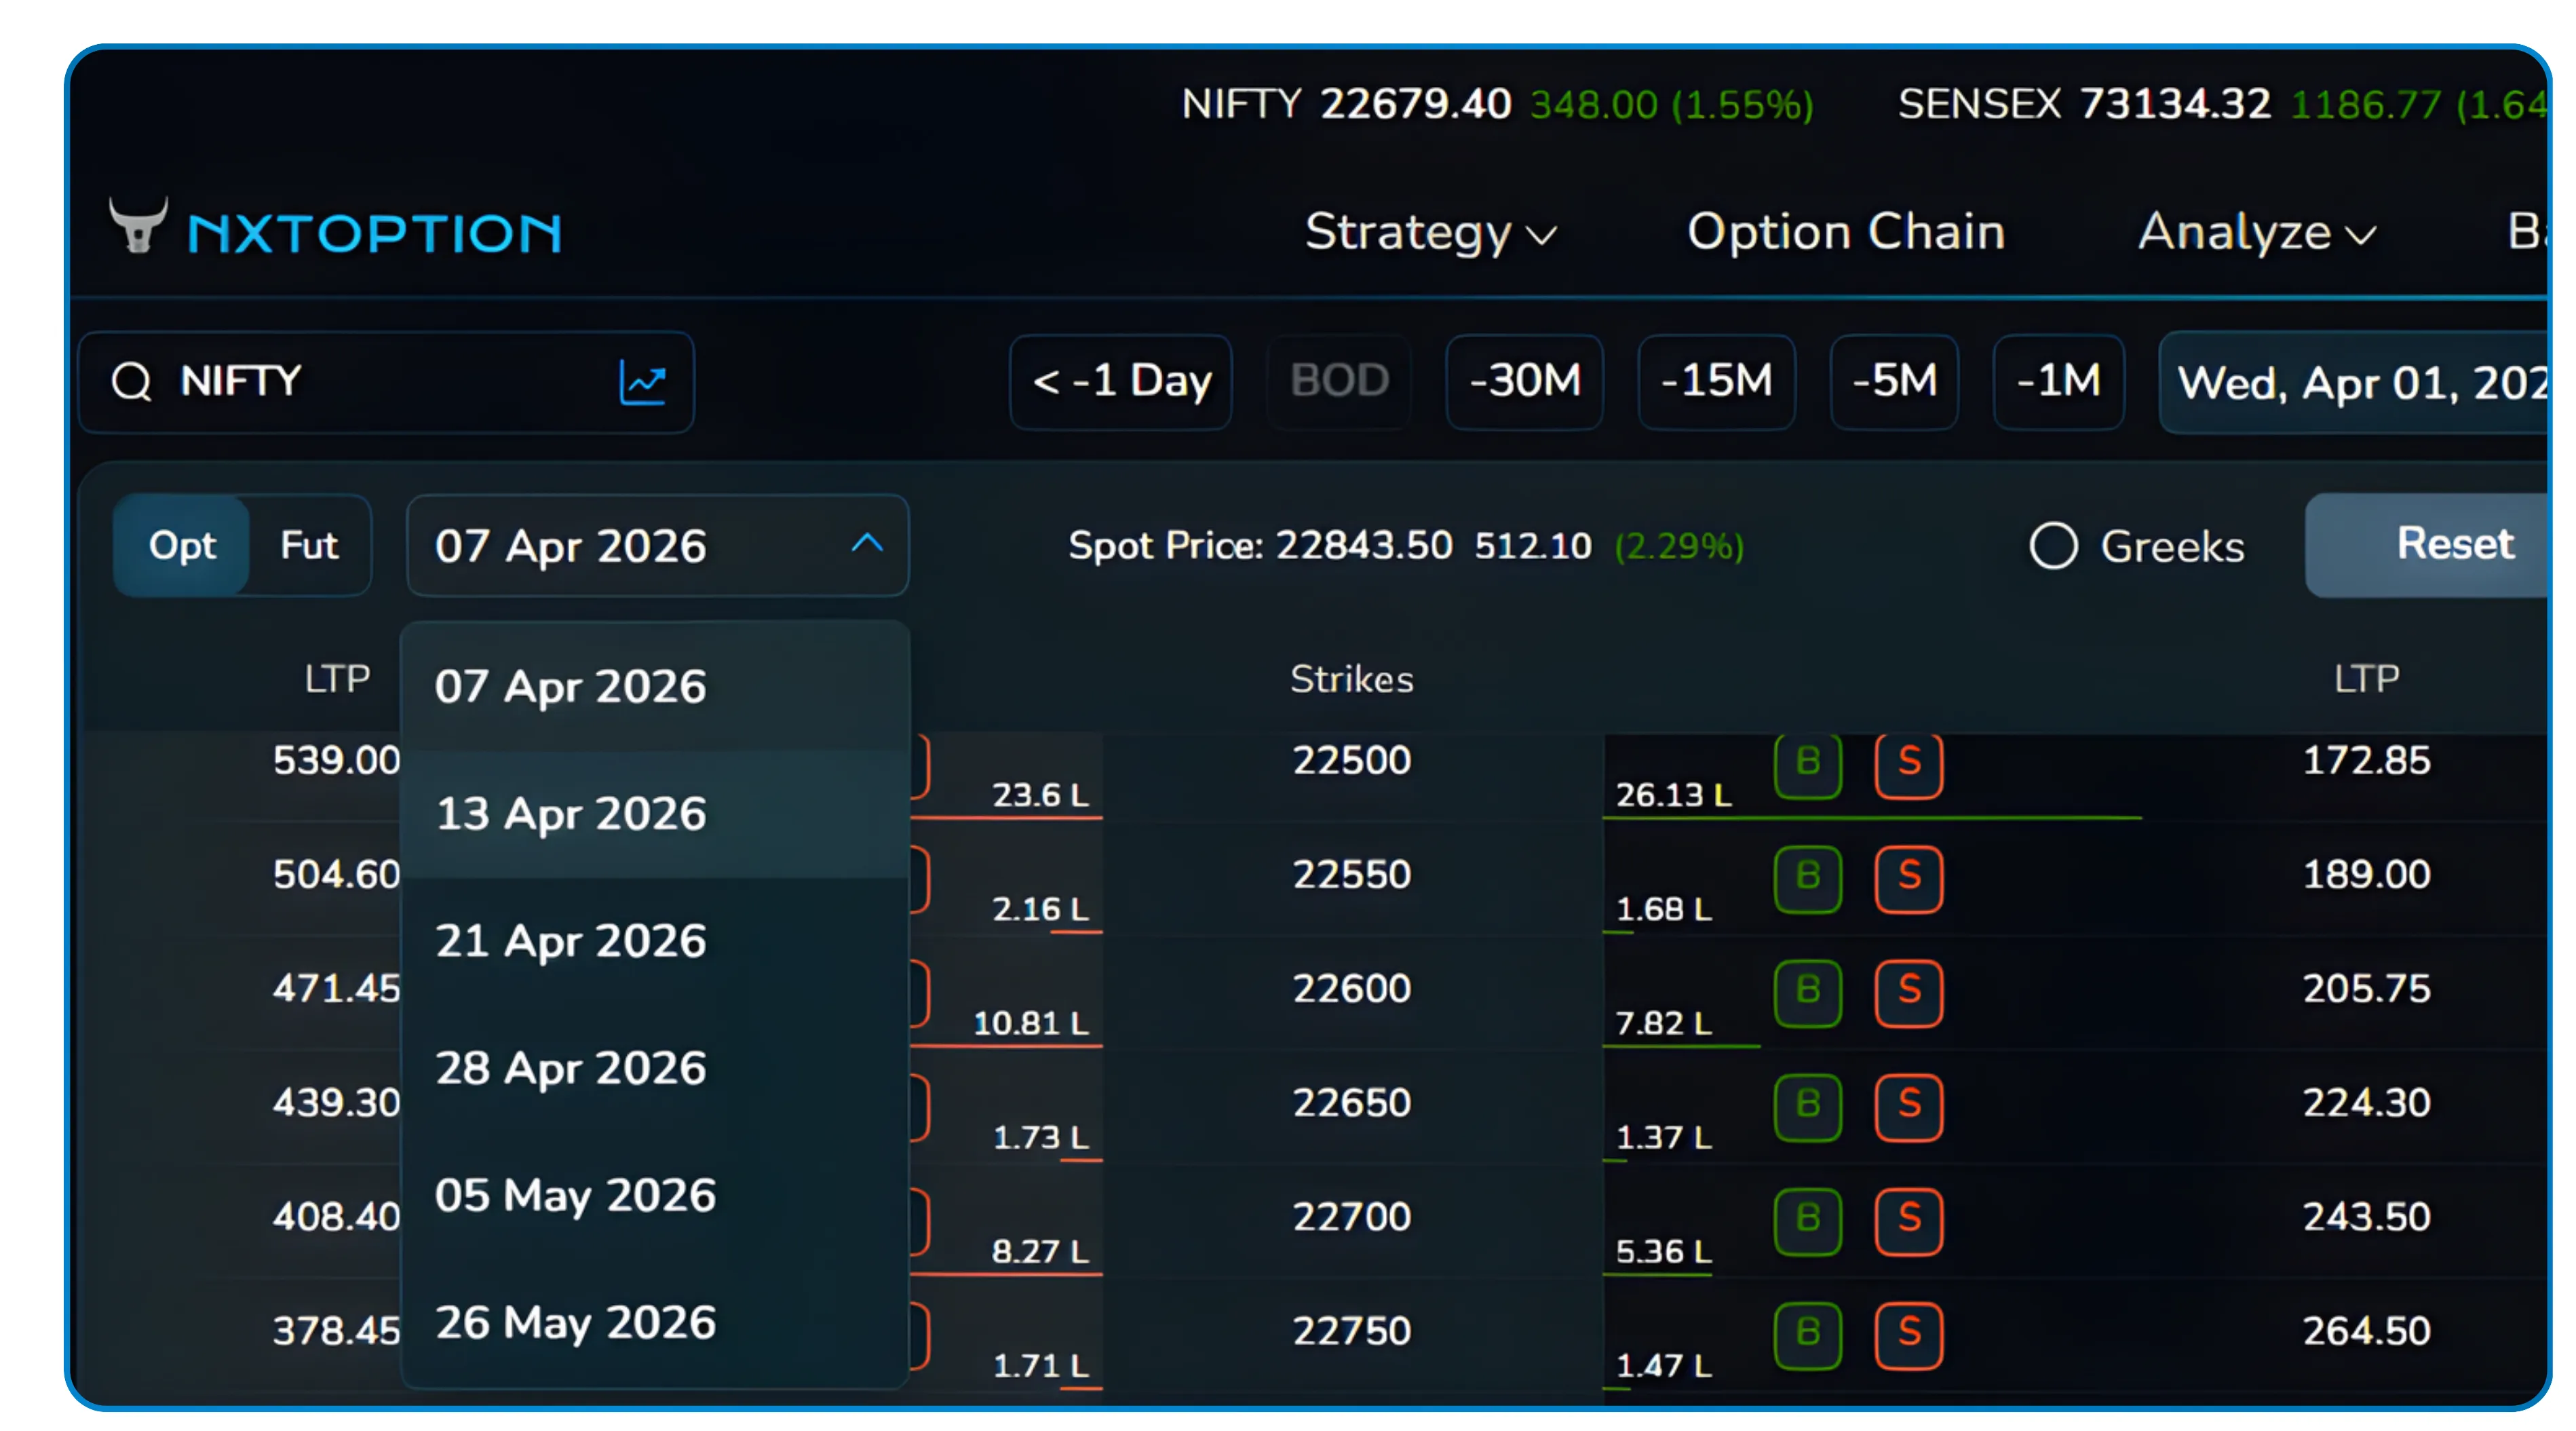
You can also switch the option chain view between Opt (options) and Fut (futures), allowing you to include or examine futures contracts as part of the same simulation session. The expiry dropdown lets you toggle between weekly, monthly, and further-dated contracts in one click.
3 Date and Time Setup
Choosing Where to Begin
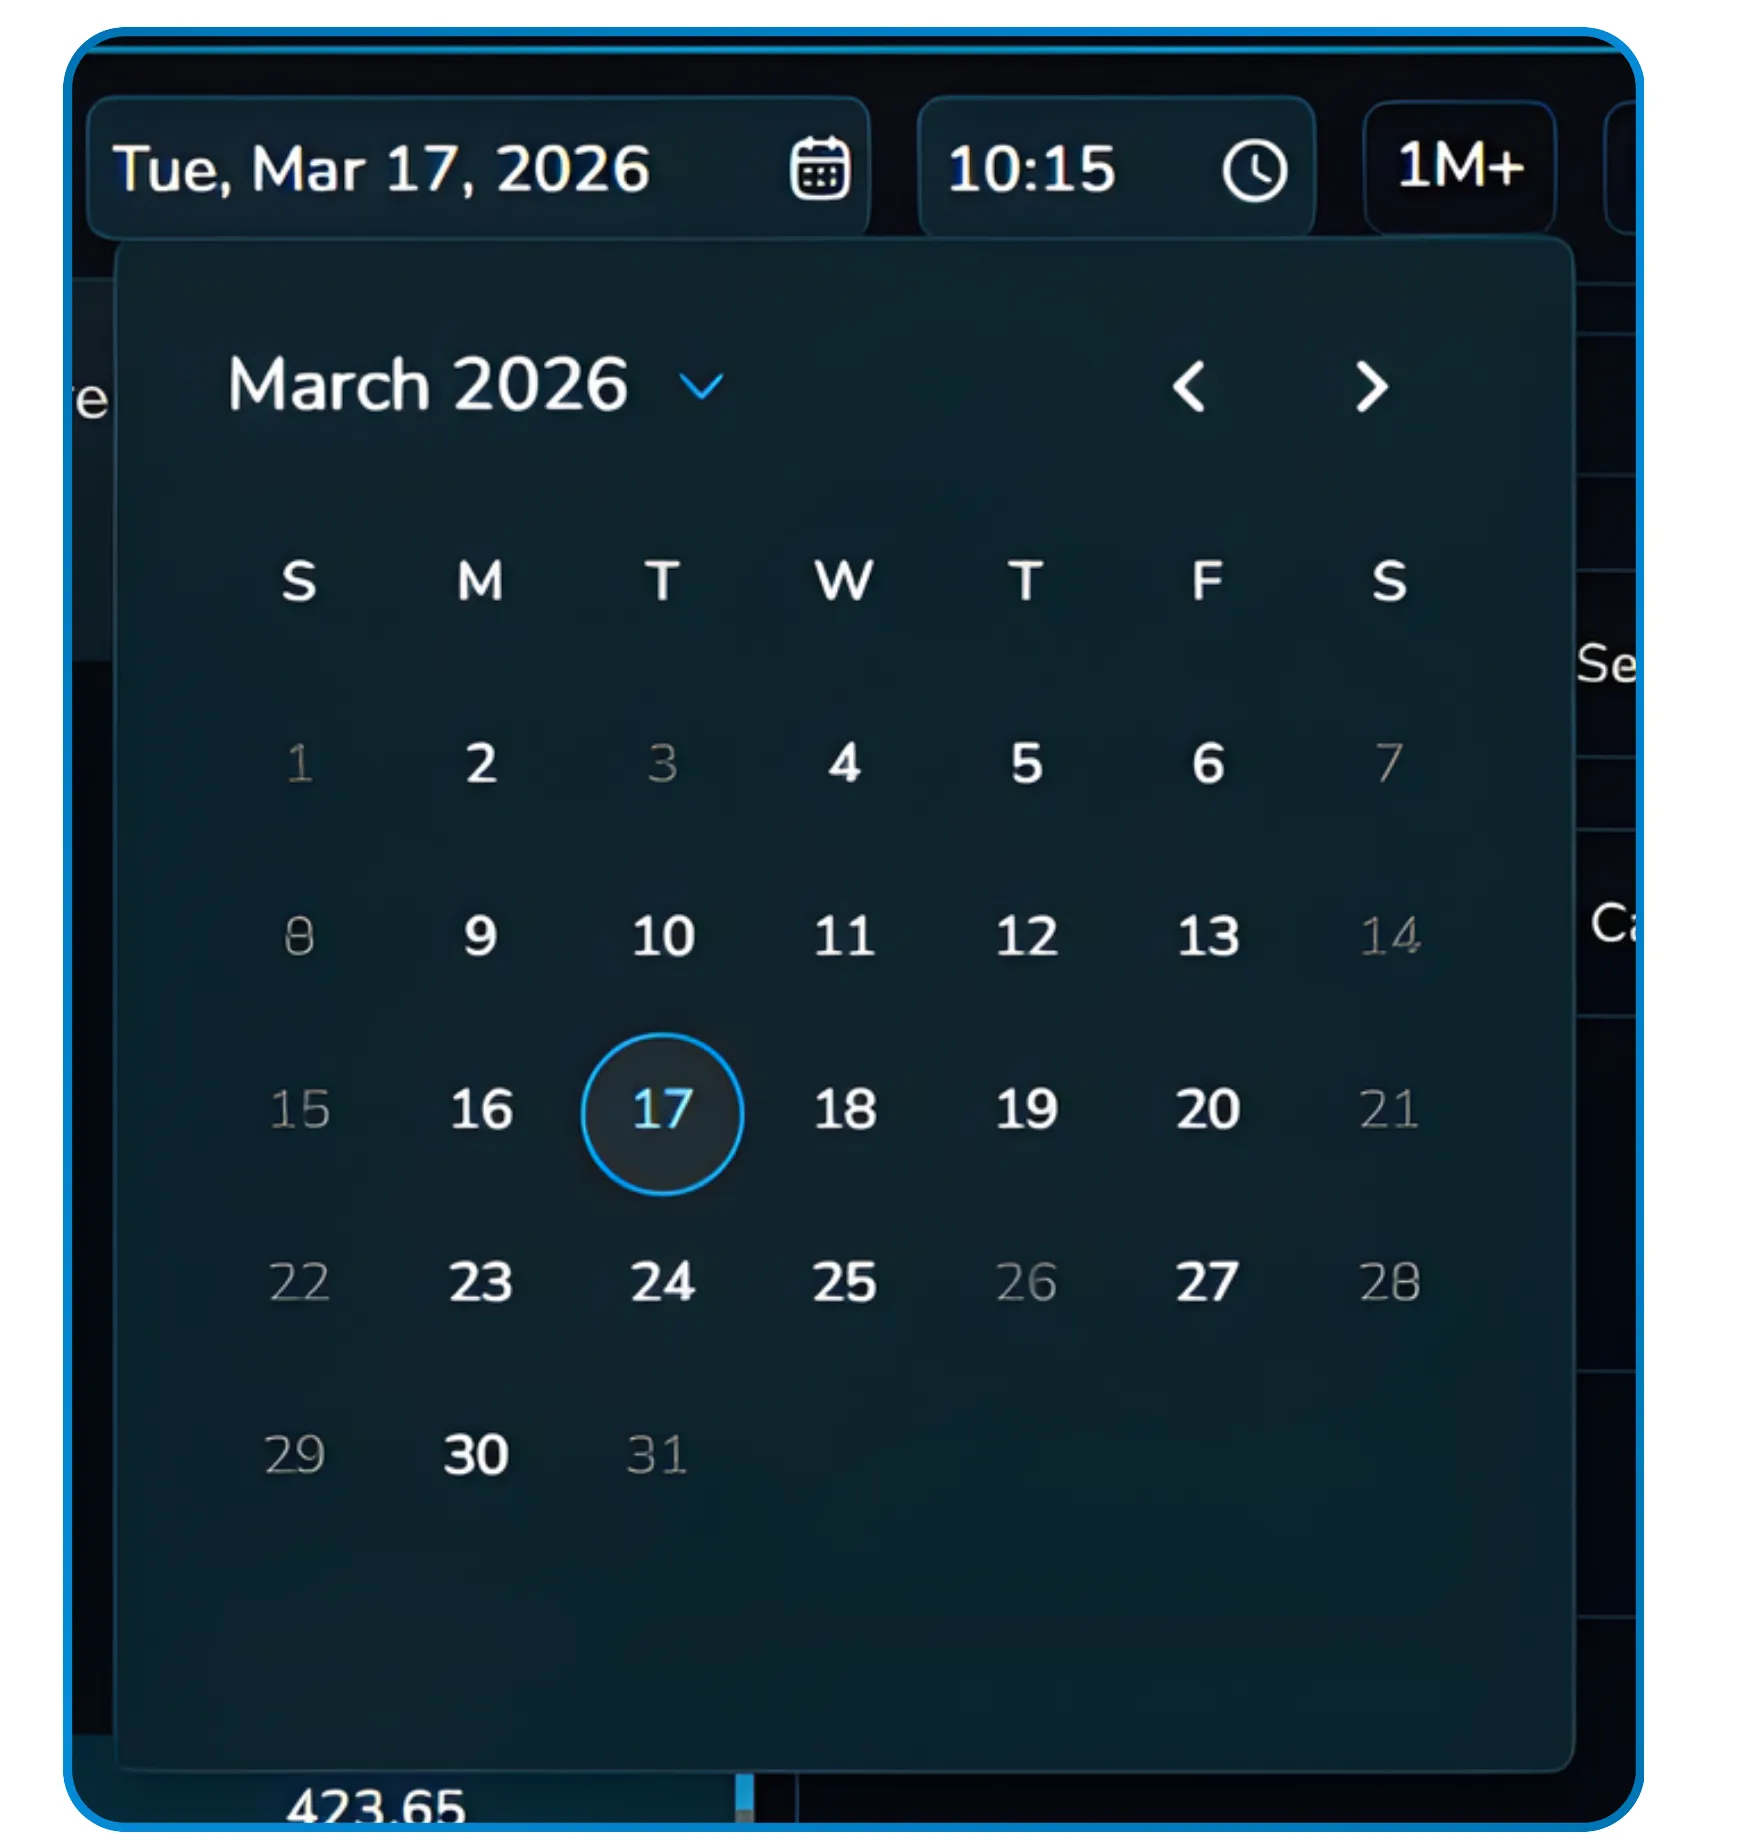
Before you build or load a strategy, you set the exact historical starting point for your simulation. A calendar picker lets you navigate to any past date and select it as the entry point. The image below shows the calendar opened to March 2026, with the 17th selected as the starting date.
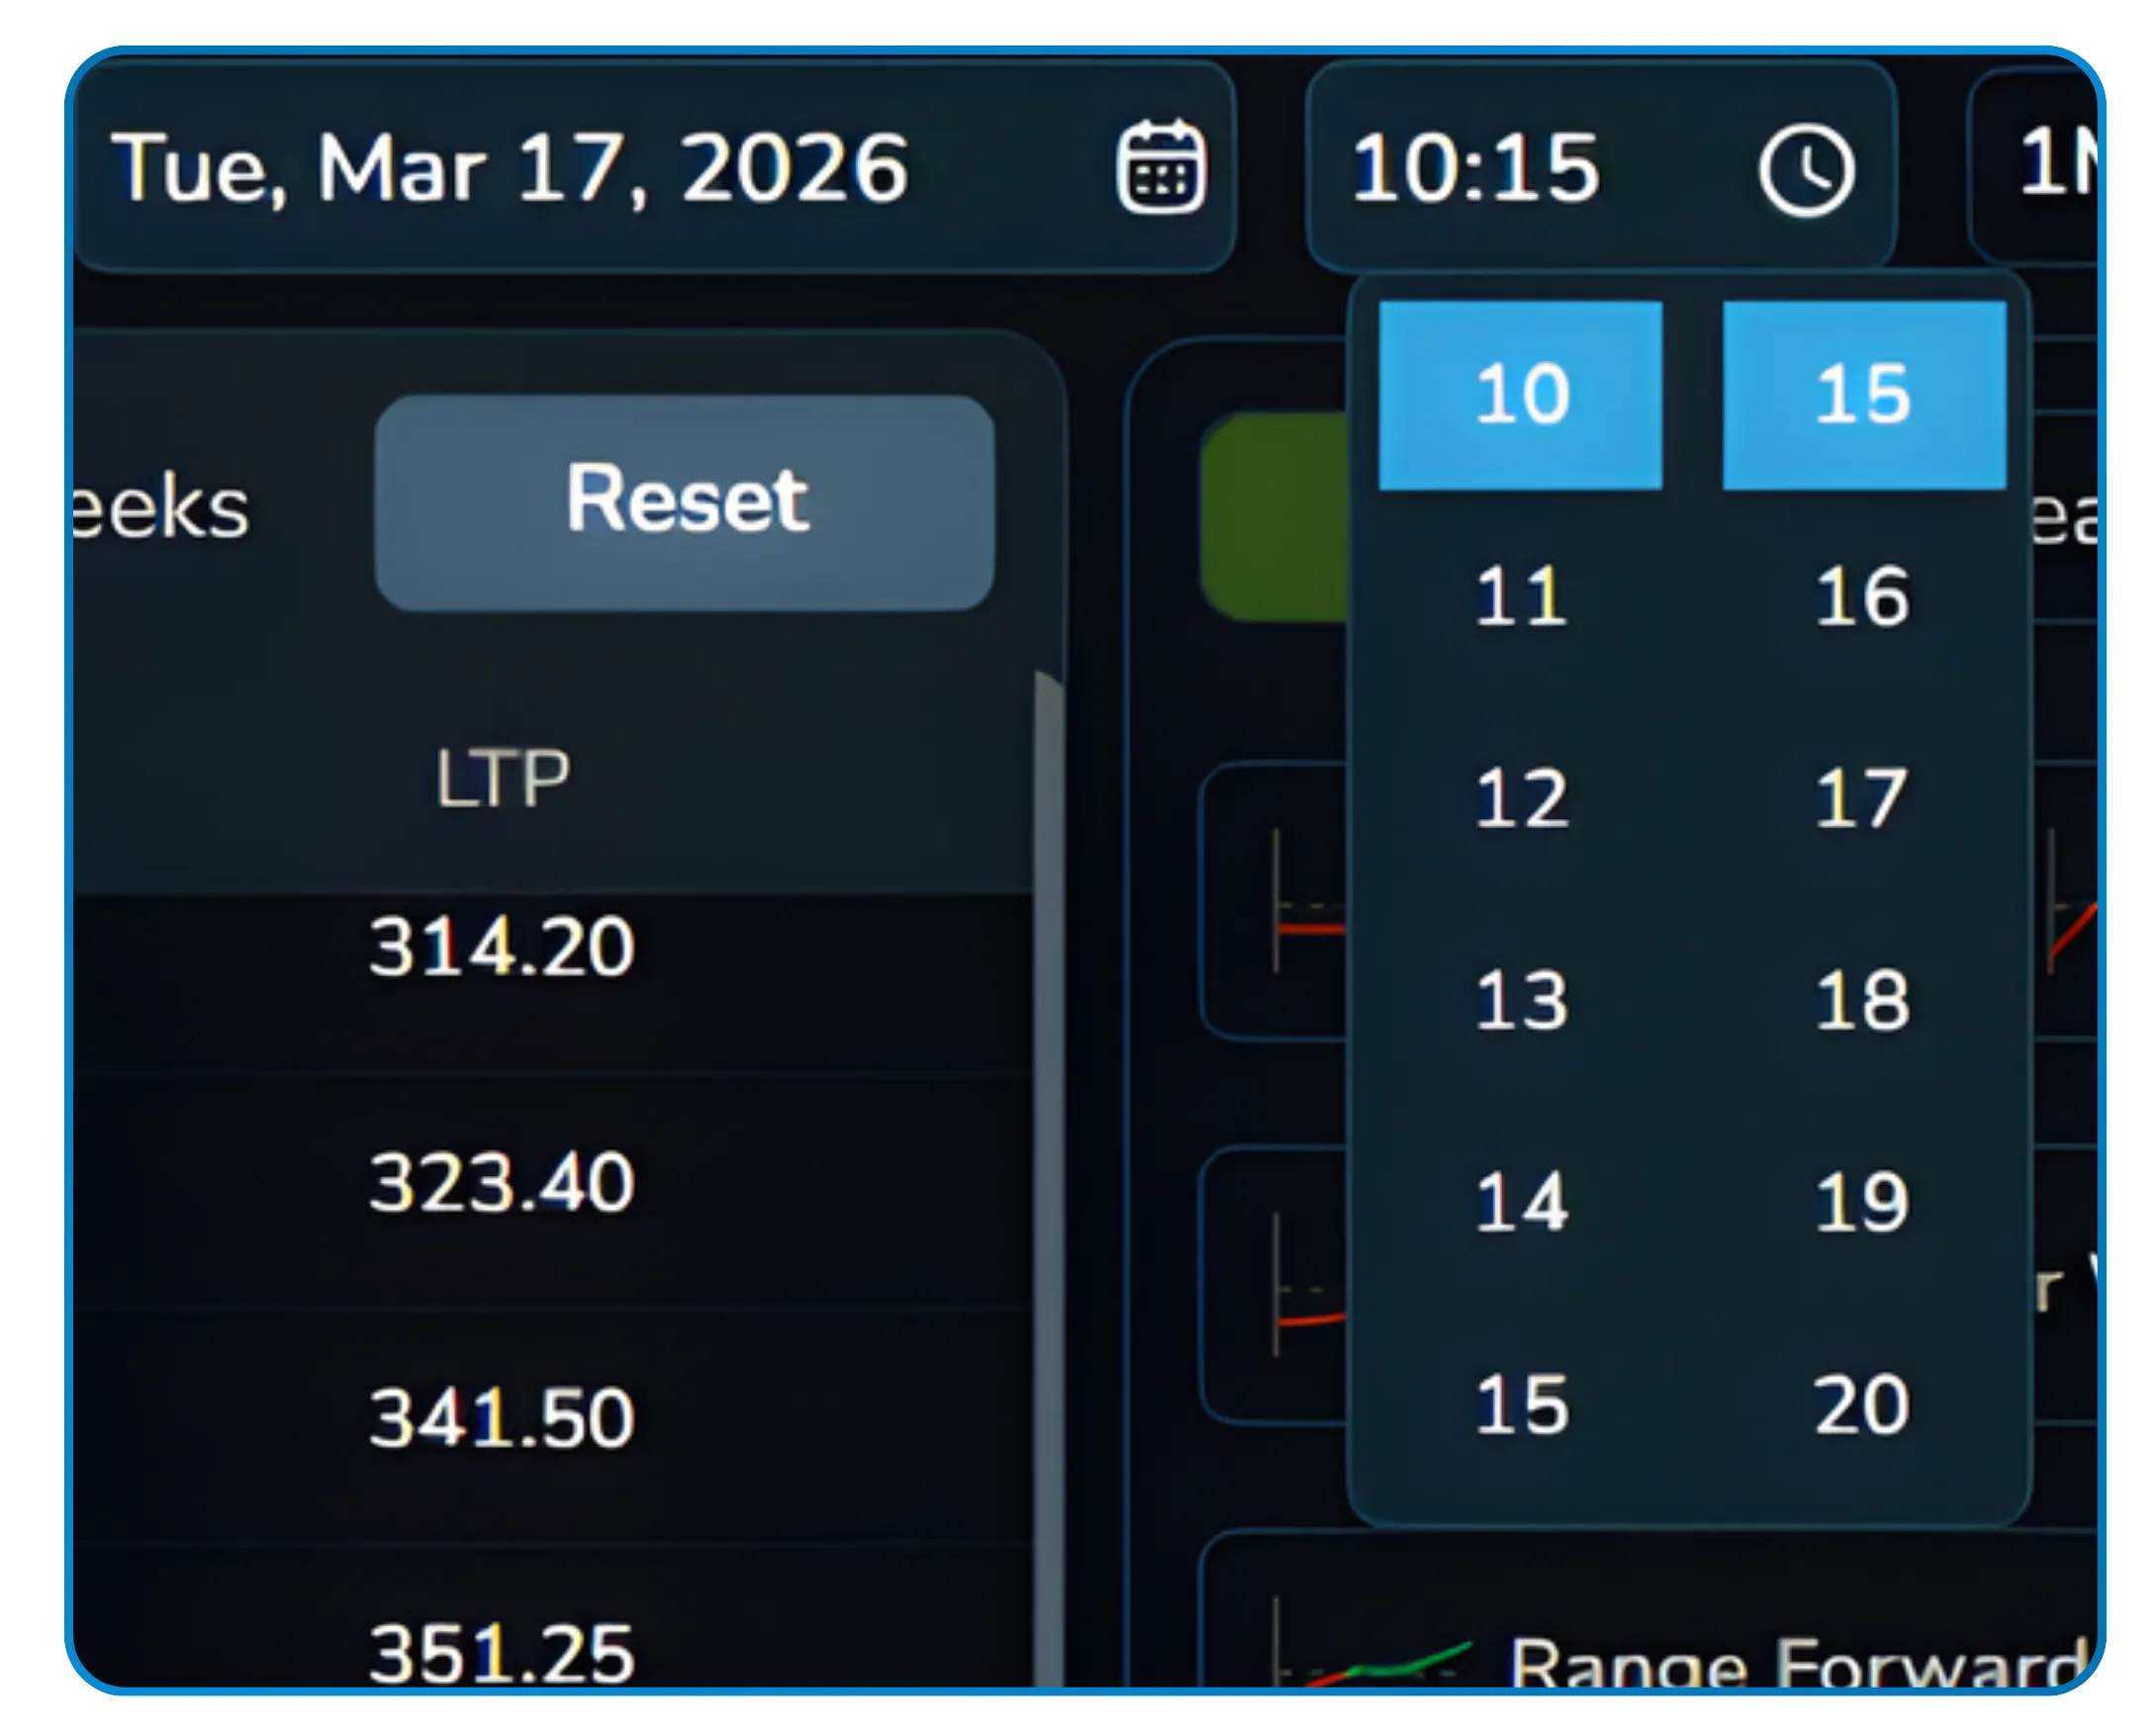
Alongside the date, you can also set the starting time down to the minute. This matters a great deal for intraday strategies where your entry timing relative to the open, or around a known event window, determines how the strategy behaves in the first few candles.
Together, the date and time controls mean you can position yourself at any point in recent market history and replay what actually happened from that moment onward.
The time control is especially powerful for strategies designed around specific market sessions, such as an entry at 9:20 AM right after the opening volatility settles, or a pre-expiry position built at 10:15 AM on the weekly expiry day.
Also Read: Understanding Shift, Width, and Hedge in NxtOption Strategy Builder
4 Strategy Selection
Build Your Own or Pick a Ready-Made Strategy
There are two ways to set up a strategy inside the Simulator. The first is to construct it manually by clicking Buy or Sell directly on the strikes of the option chain. The second, and faster approach, is to use the pre-built strategy templates organized by market outlook.
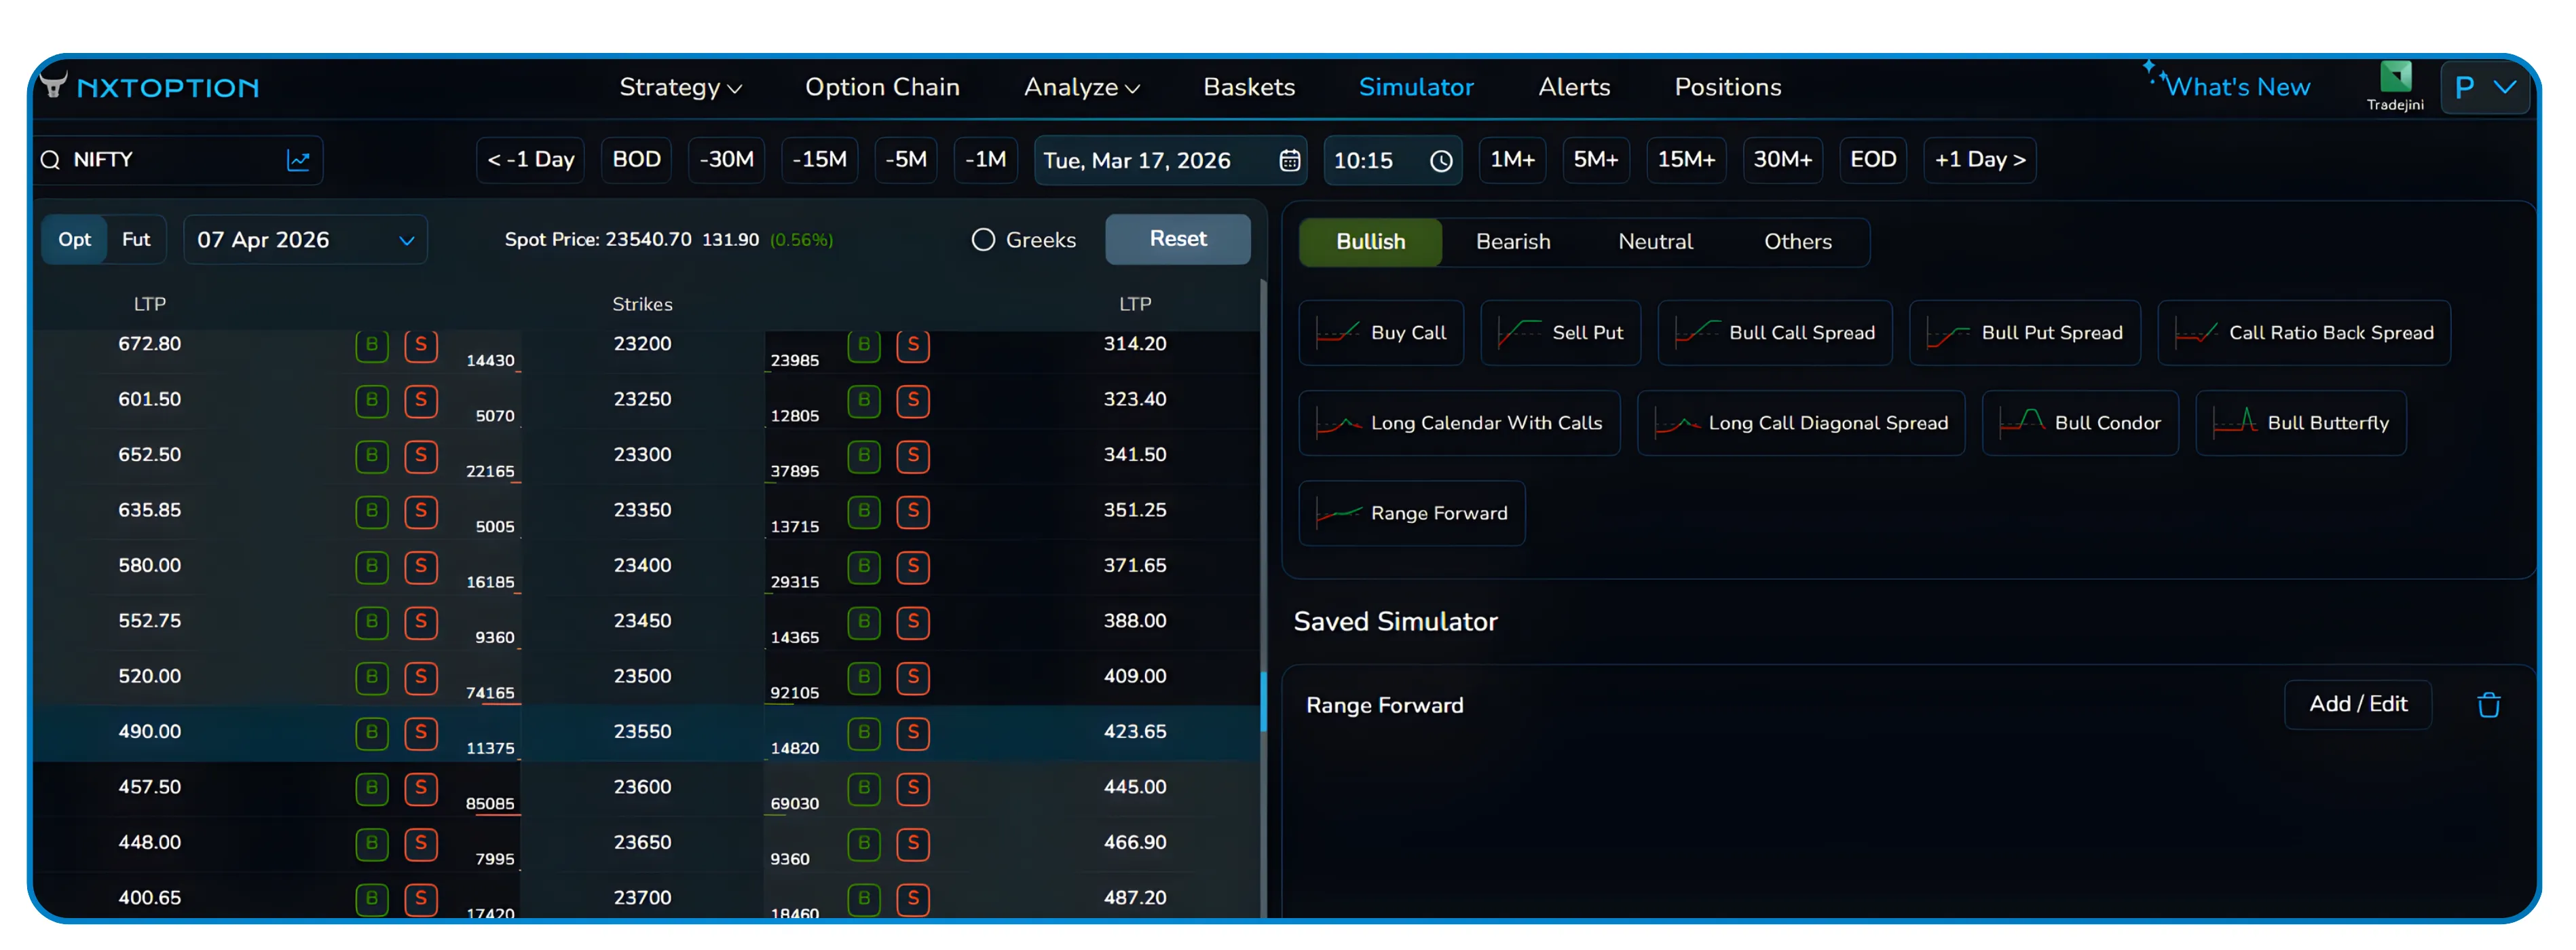
The strategy panel on the right side of the dashboard categorizes templates into four broad tabs:
Bullish
Bearish
Neutral
Others
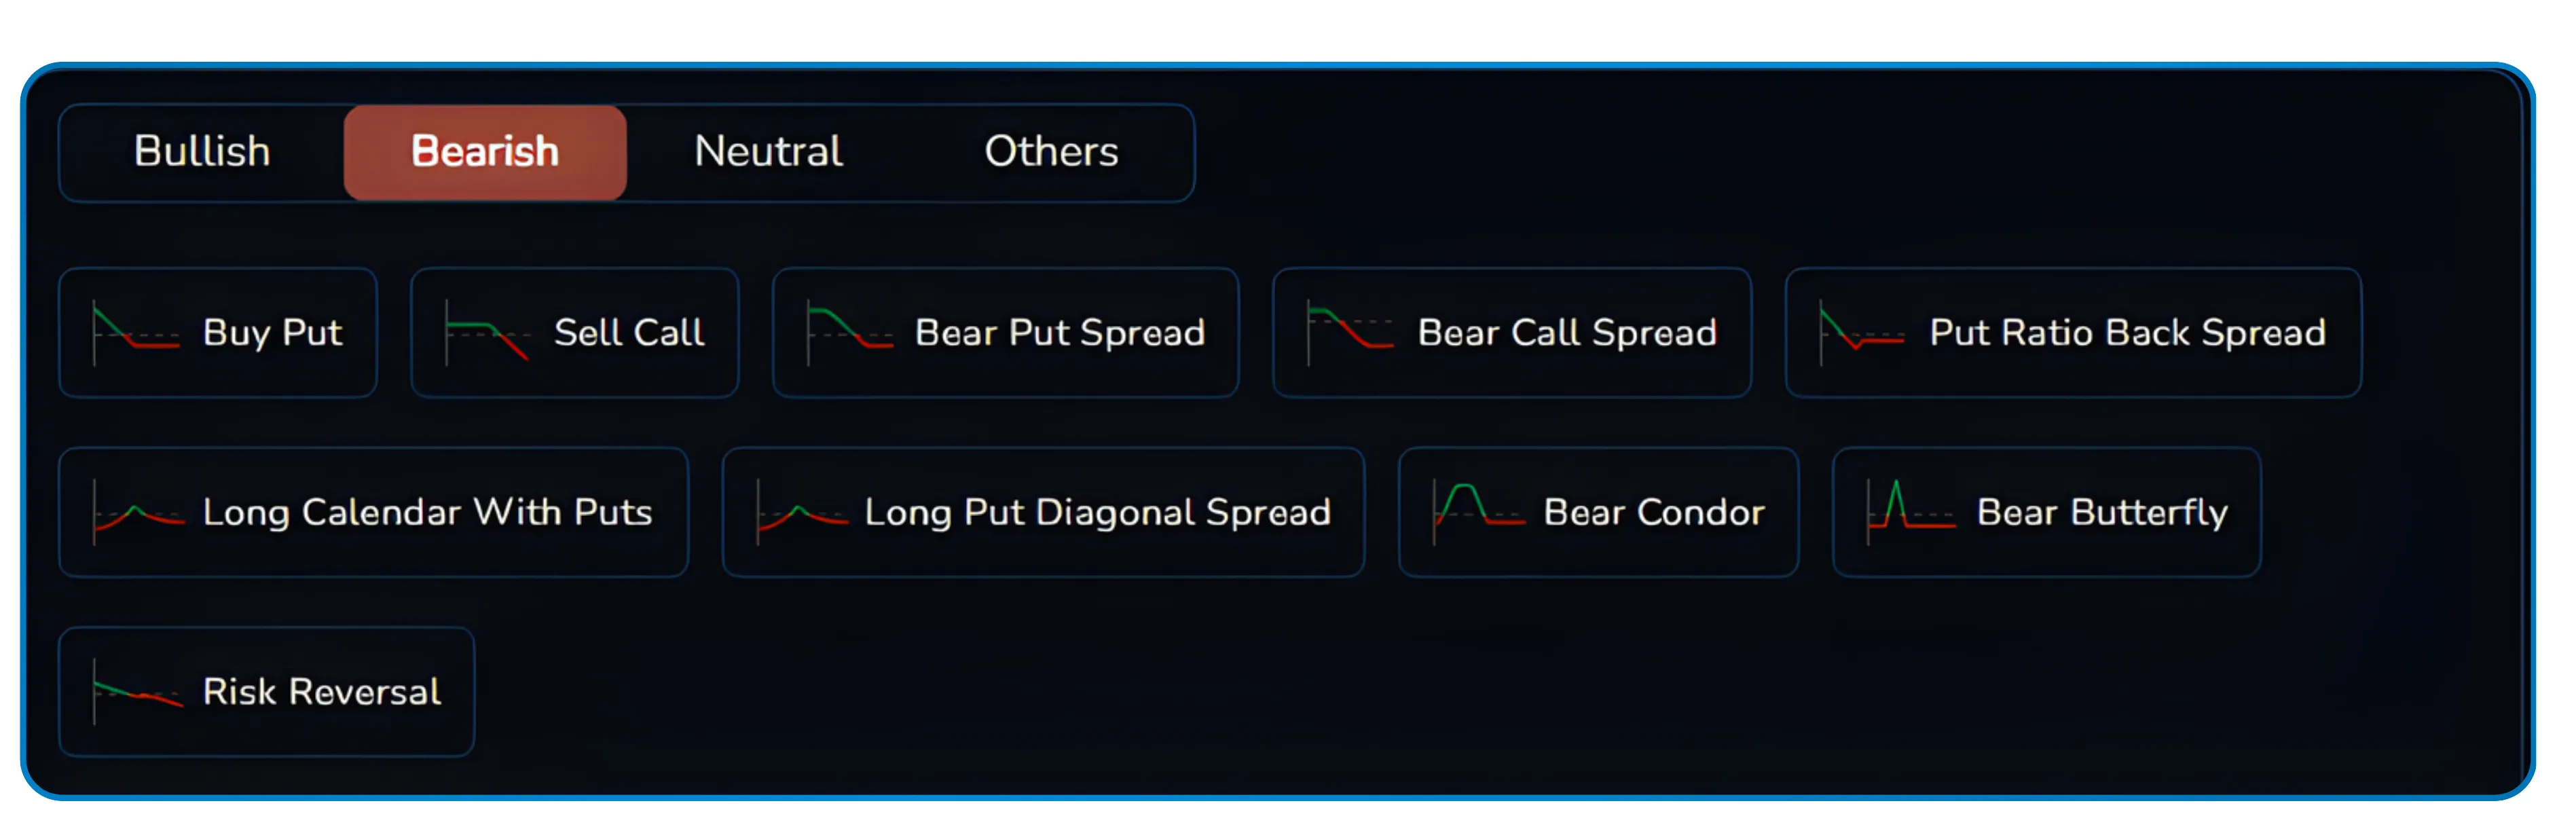
Selecting Bearish, for example, reveals a full list of bearish structures: Buy Put, Sell Call, Bear Put Spread, Bear Call Spread, Put Ratio Back Spread, Long Calendar With Puts, Long Put Diagonal Spread, Bear Condor, Bear Butterfly, and Risk Reversal. Each comes with its characteristic payoff icon so you can visually identify the shape of the structure at a glance.
Once you select a template, the platform automatically populates the relevant legs in the strategy panel below. The payoff diagram updates instantly so you can see what the structure looks like before running any simulation at all.
What the Strategy Panel Shows
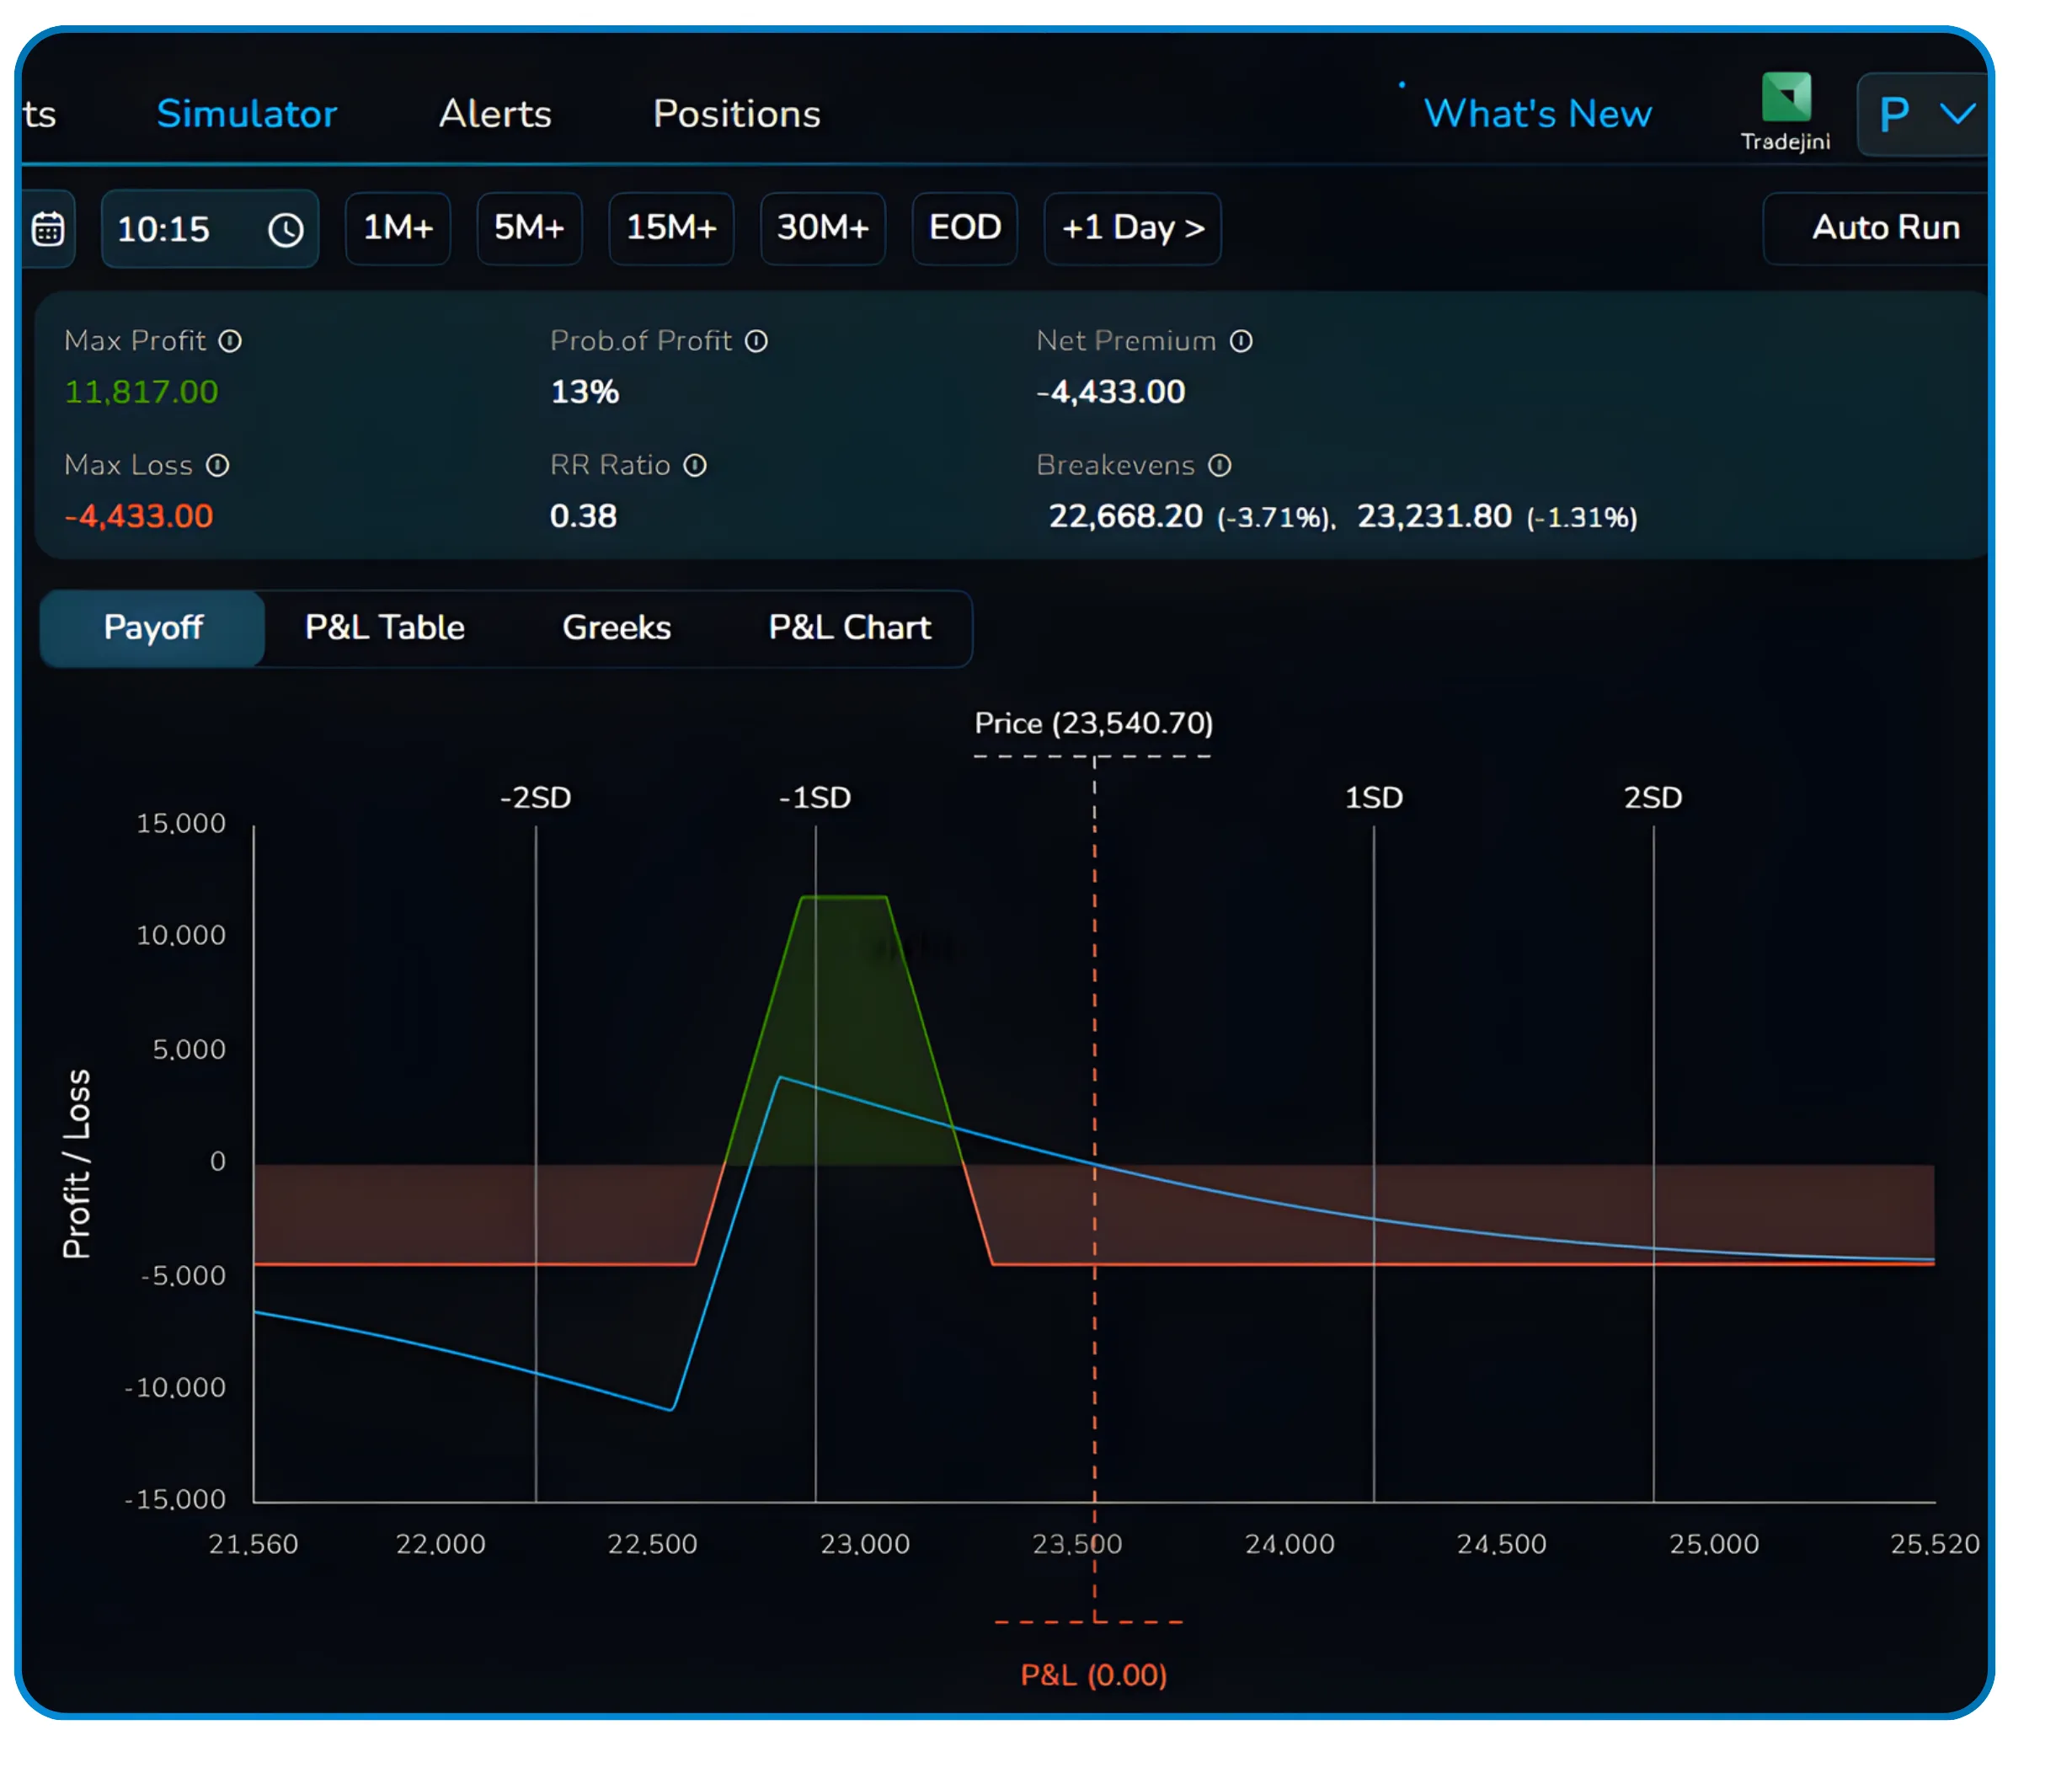
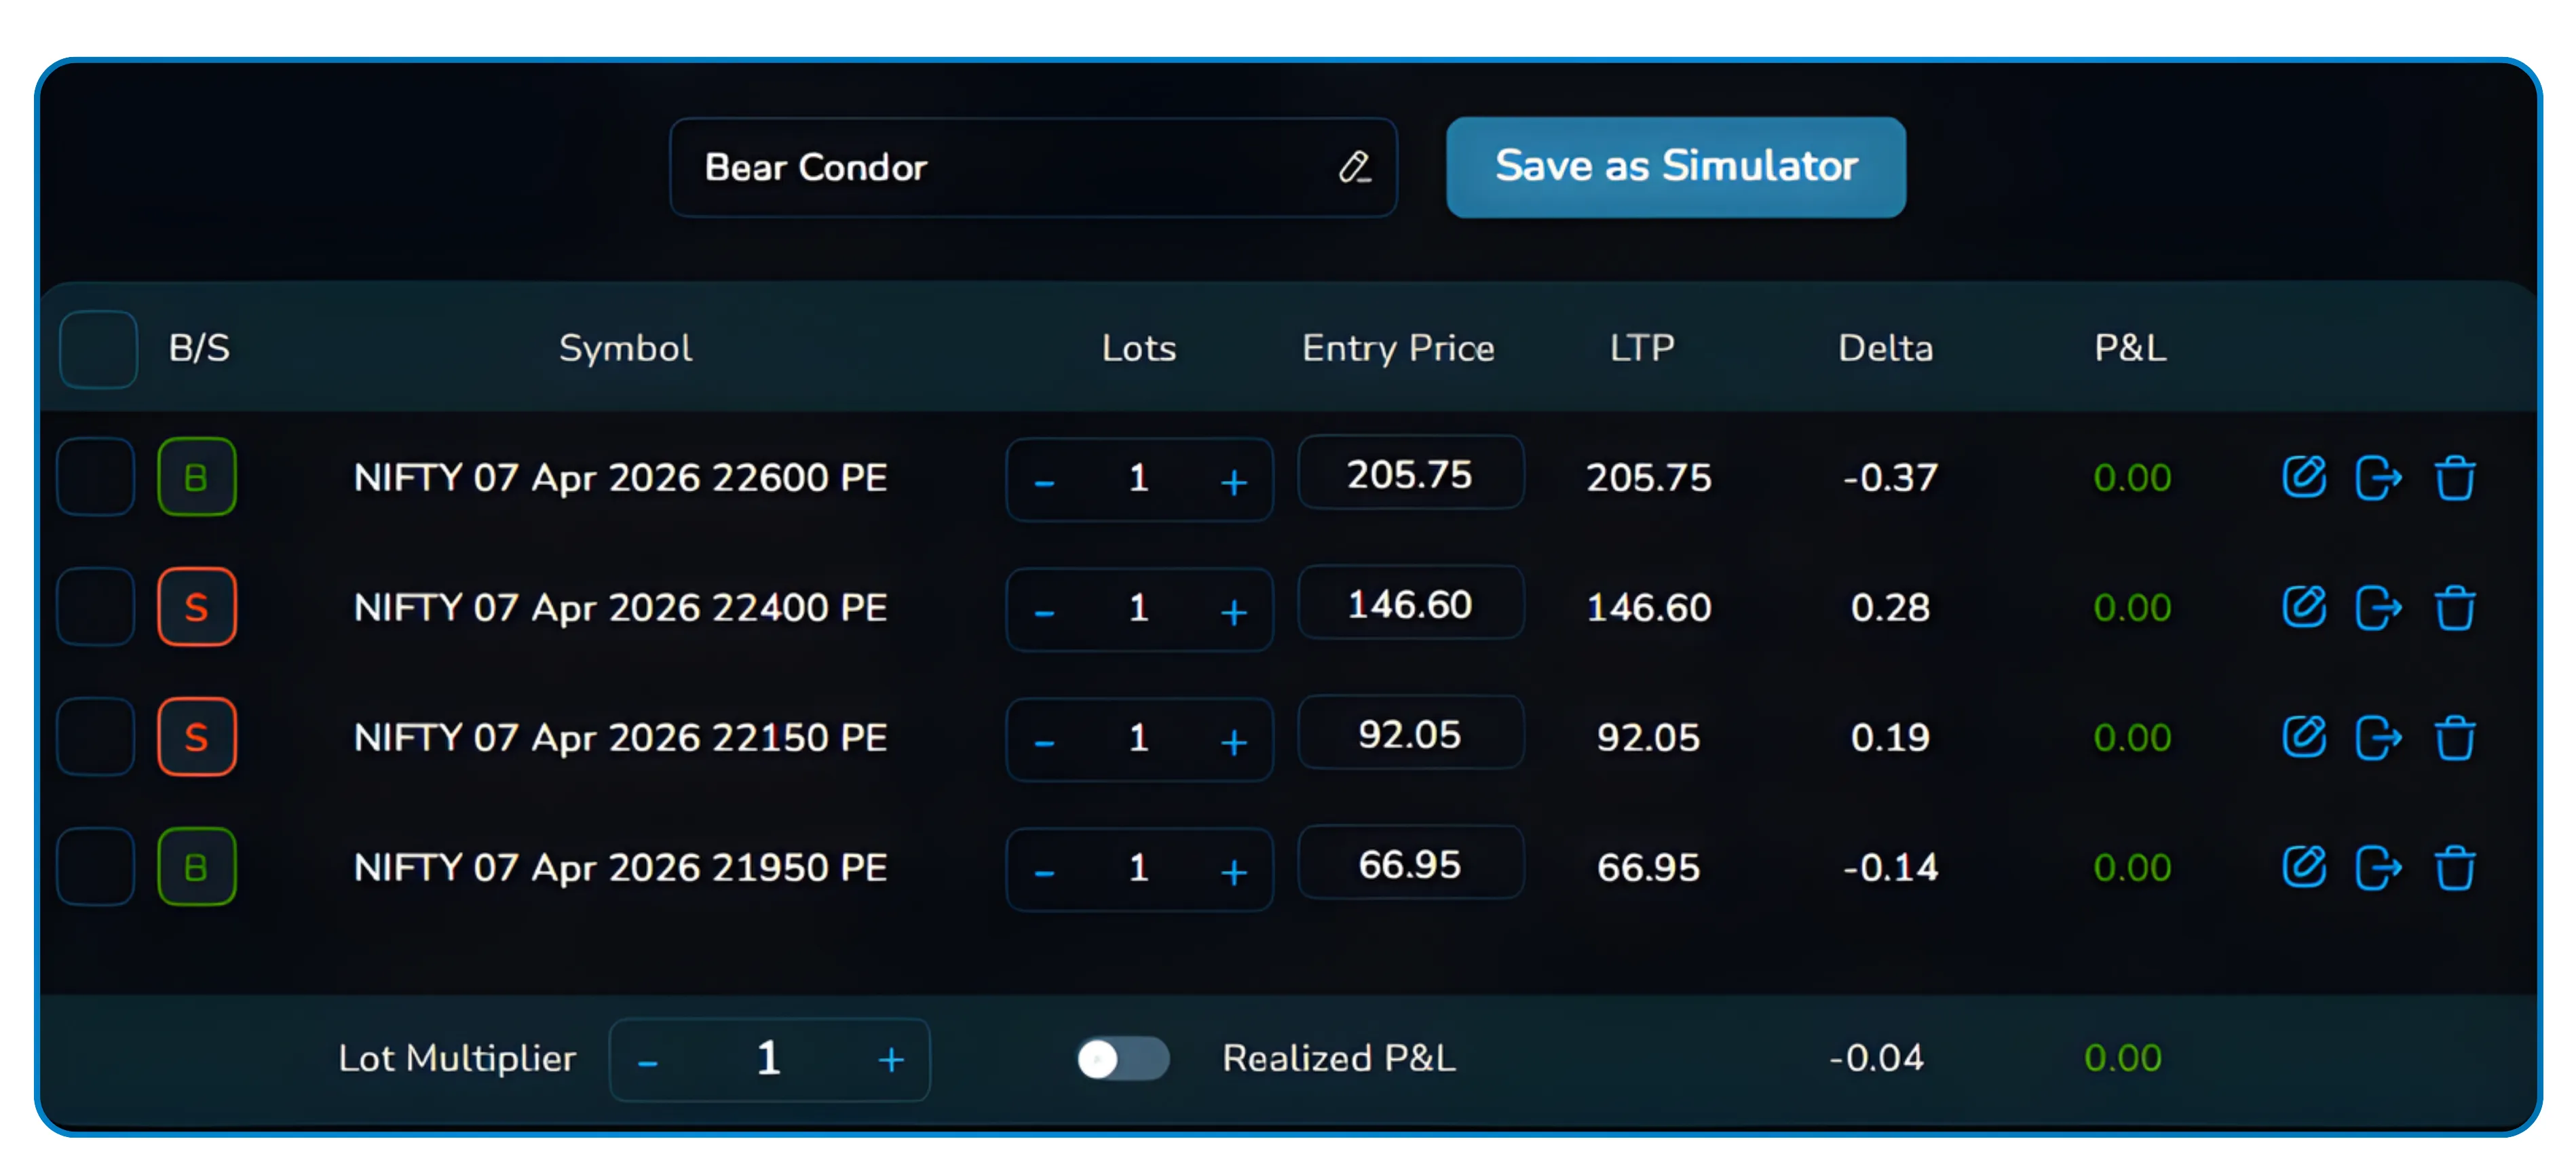
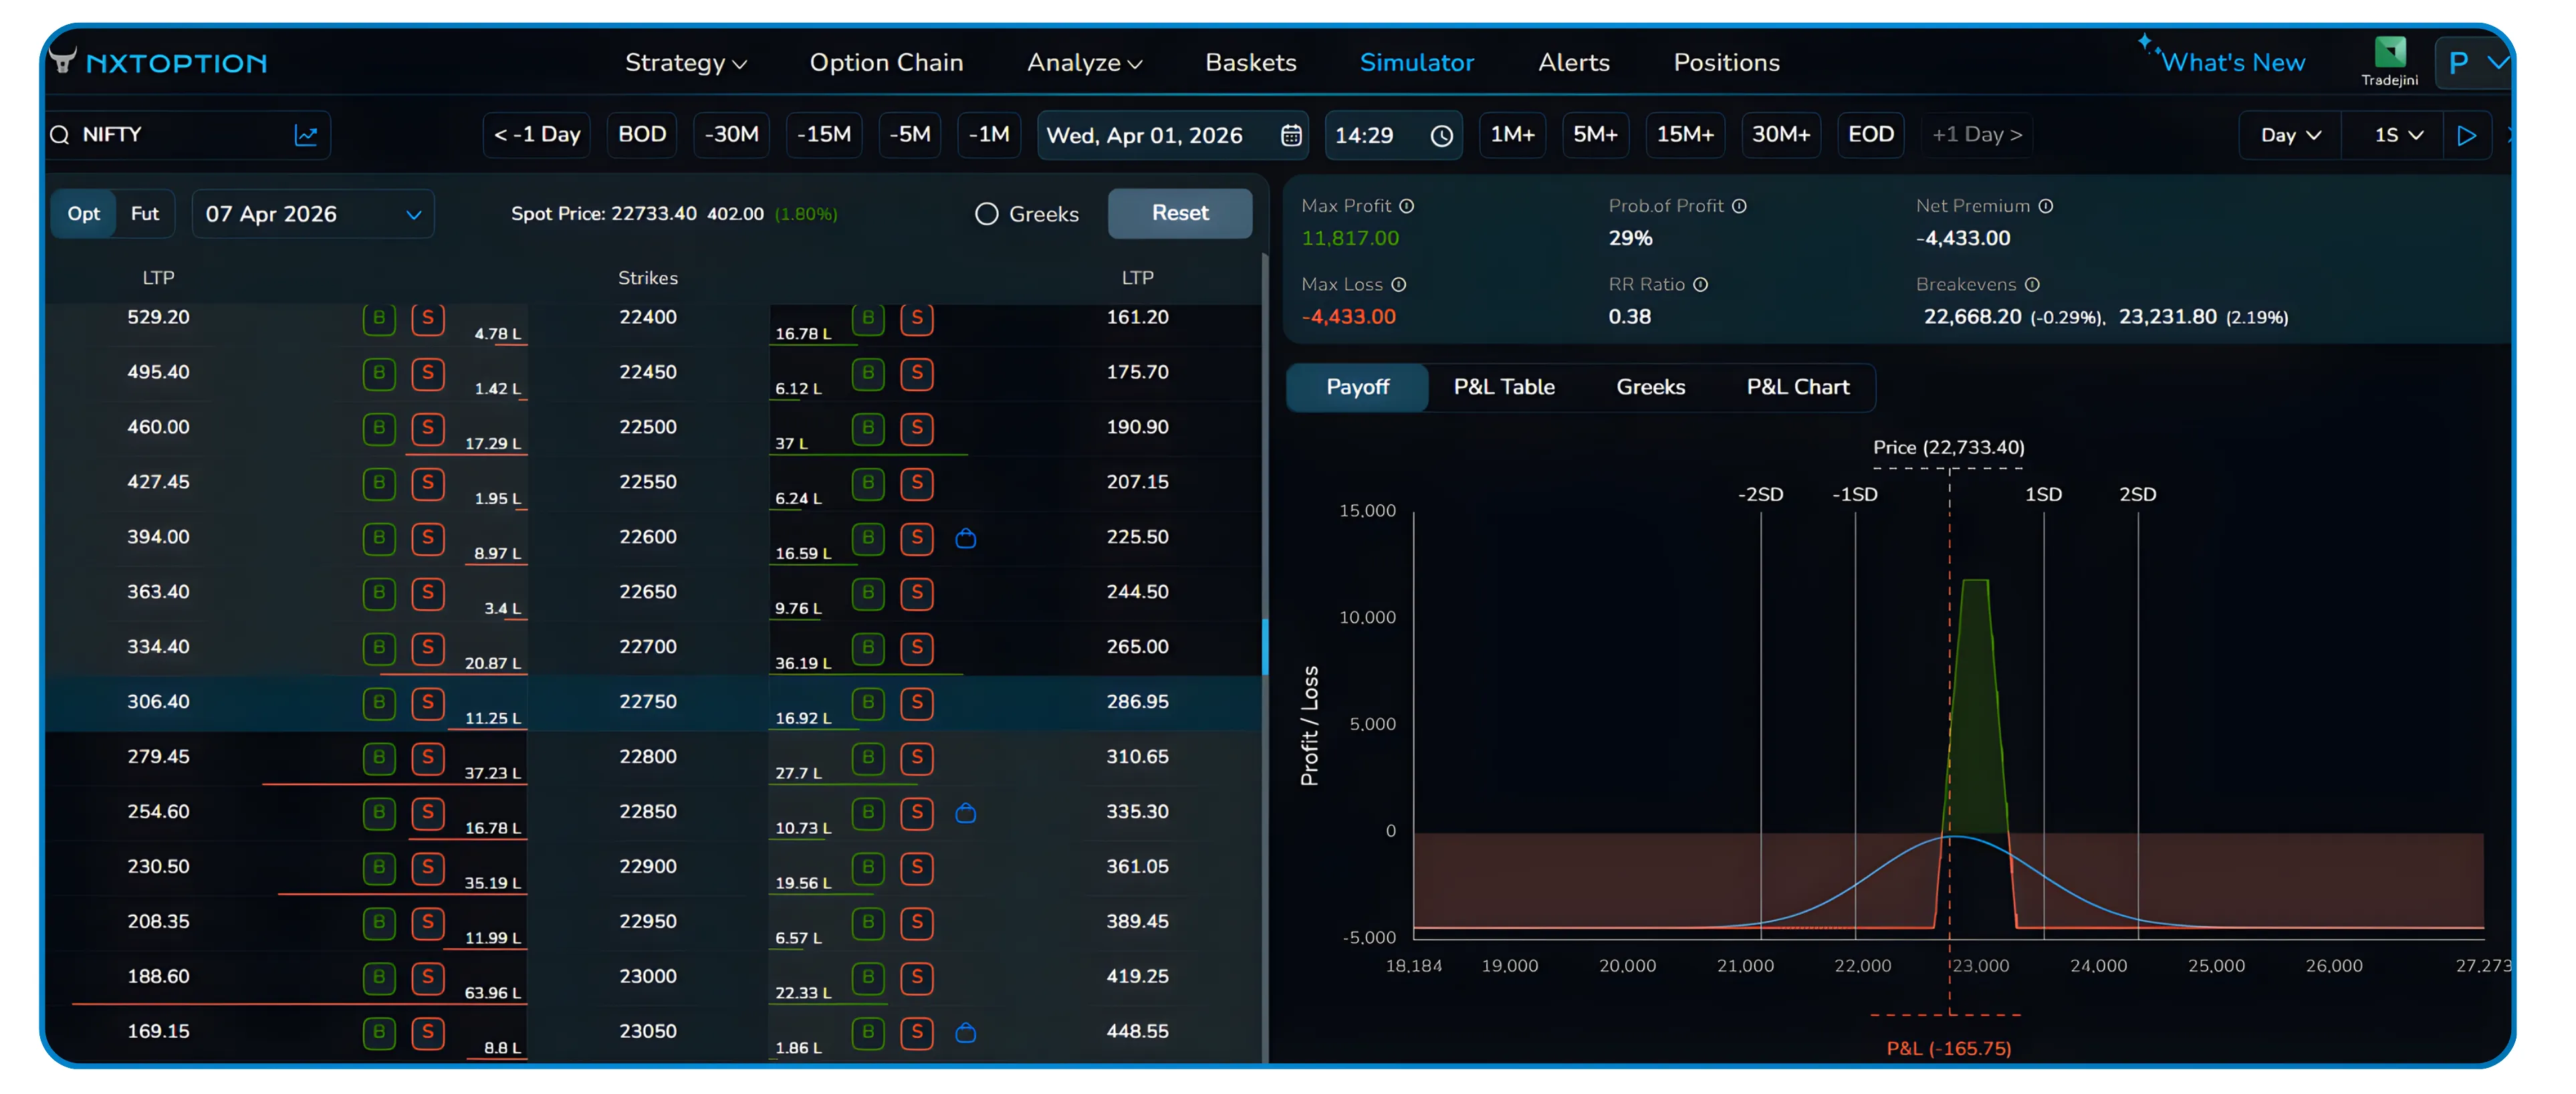
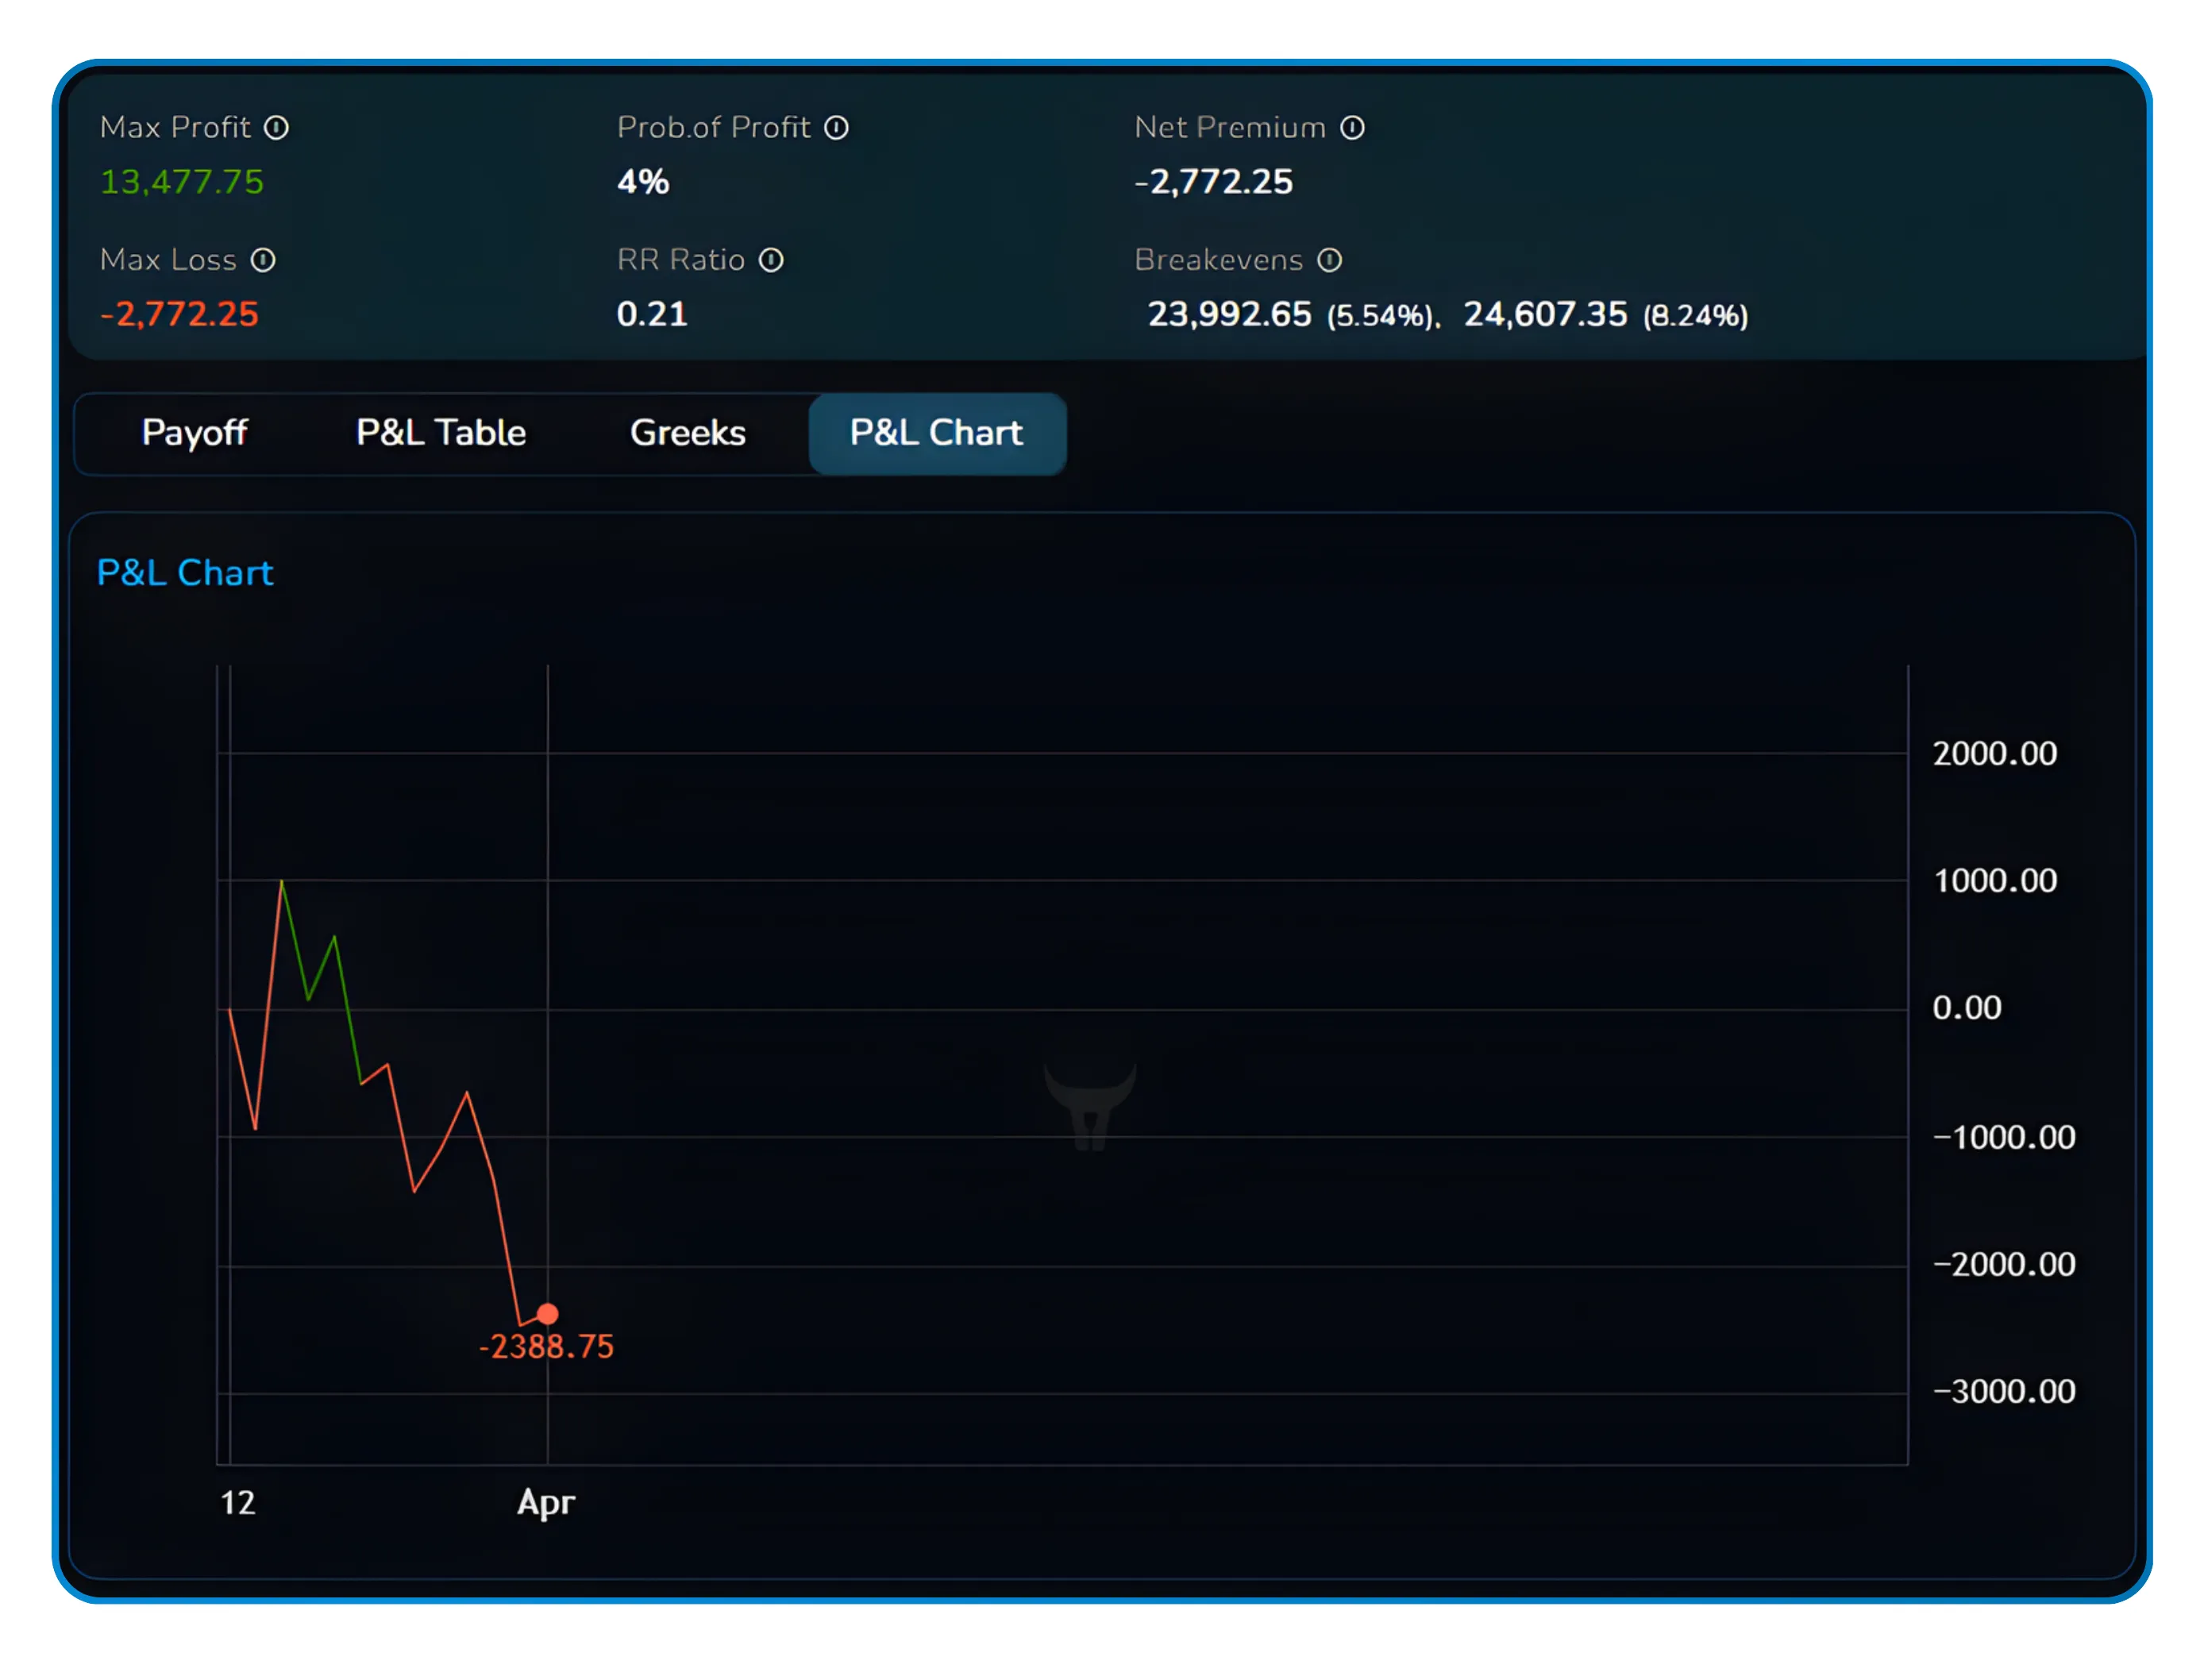
After loading a strategy, the panel displays each leg with its symbol, expiry, lot count, entry price, current LTP, Delta, and P&L. The summary bar above the payoff chart highlights four numbers that matter most when sizing up a position before entry:
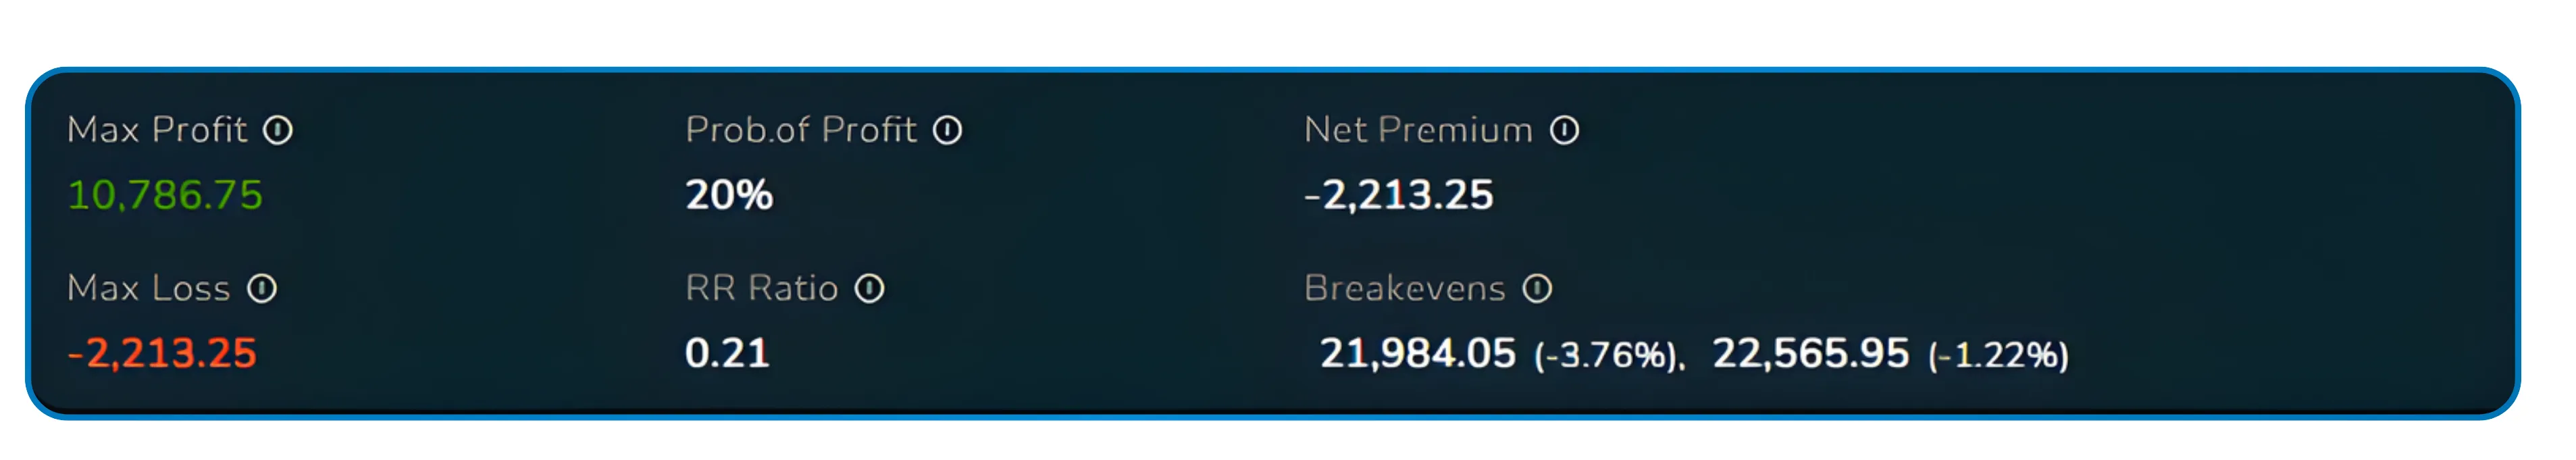
Max Profit shows the best case outcome the strategy can deliver if the market expires exactly where you need it to. Max Loss is the maximum capital at risk, giving you an immediate sense of how much downside is capped or uncapped. Probability of Profit expresses the statistical likelihood that the trade ends in the green based on current market conditions. Net Premium tells you the net credit received or debit paid to enter the position, which directly affects your breakeven levels. RR Ratio is the reward-to-risk ratio, summarising how much you stand to make relative to what you are risking in a single number. Breakevens show the exact price levels where your P&L crosses zero, giving you clear reference points for where the market needs to stay for the trade to work.
Together these six metrics give you a complete pre-trade snapshot before a single rupee is committed to the simulation.
Price levels where P&L crosses zero
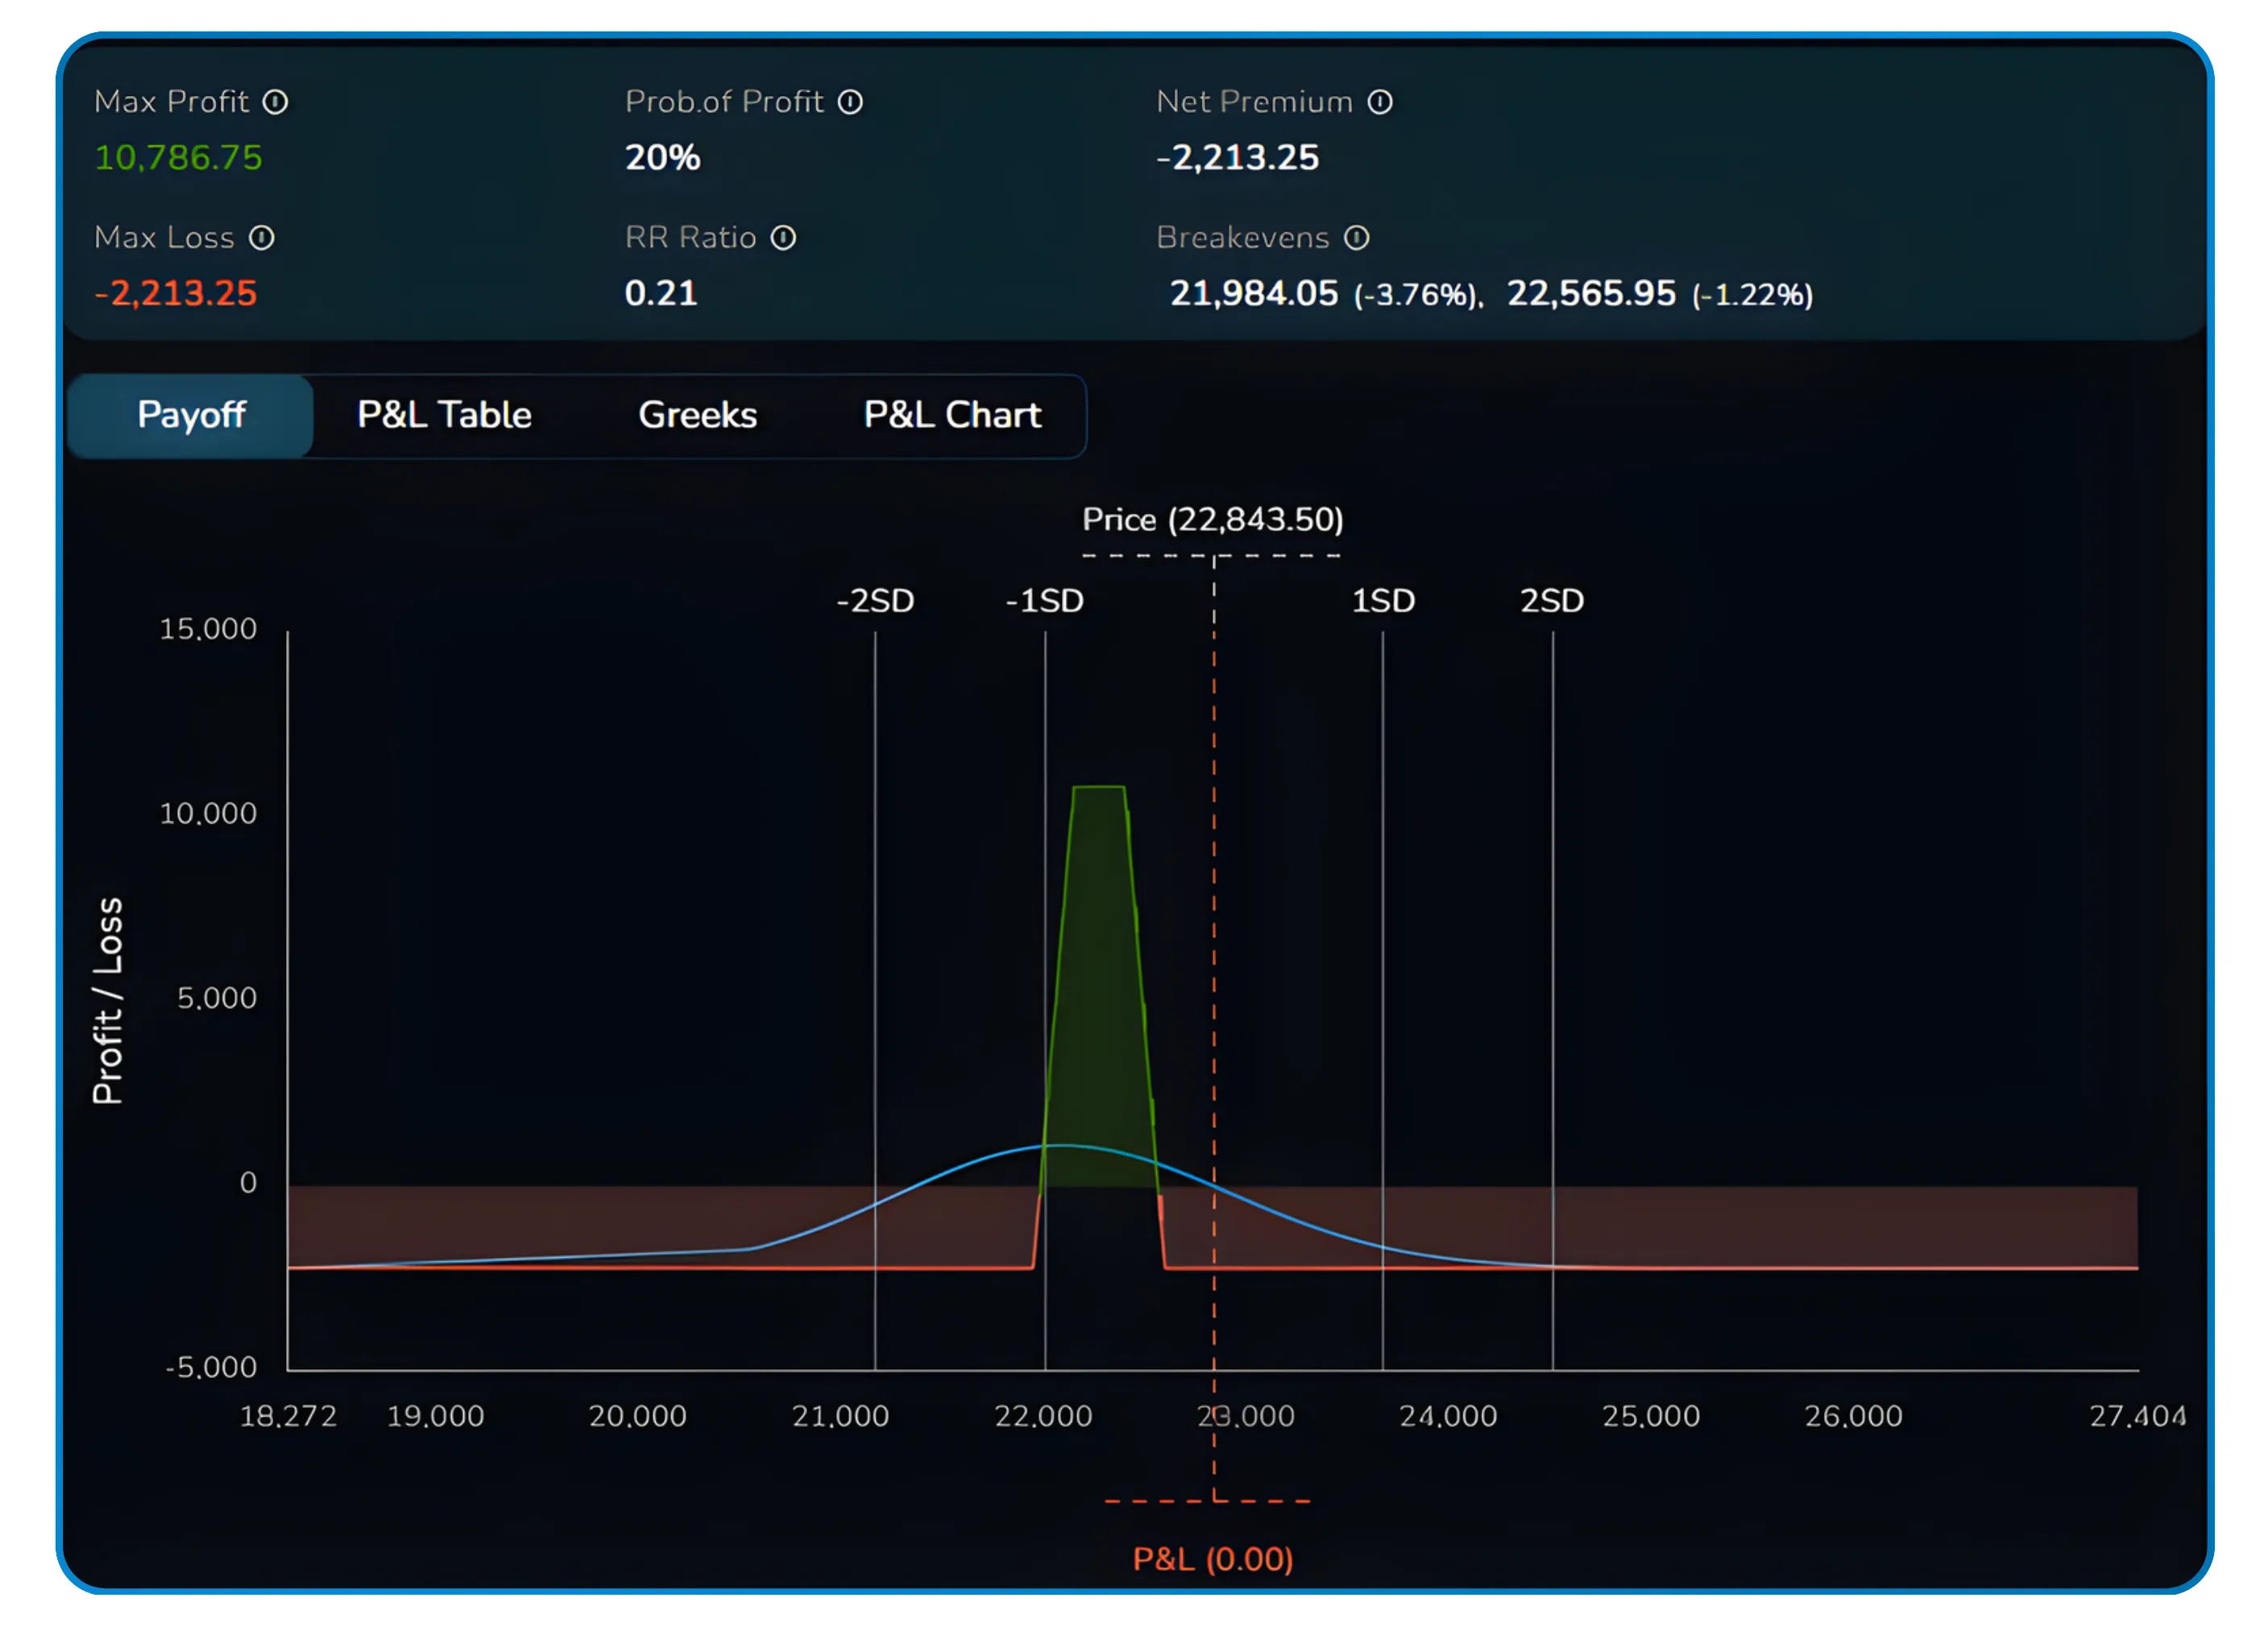
The payoff chart below these numbers draws the standard payoff curve with the current spot price marked, and overlays the standard deviation bands at -2SD, -1SD, +1SD, and +2SD so you can immediately assess how wide the profitable zone is relative to expected market movement.
5 Launching the Simulation
Setting Up and Running Auto Run
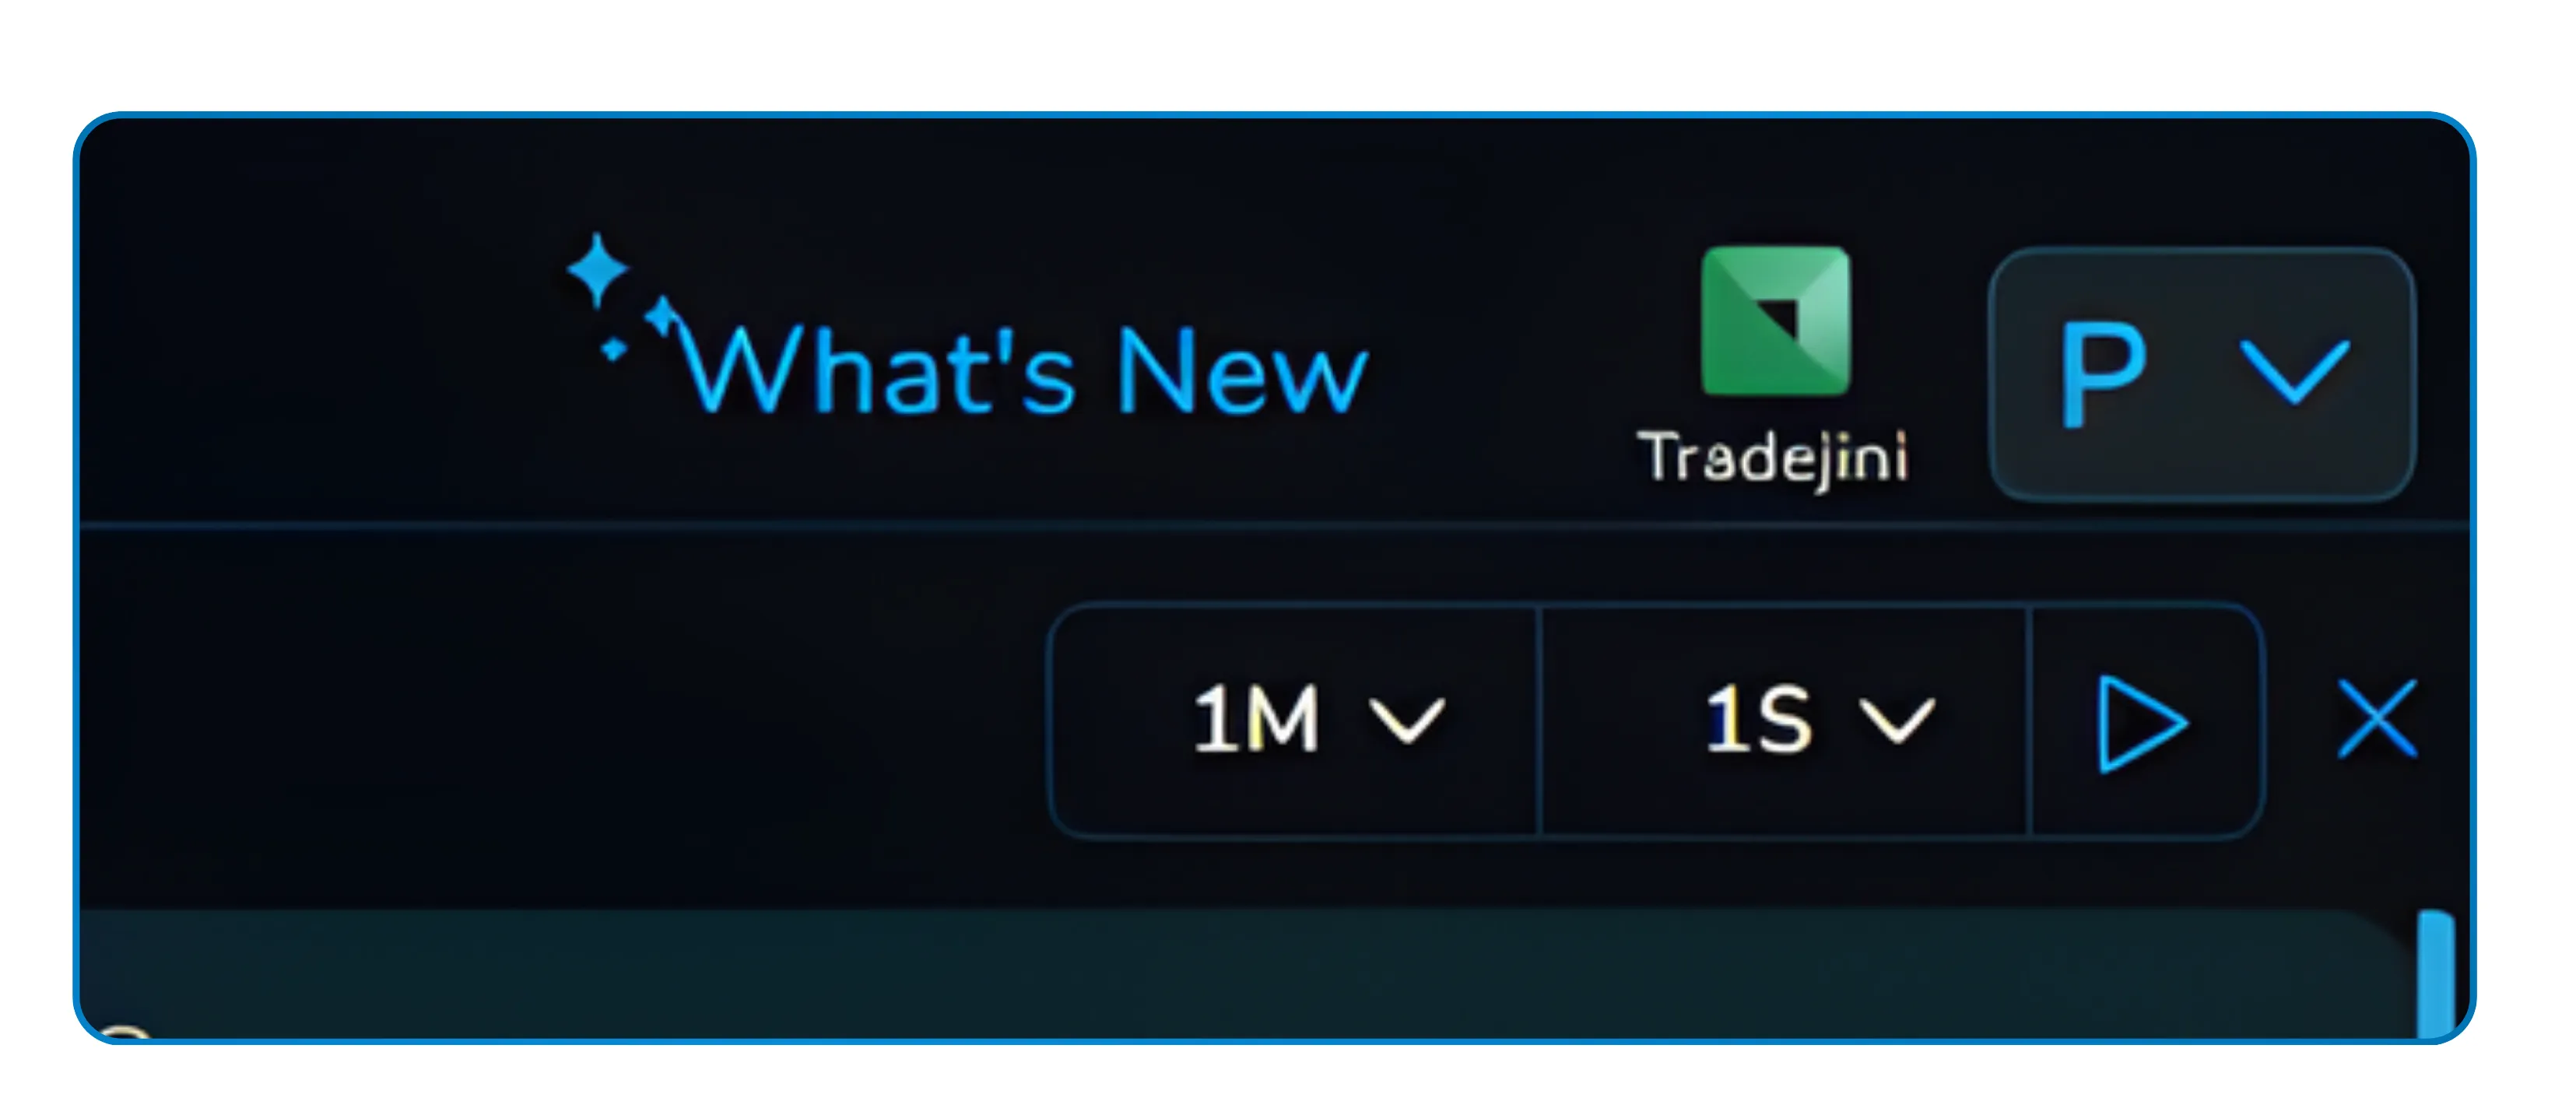
Once your strategy legs are configured and your starting date is set, a button labeled Auto Run appears in the top right corner of the Simulator. Clicking it does not immediately start playback. Instead, a compact control panel appears that gives you two final choices before the simulation begins.
Choosing the Time Frame
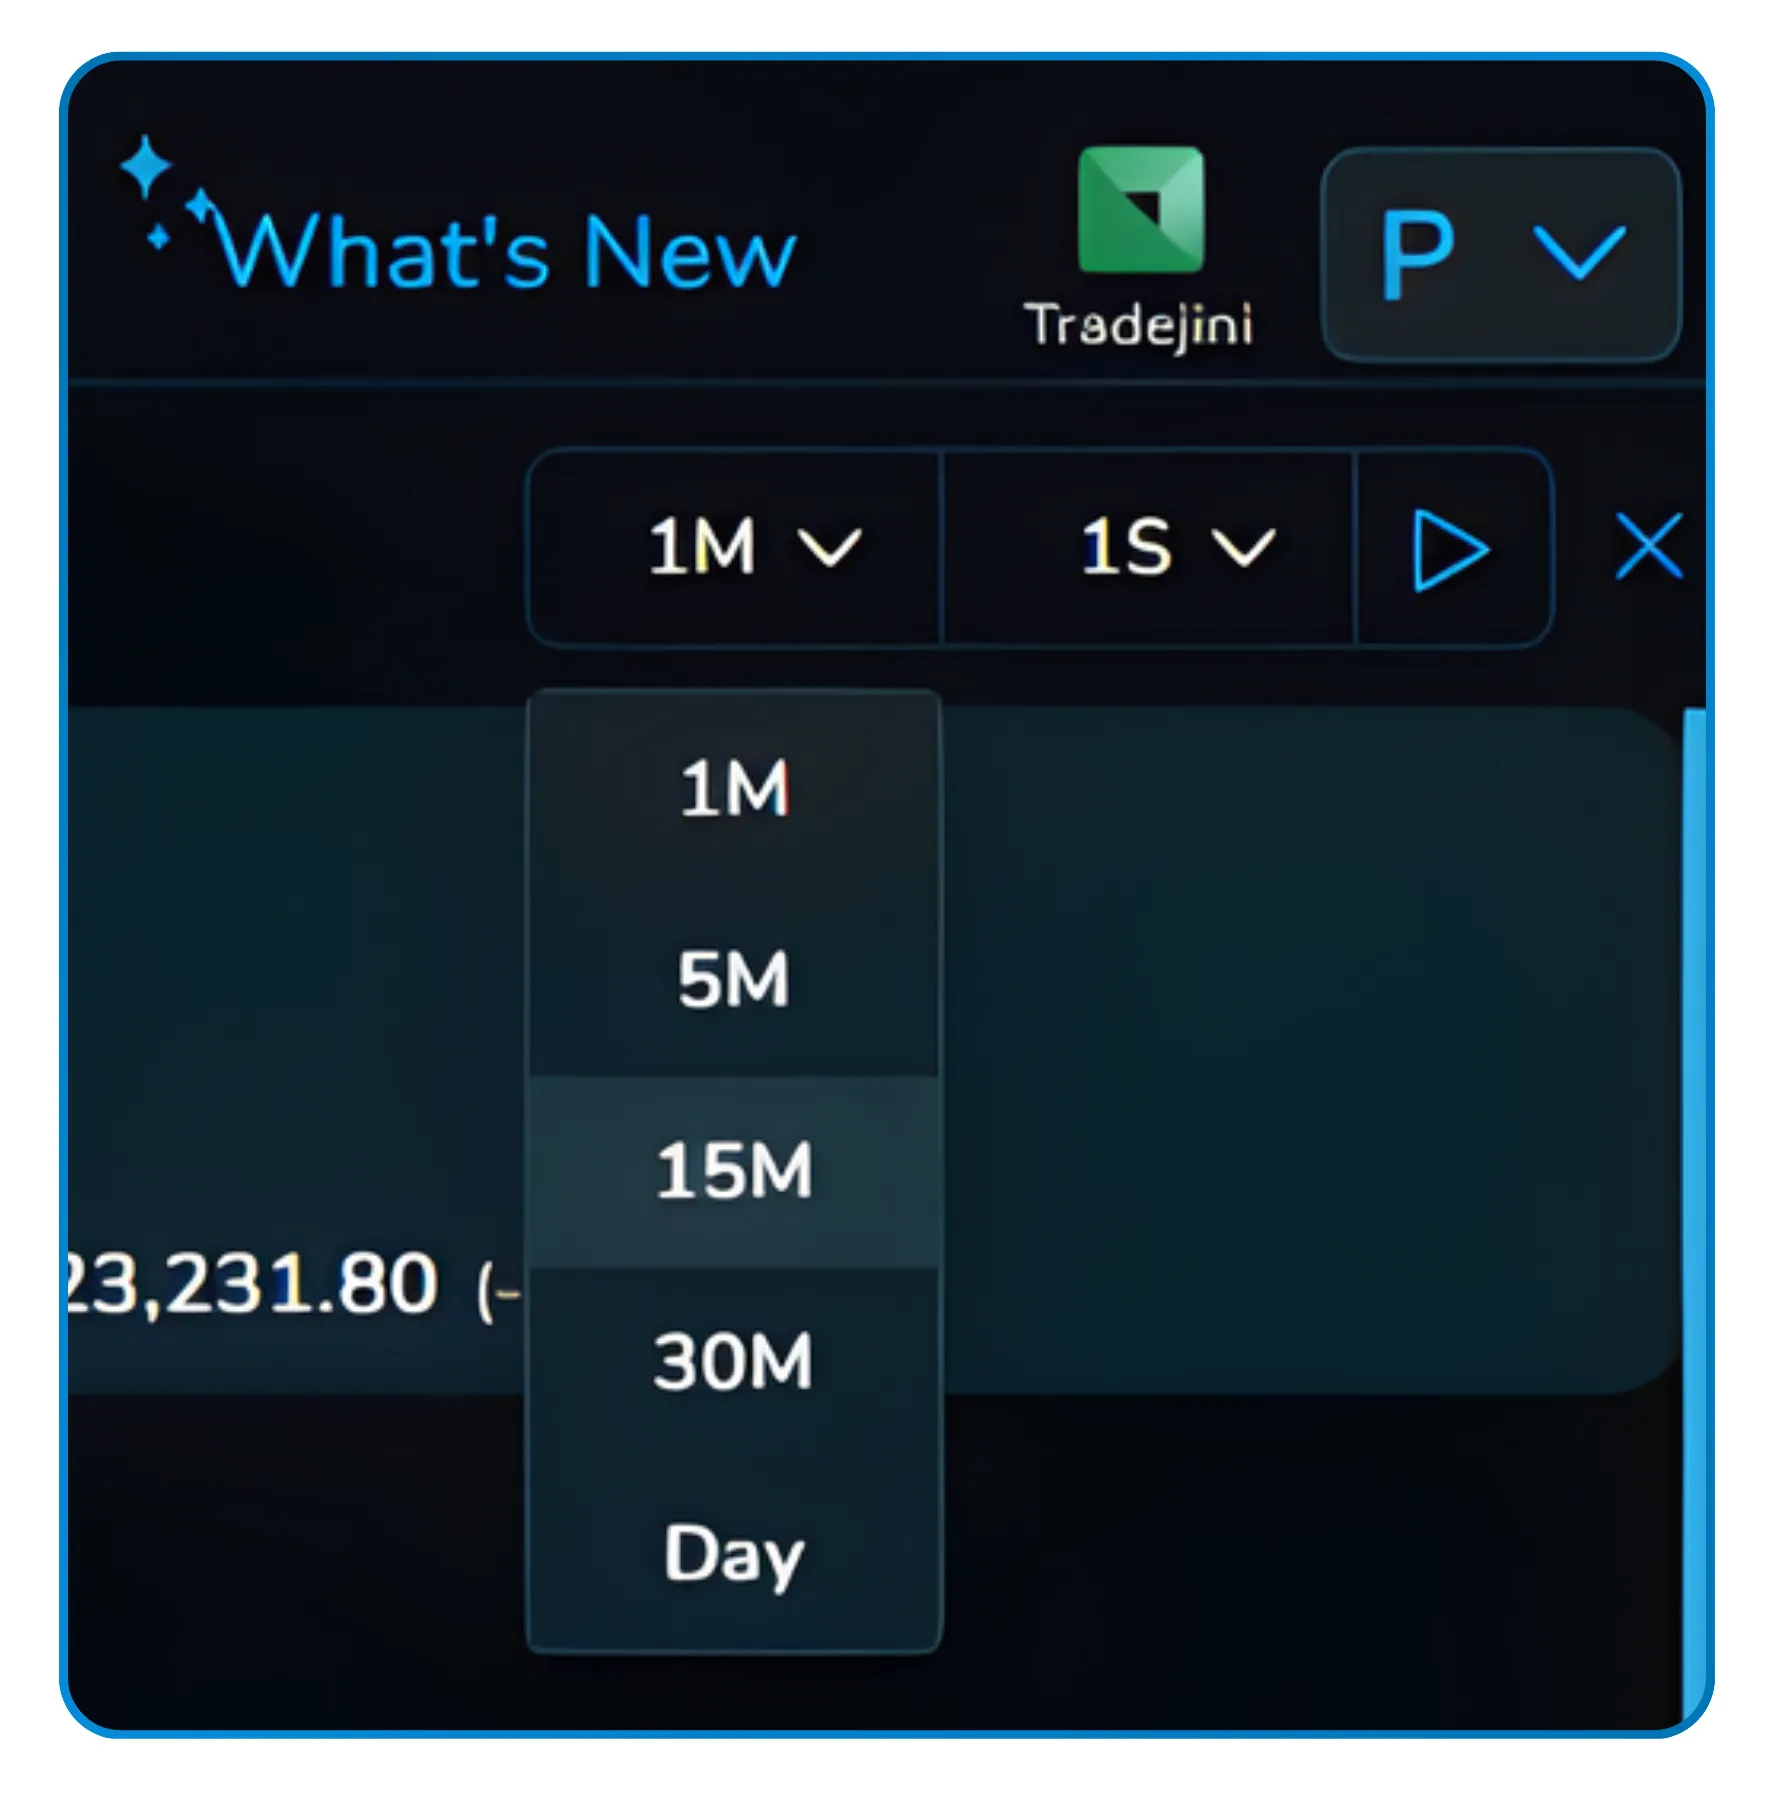
The first control is the candle time frame for the simulation. You can select from 1M, 5M, 15M, 30M, or Day. This determines the interval at which the simulator steps the market forward with each tick of playback. A 15-minute time frame, for example, advances the simulation 15 minutes of real historical price action with each step.
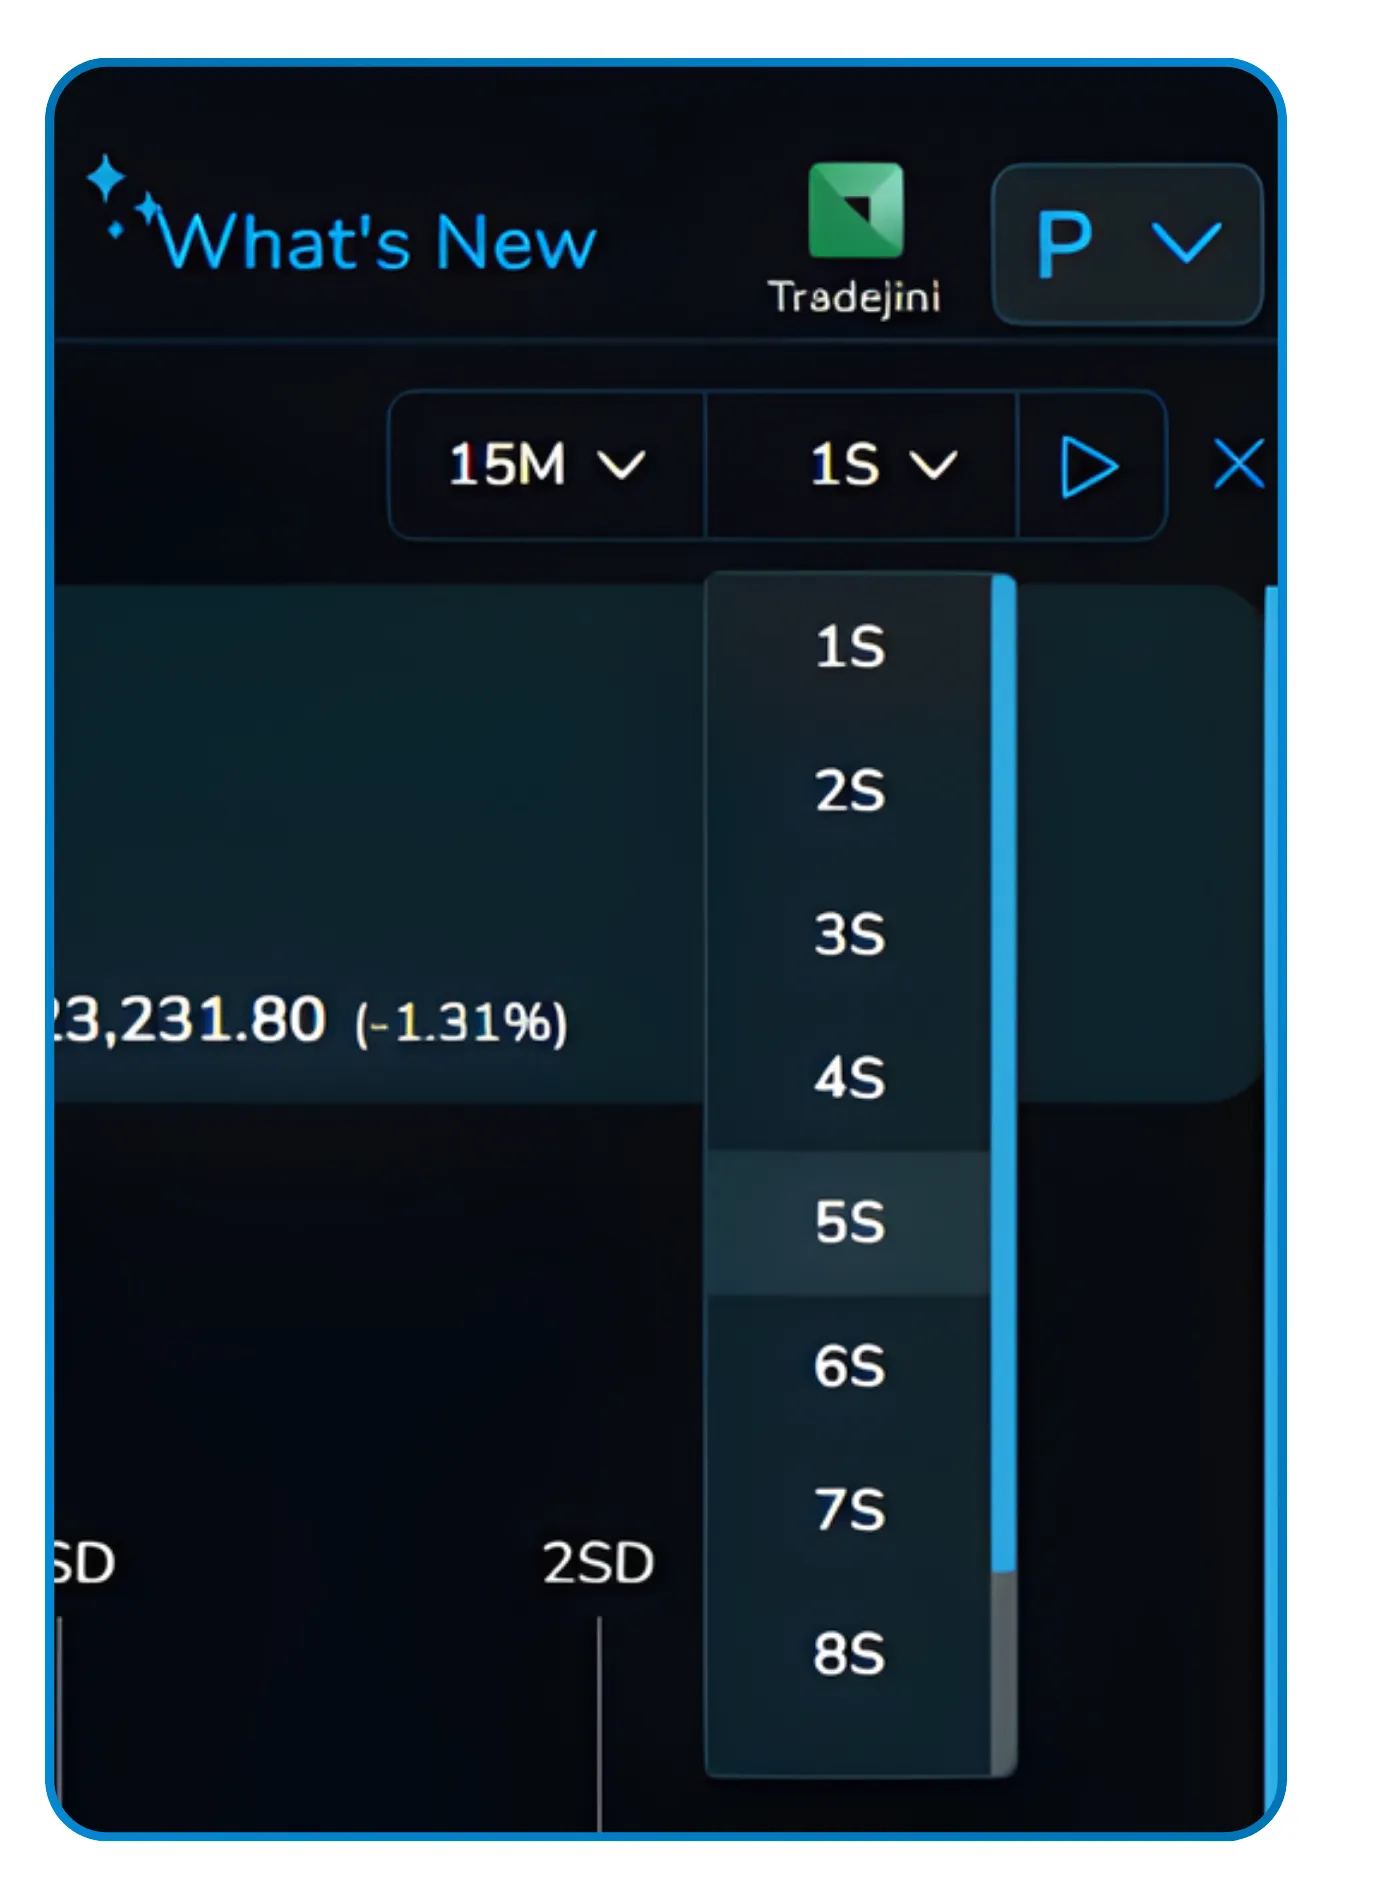
Choosing the Playback Speed
The second control is the speed, ranging from 1 second to 8 seconds per step. A slower speed like 5 seconds gives you time to observe each candle, read the updated numbers, and make note of how your P&L and the payoff diagram are responding. A faster speed lets you run through a full session quickly when you want a broad overview.
After setting both controls, you hit the play icon and the simulation begins. The date and time indicator at the top of the screen advances in real time, the option chain prices update, and the payoff chart responds to every move the market makes during that historical window.
You can adjust the time frame and speed mid-simulation without stopping playback. This is useful when you want to scan quickly through a quiet period and then slow down around a volatile spike to study your strategy's behaviour more carefully.
6 Live Simulation
Watching Your Strategy Play Out in Real Time
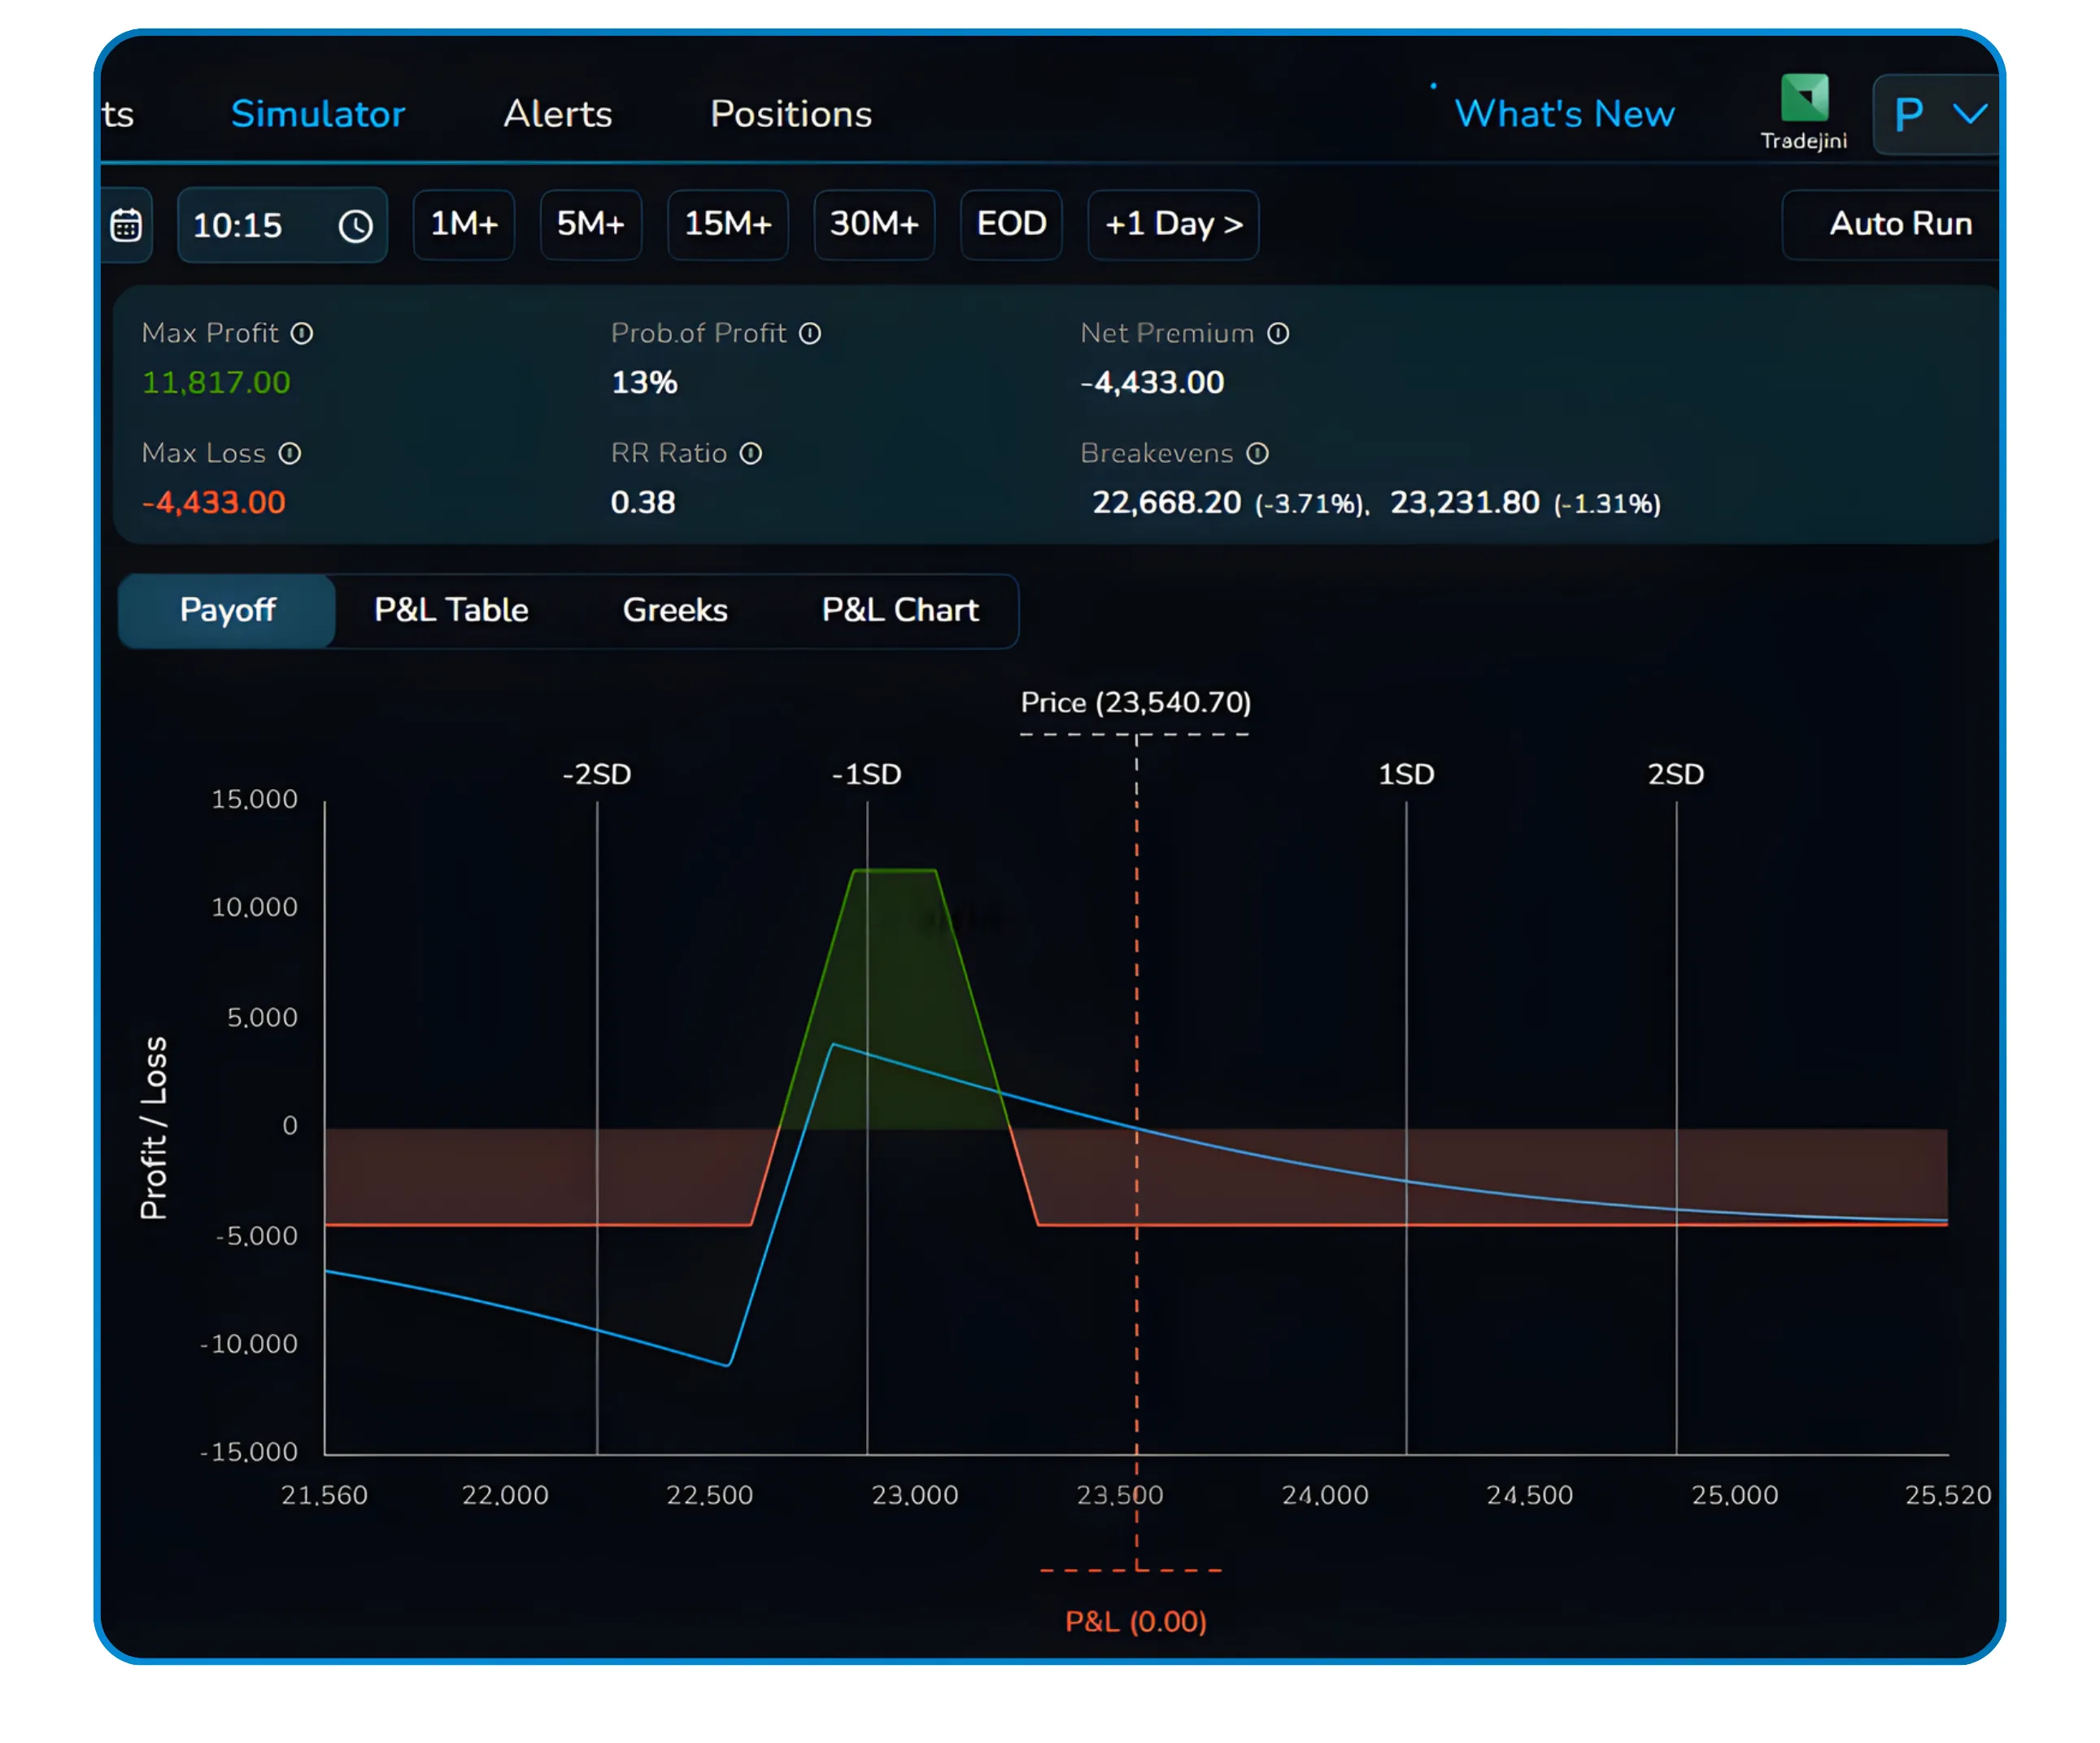
This is where the Simulator becomes genuinely instructive. As the playback runs, you are watching actual historical price data roll through your strategy in motion, not a hypothetical projection. The payoff chart reshapes itself, P&L values tick up or down, and the key metrics in the summary bar update continuously.
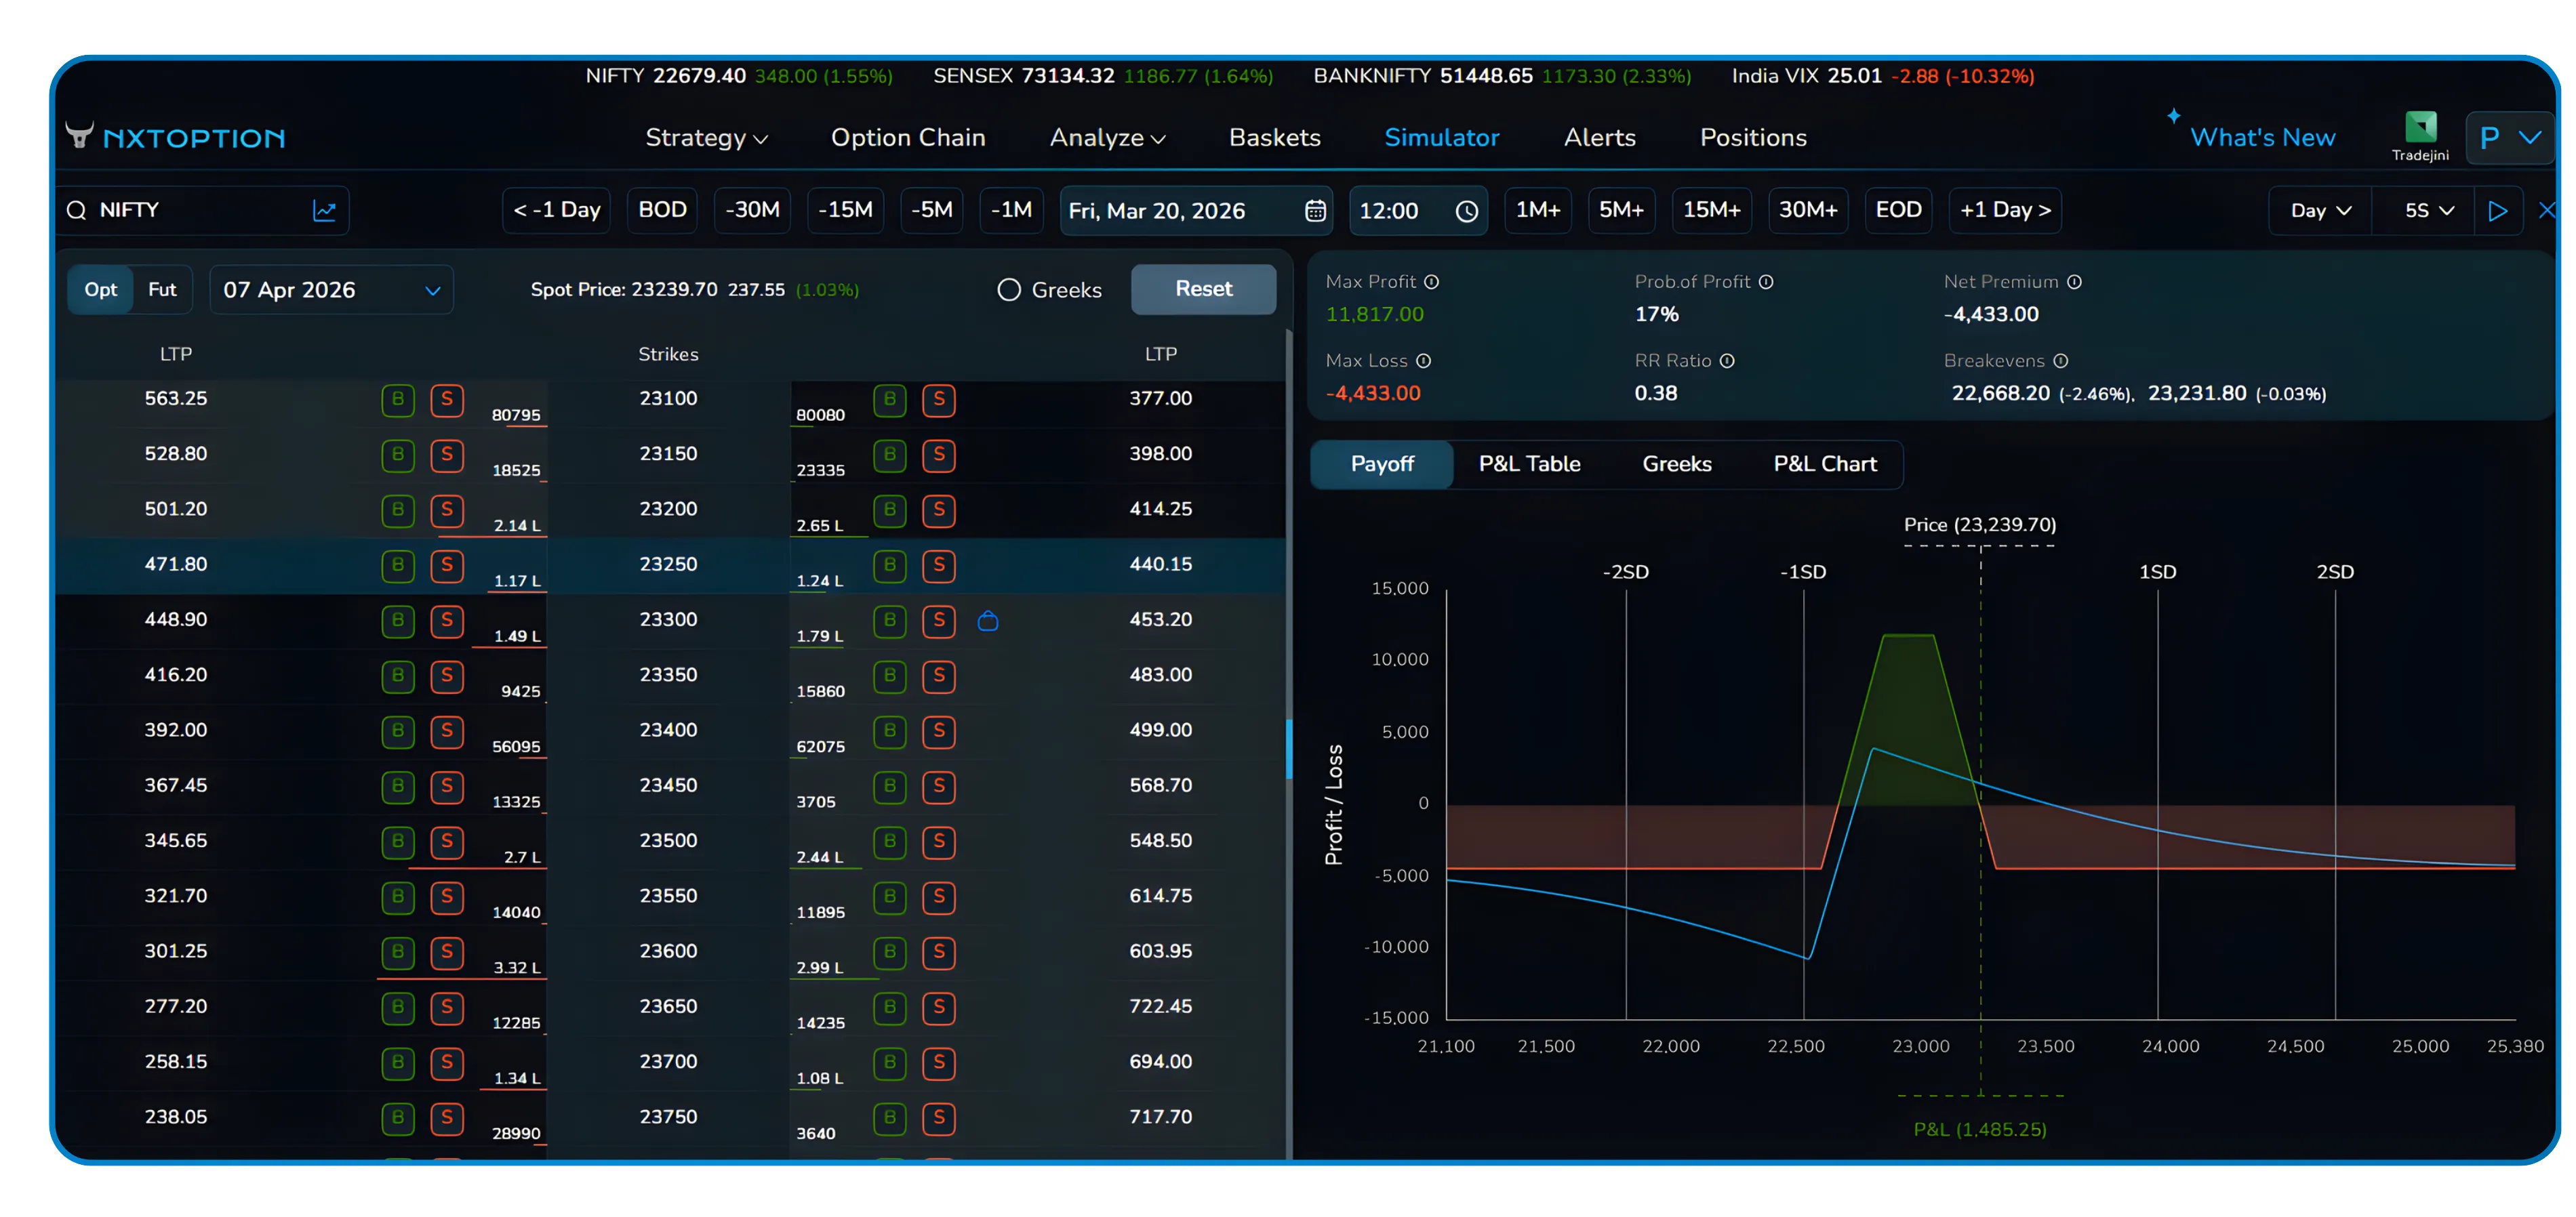
The example captured in the walkthrough shows a Bear Condor position entered on March 17, 2026. As the simulation advances day by day and candle by candle, the position, which started at a P&L of 0, moves through periods of loss and eventually crosses into positive territory by March 20, 2026.
The payoff diagram shows the real-time P&L point moving along the curve as the underlying price changes. You can see the green profitable zone expand or contract, the current price marker shift, and the P&L readout at the bottom of the chart go from neutral to positive or negative depending on where the market moves.
Multiple simulation frames from different dates are visible in the walkthrough, showing the spot price shifting from roughly 23,540 on March 17 to 23,119 on March 20 and then to 22,733 by April 1. Each shift changes the shape of the live payoff profile and the running P&L figure, making it easy to understand precisely when the strategy was working and when it was under pressure.
Pausing mid-simulation is as simple as clicking the pause button. This is useful when a particularly significant market move occurs and you want to study the state of the strategy without the numbers continuing to change underneath you.
7 Deep Analysis
Four Tabs for a Complete Picture
At any point during or after the simulation, you can switch between four analytical views using the tab bar at the bottom of the strategy panel. Each tab answers a different question about your position.
For traders in India who want to conduct options strategy analysis beyond simple P&L tracking, these four tabs collectively make NxtOption one of the most complete options trading tools India has available for retail participants. Each view is purpose-built to isolate a specific dimension of risk, so the analysis is structured rather than overwhelming.
Payoff Tab
The Payoff tab shows the visual payoff chart with your current P&L point overlaid. It is the most intuitive view and the one that stays open by default during simulation playback.
P&L Table Tab
The P&L Table breaks down every individual leg of the strategy, showing each instrument's target P&L, target price, entry price, and current LTP. This leg-by-leg breakdown is essential when you want to understand which part of a multi-leg structure is contributing to gains or dragging down performance.
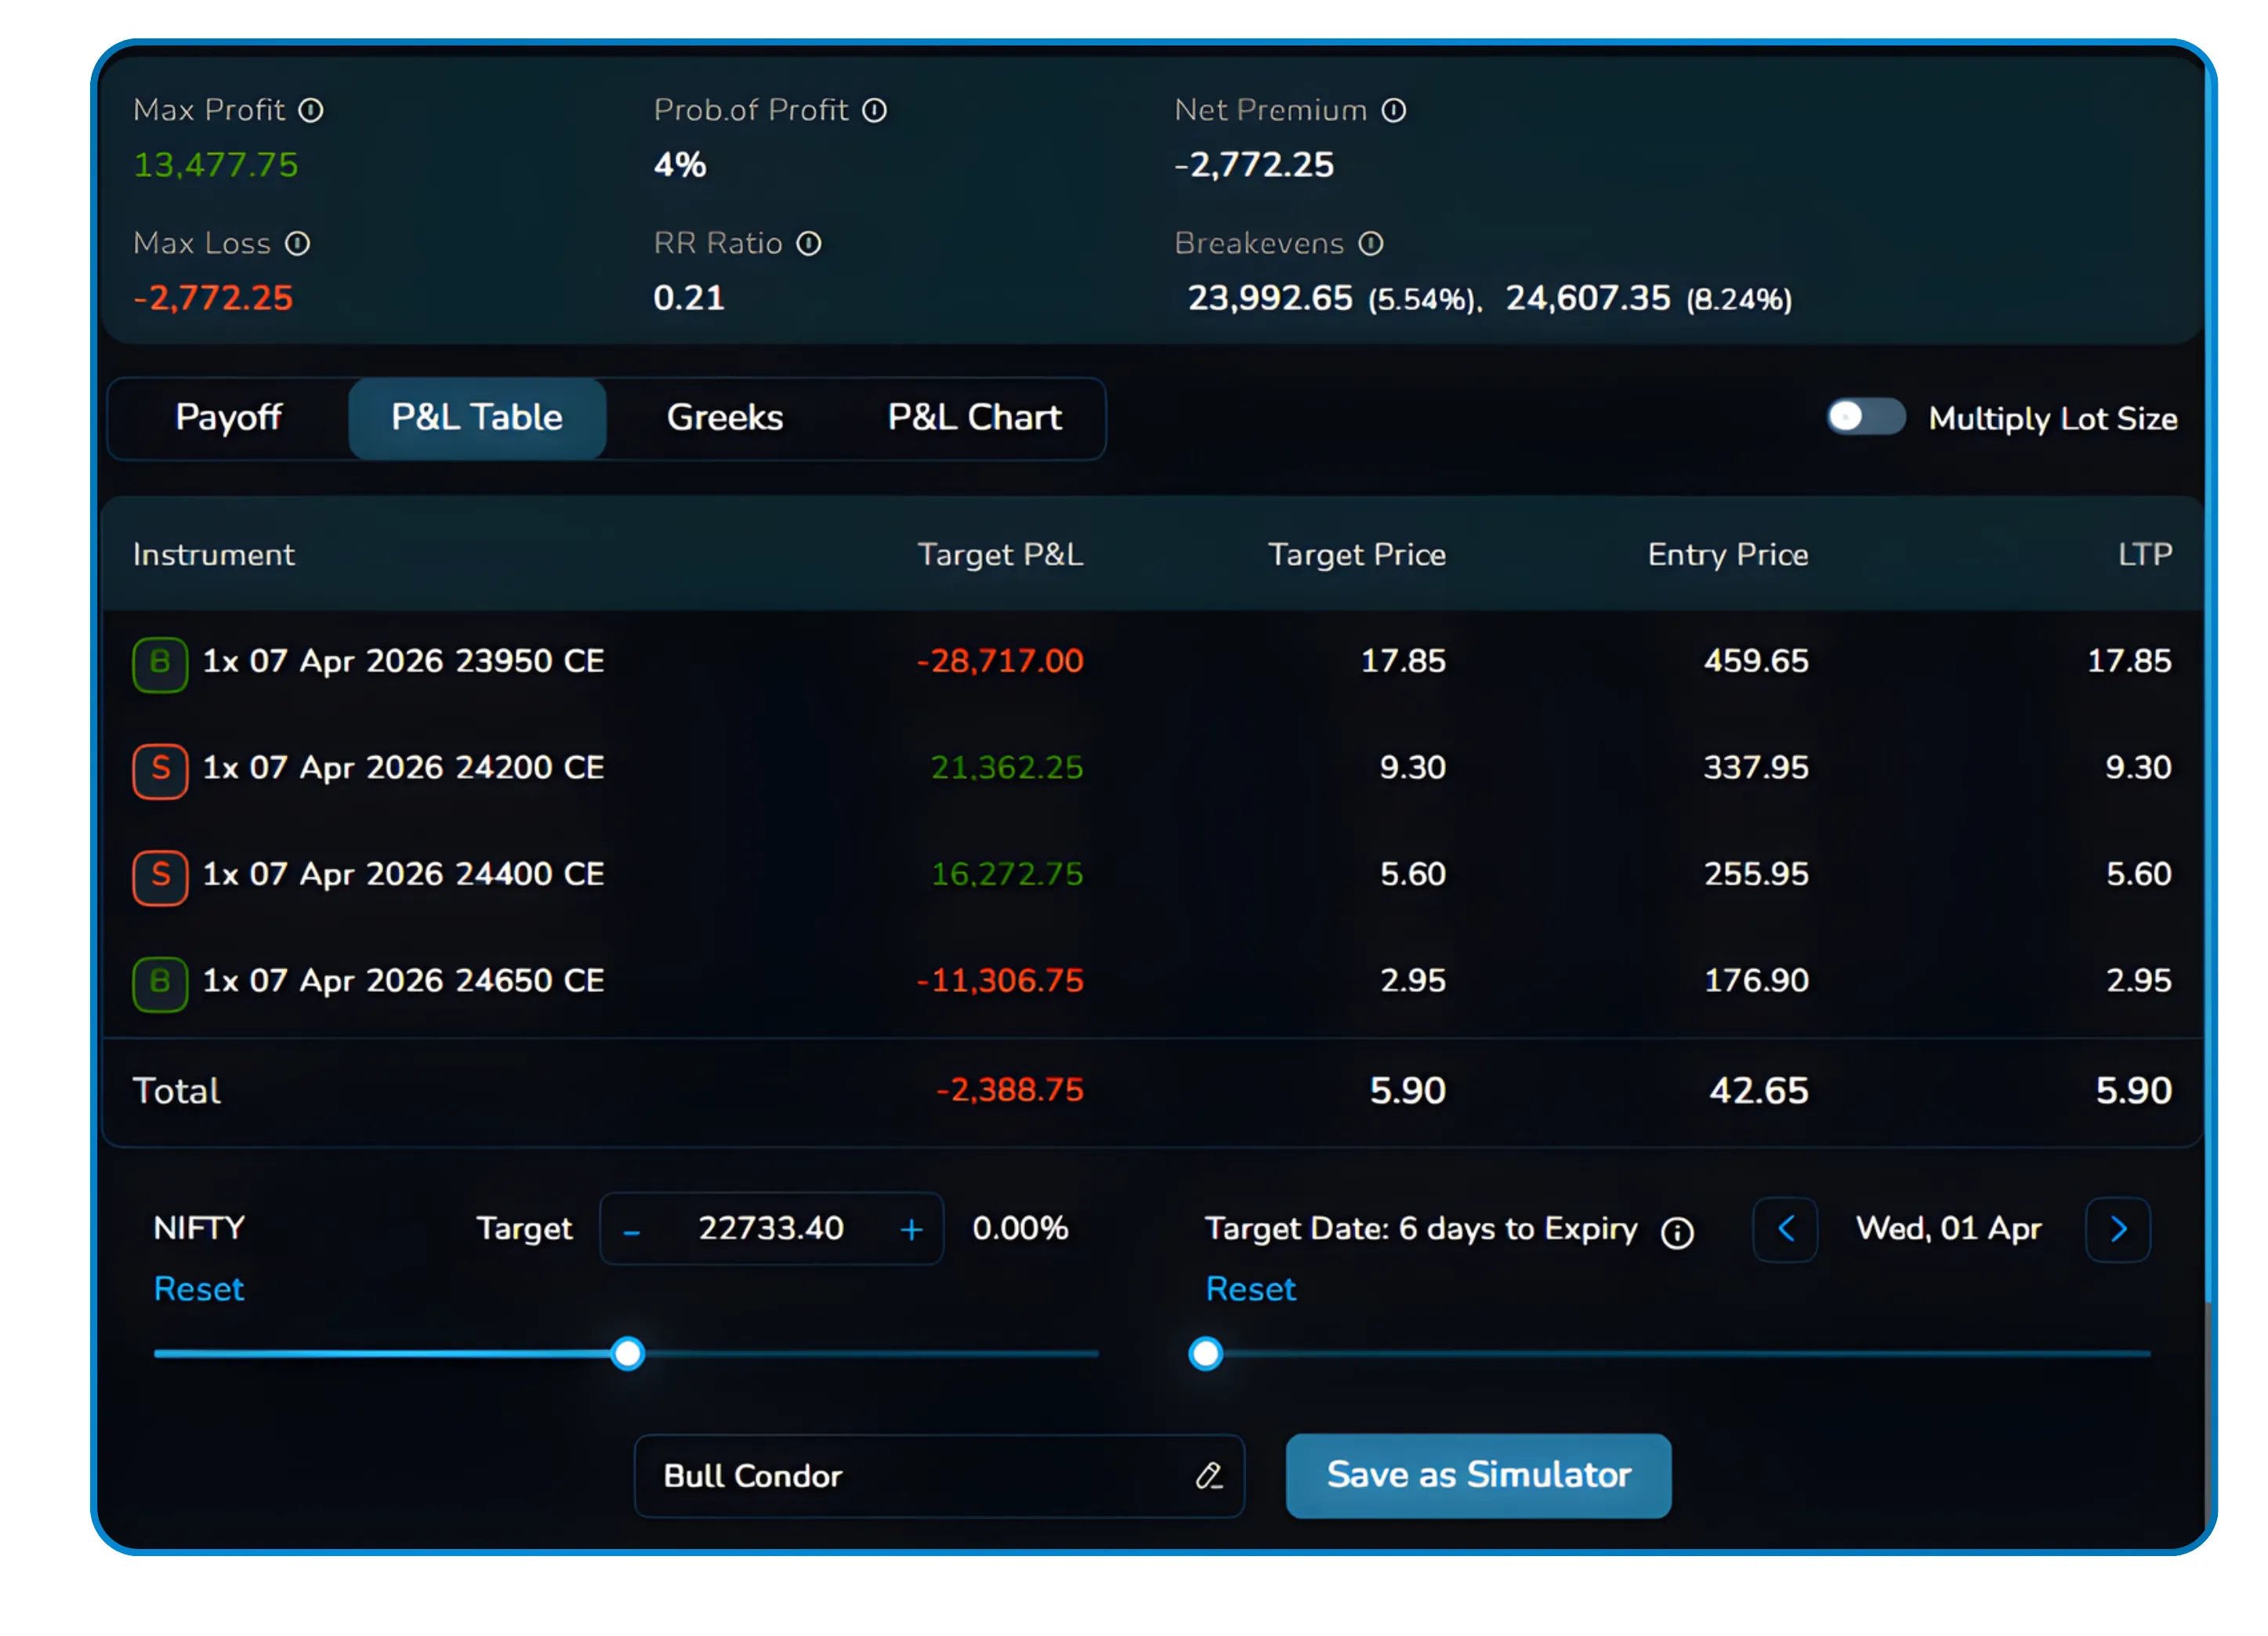
The example shown is a Bull Condor with four legs across different CE strikes. The total row at the bottom aggregates the contribution of all legs so you always see the net position at a glance.
Greeks Tab
The Greeks tab presents a per-leg breakdown of Delta, Theta, Gamma, and Vega. For multi-leg strategies where the net Greek exposure is the product of offsetting long and short positions, this view shows precisely how each leg contributes to the overall risk profile.
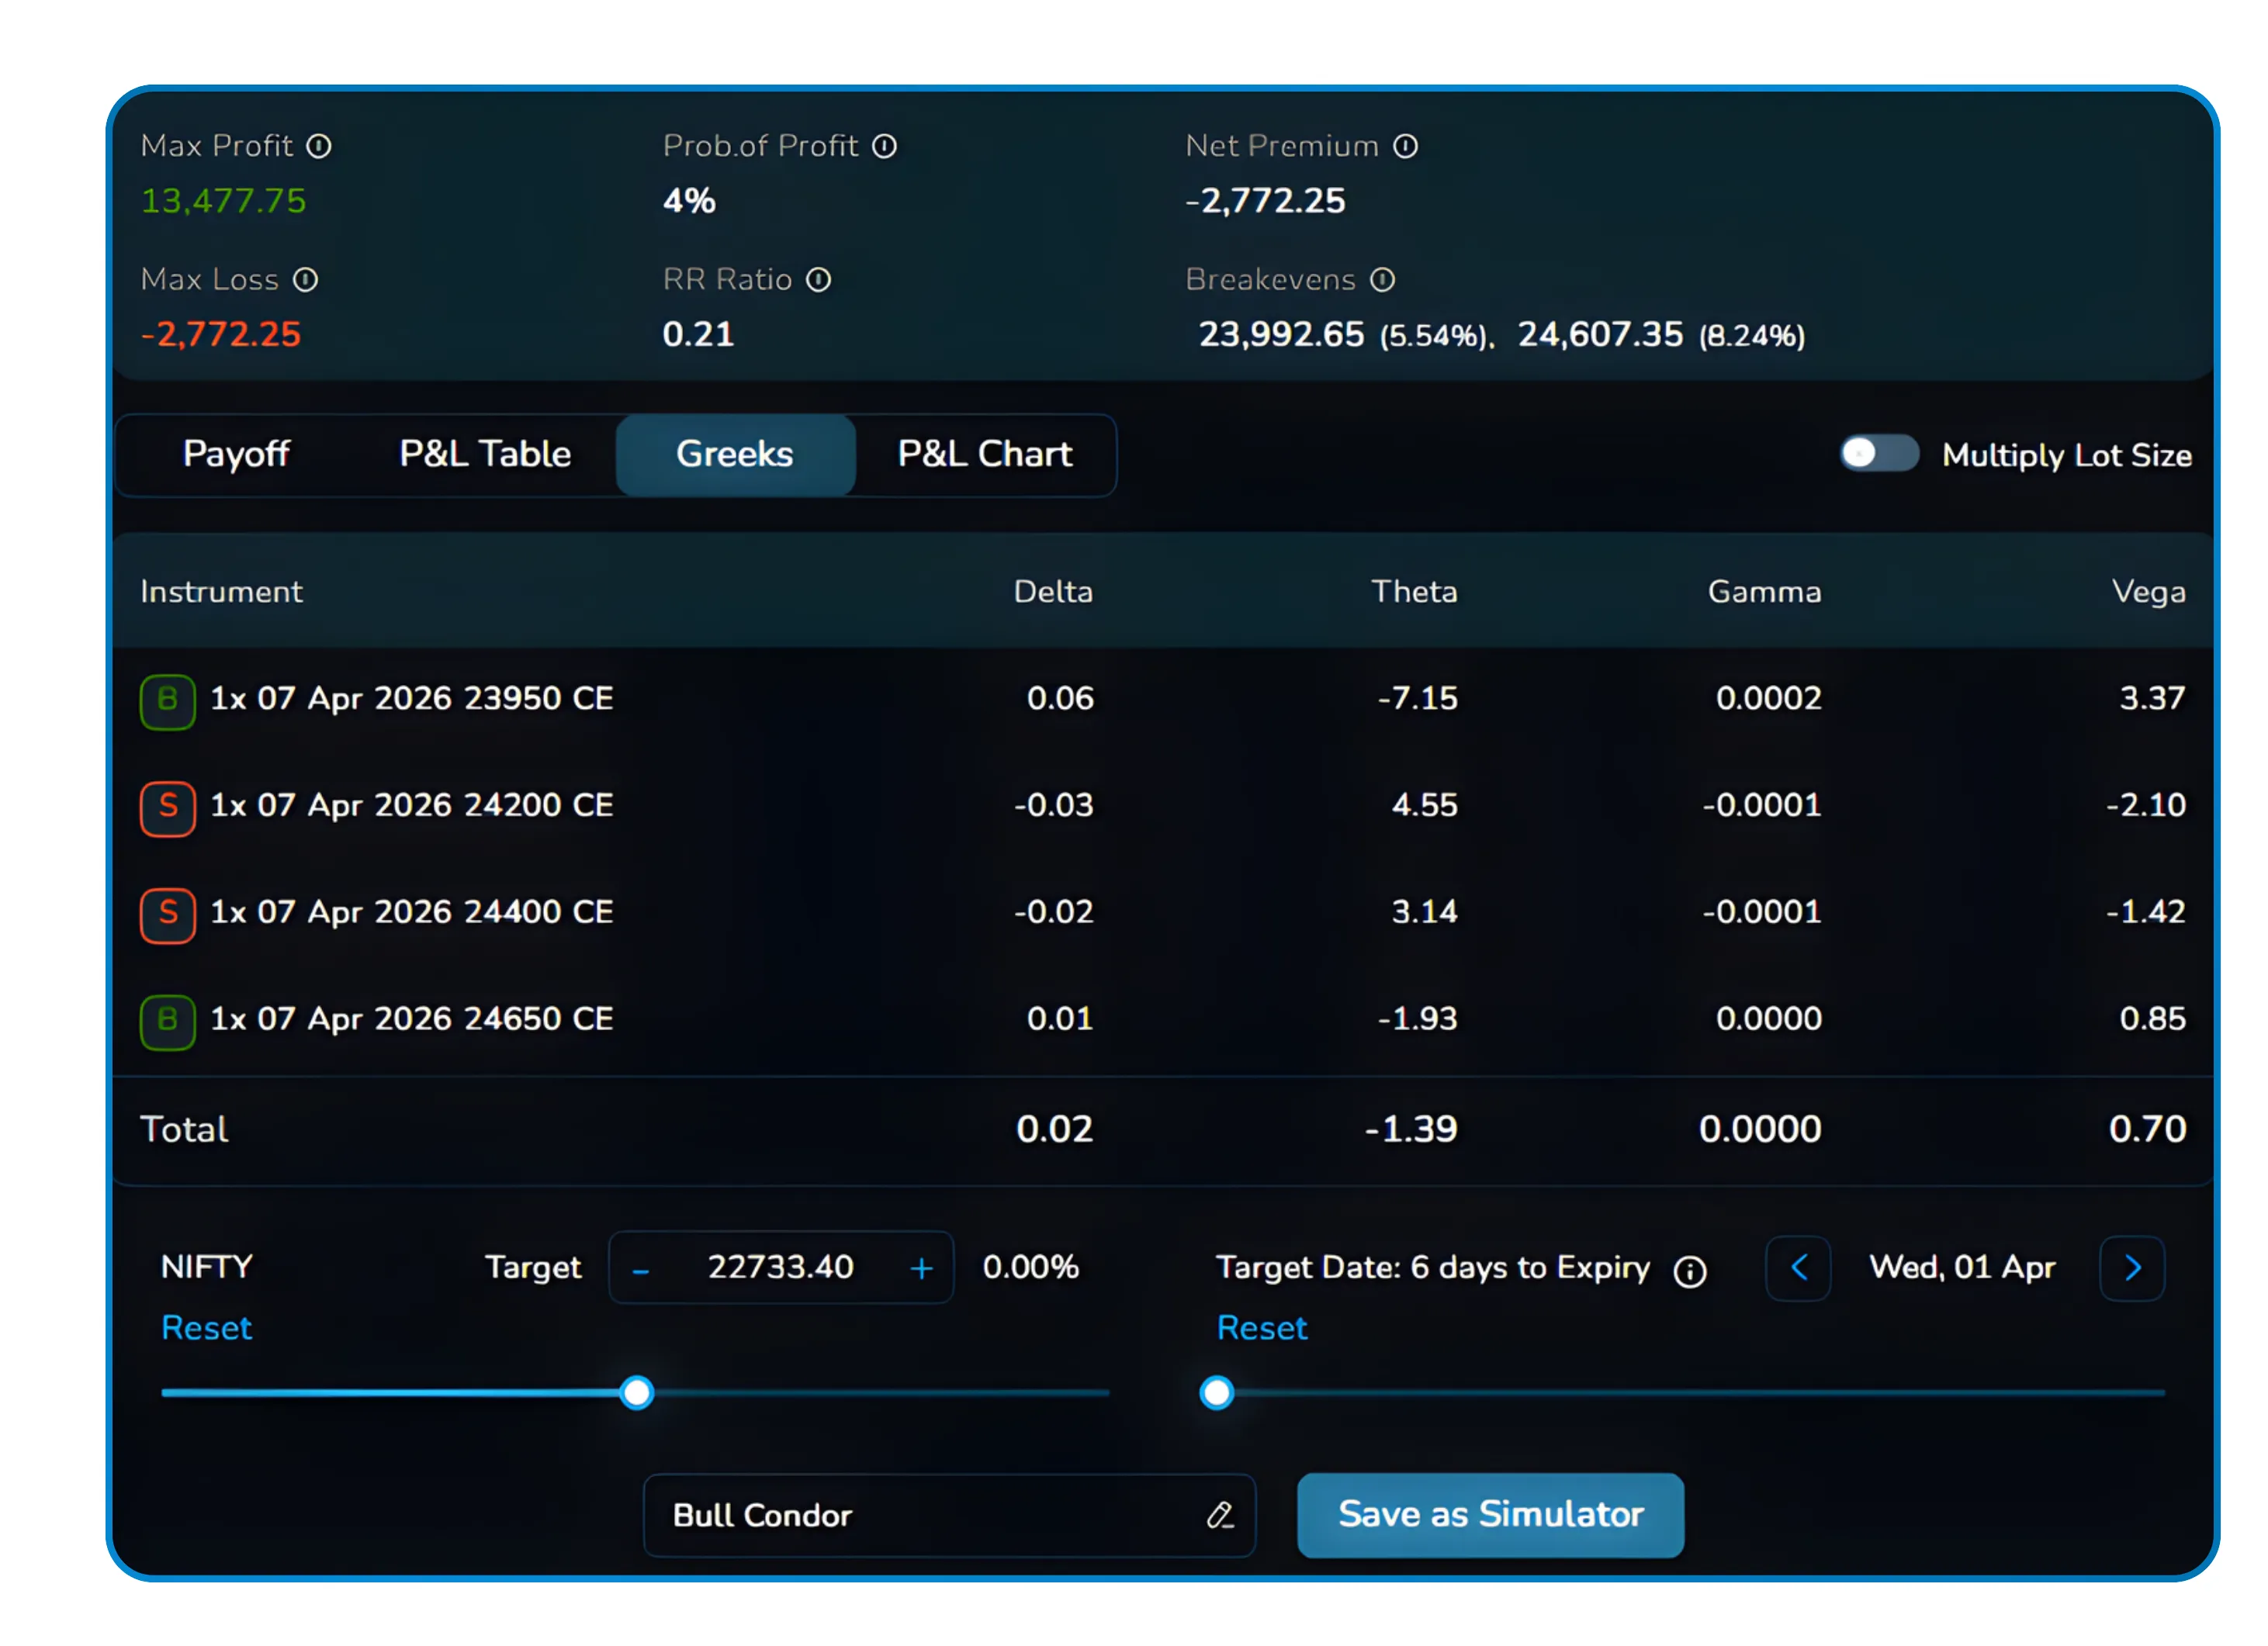
In the example shown, the total Delta is a near-flat 0.02, confirming the position is largely delta-neutral at that moment in the simulation. The total Theta of -1.39 reveals a small daily time decay drag, while the net Vega of 0.70 indicates modest positive sensitivity to volatility.
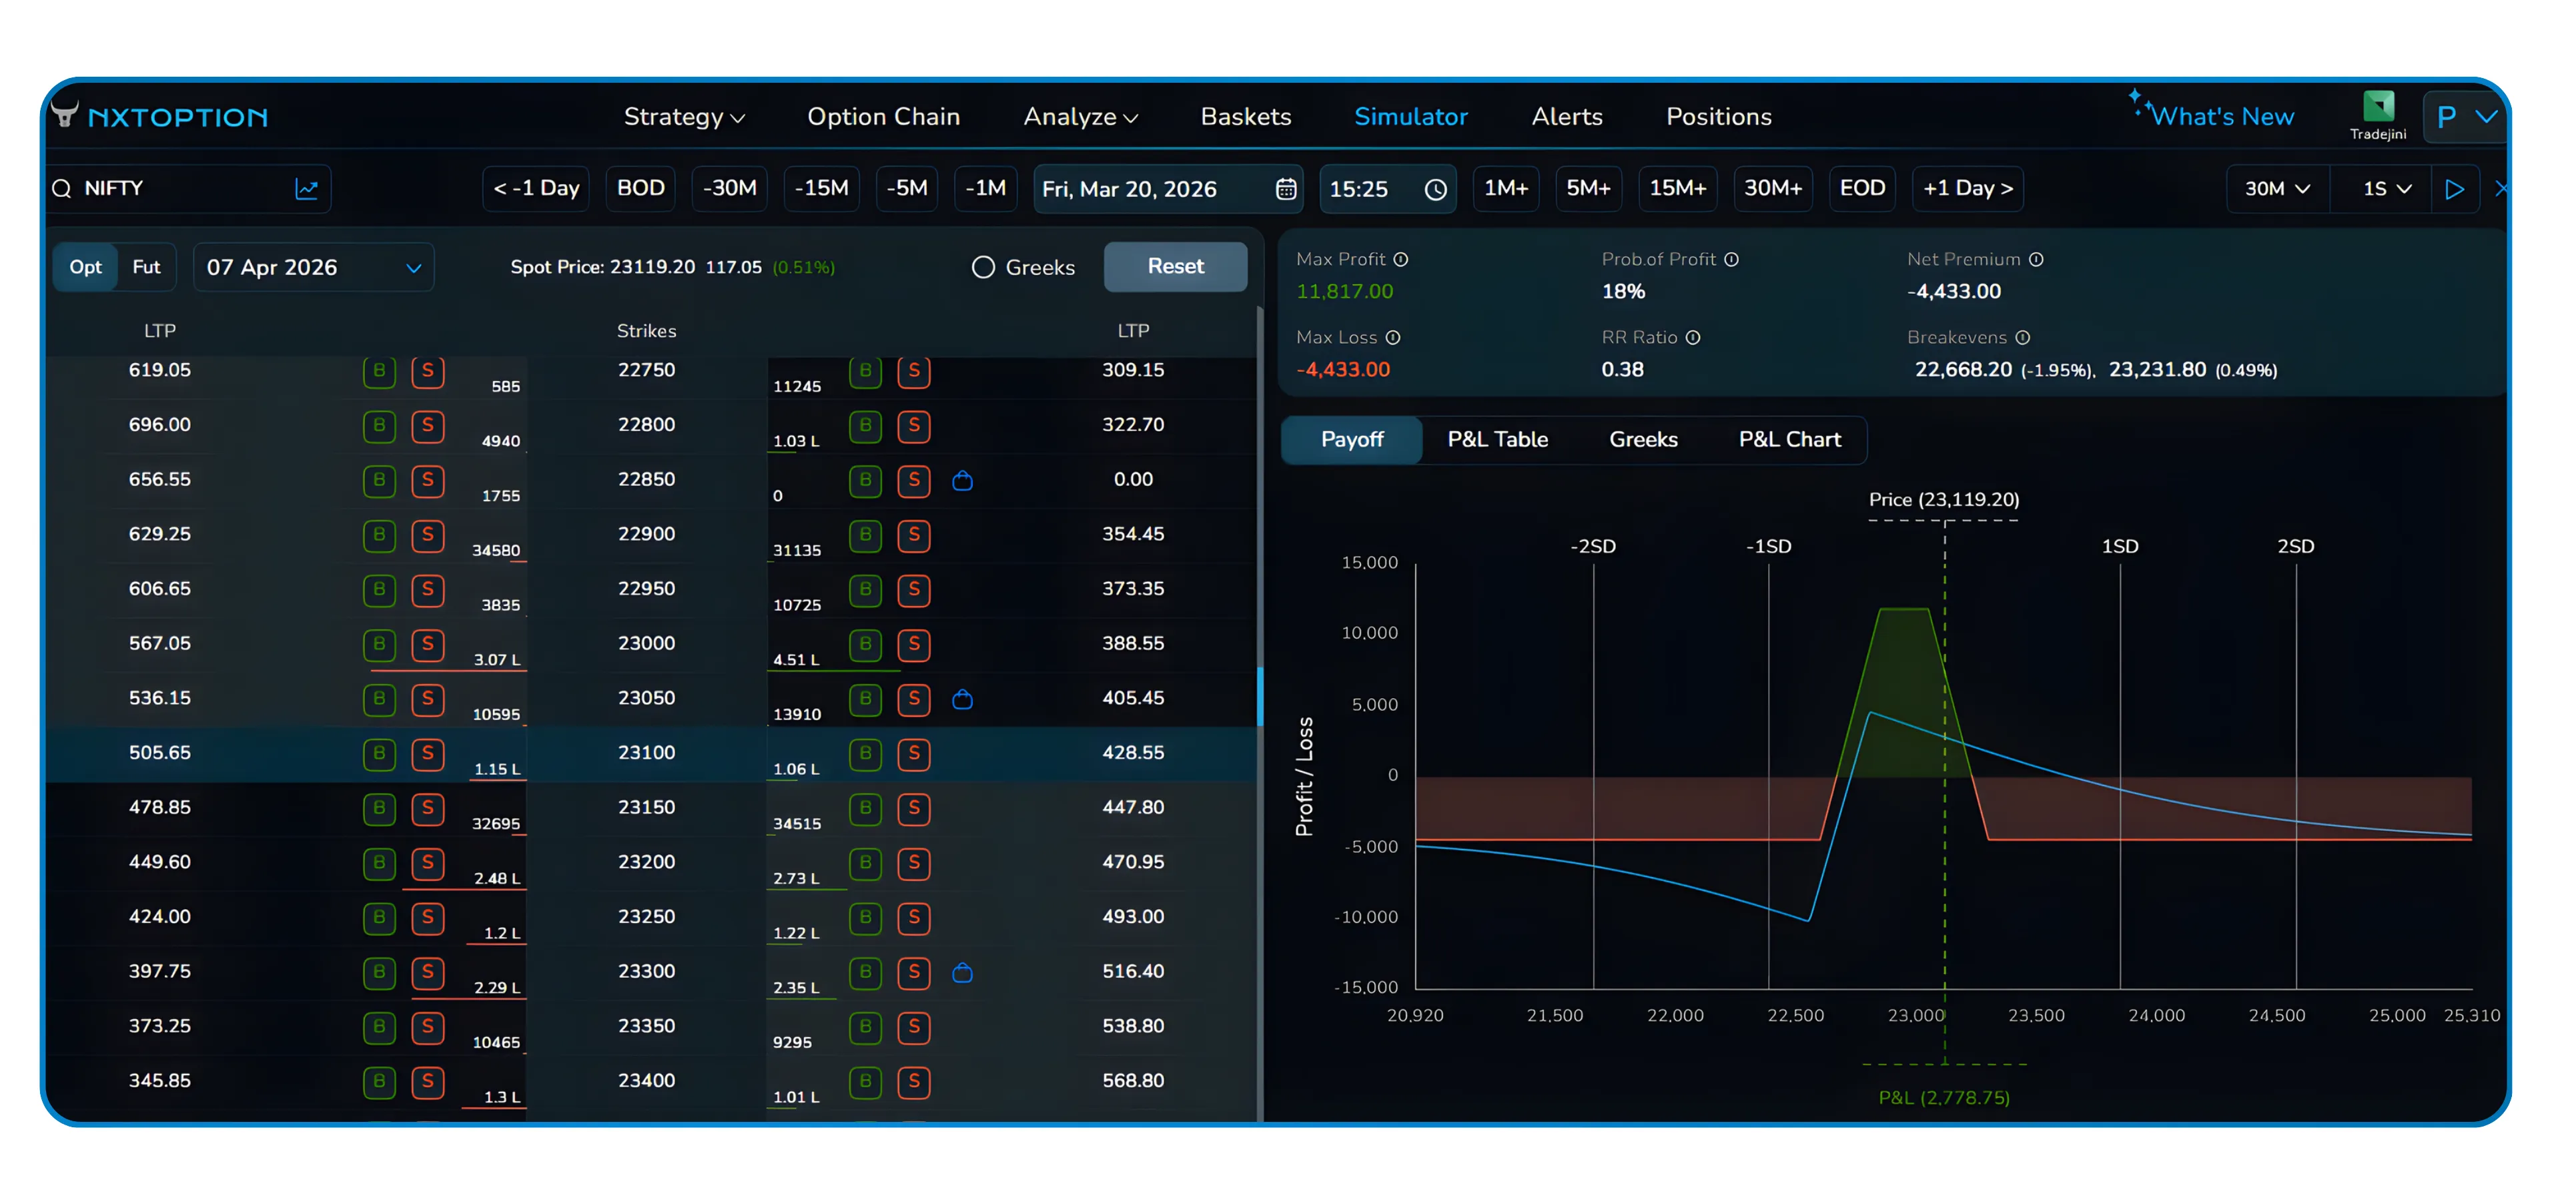
P&L Chart Tab
The P&L Chart is a time-series chart that plots your running profit and loss over the course of the simulation. Unlike the payoff diagram which shows the theoretical shape against underlying price, the P&L Chart shows the historical path of your actual P&L as time moved forward. It is the clearest way to see whether your strategy made or lost money progressively and at what point the turning moments occurred.
8 Saving Your Work
Save as Simulator for Future Sessions
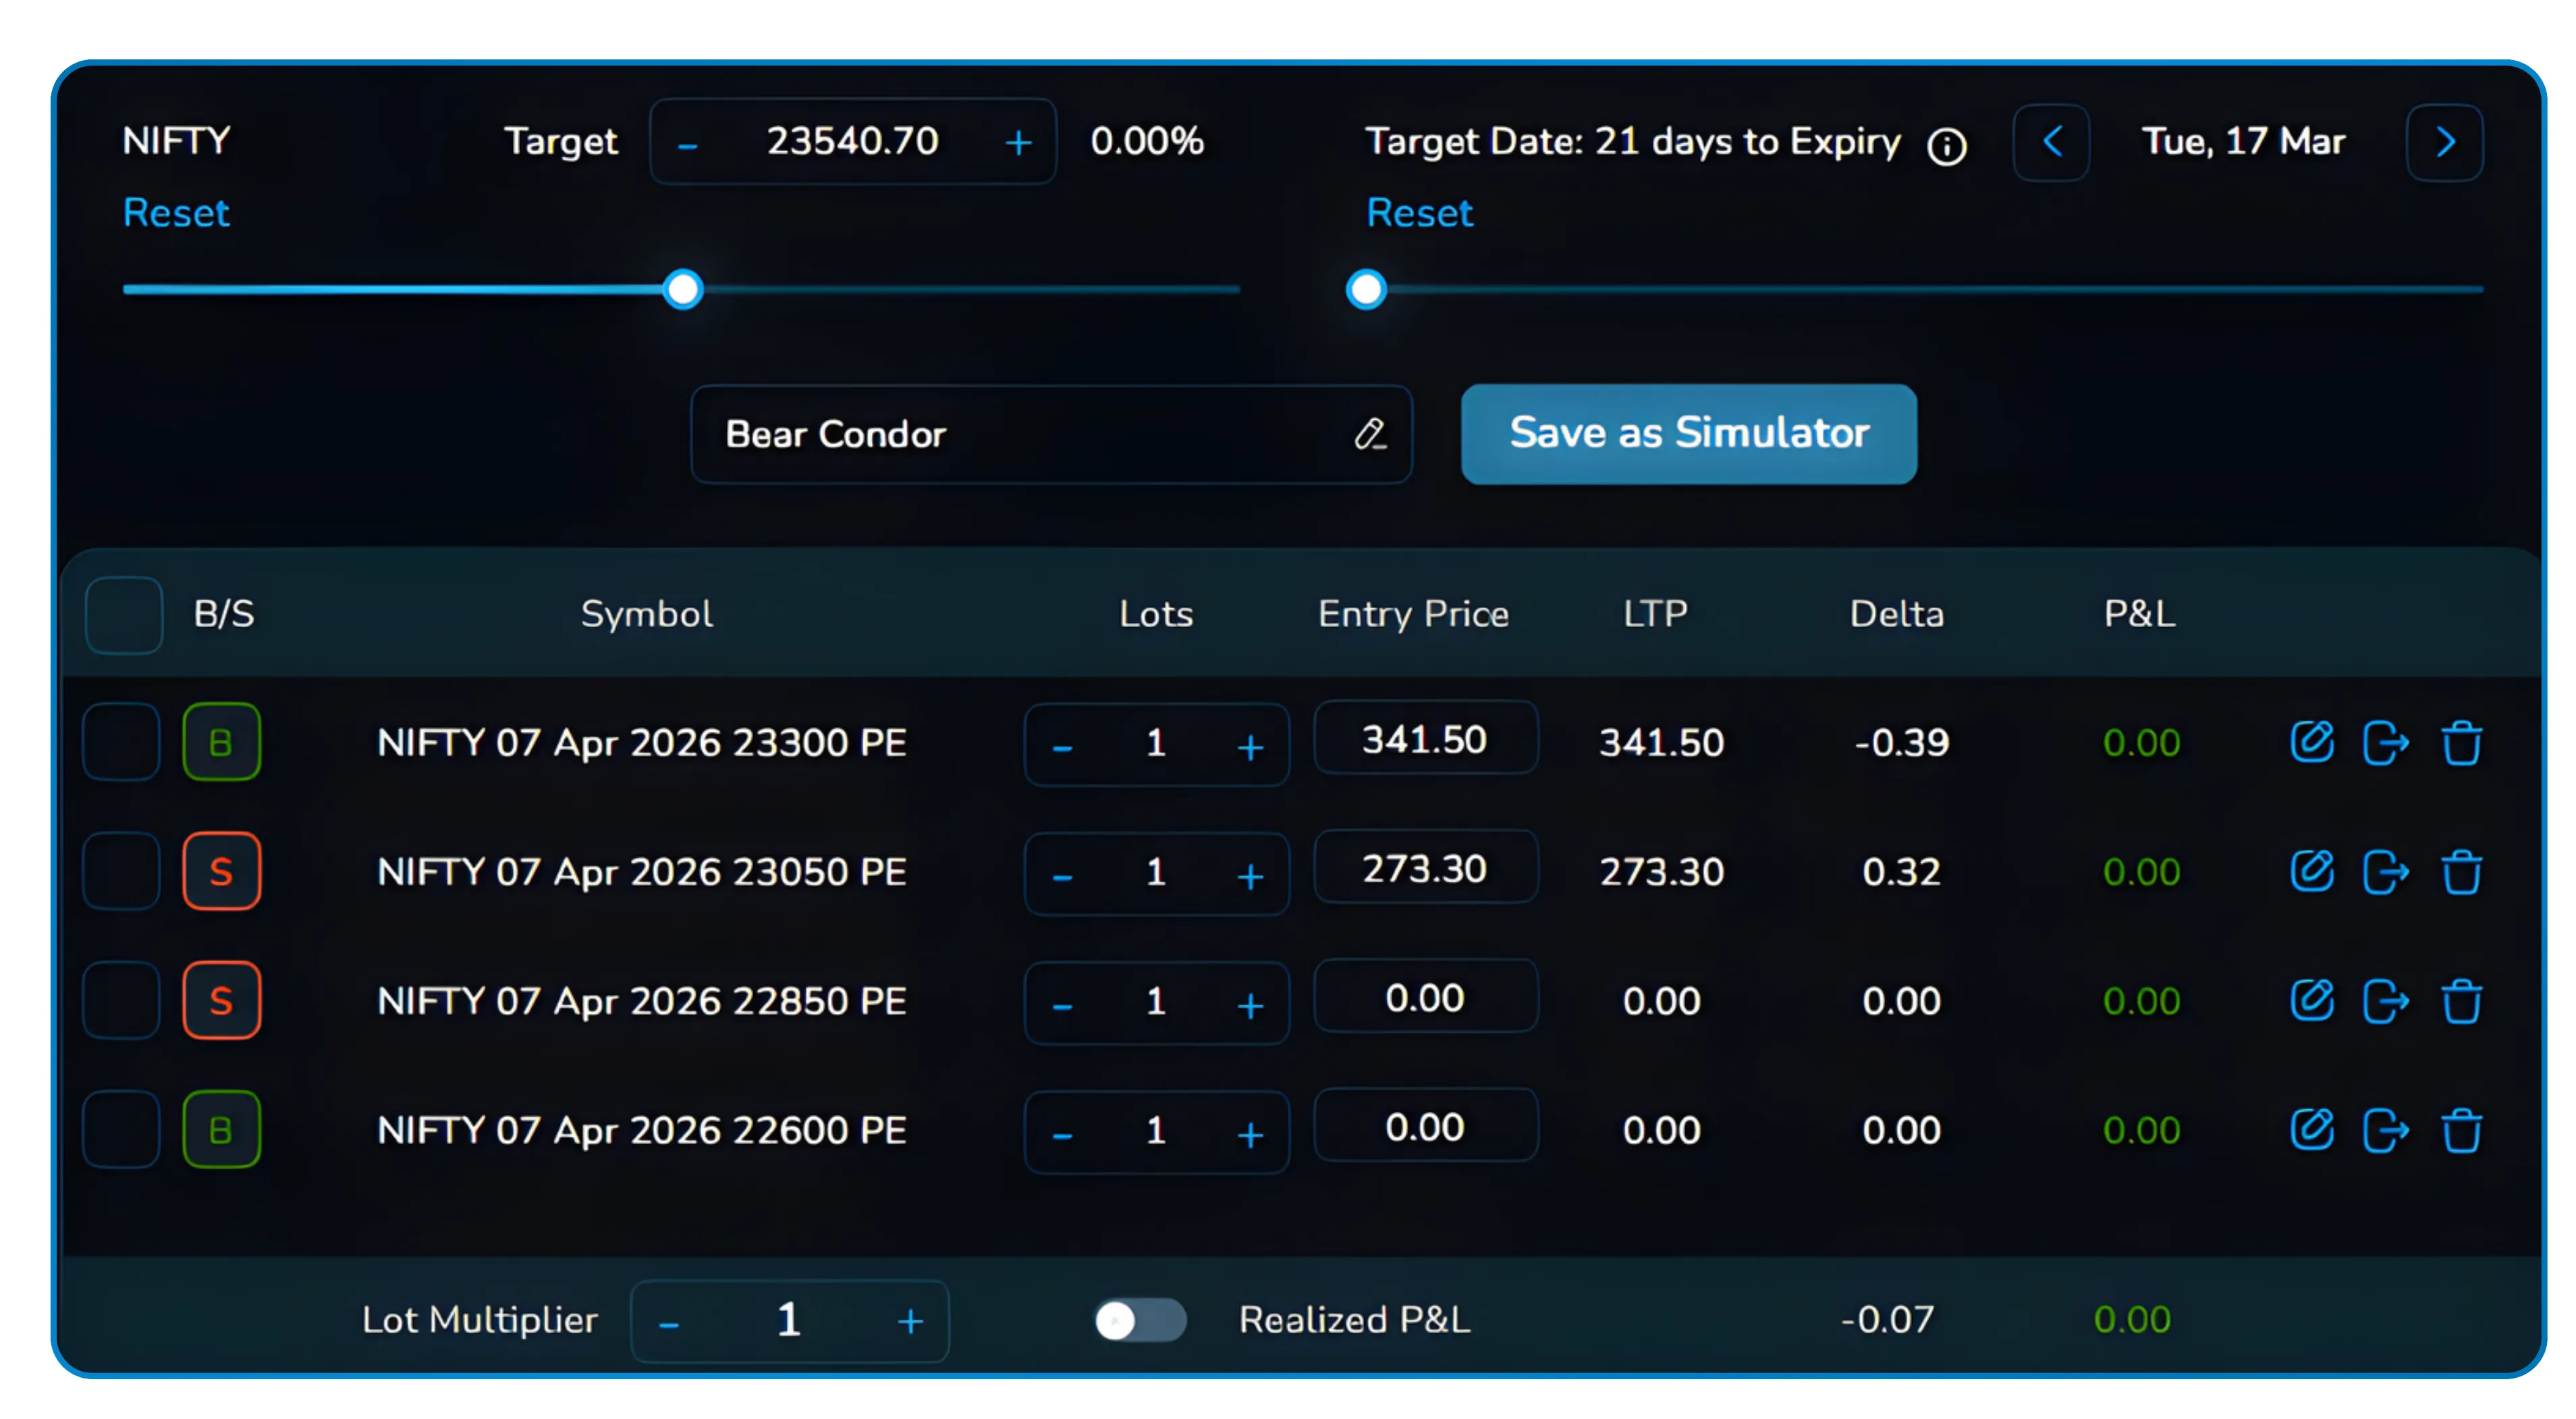
If you build a strategy setup you want to revisit, the platform includes a "Save as Simulator" button at the bottom of the strategy configuration panel. This saves the full setup including the instrument, expiry, legs, and lot configuration so you can reload it in a future session without rebuilding everything from scratch.
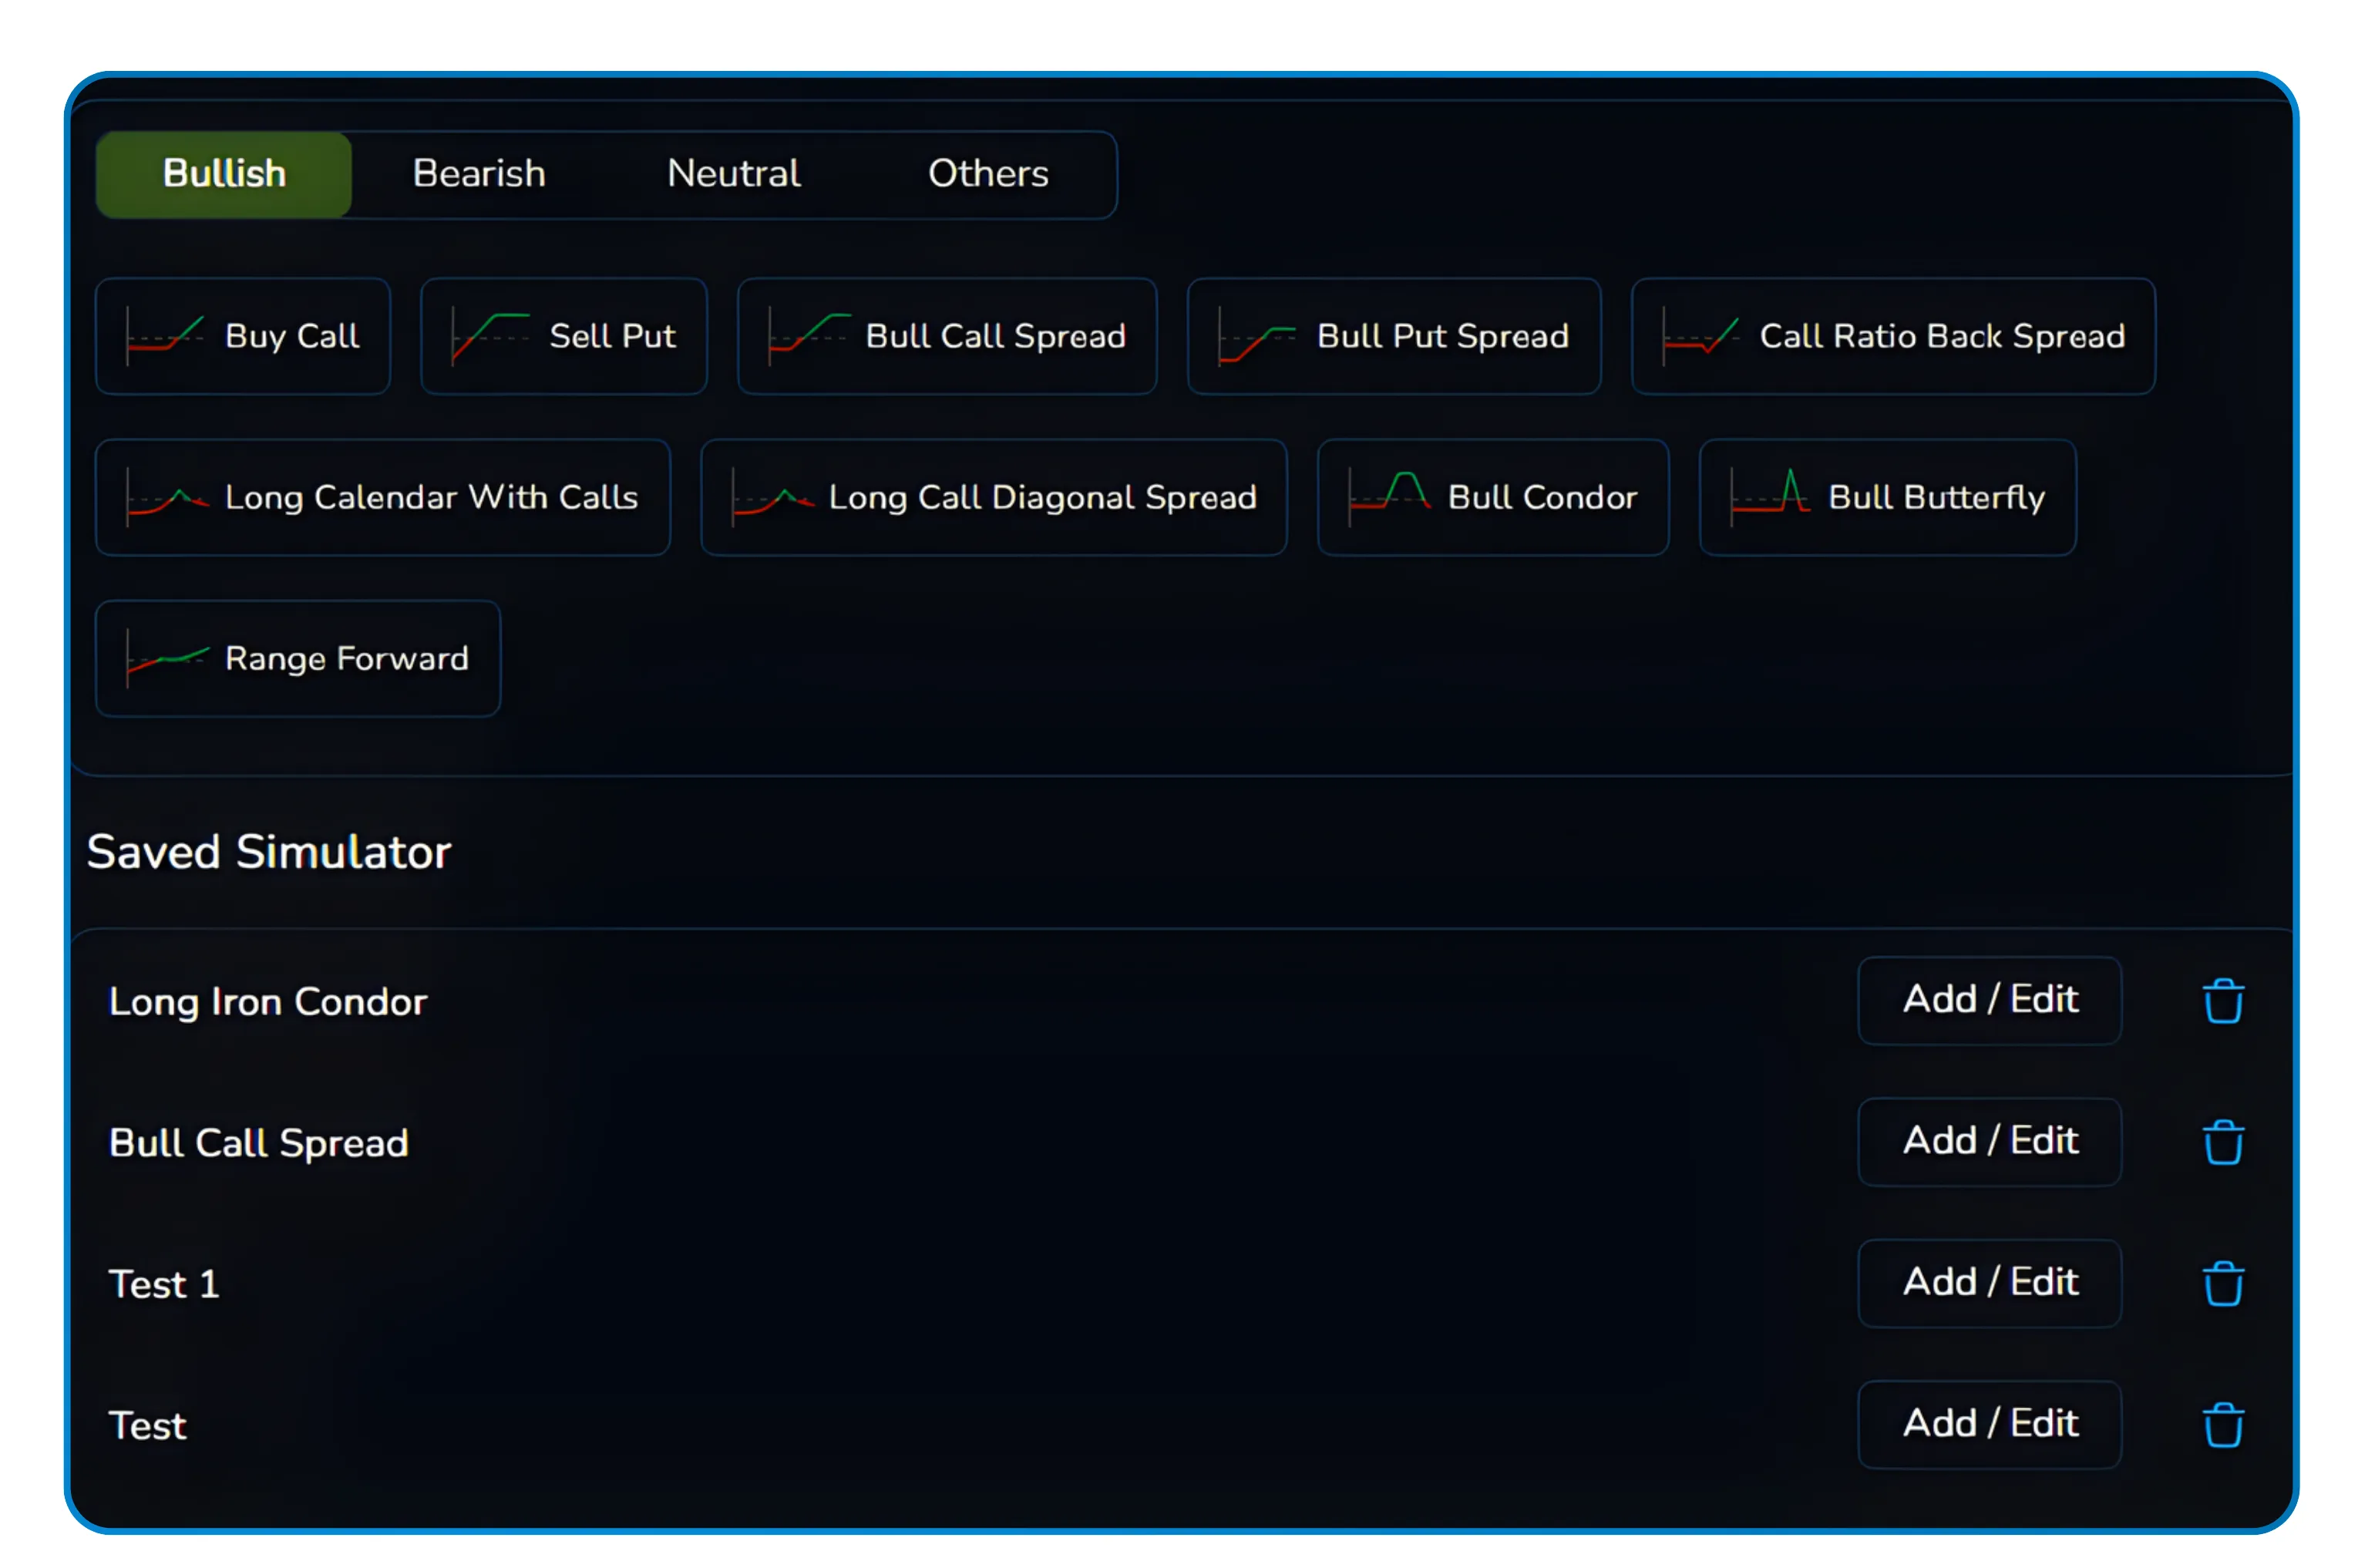
Saved simulators appear in the Saved Simulator section of the right panel on the dashboard, making it easy to maintain a library of scenarios you test regularly. Whether that is a weekly expiry iron condor setup or a recurring spread strategy you run every month, your configurations stay accessible.
Practice Is the Edge
The NxtOption Simulator removes the cost of learning. Every strategy you would have traded blind, you can now walk through historical data, see how it behaved, study the Greeks across market conditions, and arrive at your actual trading session with genuine conviction rather than theory alone. That is the advantage it is built to give you.
For traders in India who want to learn how to backtest options strategies with actual NSE data, the Simulator removes the guesswork that comes with theory alone. Options backtesting in India has historically been inaccessible to retail traders without expensive institutional tools, but the NxtOption Simulator changes that. Consistent options strategy practice in India, using real historical scenarios rather than hypothetical ones, is what builds the pattern recognition that eventually translates into confident, well-reasoned trade decisions.
Disclaimer: The information provided in our blogs is for informational purposes only and should not be construed as financial, investment, or trading advice. Trading and investing in the securities market carries risk. Always conduct your own research and consult with a qualified financial advisor before making any investment decisions. Past performance is not indicative of future results. Copyrighted and original content for your trading and investing needs.
© 2026 — Tradejini. All Rights Reserved.