


If you’ve ever wondered why your exchange-traded fund returns don’t perfectly match the underlying index, charges are often the culprit. Every ETF comes with a cost structure that quietly chips away at your returns, sometimes by tiny fractions of a percent, sometimes by more.
Understanding what you’re paying for is the first step toward making smarter investment decisions. In this comprehensive guide, we’ll break down every type of ETF charge, show you exactly how they’re deducted, and help you compare costs so you can keep more of your returns over the long haul.
Quick Answer: What ETF Charges Do Investors Actually Pay?
ETF charges primarily consist of ongoing fund fees plus trading-related costs incurred when you buy or sell shares. These costs don’t arrive as separate invoices; they quietly eat your returns over time, which is why many investors underestimate their impact.
Here are the key charges every ETF investor should know:
Expense ratio: The annual fee covering management fees, administration, and operational costs, expressed as a percentage of fund assets. For example, a Nifty 50 ETF in India might charge an annual fee of 0.05%, meaning you pay ₹50 for every ₹1 lakh invested.
Exchange transaction charge: A fee paid to the stock exchange for providing the infrastructure to execute your trade. It is typically 0.00297% of the transaction value.
Brokerage commission: This is typically a percentage like 0.05% (minimum ₹5) of the transaction value or a flat rate such as ₹20 per order in CubePlus, whichever is lower.
Bid-ask spread: The difference between what buyers are willing to pay and what sellers are asking. For example, a liquid ETF might have a spread of 0.02%, where the buy price is ₹100.00, and the sell price is ₹100.02, while an illiquid ETF could have a gap of 1% or more.
Securities transaction tax and stamp duty: Government levies that apply when you buy or sell ETF shares. In India, this usually involves a stamp duty of 0.005% on the purchase value and a securities transaction tax of 0.001% on the sale value. While STT of 0.001% applies to the sale of Equity ETFs, it does NOT apply to Gold ETFs, Liquid ETFs, and other Debt ETFs.
IPFT (Investor Protection Fund Trust) charge: A tiny contribution used to protect investors against broker defaults, usually around 0.0001% of the turnover.
SEBI turnover charge: A regulatory fee levied by the Securities and Exchange Board of India for market oversight. This is charged at 0.0001% (₹10 per crore) of the trade value.
GST (Goods and Services Tax): A tax on the services provided by the broker and the exchange. It is 18% applied to the sum of your brokerage, transaction charges, and SEBI fees.
Premium or discount to NAV: The difference between the ETF’s market price and its NAV. For example, if an ETF's underlying assets are worth ₹100 but it trades at ₹101, you are paying a 1% premium, whereas trading at ₹99 would represent a 1% discount
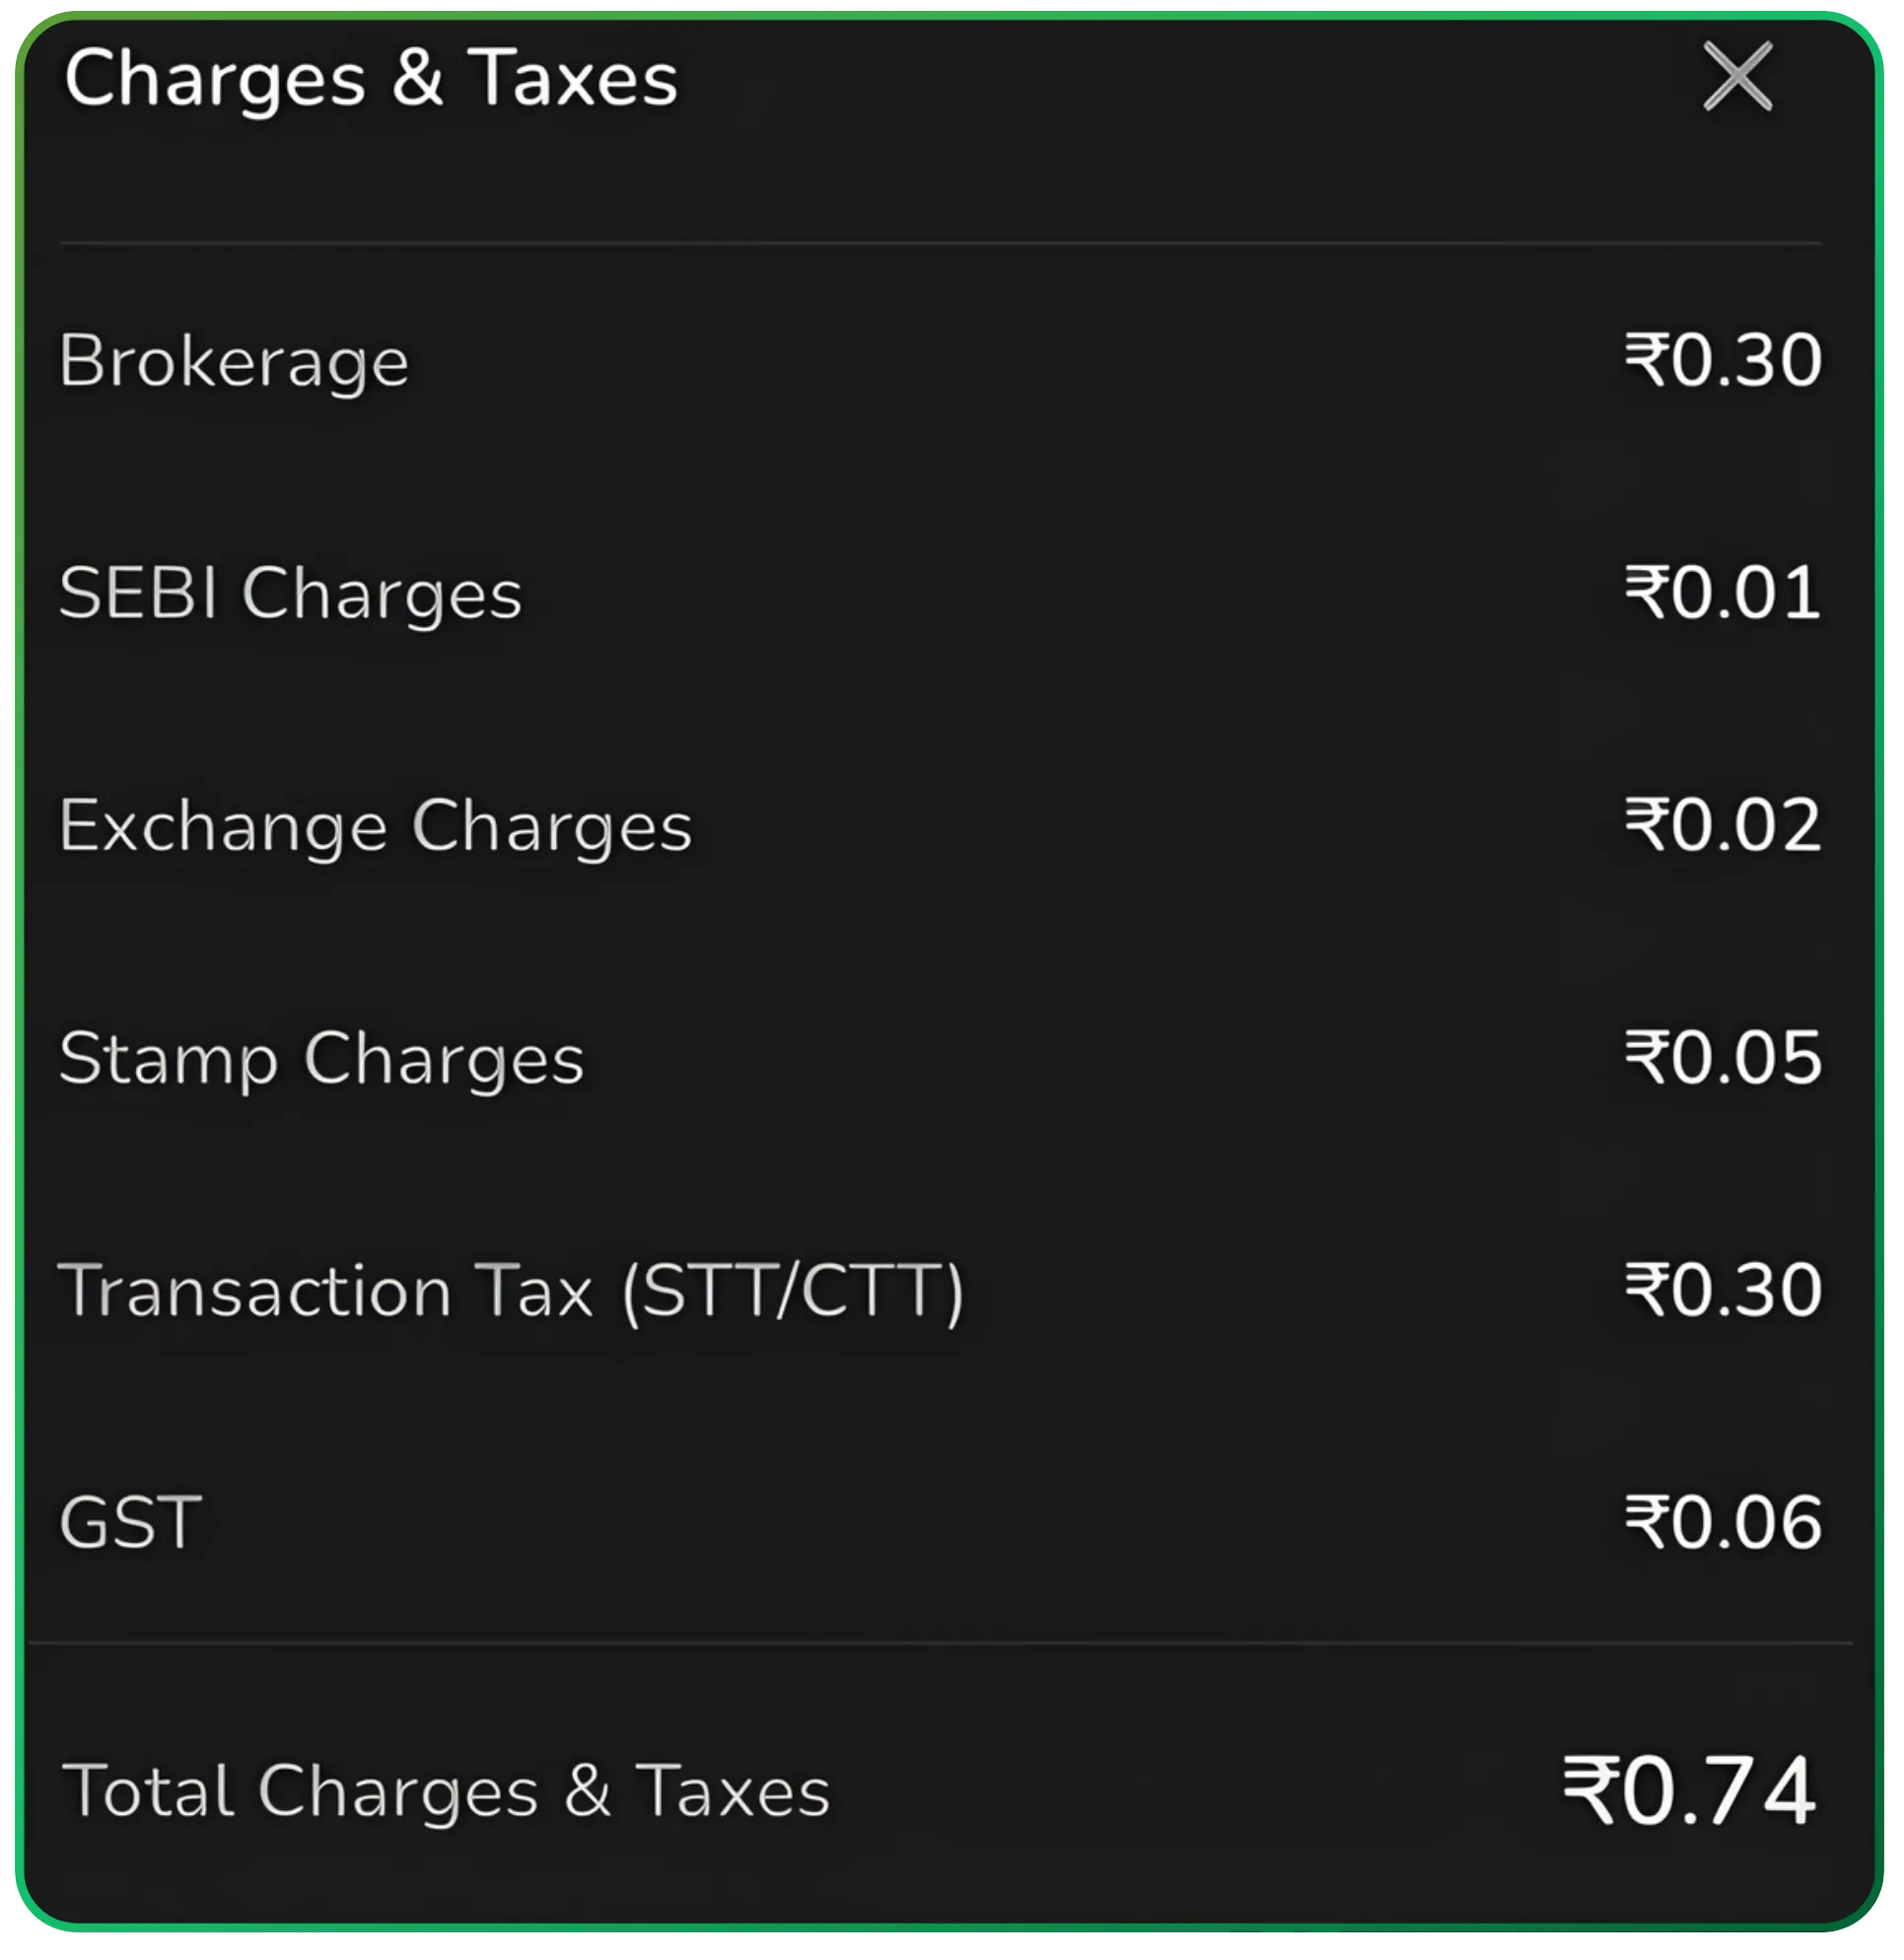
Buy charges for 1 niftybees
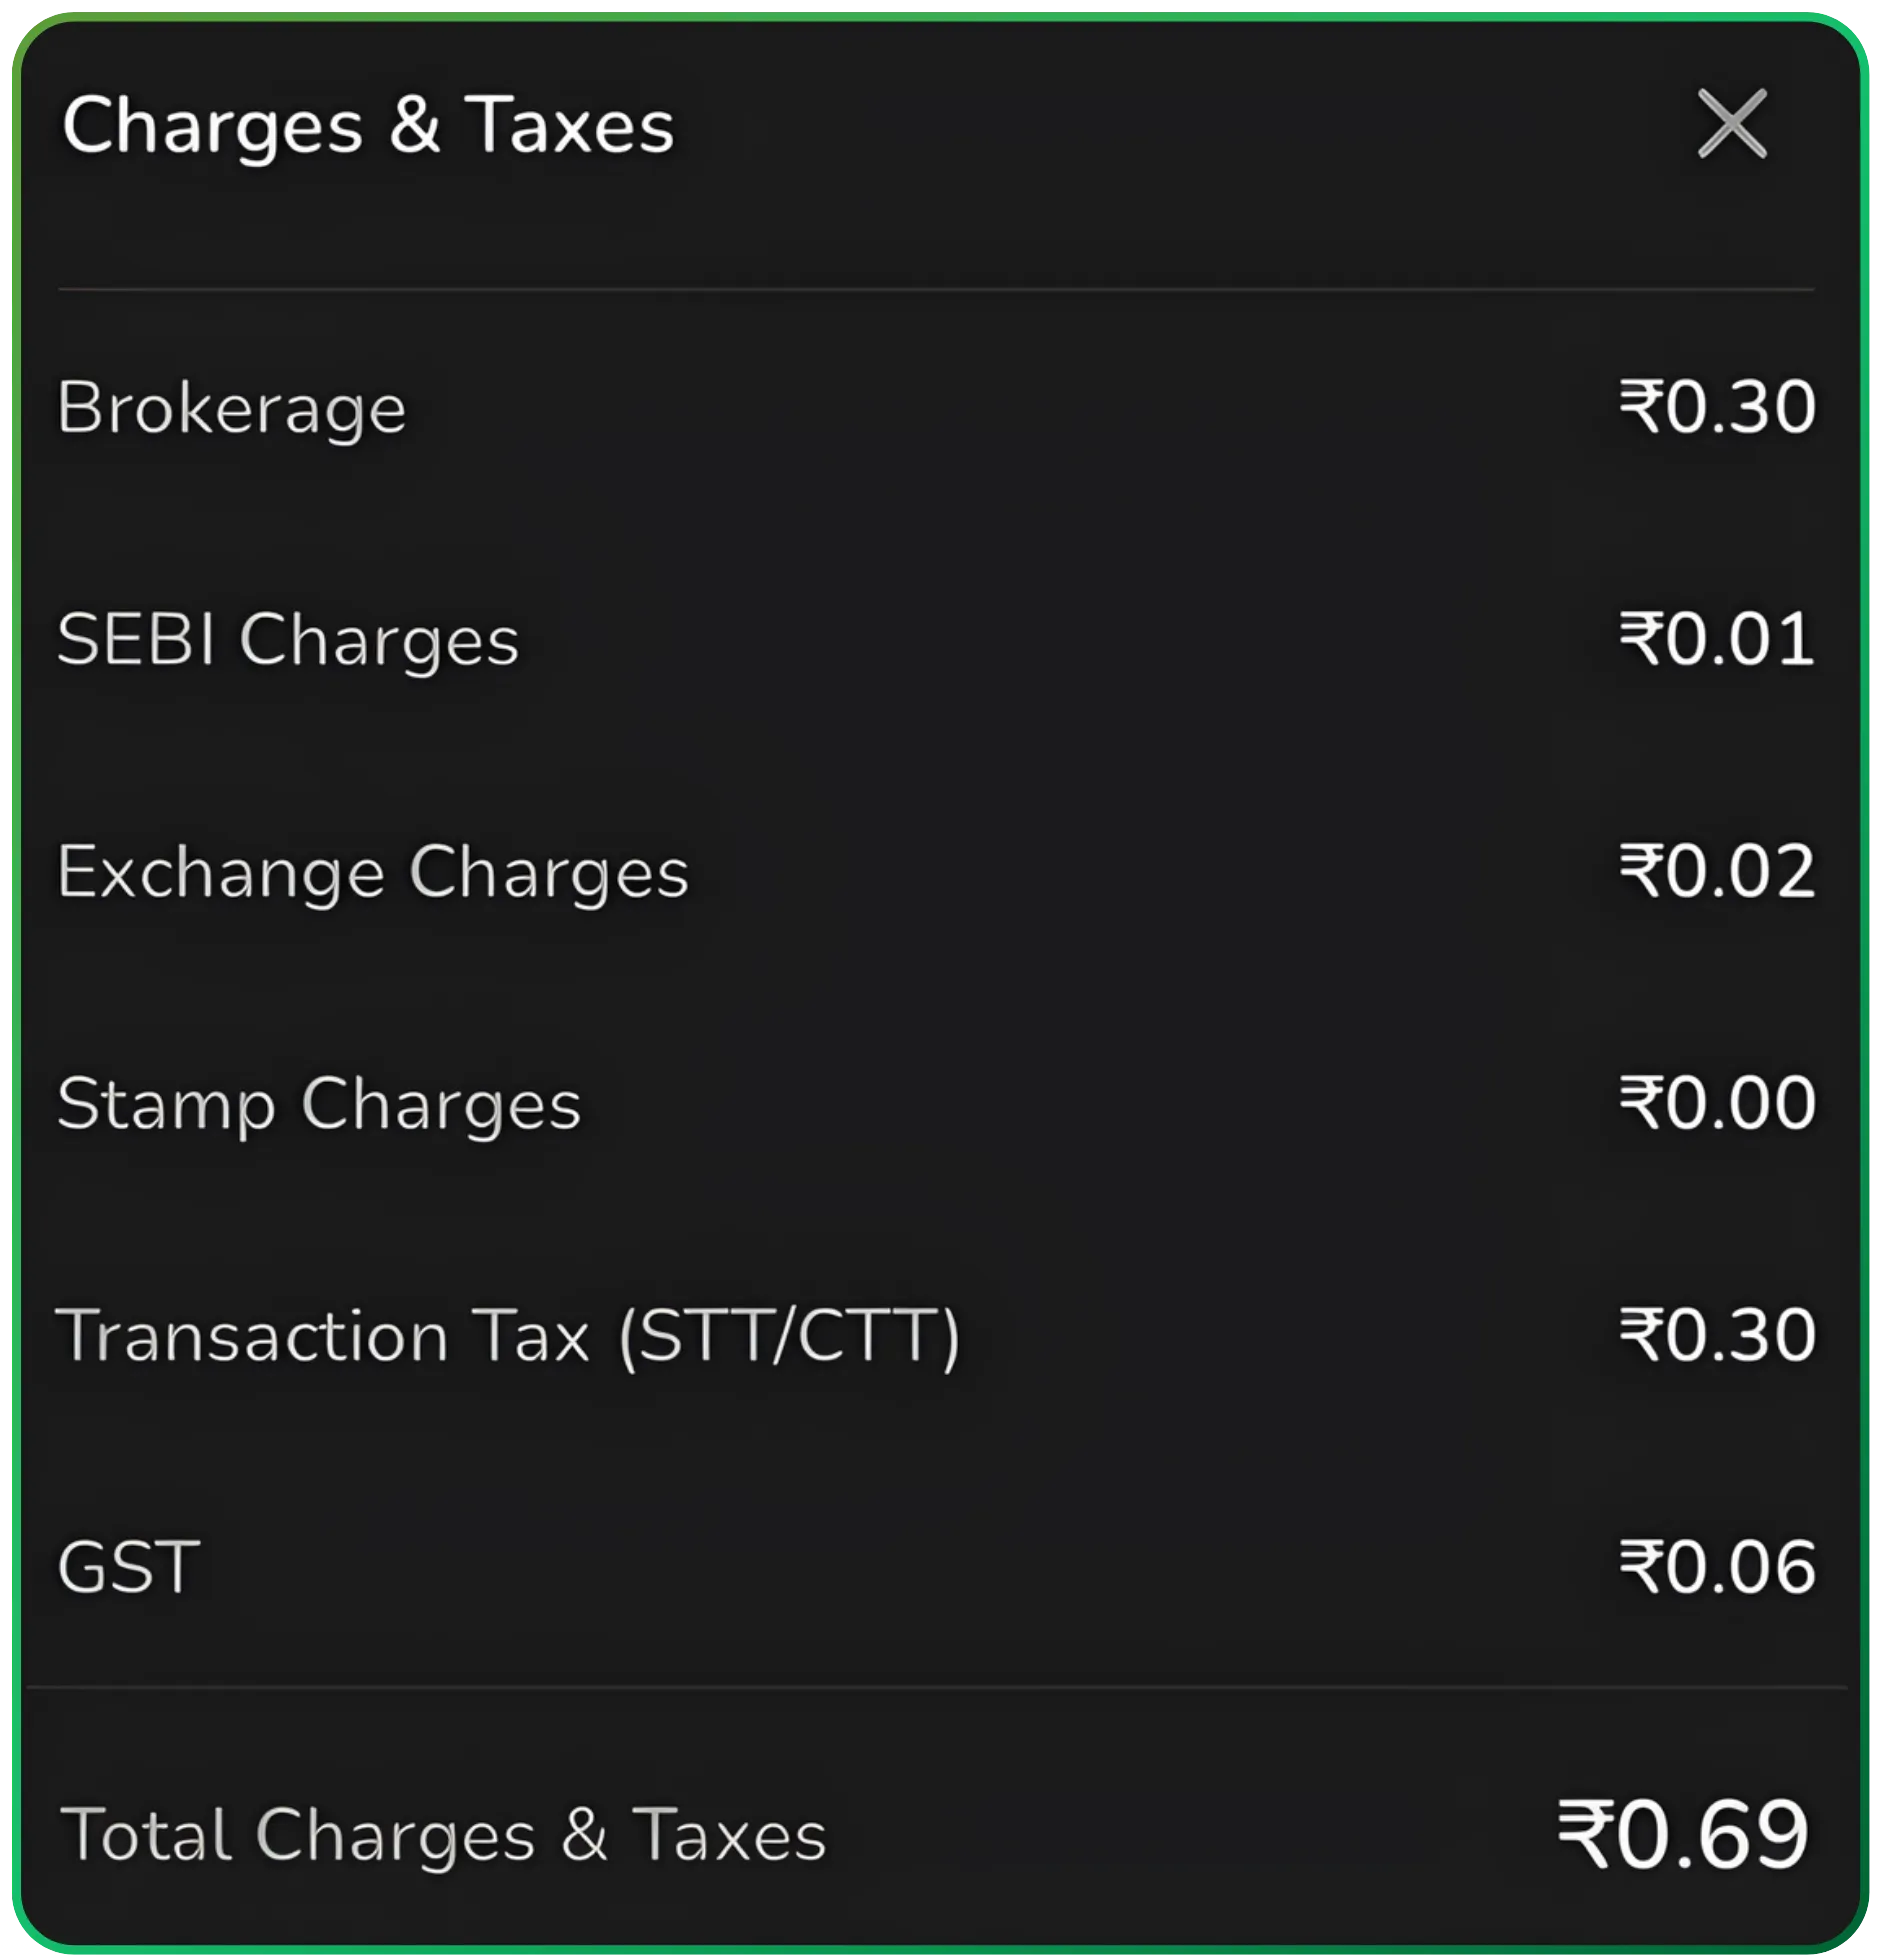
Sell charges for 1 niftybees
Most charges are not billed separately. Core ETF fees are deducted from the fund’s assets daily and show up as slightly lower net asset value and returns; you won’t see a line item on your bank statement.
Understanding these charges helps you choose between very similar ETFs tracking the same index. Over 15-20 years, picking a fund with a 0.10% lower expense ratio can add thousands to your portfolio.
Expense Ratio by Category
| ETF Category | Typical Expense Ratio Range |
|---|---|
| Broad large-cap index ETF | 0.03% – 0.10% |
| Sector or thematic ETF | 0.07% – 0.50% |
| Actively managed ETFs | 0.60% – 1.00% |
| International / emerging markets | 0.10% – 0.85% |
Even small differences compound significantly over time. The gap between a 0.10% and 0.60% annual fee becomes meaningful over a 10-20 year investment horizon, potentially costing you tens of thousands in foregone returns.
How Are ETF Charges Deducted In Practice?
Investors rarely notice ETF charges as separate line items because fund-level fees are deducted from assets internally. You won’t find a debit on your trading account, as the effect shows up in slightly lower returns.
Here’s how it works operationally:
The annual expense ratio is converted into a daily fee
This tiny amount is removed from the fund’s assets each business day
The net asset value reported each day is already net of these fees
You simply see slightly lower performance versus the underlying index
Numeric illustration: A 0.25% annual fee equals about 0.000685% per day. On ₹1,00,000, that’s roughly ₹0.68 per day.
Effect on returns: If the stock index returns 10% gross and the ETF has a 0.30% fee plus 0.10% tracking difference, the investor might see around 9.60% net returns.
Trading-related costs are incurred only when you buy or sell ETF units. These are separate from the daily fund deduction and appear in your brokerage statements.
Charges In Different Types Of ETFs
Charges differ significantly based on investment strategy, asset class, and market focus.
Passive Index ETFs vs. Actively Managed ETFs
| Feature | Passive Index ETF | Actively Managed ETF |
|---|---|---|
| Management approach | Replicates the underlying index | Fund manager selects securities |
| Typical expense ratio | 0.03% – 0.25% | 0.50% – 1.00% |
| Turnover | Low | Higher |
| Research costs | Minimal | Significant |
Passively managed funds simply track benchmarks like the Nifty 50. There’s no active management involved, so costs stay low. Actively managed funds pay for continuous research, security selection, and more frequent trading decisions.
Equity vs. Bond vs. Commodity ETFs
Plain-vanilla large-cap equity index ETFs: Often charge around 0.03%-0.20%
Bond ETFs and fixed income investments: May be slightly higher due to trading and liquidity costs in debt markets. Corporate bonds and government securities have different liquidity profiles.
Commodity ETFs: Tend to have higher expense ratios due to storage, insurance, and specialized operational costs
Niche, Thematic, Leveraged, and Inverse ETFs
Emerging markets and small-cap ETFs: Higher expenses due to complexity and lower liquidity
Thematic ETFs: Premium pricing for specialized exposure
Leveraged and inverse ETFs: Charge more for daily rebalancing and derivatives, plus high implicit costs from compounding effects
When two ETFs follow the identical benchmark, cost often becomes the main differentiator. Always compare ETFs tracking the same index fund before making investment decisions.
Zero-Fee And Ultra-Low-Cost ETFs
Since 2018-2020, ETF providers have launched ultra-low-cost and occasional zero-fee ETFs to attract price-sensitive investors. This trend has intensified competition and benefited cost-conscious investors.
How Zero-Fee ETFs Usually Work
- Expense ratios may be temporarily waived or subsidized by the fund provider
- The ETF fund still has operating costs
- These waivers are typically promotional and time-limited
Potential Benefits
- No ongoing fee drag during the waiver period
- Very attractive for long-term core holdings if the investment strategy and liquidity are sound
- Forces competitors to lower costs, benefiting all investors
Risks and Trade-Offs
- Future fee increases once the promotional period ends
- Possibly lower liquidity and wider bid-ask spreads in newer, small AUM funds
- Some may focus on narrow themes or factors to differentiate from existing low-cost core index etf products
- May have less established past performance track records
How ETF Charges Impact Long-Term Returns
Even tiny annual percentages compound dramatically over decades, affecting retirement savings and long-term wealth goals. What looks like a rounding error today can become a substantial sum over your investment horizon.
Also read: Multi-Asset Allocation Funds
25-Year Comparison Example
Consider two ETFs tracking the same index with a 10% gross annual return:
| Scenario | Expense Ratio | Starting Value | Value After 25 Years |
|---|---|---|---|
| Low-cost ETF | 0.10% | ₹5,00,000 | ₹52,92,000 |
| Higher-cost ETF | 0.70% | ₹5,00,000 | ₹45,87,000 |
| Difference | 0.60% | — | ₹7,05,000 |
Understanding Fee Drag vs. Tracking Error
Fee drag: The explicit cost reduction from the expense ratio
Tracking error: The performance gap versus the benchmark from cash holdings, rebalancing costs, and implementation differences
Both matter. A fund with a 0.05% expense ratio but poor tracking could underperform a 0.15% fund that tracks its underlying index tightly.
Focus on net returns and risk profile, not just picking the fund with the absolutely lowest expense ratio. Sacrificing liquidity or tracking quality to save 0.02% rarely makes sense.
Long-term, buy-and-hold investors generally benefit from broad, low-cost, liquid ETFs with tight spreads and stable fee policies. This approach aligns with sound personal finance principles.
How To Find And Compare ETF Charges
ETF fee information is public and standardized, but you need to know where to look. Unlike mutual funds that might bury fees in dense documents, most etfs work with transparent, easily accessible disclosures.
Where to Check Charges
- Fund provider’s website
- Stock exchange disclosures
- Financial data platforms
- Your depository participant or broker portal
Review Your Broker’s Fee Schedule
Before investing, understand:
- Commission per trade
- Platform fees for account maintenance
- Whether selected ETFs are on any commission-free list
- Currency conversion fees for international ETFs
Step-by-Step Comparison Checklist
- Identify the index or strategy you want
- Shortlist 3-5 ETFs tracking it
- Compare expense ratios
- Check average bid-ask spreads
- Review AUM
- Analyze tracking difference
- Prefer funds with transparent, stable fee structures

ETF Charges vs. Mutual Fund Charges
ETFs and mutual funds can hold similar portfolios, but their fee and tax structures differ due to how they’re bought, sold, and managed. Understanding these differences helps you choose the right vehicle for your mutual fund investments or ETF portfolio.
Common Mutual Fund Charges
| Charge Type | Mutual Funds | ETFs |
|---|---|---|
| Sales loads | Common in many funds | None |
| 12b-1 fees | Up to 0.25%–1.00% | Not typically charged |
| Average expense ratio | 0.1%–2.5% | 0.05%–0.3% |
Index Fund Convergence
Index mutual funds have become cheaper over time, narrowing the gap with passive ETFs. In some markets, expense ratios around 0.02%-0.20% are now found in index funds and index ETFs.
Also read: What is a NFO(New Fund Offer)?
Structural Trading Differences
ETFs trade intraday and delivery on exchanges at market prices during market hours, incurring spreads and trading-related taxes
Mutual funds transact at end-of-day NAV with no intraday trading or bid-ask spread, but may have exit loads
Key Differences for Investors
ETFs offer:
- Lower ongoing fund expenses for most passively managed funds
- Greater flexibility
- Often more tax efficient
Mutual funds offer:
- Simpler execution
- Automatic SIPs without worrying about spreads
- No need to monitor market volatility during trading
Practical Tips To Keep ETF Charges Low
You can significantly reduce total costs with a few practical decisions around fund choice and trading habits. Here’s how to minimize what you pay while maximizing diversification benefits.
Fund Selection Tips
- Choose broad, liquid ETFs
- Prioritize established funds
- Check tracking difference
- Read all the related documents
Periodic Portfolio Review
Review whether any ETFs in your portfolio have become expensive relative to newer, cheaper alternatives tracking the same underlying index. Fund providers regularly launch competitive products.
Small, Frequent Investments
For very small, frequent investments, compare the total cost of using ETFs versus low-cost index mutual funds or systematic plans. Per-trade charges can disproportionately impact small transactions
Work with Financial Advisors
If you’re unsure about navigating these choices, financial advisors can help you understand your own discretion limits and build a portfolio aligned with your investment opportunities and goals. Always confirm they understand the fee structures of products they recommend.
Final Considerations
Before making any investment, read scheme related documents carefully and understand the market risks involved. ETFs pay dividends based on their underlying securities, and tax treatment varies by jurisdiction and fund type.
Key Takeaways
- ETF charges include expense ratios, brokerage fees, bid-ask spreads, and transaction taxes
- Expense ratios are deducted daily from fund assets
- Passive index ETFs typically cost less, while actively managed funds charge higher fees
- Compare ETFs tracking the same index using expense ratios, spreads, AUM, and tracking difference
- Trading habits matter as much as fund selection for keeping total costs low
ETF charges may look small in isolation, but they compound and can meaningfully impact long-term wealth. A disciplined focus on low, transparent costs can improve your investment outcomes over decades.
Disclaimer: The information provided in our blogs is for informational purposes only and should not be construed as financial, investment, or trading advice. Trading and investing in the securities market carries risk. Always conduct your own research and consult with a qualified financial advisor before making any investment decisions. Past performance is not indicative of future results. Copyrighted and original content for your trading and investing needs.
© 2026 — Tradejini. All Rights Reserved.