


Delivery volume shows you more than just how busy the market is. While trading volume tells you how many shares changed hands during the day, delivery volume tells you how many of those shares actually moved into investors’ demat accounts. This shift often reveals genuine buying interest, making it a useful signal for reading sentiment and spotting potential trends.
Delivery Volume vs. Normal Volume
Delivery volume is not the same as regular trading volume, and that difference matters.
Normal volume is the total number of shares traded in a session. It counts everything, intraday trades that get squared off by the end of the day, and the ones that stay.
Delivery volume only counts the shares that actually leave the seller’s demat account and land in the buyer’s. These are the shares investors choose to hold beyond the trading day, which makes them a better indicator of genuine buying or selling pressure.
Here’s the key distinction: Normal volume tracks how active the trading was, while delivery volume shows how committed investors were. A spike in total volume might just mean there was a lot of speculative, intraday action. But when delivery volume is high, it suggests that buyers actually wanted to own the stock; that’s genuine investor interest.
Why Delivery Volume increases
Delivery volume usually climbs when there’s real conviction behind the trades. Common reasons include:
- Investor accumulation: Big players like institutions and long-term investors prefer taking delivery instead of flipping the stock intraday.
- Positive news or earnings: A strong earnings print or good news often nudges traders to hold their positions overnight, expecting more upside.
- Reduced speculation: When intraday volatility cools off, fewer people square off quickly, so more shares end up in delivery.
- Fundamentals-driven buying: If a stock looks undervalued or benefits from sector tailwinds, investors tend to buy and hold rather than trade in and out.
How to Read Delivery Volume Data
| Scenario | What It Indicates |
|---|---|
| Rising Delivery % with Rising Price | Strong accumulation; bullish sign |
| Rising Delivery % with Falling Price | Investors shifting to long-term hold despite correction (value buying) |
| Low Delivery % with High Volume | Speculative intraday trading; less conviction |
| Sudden Spikes in Delivery % | May precede major trend changes or institutional entry |
Also read: Explore Open = High and Open = Low Stocks with Ease on Tradejini CubePlus
How to view delivery volume in Tradejini CubePlus
Here’s how you can check delivery volume on Tradejini’s CubePlus:
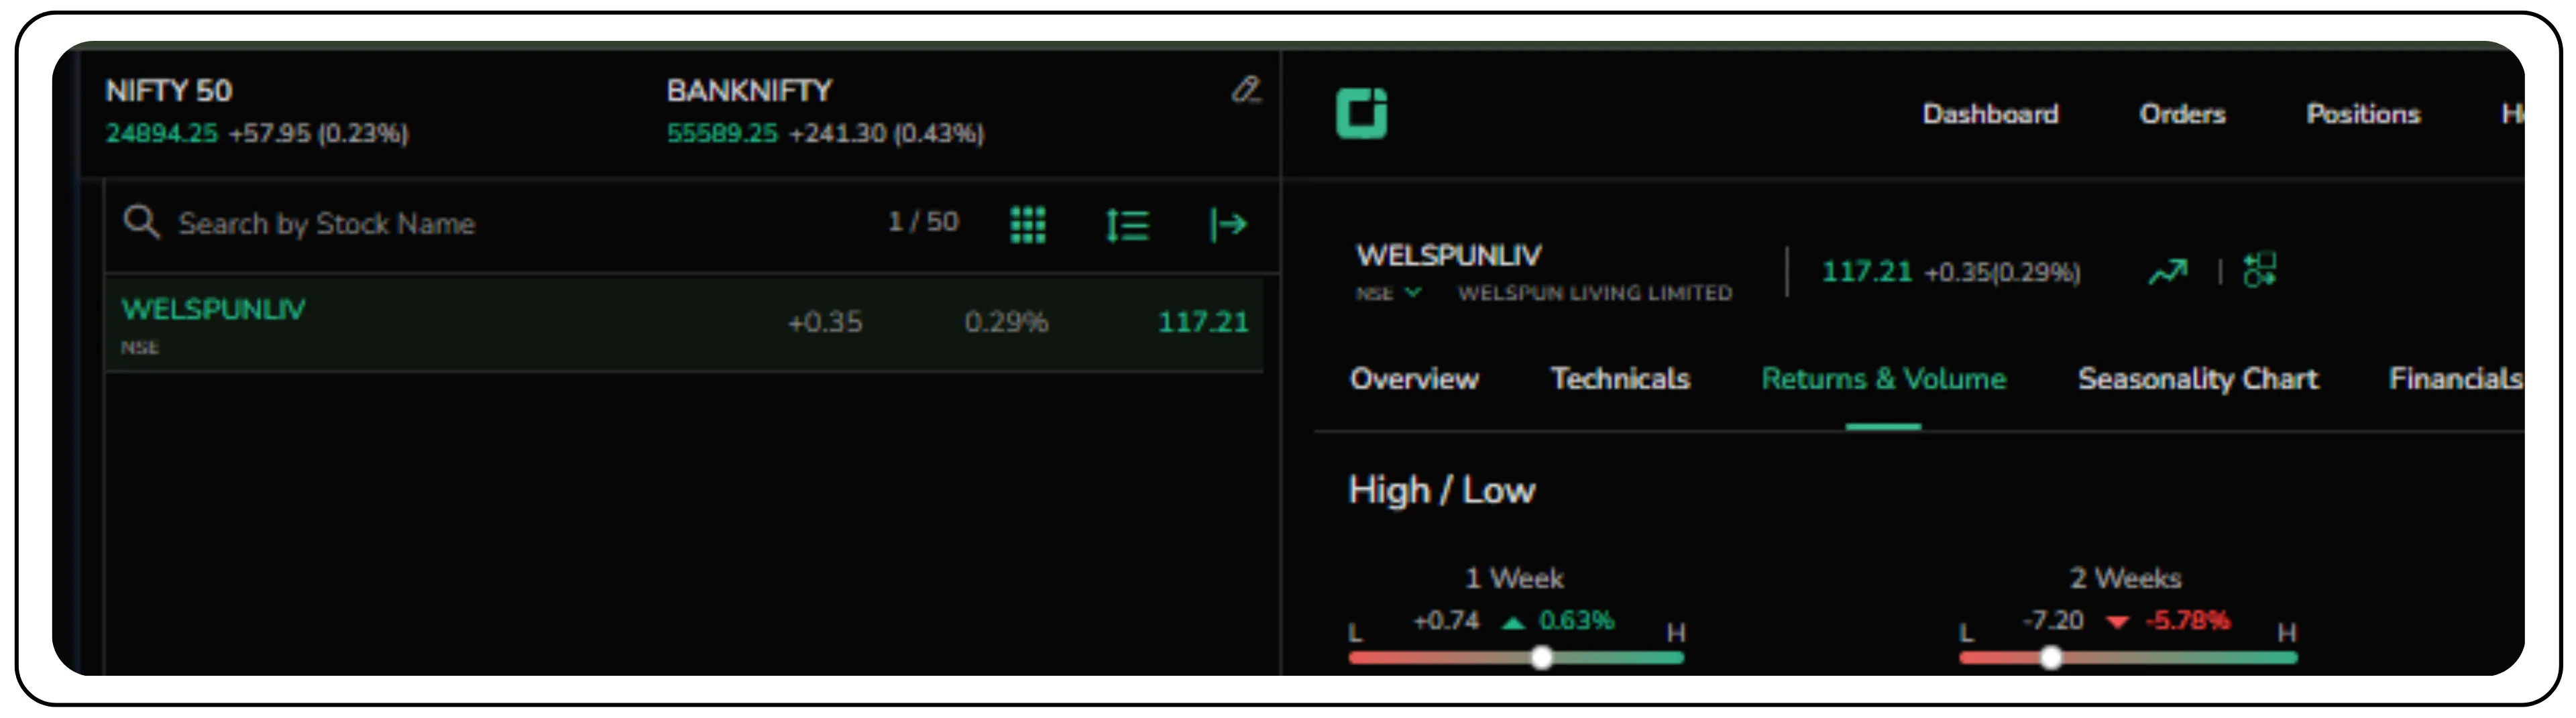
- Click on the stock name in your watchlist.
- Open the “Returns & Volume” tab in the stock window.
- This tab lines up Annual Returns, Total Volume, and Delivery Volume all in one place.
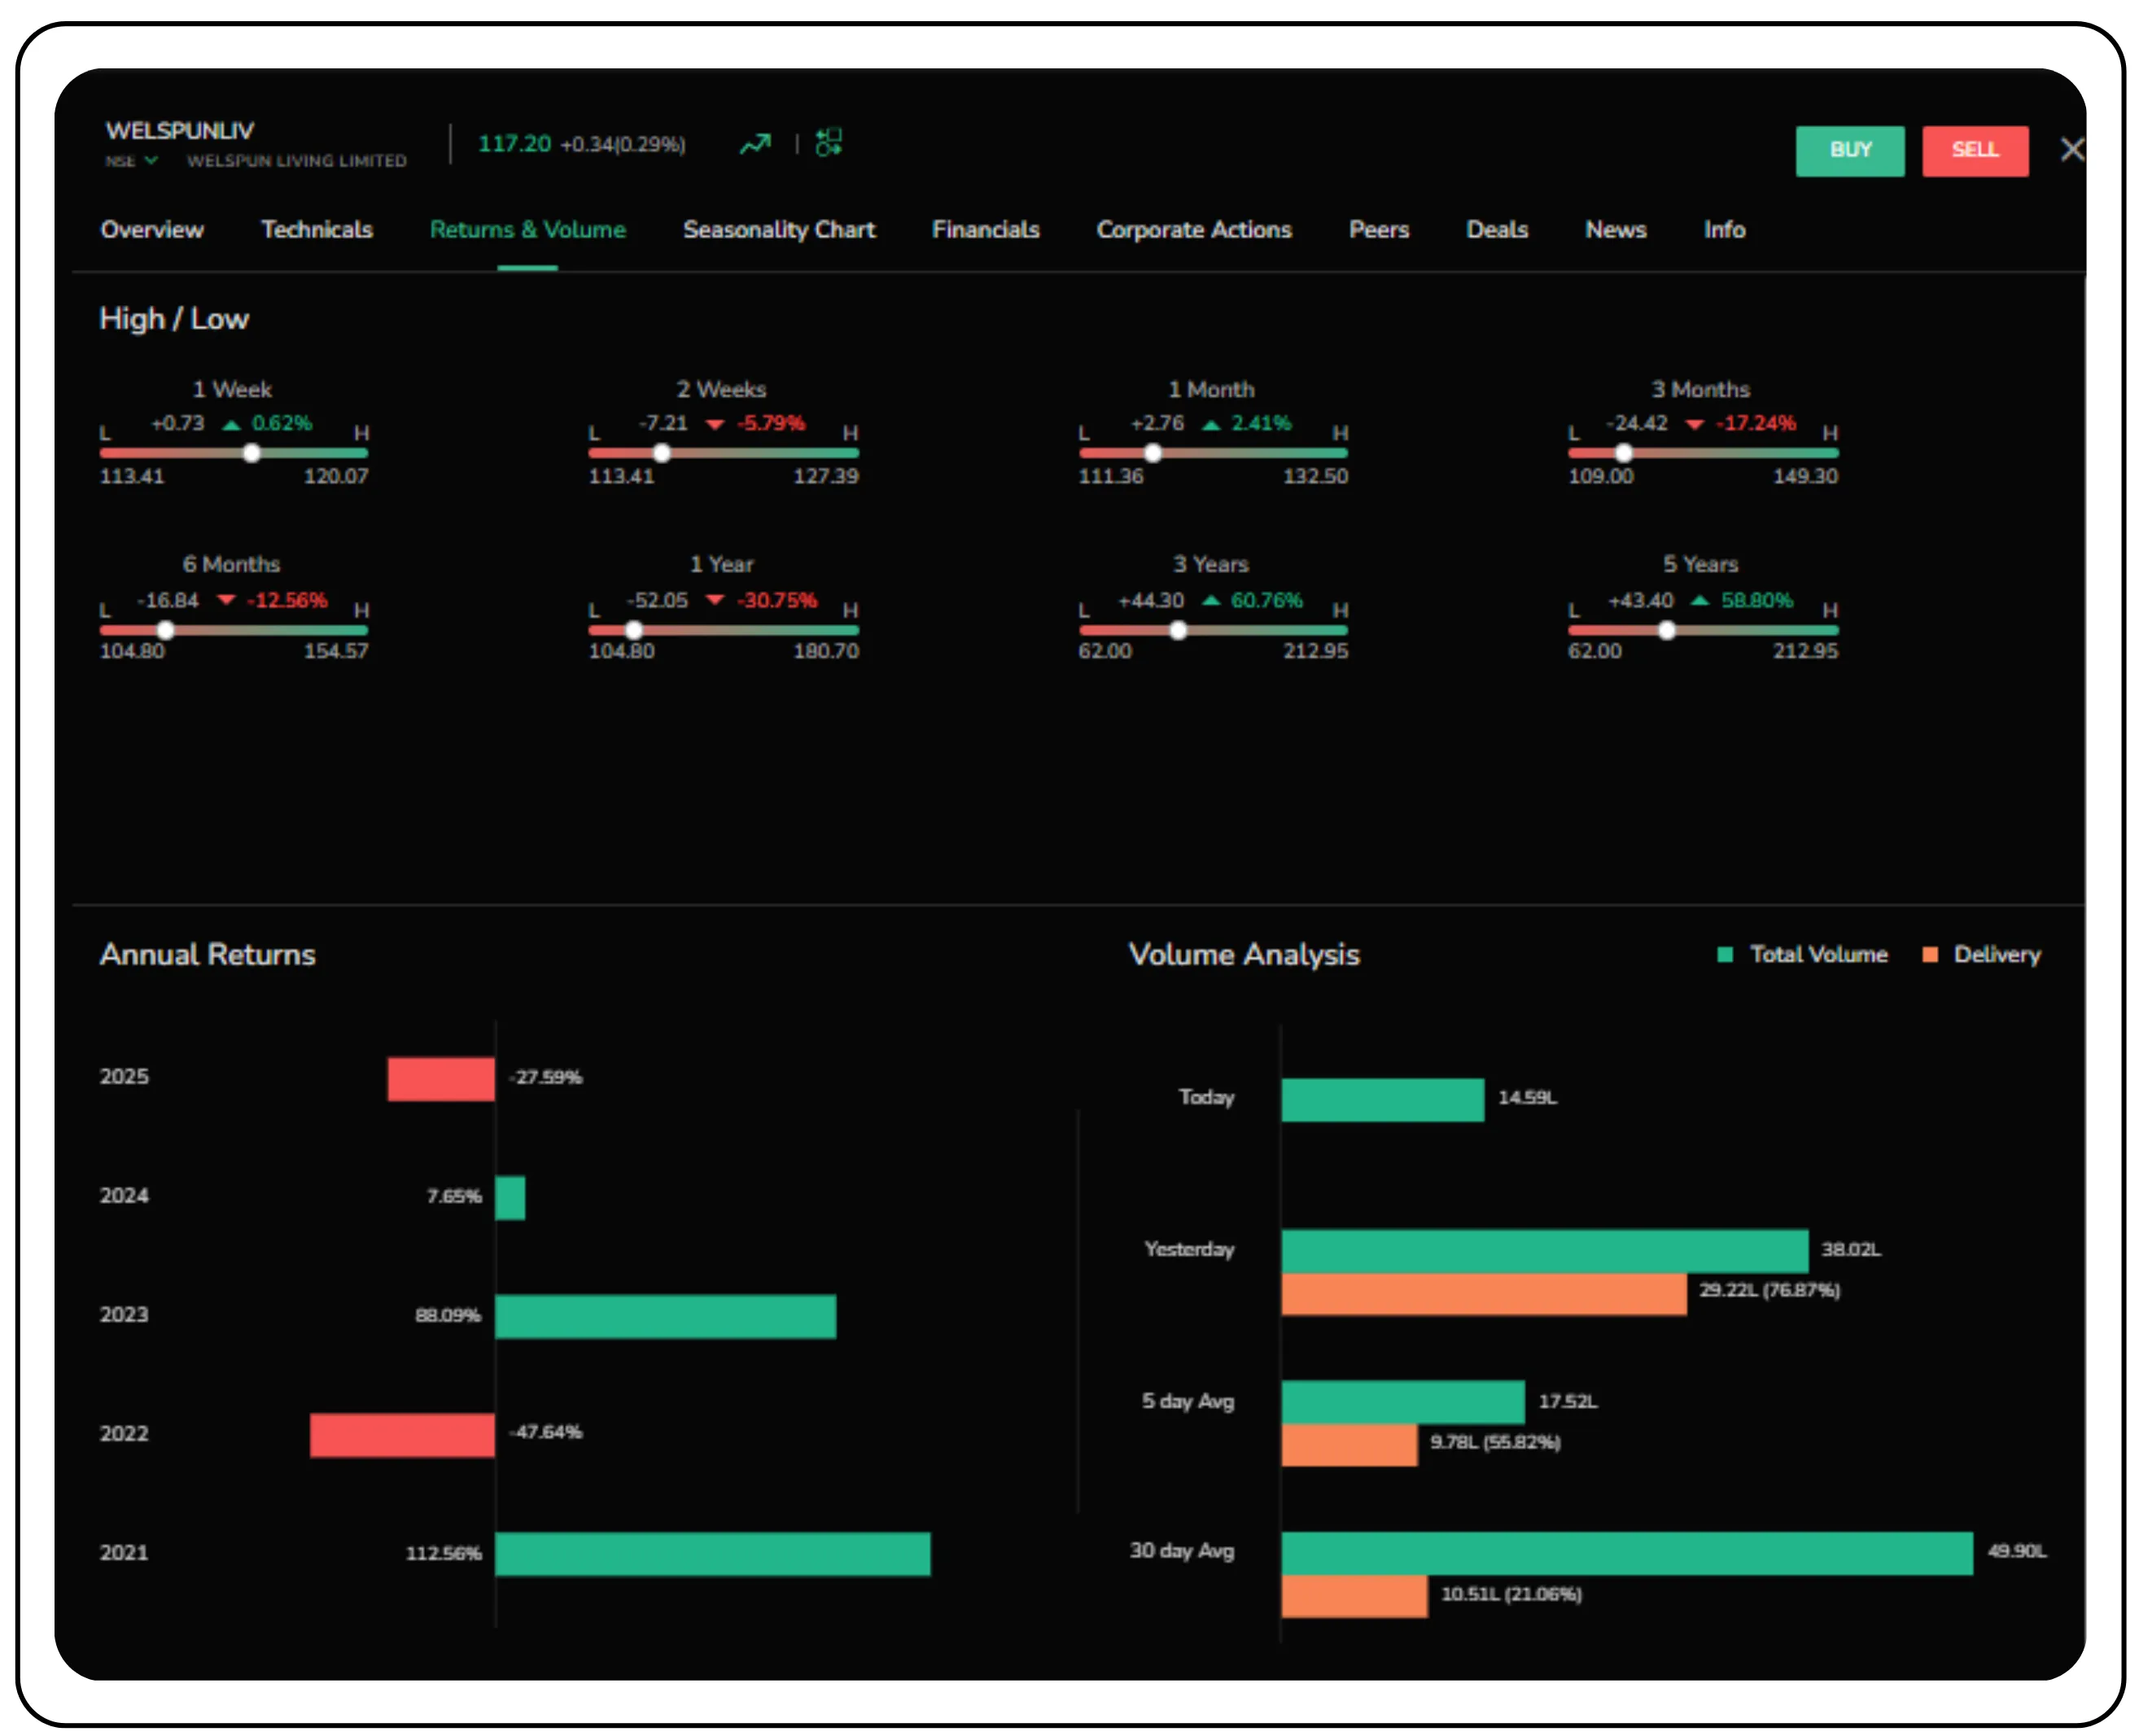
Next, scroll to the “Volume Analysis” section:
- The green bar shows total traded volume.
- The orange bar shows delivery volume.
- You will also see the delivery % (say, 71.03%).
You can switch between Today, 5-Day Average, and 30-Day Average to spot trends. A higher delivery % suggests genuine buying interest, while a low one points to mostly speculative activity.
Tradejini’s CubePlus platform makes it easy to track delivery volume and delivery %. Here’s how:
Volume Analysis (Main focus)
| Period | Total Volume (Green) | Delivery Volume (Orange) | Delivery % |
|---|---|---|---|
| Today | 12.90 L shares | (not yet settled) | — |
| Yesterday | 38.02 L shares | 29.22 L shares | 76.87% |
| 5-Day Avg | 17.52 L shares | 9.78 L shares | 55.82% |
| 30-Day Avg | 49.90 L shares | 10.51 L shares | 21.06% |
Here’s how to make sense of the numbers you see:
Today
Total traded shares: 12.9 L.
Delivery data isn’t available yet because it gets finalised after settlement, so you will only see the green bar for now.
Yesterday
38.02 L shares traded, and 29.22 L were delivered, a hefty 76.87% delivery ratio.
→ That is a sign of strong investor conviction. Most buyers were not just trading intraday; they chose to hold.
5-Day Average
Average volume: 17.52 L, with 9.78 L delivered (55.8% delivery).
→ Pretty typical. Roughly half the trades turned into delivery.
30-Day Average
Average volume: 49.9 L, but only 10.5 L got delivered (21% delivery).
→ Over the past month, most of the action was speculative or intraday, and not many investors stayed in overnight.
Key takeaways from this example:
Yesterday’s delivery % (76.9%) was far above both the 5-day (55.8%) and 30-day (21.0%) averages.
→ A sudden spike like this often hints at accumulation by bigger players or a shift from short-term trading to longer-term holding.
Total volume yesterday (38 L) was more than double the 5-day average (17.5 L).
→ It was not just heavier trading; a larger share of those trades actually went into delivery.
If the price climbed alongside this jump in delivery, it’s a bullish sign of active accumulation. If the price dropped, it could point to value buying at lower levels.
Turn research into action and explore smarter investing opportunities with CubePlus.
Disclaimer: The information provided in our blogs is for informational purposes only and should not be construed as financial, investment, or trading advice. Trading and investing in the securities market carries risk. Always conduct your own research and consult with a qualified financial advisor before making any investment decisions. Past performance is not indicative of future results. Copyrighted and original content for your trading and investing needs.
© 2025 — Tradejini. All Rights Reserved.