


Tarsons Products Ltd., seen as a slow-growth labware company buried under an enormous capex overhang, appears to be a business caught between pricing pressure from domestic competition, a COVID-era capacity boom that hasn't yet monetized, and depressed near-term earnings. The stock listed above ₹800, has since lost more than 75% of that peak value, and trades near ₹190 today, making it one of the most debated small cap fundamental analysis stories in India's manufacturing space.
Tarsons is one of India's very few vertically integrated manufacturers of plastic labware — the centrifuge tubes, pipette tips, cryovials, cell culture vessels, and sterile media bottles that every pharmaceutical lab, diagnostics company, CRO, and research institute runs on every single day. Its gross margins have held above 67% through the down cycle. Its EBITDA margin at the standalone level stands at 34.7%, among the highest in Indian specialty manufacturing. And it is in the final stages of commissioning a ₹600 crore greenfield facility that could double its addressable product set and revenue potential over the next three to four years.
Tarsons is a capital cycle story where the spending is nearly done and the revenues are about to follow, and the market is currently pricing it for the overhang, not the optionality.
The Business: What Happens Inside Every Indian Lab
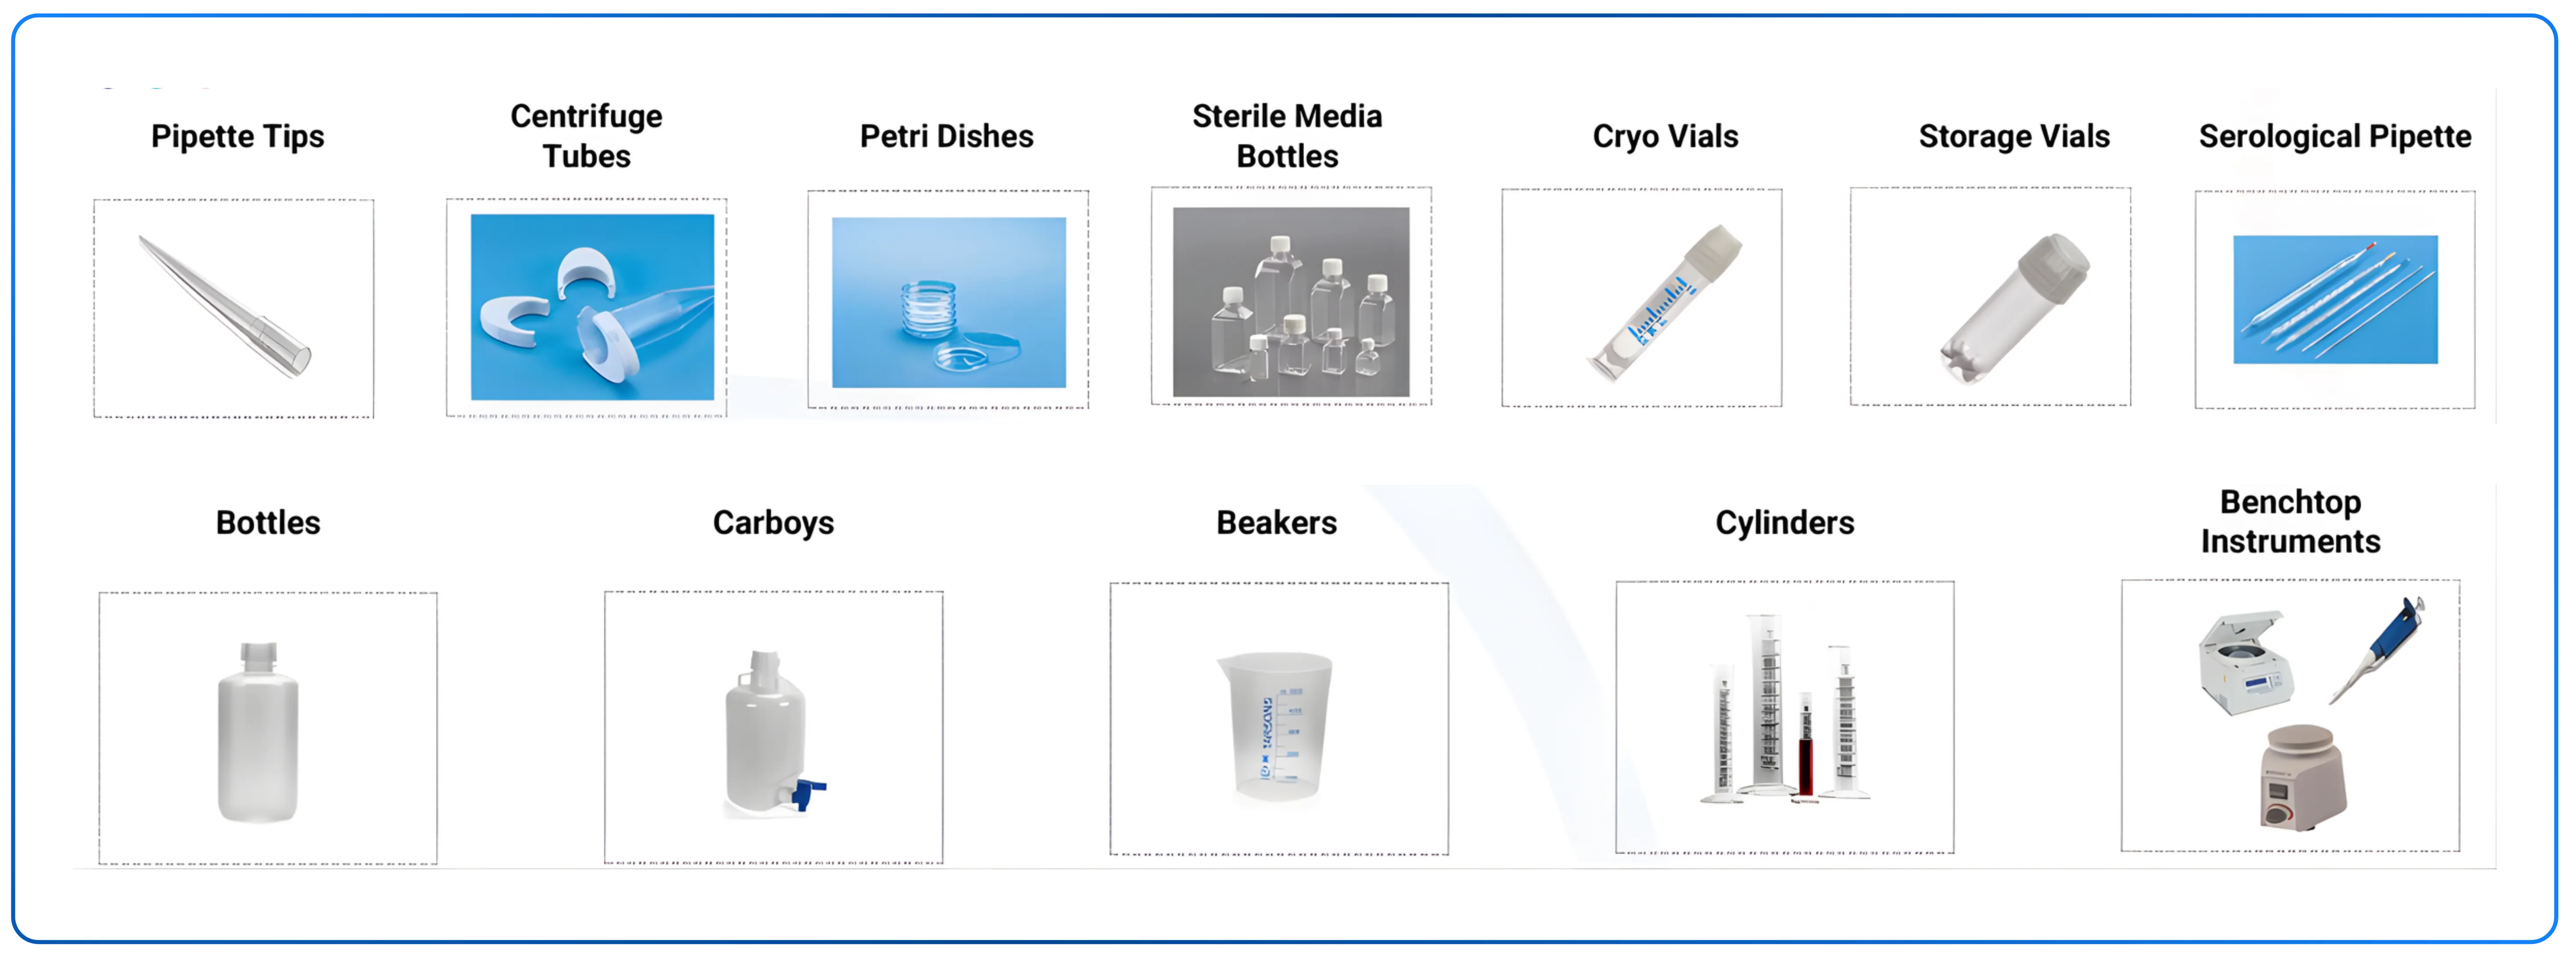
Tarsons Products has focused on a single, critical domain for over four decades: manufacturing plastic consumables used in laboratories.
Centrigue tubes enable sample separation during analysis. Pipette tips allow precise microliter liquid handling. Cryovials preserve genetic material at temperatures as low as -196°C in liquid nitrogen. Petri dishes support the cultivation of microorganisms. Each of these items play a vital role in the experiments behind it.
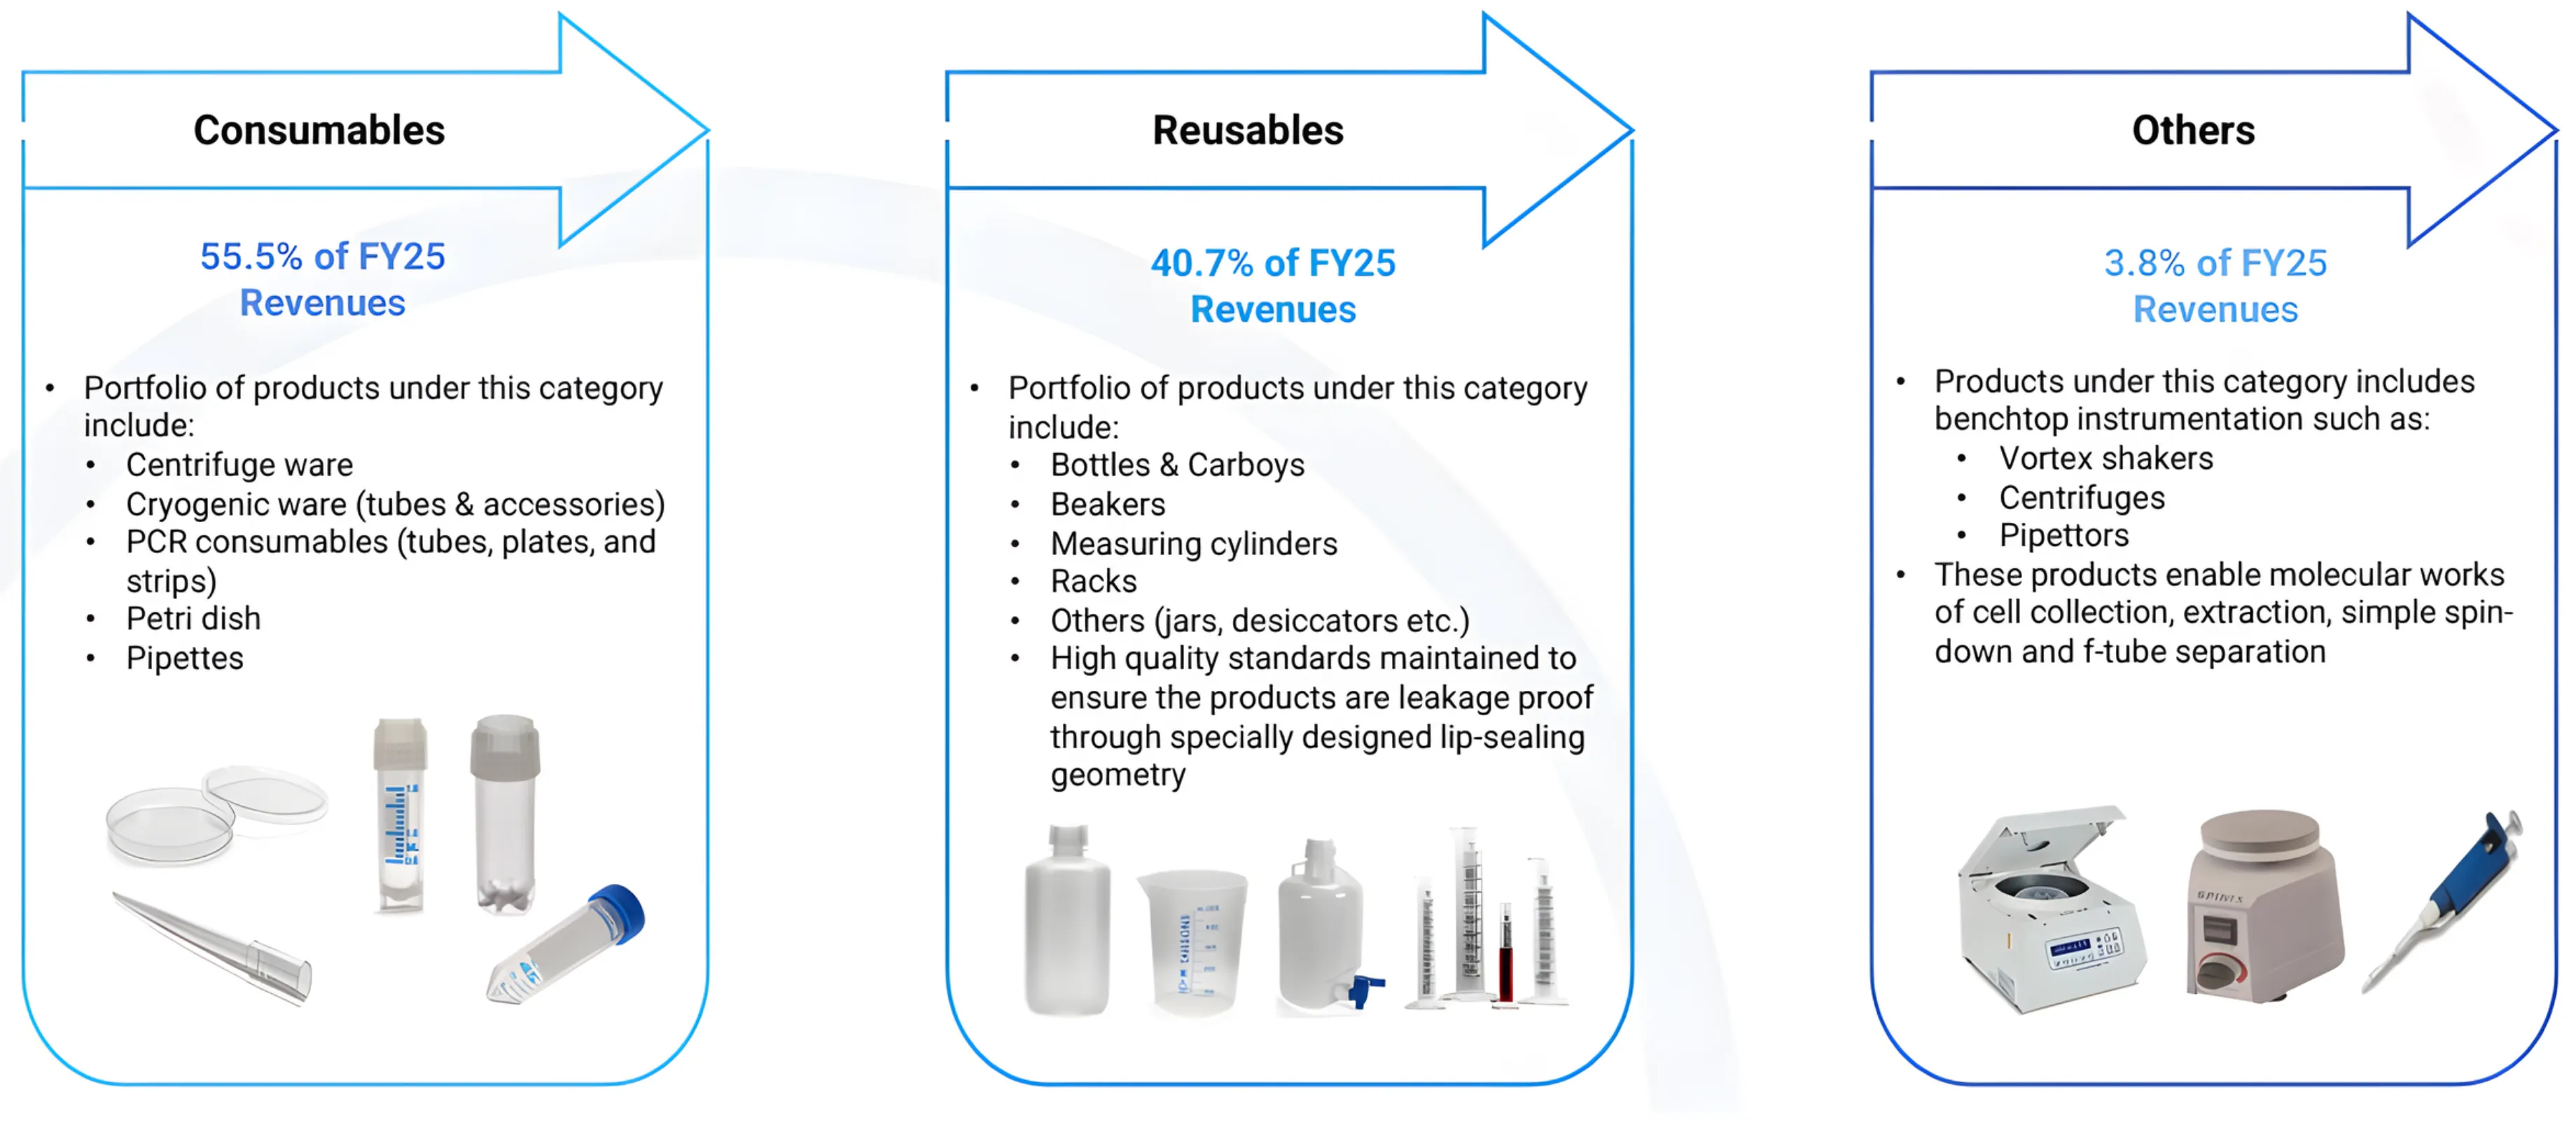
The company sells across three product categories. Consumables — centrifuge ware, cryogenic ware, PCR products, petri dishes, and pipette tips account for 55.5% of FY25 revenues. These are single-use products with high repeat purchase frequency. Reusables — bottles, carboys, beakers, and measuring cylinders contribute 40.7% of revenues. They are bought less frequently but create durable customer relationships. Others, including benchtop equipment like vortex shakers and centrifuges, make up the remaining 3.8%.
Across these three categories, Tarsons offers 2,000+ SKUs across 350 product segments. Its customers span the full spectrum of Indian science: academic research institutes like NCBS and IISc, pharmaceutical majors like Dr. Reddy's and Lupin, diagnostics chains like Dr Lal Pathlabs and Metropolis, CROs like Syngene and TCG Lifesciences, and international distributors like Avantor, Toei Kaisha, and FC-BIOS across 40+ countries.
The products are made from high-quality medical-grade, DMF-registered resins (the same resins global players use) in six manufacturing facilities across West Bengal, all operating under fully validated, third-party certified ISO 8 cleanrooms. The entire manufacturing process is human-touch-free: automated robotics and cleanroom protocols ensure that a pipette tip made in Kolkata reaches quality thresholds comparable to one made in Germany or the United States.
That parity is the foundation of the Tarsons business model.
The Competitive Position: What 40 Years Buys You
Tarsons holds an approximately 9–12% market share in the highly fragmented Indian plastic labware market, per a Frost & Sullivan industry report. In context, this is a market historically dominated by global multinationals like Thermo Fisher, Corning, and Greiner, who benefit from decades of scientific trust, deeper product portfolios, and strong sales infrastructure.
What allowed Tarsons to carve out a durable domestic share is a combination of three things: quality that is genuinely comparable to imported alternatives, pricing that reflects the domestic cost base, and three decades of relationship capital with the scientists, procurement officers, and distributors who make buying decisions in Indian labs.
The Geography: Two Markets in Different Innings
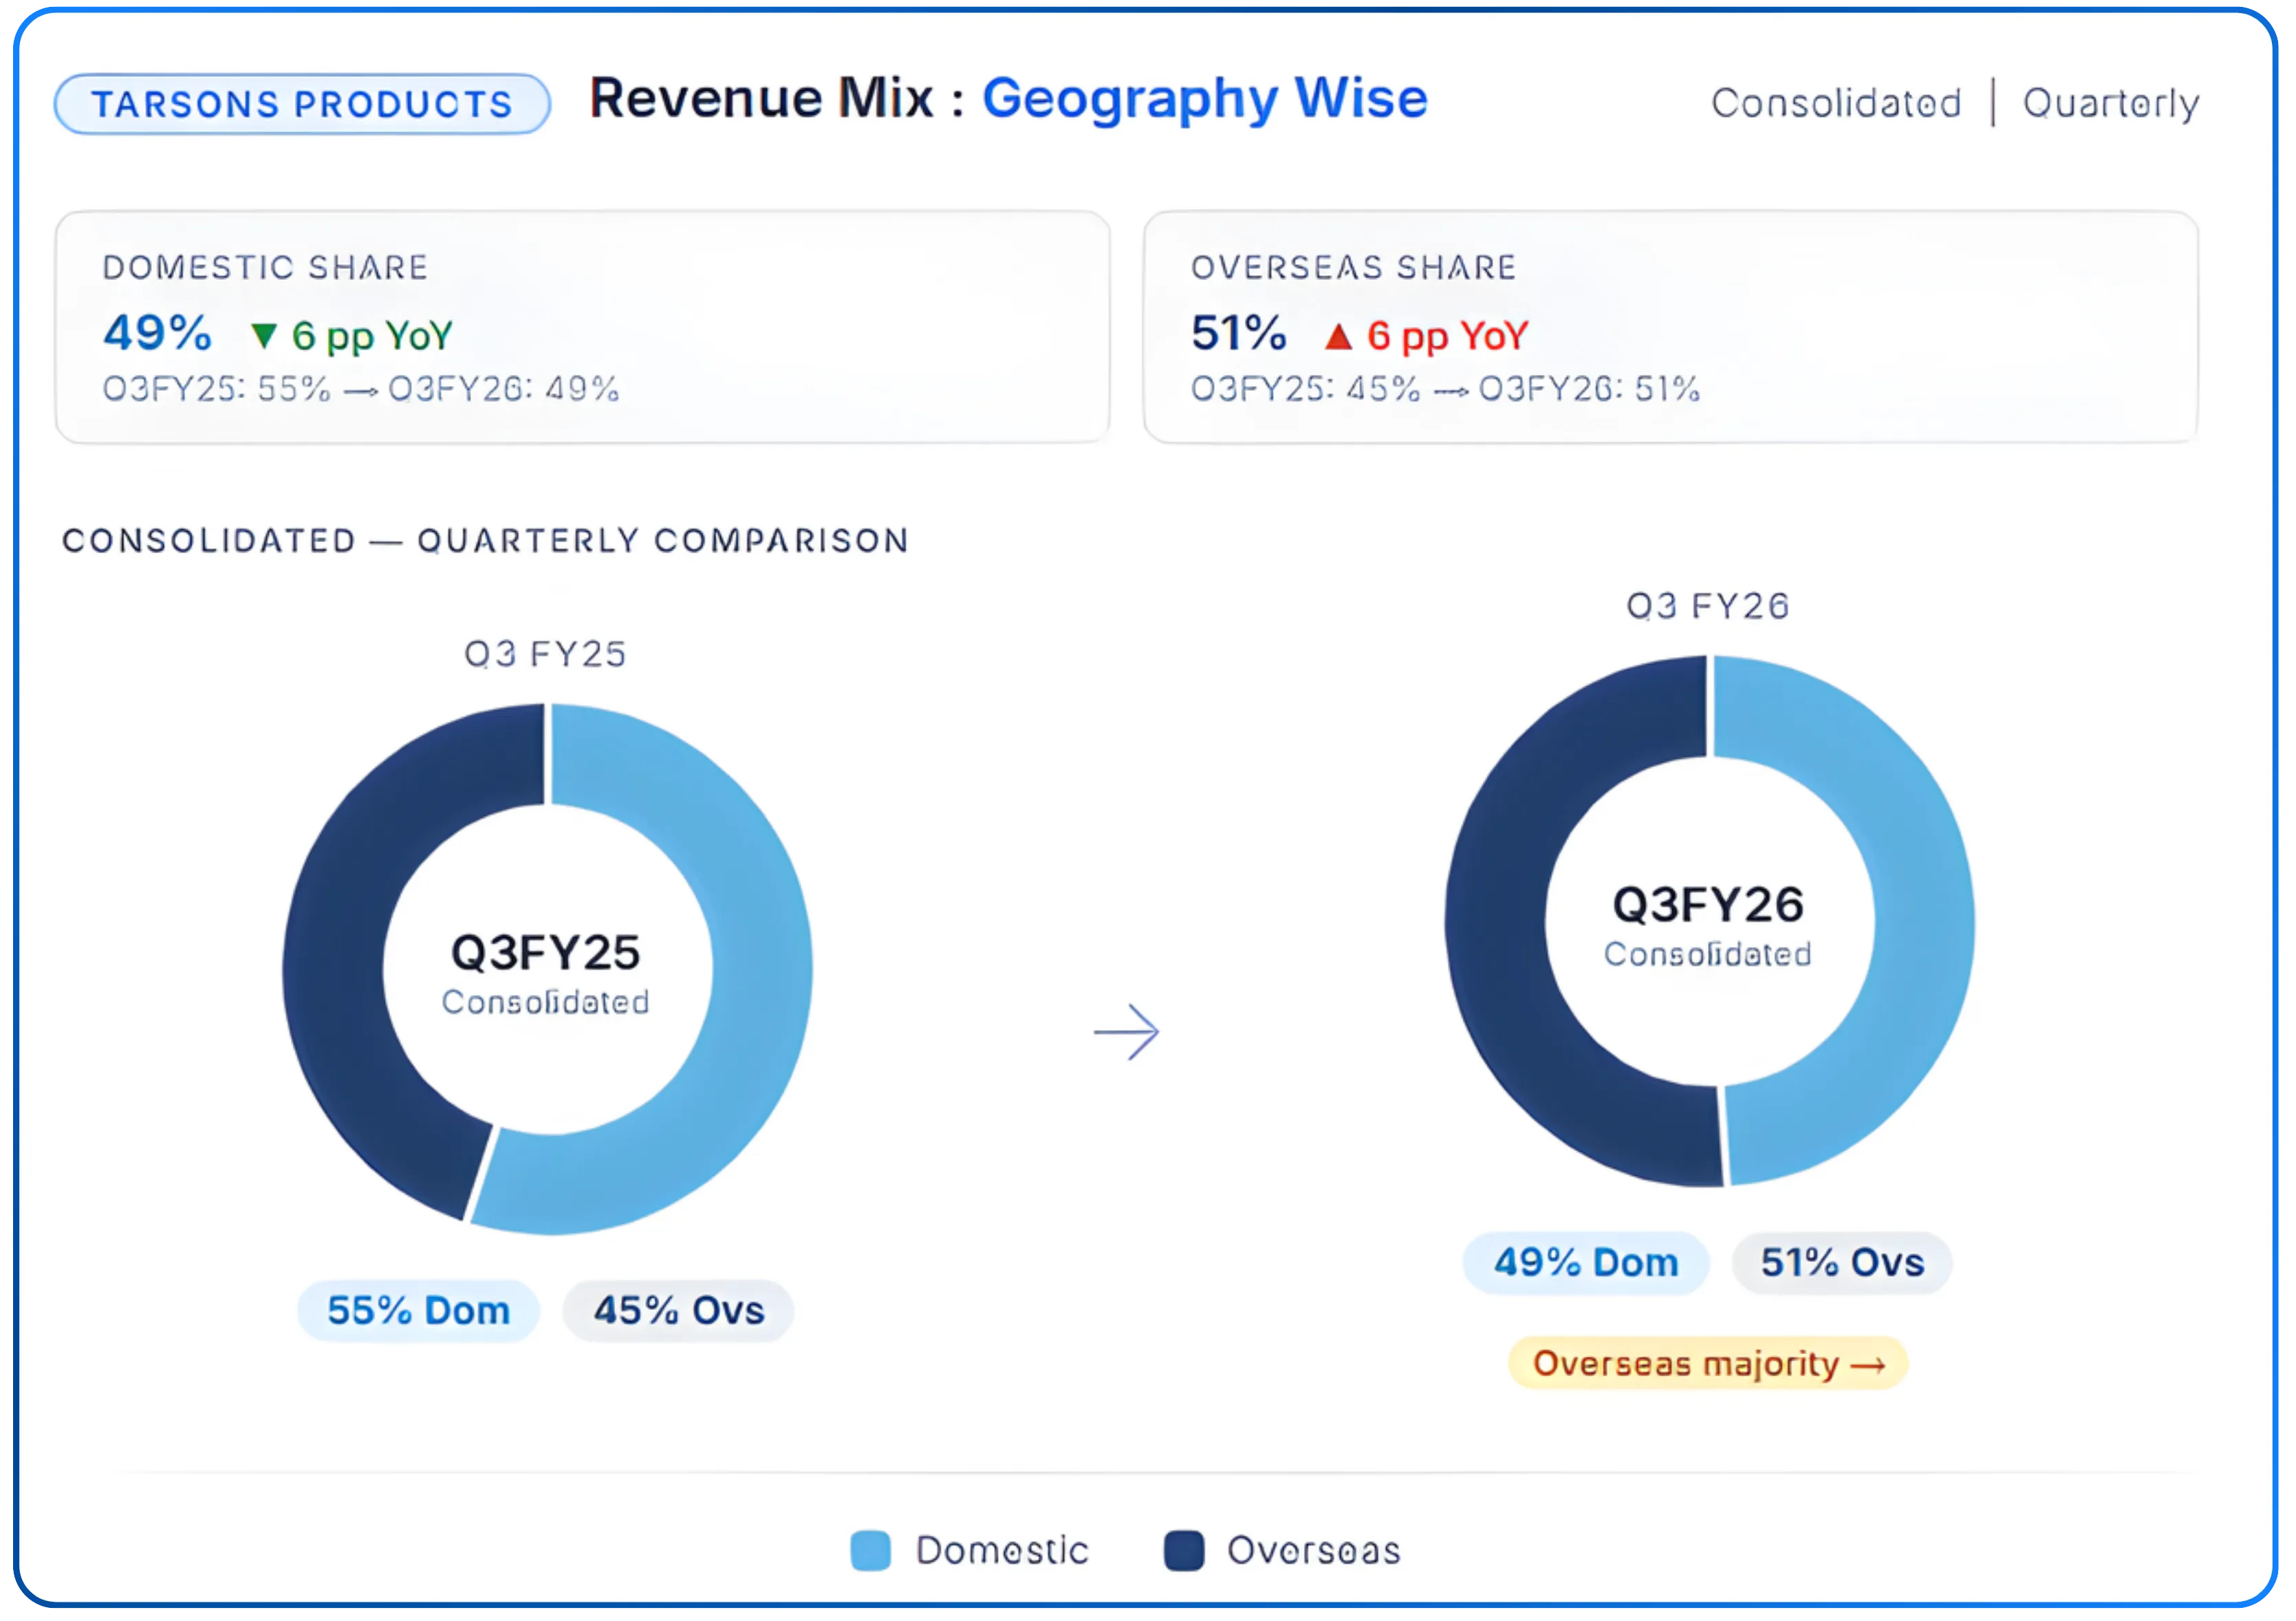
Understanding Tarsons requires understanding that its domestic and international businesses are at entirely different moments in their development.
India contributes approximately 65–70% of standalone revenues. The domestic market is going through a post-COVID normalization. COVID-era demand created an artificial boom for labware, which led multiple players (including Tarsons) to invest heavily in expanded capacities. That excess capacity has been flooding the market over the past two years, driving prices to, in management's own words, "all-time lows" and creating a "buyer's market by far." The GeM (Government e-Marketplace) procurement system has further complicated the institutional segment, forcing L1 price-based buying rather than quality-criteria purchasing, penalizing premium suppliers.
But even within this environment, Tarsons' domestic demand has begun to recover. Management noted on the Q3 FY26 call that "demand for our products has begun to pick up, reflected in increased order inflows" and that "existing plants have been operating at near full capacity over the past few months." This is an important inflection; the legacy business is back at full utilization while the new Panchla facility is still ramping.
Exports (currently 35% of standalone revenues and growing) tell a more constructive story. Export revenue has grown from ₹48 crore in FY19 to ₹99.8 crore in FY25, representing an approximately 13% CAGR over six years. The two-pronged strategy — branded sales to emerging markets (APAC, Middle East, South America) and ODM (Original Design Manufacturer) sales to developed markets (US and Europe) — positions Tarsons differently in each geography.
ODM sales to the US and Europe are high-volume where Tarsons designs and manufactures the product; the brand owner puts their label on it. This has been the more immediately scalable route in developed markets. Branded exports to emerging markets build longer-term equity and superior margins.
On the EU front, the India-EU FTA will eliminate the current 6% import duty on labware products, creating pricing room for distributors. On the US front, the more significant opportunity: a potential reduction of import duties from 50% to 18% under the India-US trade framework would "give a new lease of life" and definitively position Indian labware as the cost-competitive alternative to Chinese supplies in the American market.
If you're drawn to capital-efficient businesses with defensible niches, you might find this equally compelling: Dissecting Vaibhav Global's Niche Retail Model at Scale
The Nerbe Acquisition: A German Foothold Being Staged
In Q3 FY24, Tarsons acquired Nerbe, a Hamburg-based specialty labware distributor with approximately EUR 8.5 million in annual revenue, primarily serving the German market. The acquisition was funded through a Singapore subsidiary structure and a bank loan.
Nerbe brings two things: a local European brand with customer relationships built over decades (precisely the kind of trust that Indian-origin products struggle to establish cold), and a physical sales and logistics infrastructure in Europe.
The Q3 FY26 reported 22% revenue growth from Nerbe where most of the growth was currency translation, as the Euro appreciated significantly against the Rupee. Operationally, Nerbe has delivered "just marginal growth" in a challenging German economy that has been under particular pressure in 2025.
The honest appraisal is that Nerbe is an asset in waiting. The growth model for Nerbe is to introduce new products like cell culture into the European customer base, and to replicate the Germany model in other key EU geographies. Those 70–80% of revenues currently concentrated in Germany represent untapped franchise value across the broader EU market.
The ₹600 Crore Bet: What Panchla Changes
This is the central thesis for Tarsons in FY27 and beyond.
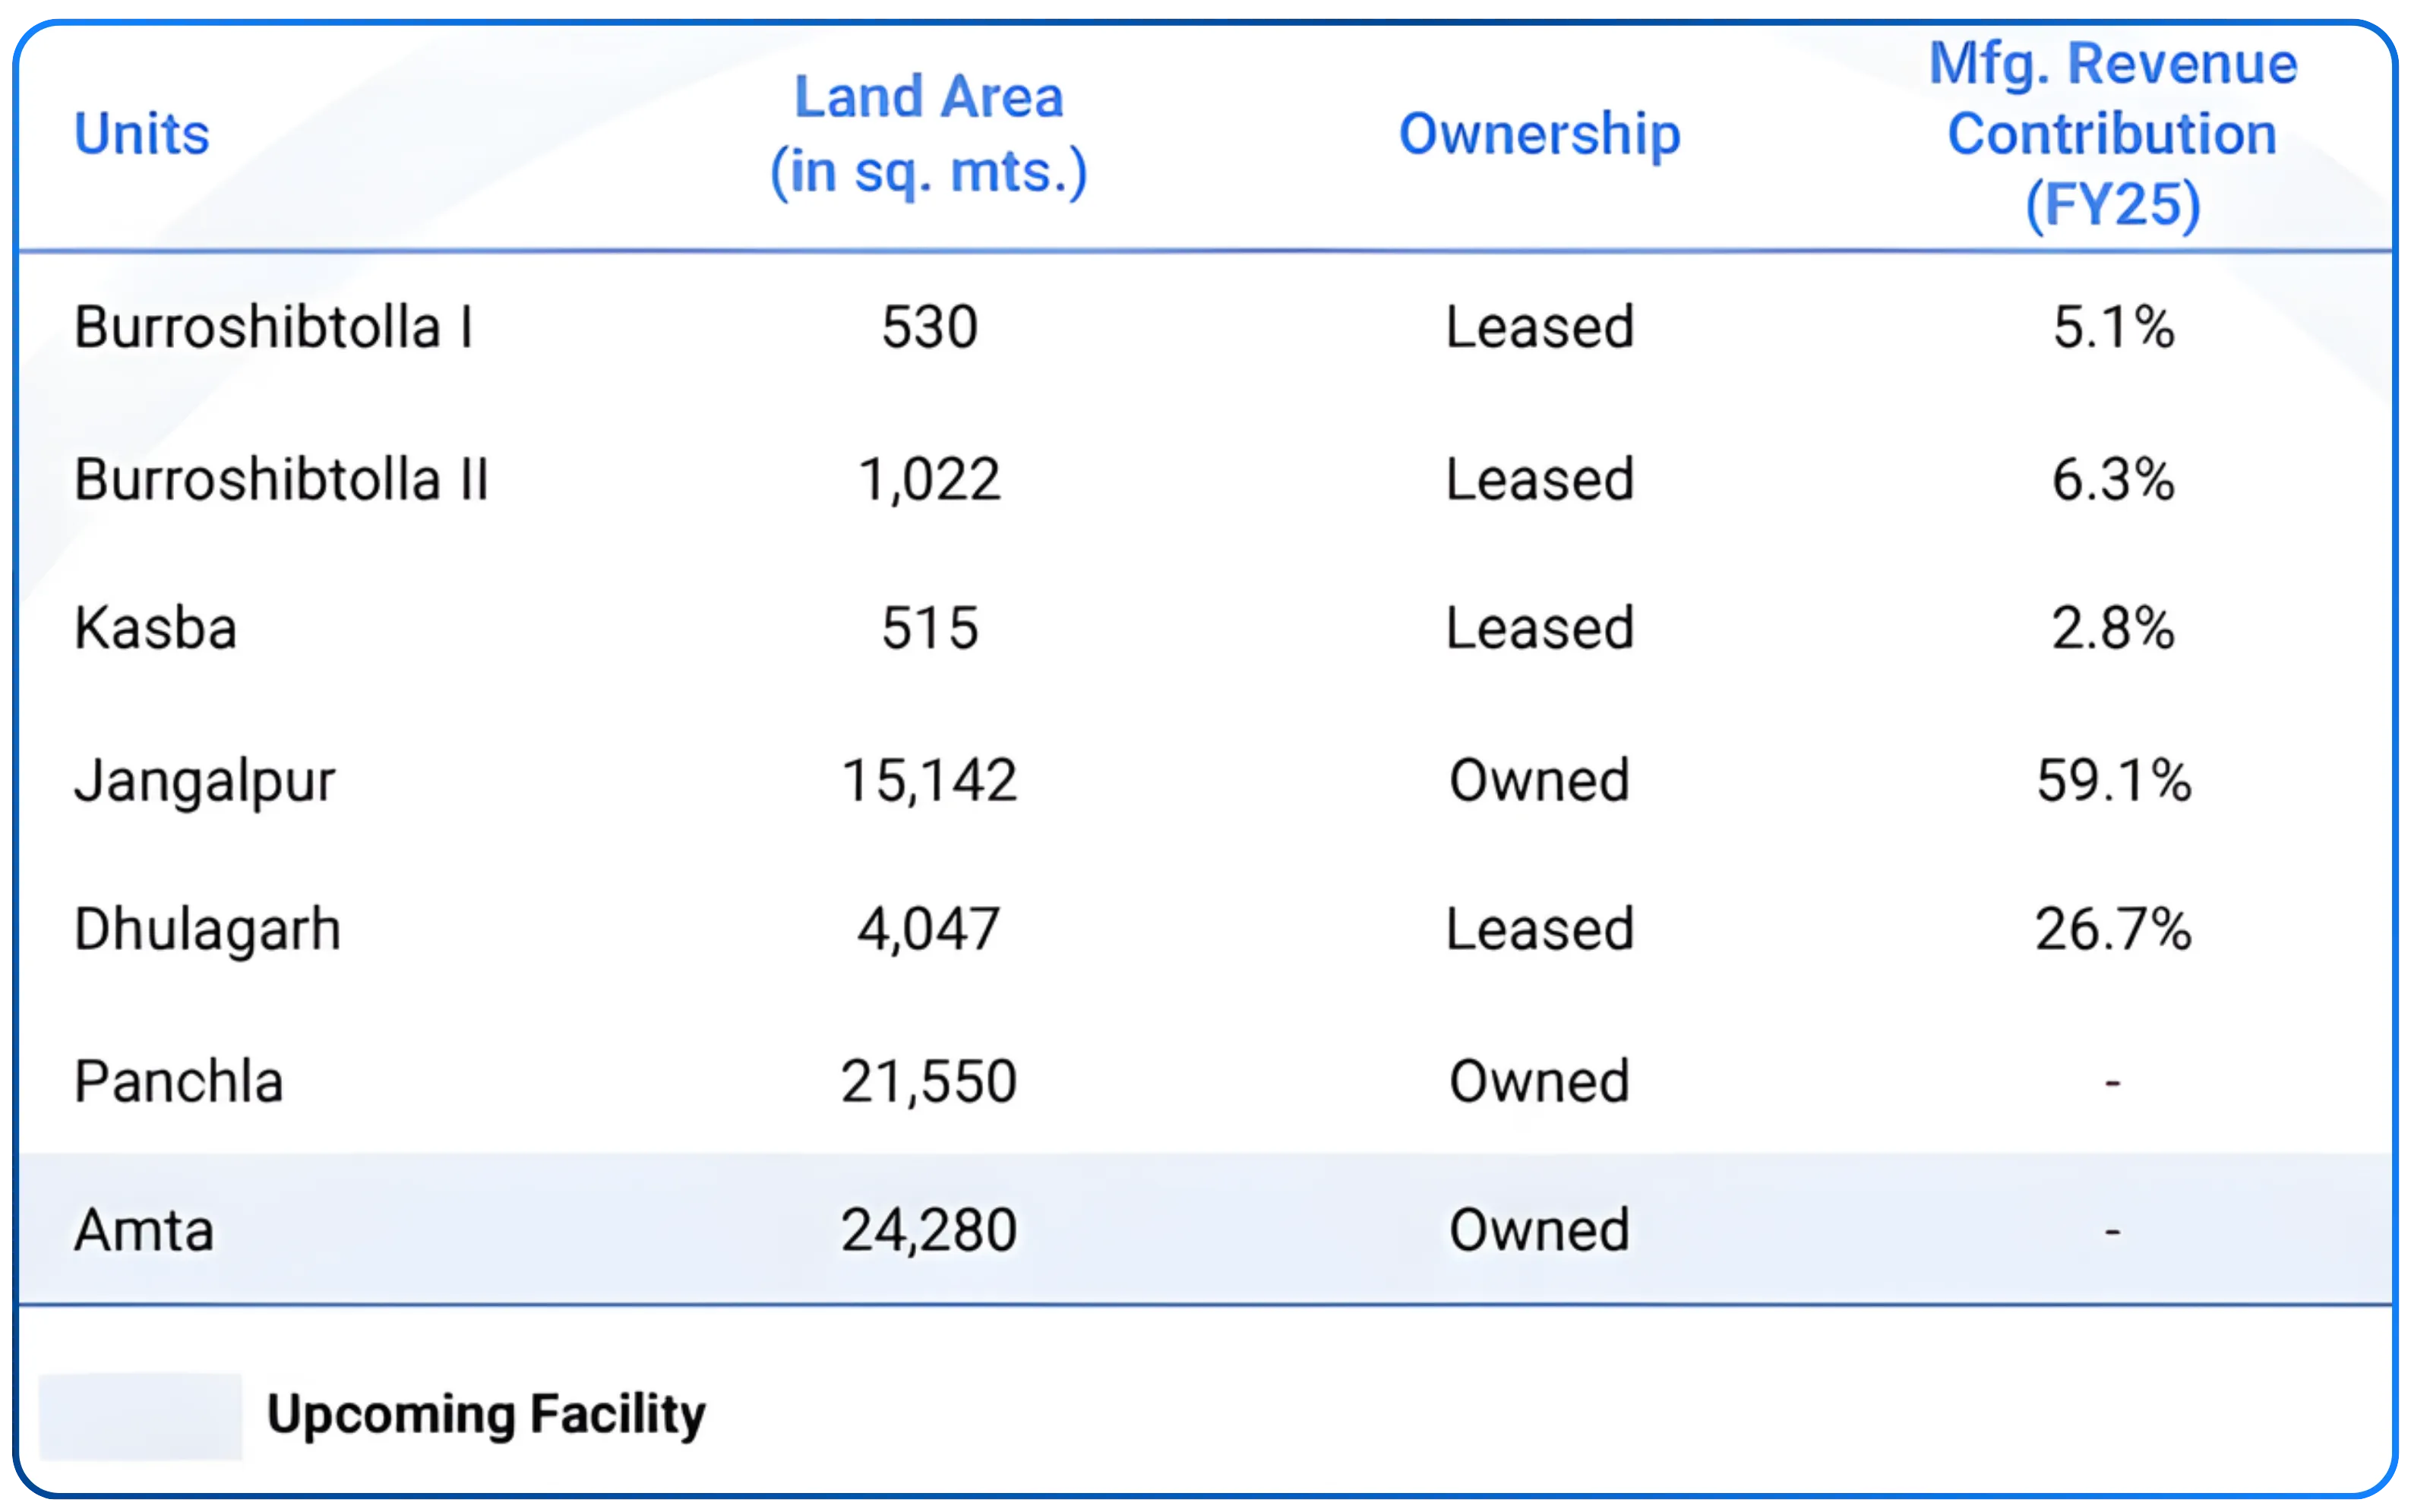
Beginning in FY22, Tarsons committed to a ₹600 crore capital expenditure program across two new facilities: the Panchla plant (21,550 sq. mt. of owned manufacturing space for cell culture vessels, bioprocess containers, capacity expansion of existing products) and the Amta facility (24,280 sq. mt. for a fulfillment center with in-house sterilization and selective manufacturing capability). The strategic rationale was clear: expand into new, technologically adjacent product categories that Tarsons had never manufactured — categories that were 100% imported by India's growing biopharma and life sciences sector.
Here is the current status as of Q3 FY26:
Bioprocess containers and bottles (at Panchla): Commissioned and selling. Products are already reaching customers in India and international markets. Revenue potential at full utilization: in excess of ₹150 crores from this product line alone.
Cell culture vessels (at Panchla): Expected to be commissioned in Q4 FY26. This is the higher-margin, higher-stickiness product category.
Amta sterilization facility: Operational. Built to eliminate Tarsons' sole dependence on the only third-party sterilization plant in eastern India — a critical infrastructure de-risking, not just an expansion.
The Panchla facility breakeven economics are straightforward. Management indicated that at approximately ₹70–75 crores of revenue from the overall Panchla facility, the business reaches "cash positive, EBITDA positive numbers", a relatively modest threshold given the long-term potential.
The ramp timeline is realistic and explicitly framed: 15–20% of installed capacity in Year 1, 30–35% in Year 2, and near-full utilization over 3–4 years. This is a practical timeline for getting customers to validate products, update SOPs, and progressively shift purchasing to Tarsons.
Why does the cell culture category matter so much? Once a lab validates Tarsons' cell culture flasks and plates, the switching cost is embedded in their SOP. This creates a multi-year, defensible revenue stream per customer, very different from the consumables business, where switching is easier and price competition is more acute.
Tarsons' built-in advantage for cell culture customer acquisition? Thirty years of existing relationships with the same scientific user base. Every customer in India who already buys Tarsons' centrifuge tubes or pipette tips already trusts the brand.
The Gross Margin Story: What 68–70% Means in Manufacturing
Tarsons operates at 68–70% gross margins across its product portfolio. The standalone business reported a gross margin of 71.1% in Q3 FY26. At the consolidated level (including Nerbe, which inherently has lower margins as a distribution business), the gross margin was 67.4%.
To put this in context: most Indian specialty chemicals companies target 40–50% gross margins. Most FMCG companies celebrate 55%. Even premium consumer goods companies rarely sustain 65%+. Tarsons does it while selling to price-sensitive institutional buyers in a competitive market.
Tarsons controls the entire production chain. High-quality medical grade resins come in, precision-manufactured, sterility-validated products go out. And because the resins are specified (DMF-registered, medical grade), there is limited ability for competitors to meaningfully undercut on quality at the same margin level; those who try do so by cutting resin quality, which sophisticated customers detect.
The gross margin has been remarkably stable through the down cycle. Even as EBITDA margins compressed (from peak levels of 40%+ in COVID years to 32–35% today) due to fixed cost deleverage, the gross margin held. Tarsons’ moat actually sits in the manufacturing process, not in pricing power or sales leverage.
The Financial Journey
The financial story of Tarsons over the past three years cannot be read through the lens of reported PAT. Here is why.
As Panchla began to be capitalized (partially, from Q2 FY25 onwards), Tarsons began booking accelerated depreciation on assets whose revenue contribution is still in early stages. The 9-month FY26 depreciation charge jumped to ₹60.6 crores, compared to ₹36.35 crores in the same period of FY25 — a ₹24 crore increase that flows entirely to the bottom line as a PAT headwind, with no corresponding revenue offset yet.
| Period | Revenue (₹ Cr) | EBITDA (₹ Cr) | EBITDA Margin | Adj. Cash PAT (₹ Cr) | Growth |
|---|---|---|---|---|---|
| Q3 FY25 | 95.7 | 29.6 | 31.0% | 22.7 | — |
| Q3 FY26 | 107.9 | 31.5 | 29.2% | 31.4 | +38.6% |
| 9M FY25 | 279.7 | 73.7 | 26.3% | 62.0 | — |
| 9M FY26 | 301.6 | 83.7 | 27.7% | 78.9 | +27.3% |
(Consolidated figures. Adjusted Cash PAT = Adjusted PAT + Depreciation)
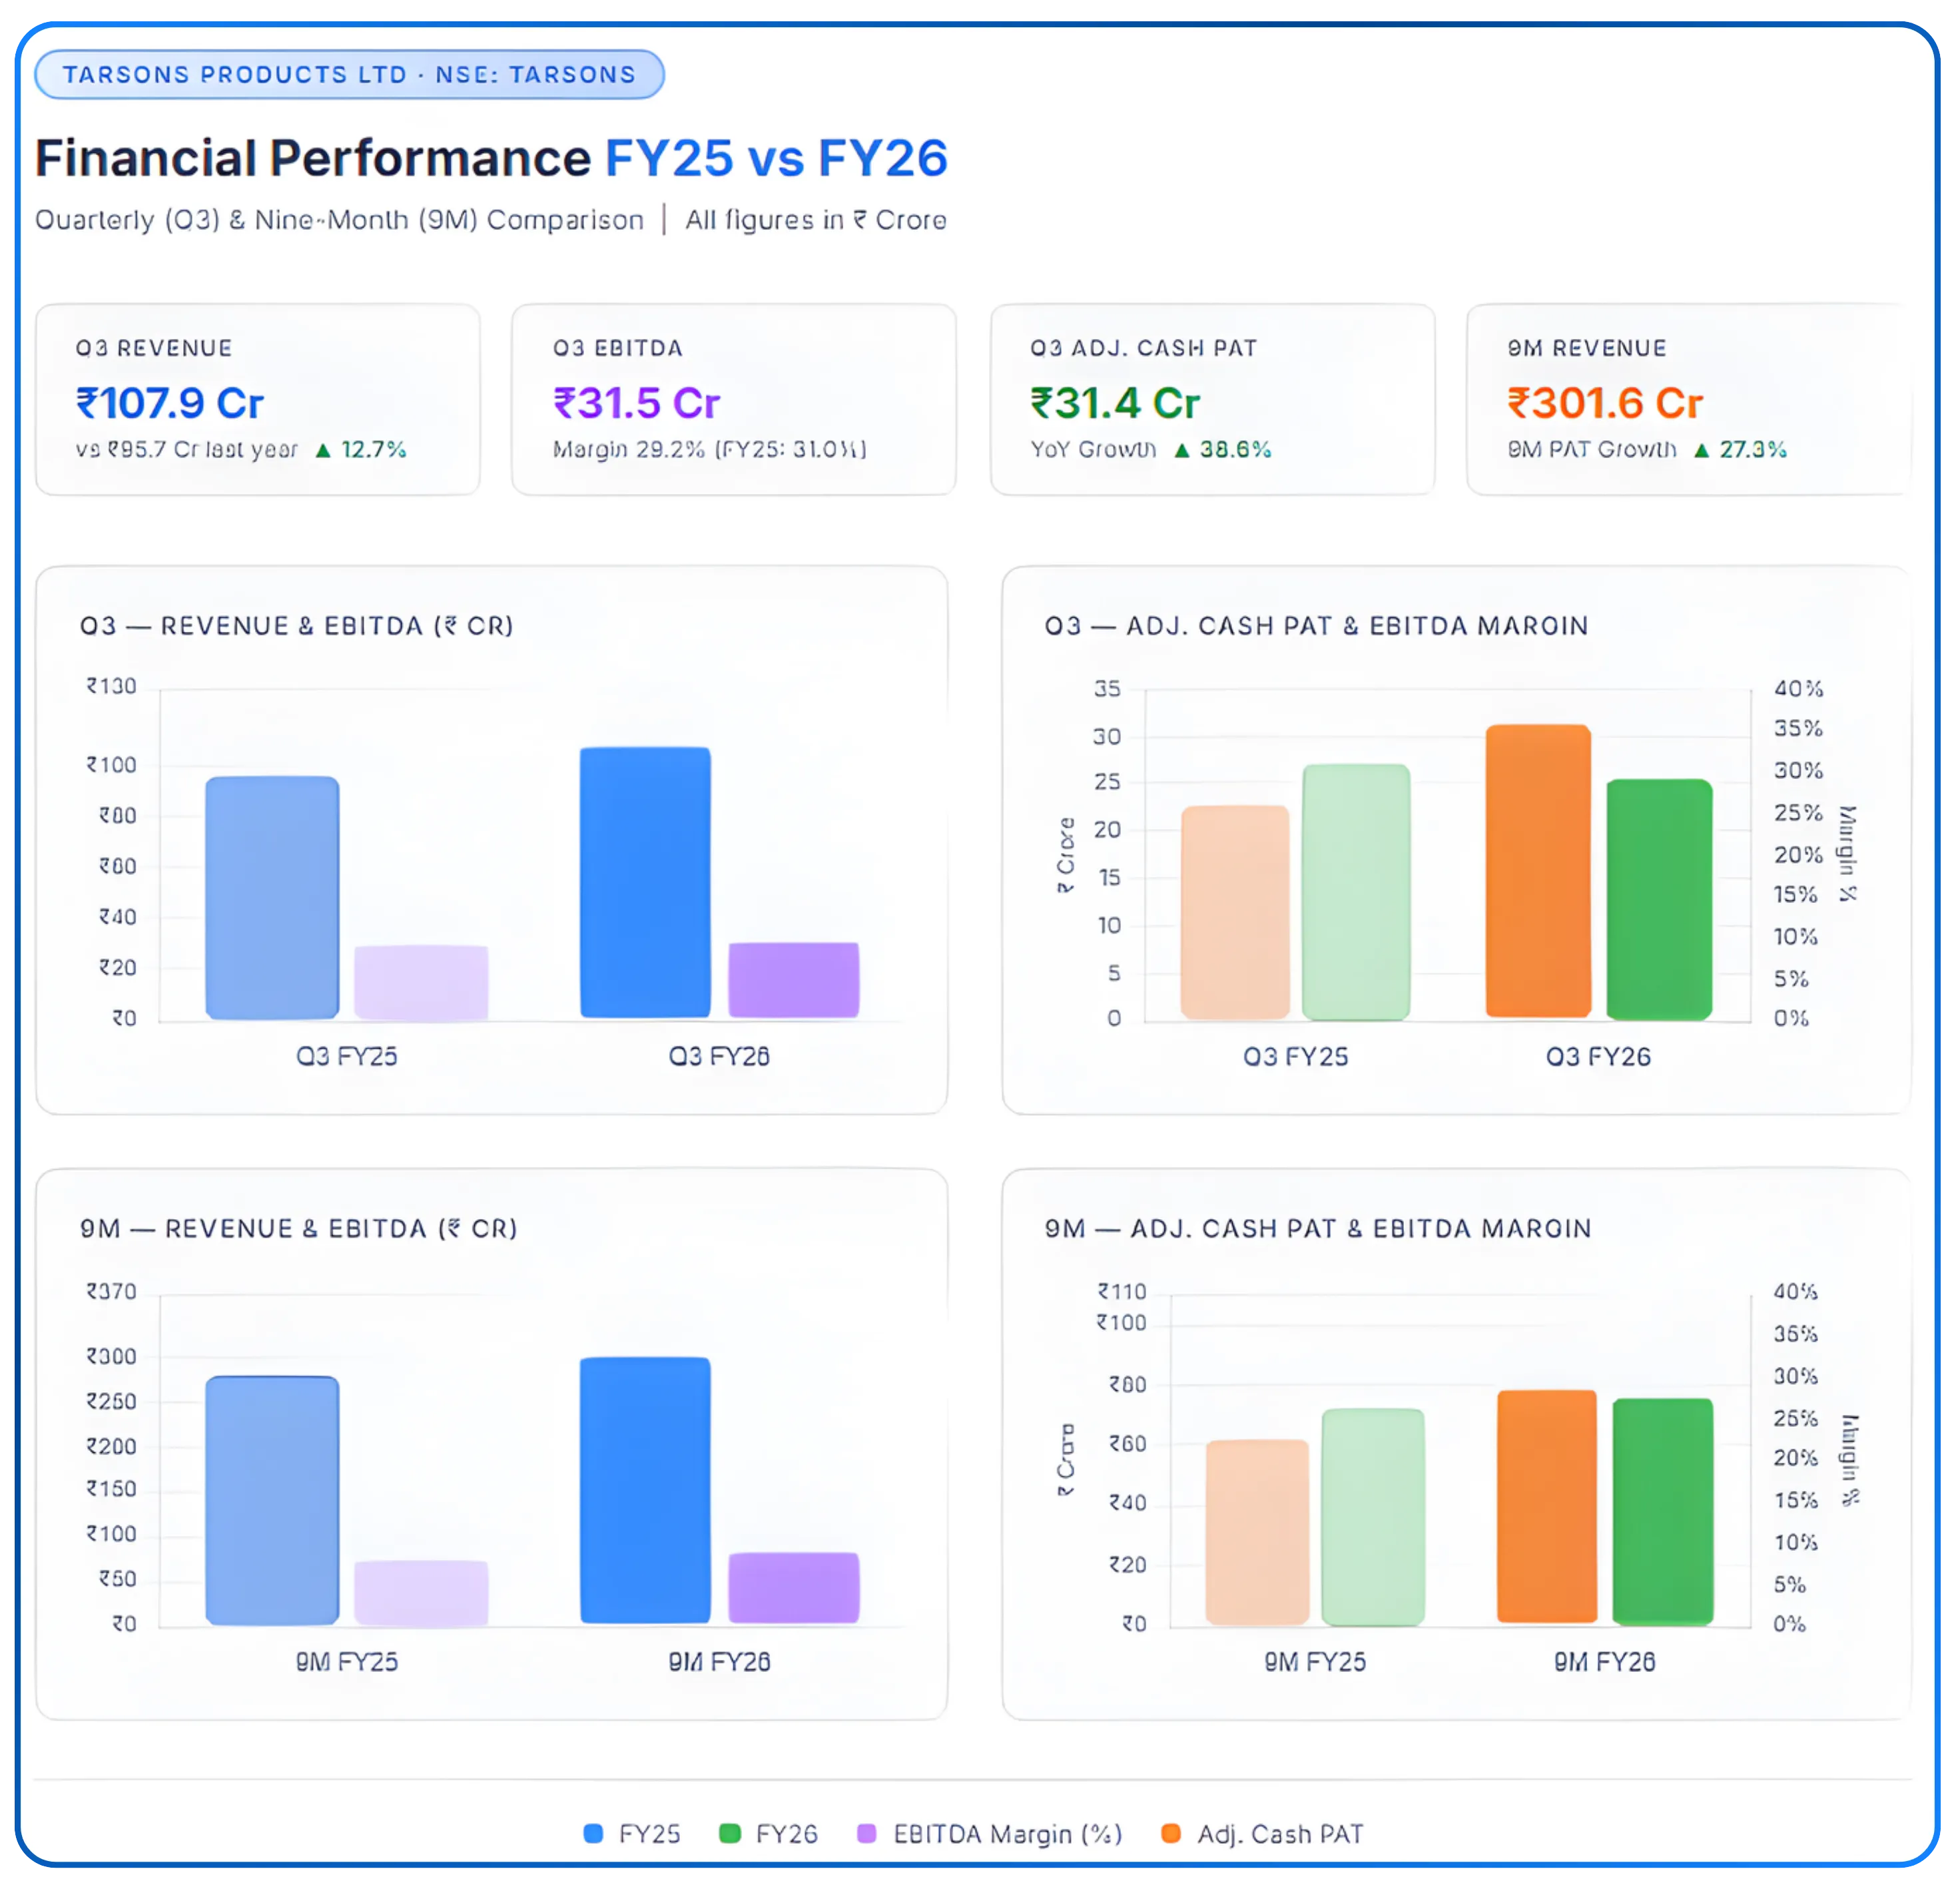
Q3 FY26 standalone EBITDA margin was 34.7%, and standalone Cash PAT grew 33.9% YoY to ₹31.1 crores.
The revenue growth (12.8% consolidated in Q3 FY26, and 10.3% standalone) signals that the core business is recovering from its FY24 trough. EBITDA is growing faster than revenue (Q3 EBITDA +6.3% consolidated, +4.4% standalone, but with improving margin trajectory in 9M numbers). And cash generation is accelerating significantly — 38.6% cash PAT growth in Q3, 27.3% in the 9M period. This is the shape of a business that is past the worst of its cycle and beginning to compound.
The EBITDA margin delta between standalone (34.7%) and consolidated (29.2%) reflects Nerbe's lower-margin distribution business. As Nerbe begins cross-selling Tarsons' higher-margin manufactured products and scales its geographic reach, this gap should narrow over time, a secondary source of margin expansion embedded in the structure.
The Historical Returns: What the Numbers Actually Show
Profit & Loss — Consolidated (₹ Crores)
| Metric | FY21 | FY22 | FY24 | FY25 | TTM |
|---|---|---|---|---|---|
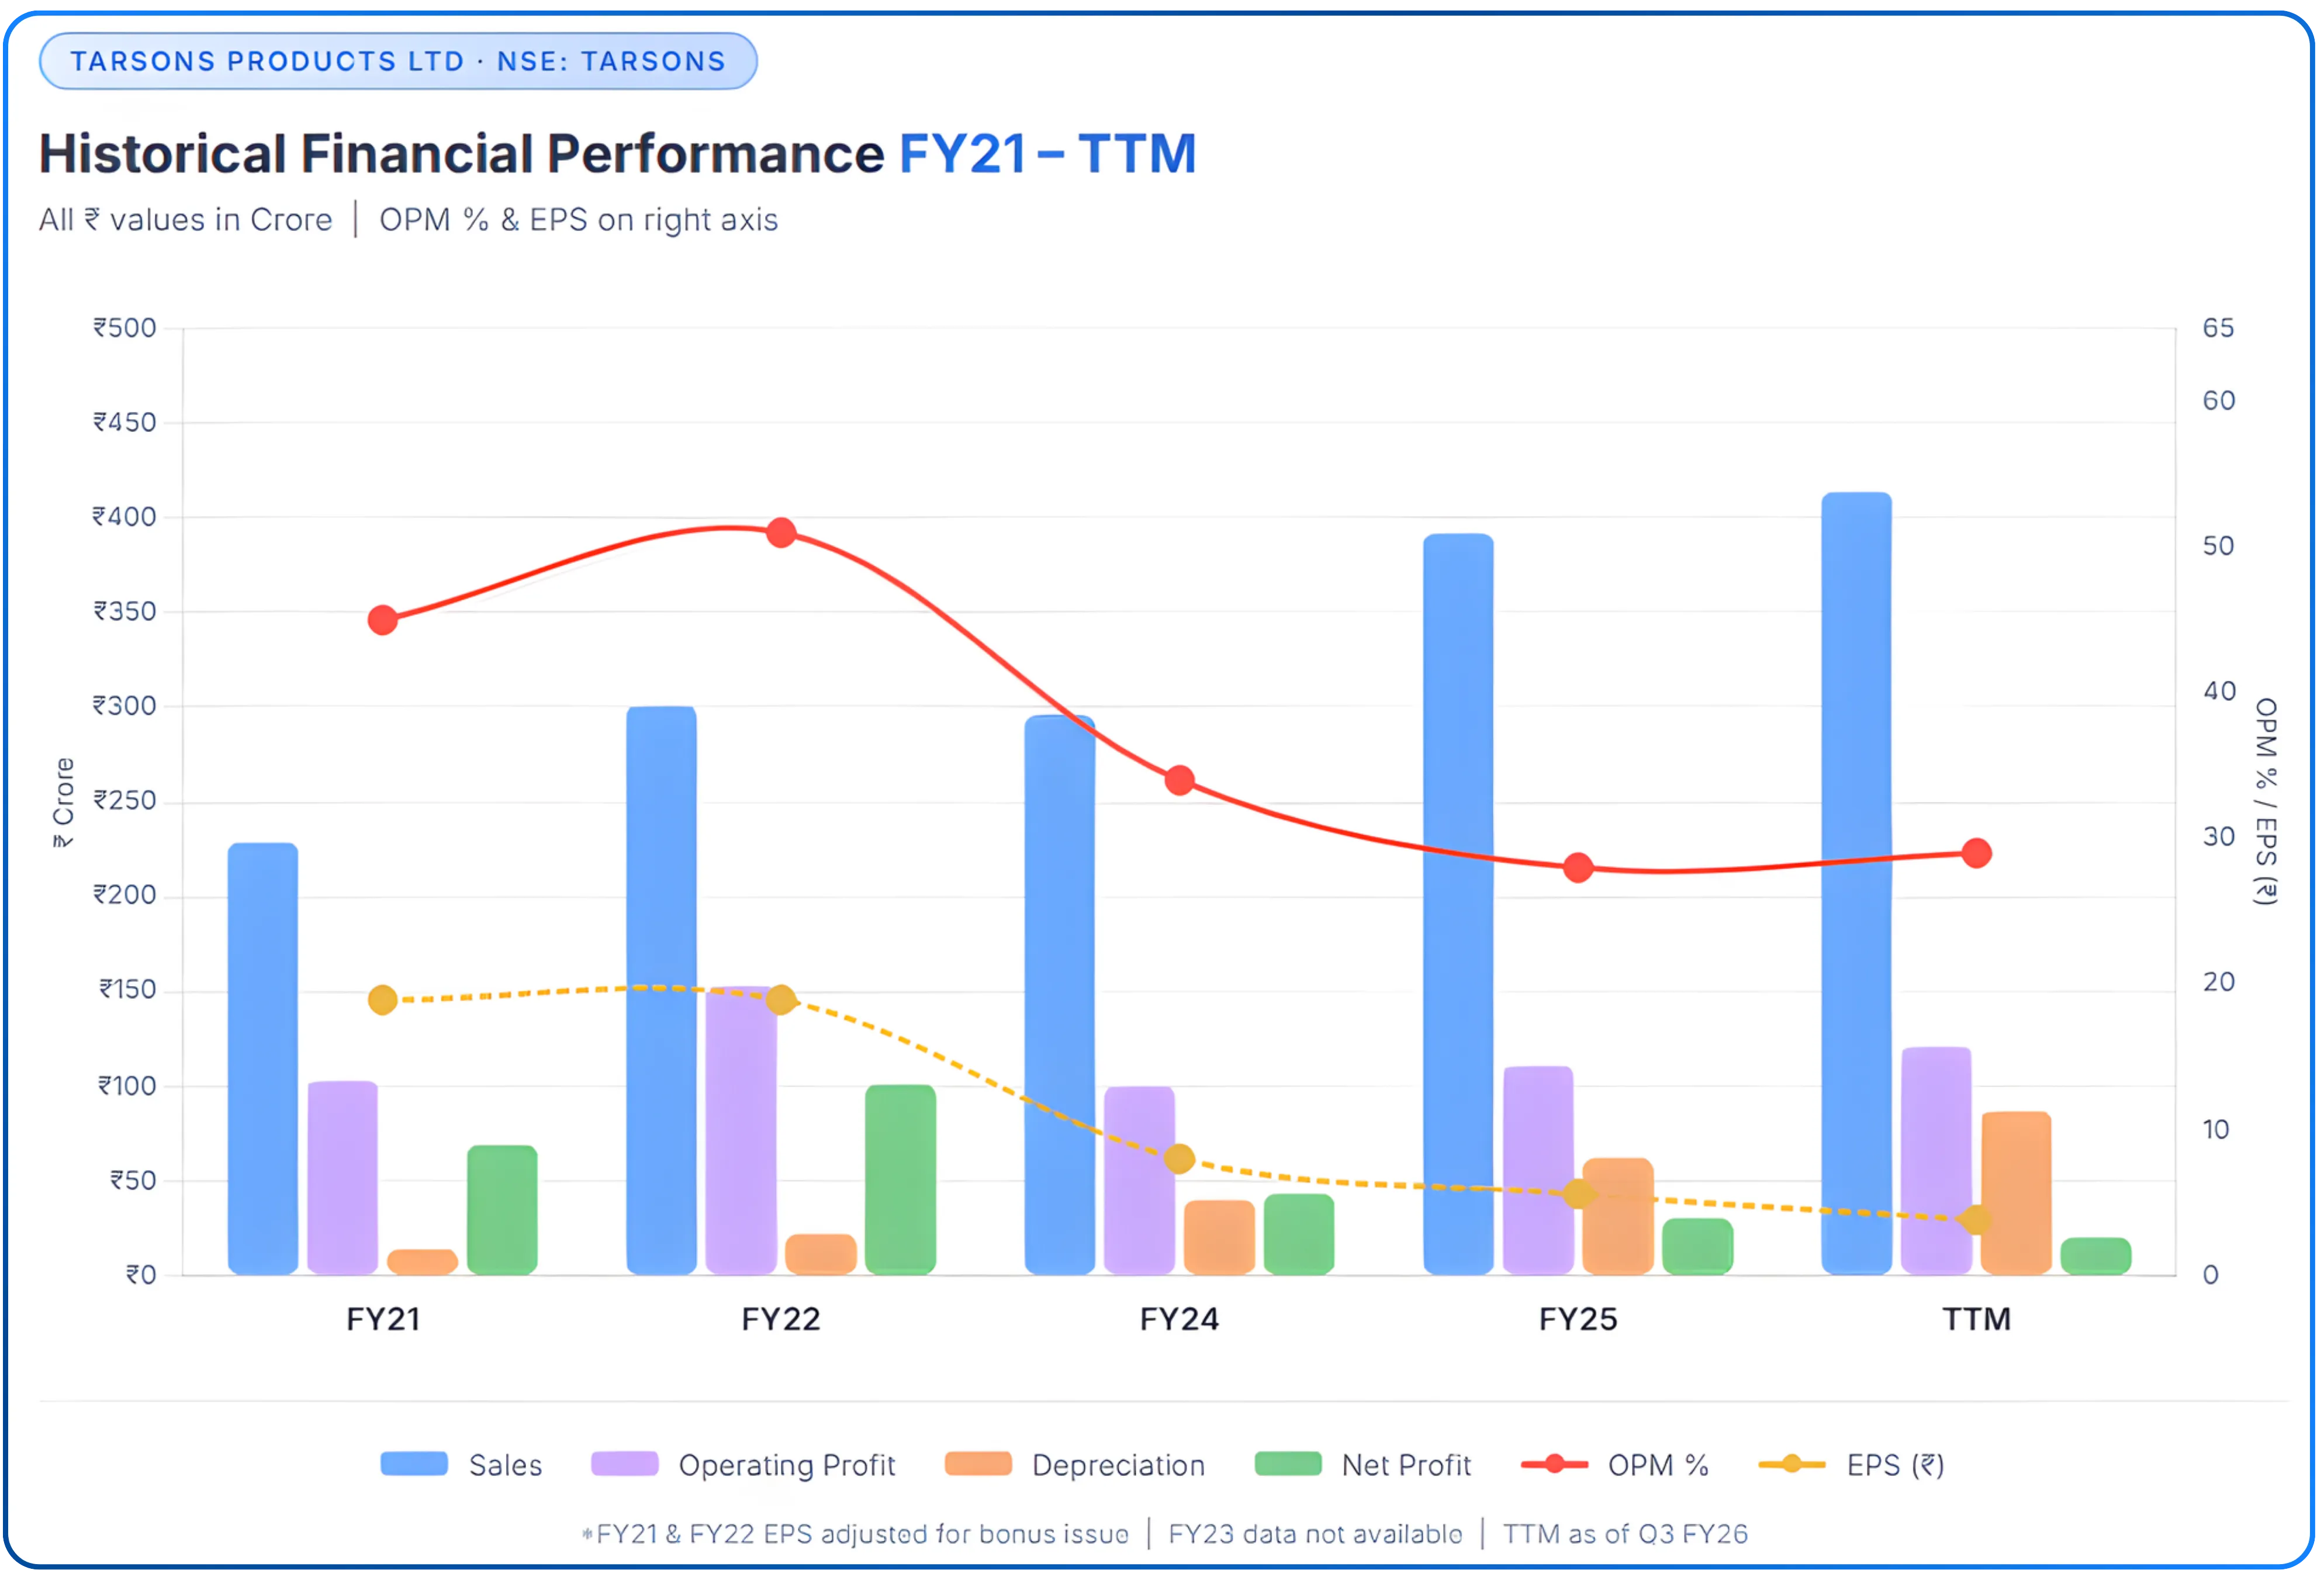
| Sales (₹ Cr) | 229 | 301 | 296 | 392 | 414 |
| Operating Profit (₹ Cr) | 103 | 153 | 100 | 111 | 121 |
| OPM % | 45% | 51% | 34% | 28% | 29% |
| Depreciation (₹ Cr) | 14 | 22 | 40 | 62 | 87 |
| Net Profit (₹ Cr) | 69 | 101 | 43 | 30 | 20 |
| EPS (₹) | 18.92* | 18.92 | 8.01 | 5.60 | 3.82 |
Pre-IPO EPS adjusted for share count, hence the anomaly in FY21.
Balance Sheet — Consolidated (₹ Crores)
| Metric | FY21 | FY22 | FY24 | FY25 | Sep 2025 |
|---|---|---|---|---|---|
| Equity + Reserves (₹ Cr) | 244 | 490 | 613 | 631 | 627 |
| Borrowings (₹ Cr) | 34 | 22 | 269 | 339 | 396 |
| Fixed Assets (₹ Cr) | 120 | 189 | 336 | 536 | 583 |
| CWIP (₹ Cr) | 22 | 32 | 267 | 233 | 251 |
| Total Assets (₹ Cr) | 296 | 544 | 972 | 1,080 | 1,164 |
Three things stand out from these tables:
First, the peak business was extraordinary. FY21 OPM of 45% and FY22 OPM of 51%. These margins are now suppressed, not structurally destroyed.
Second, Depreciation went from ₹22 Cr in FY22 to ₹87 Cr TTM, a ₹65 crore annual charge that has been the mechanical cause of the net profit collapsing from ₹101 Cr to ₹20 Cr TTM. Revenue has actually grown from ₹301 Cr to ₹414 Cr over the same period.
Third, borrowings built from ₹22 Cr (FY22) to ₹396 Cr (Sep 2025) to finance the Panchla and Amta capex. Once the capex cycle is complete and Panchla revenues build, the debt service metrics will look very different against a meaningfully higher EBITDA base.
If you're interested in how India's industrial backbone is being rewired, this sector deep-dive is worth your time: A Comprehensive Analysis of India's Logistics and Supply Chain Sector — Part 1/2
The Valuation: A Capex Discount or a Business Discount?
At the current market price of ₹186 (February 25, 2026), down over 75% from its listing high, Tarsons trades at the following verified multiples:
| Metric | Value |
|---|---|
| Market Cap | ₹992 Cr |
| Stock P/E | 46.7x (depressed PAT due to depreciation) |
| EV/EBITDA | 9.55x (vs historical median 18.2x) |
| Price to Sales | 2.39x (vs historical median ~8.8x) |
| Price to Book | 1.58x |
| Book Value per Share | ₹118 |
| ROCE | 6.91% (suppressed by capex-heavy asset base) |
| ROE | 4.75% |
| Gross Margin | 67–71% |
| Standalone EBITDA Margin | 34.7% |
The single most striking number in the table above is the EV/EBITDA comparison. Tarsons today trades at 9.55x EV/EBITDA against a 5-year historical median of 18.2x, a 47% discount to its own normalised valuation band. The stock has re-rated downward as the market priced in the capex overhang, depreciation headwind, and pricing cycle.
Similarly, the Market Cap / Sales ratio has compressed from a median of 8.8x to approximately 2.4x today. The revenue base (₹414 Cr TTM revenues) is at an all-time high even as the multiple is near an all-time low.
For a business with:
- 68–70% gross margins
- 34%+ standalone EBITDA margins
- A greenfield facility (Panchla) with ₹150+ crore revenue potential from just the bioprocess lines
- Cell culture capabilities coming online in Q4 FY26 — products with superior switching costs
- Export demand set to structurally improve with India-US and India-EU trade developments
- 40+ years of brand equity with the Indian scientific community
9.55x EBITDA against a historical median of 18.2x prices this business for a permanent structural deterioration that the operating evidence does not support.
The more instructive lens is Cash PAT. On an annualized basis, the 9M FY26 consolidated Adjusted Cash PAT of ₹78.9 crores suggests a run-rate of approximately ₹100–105 crores. As Panchla revenues begin flowing through and the depreciation charge is absorbed by top-line growth, reported PAT will recover rapidly.
The Risks: What Could Extend the Down Cycle
Tarsons carries several risks that investors should understand clearly.
Pricing pressure may persist longer than expected. The domestic market is in a period of excess capacity and aggressive competitive pricing. Indian labware players who built COVID-era capacity are still working off that overhang. Tarsons' volume-led strategy, backed by brand quality and supply reliability, is the right response — but it implies that near-term top-line growth will be moderate, not explosive. A buyer's market that lasts for two more years depresses the investment case.
The Panchla ramp depends on customer SOP adoption cycles. Cell culture has materially higher switching costs — which cut both ways. Winning customers away from established suppliers (Corning, Greiner, Thermo Fisher) requires not just product quality, but a validation process that is embedded in their R&D protocols. If onboarding is slower (due to customer inertia, budget cuts, or geopolitical uncertainty in export markets) the Panchla revenue ramp could be delayed, and the depreciation headwind to reported PAT will persist.
Export catalysts depend on policy execution. The US FTA tariff reduction from 50% to 18% is potentially transformative, but it is not yet implemented. The EU FTA benefit (6% to 0%) is more certain but smaller. Geopolitical trade uncertainty means that international order flows can remain lumpy and unpredictable.
The GeM procurement issue in the domestic institutional segment. The Government e-Marketplace has effectively commoditized government procurement of lab consumables. L1 price-based purchasing has penalized quality suppliers and created a structural headwind. Unless GeM procurement rules evolve to accommodate specification-based buying, the government budget allocations to healthcare and biopharma will not translate proportionally into revenue for premium labware companies like Tarsons.
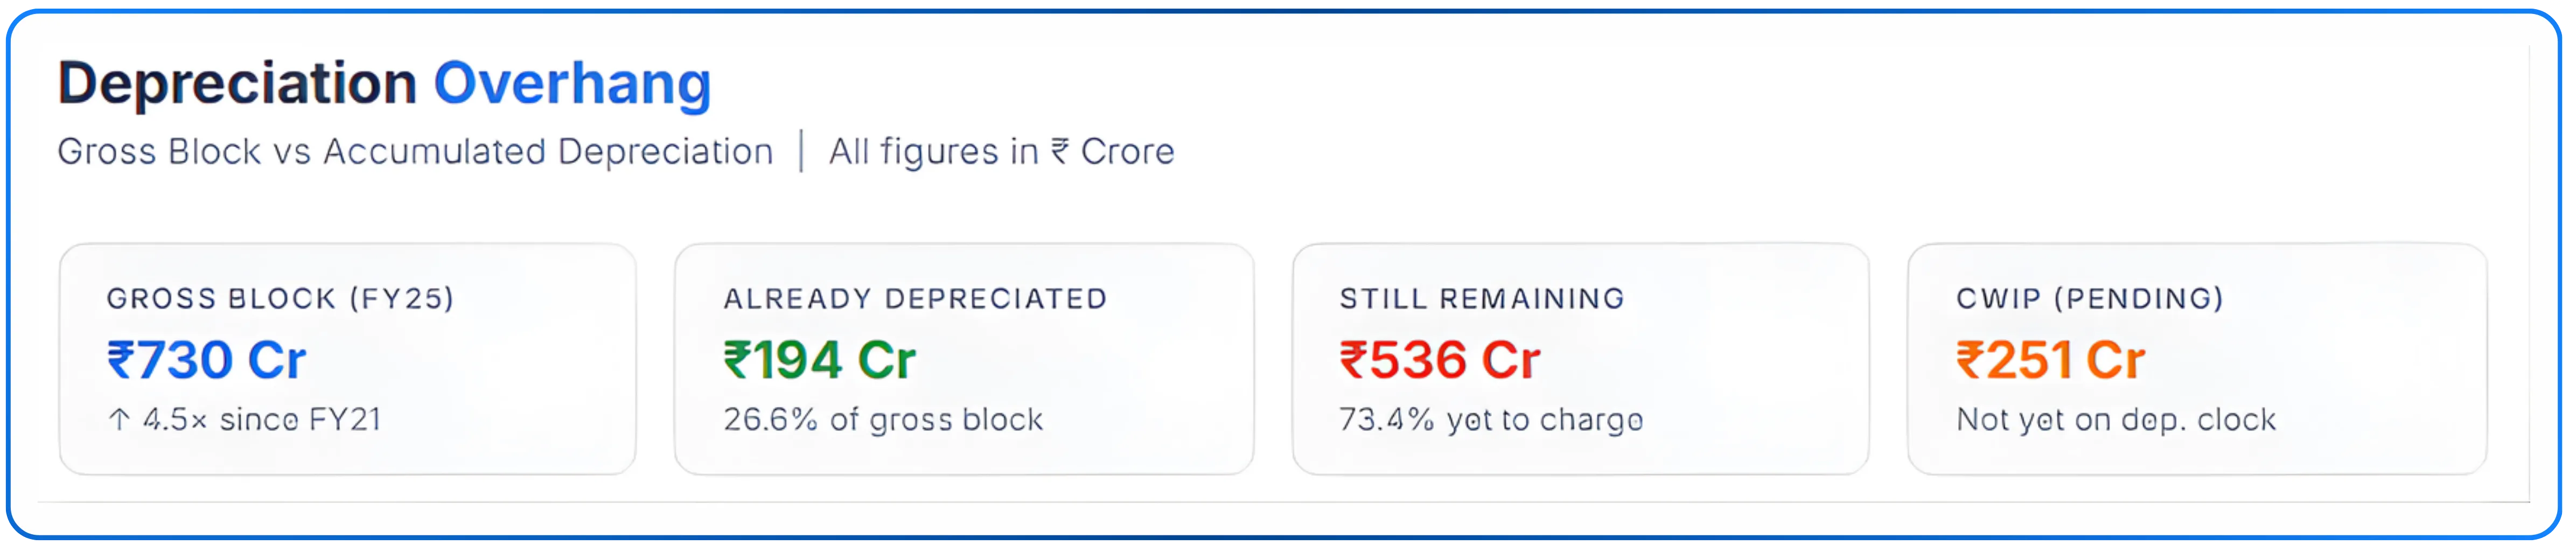
Tarsons has depreciated only roughly 27% of its gross block (₹194 Cr of ₹730 Cr as of FY25), with ₹536 Cr still on the clock. At the current run-rate of approximately ₹87 Cr/year, existing assets alone carry close to 6 years of depreciation ahead. With ₹250 Cr in CWIP yet to be capitalized, annual depreciation could rise to ₹120–140 Cr — keeping net profit suppressed well into FY30.
The Catalysts: What Could Re-Rate the Stock
Three developments, if they occur in the next 12–18 months, could meaningfully close the gap between current valuation and underlying business quality.
The Panchla revenue inflection. As bioprocess container sales scale and cell culture vessels begin contributing revenue from Q4 FY26 onwards, the top line should accelerate, the depreciation charge gets absorbed by revenue growth, and reported PAT begins recovering. At the guidance-implied ₹70–75 crores of Panchla revenue for EBITDA breakeven, even partial utilization in FY27 represents a meaningful P&L step-change.
The US tariff reduction. If the India-US trade framework reduces labware import duties from 50% to 18%, Tarsons' cost competitiveness in the American market improves dramatically. The US labware market is large, fragmented at the distributor level, and more open to non-domestic manufacturing than EU markets. Tarsons has been building its US ODM relationships for over 17 years. A meaningful tariff reduction is an accelerant on an existing commercial relationship, not a cold start.
Operating leverage as Panchla scales. The fixed cost base (engineering staff, management headcount, cleanroom depreciation) is already being absorbed. Revenue from the new facilities is incremental against a largely fixed cost structure. When Panchla moves from 20% to 50% utilization, the EBITDA contribution per incremental rupee of revenue will be significantly higher than the legacy business. This is the operating leverage flywheel that makes the investment compelling at current multiples — if the ramp thesis holds.
Conclusive Take
Tarsons Products has spent four decades building something genuinely hard to replicate: a vertically integrated, ISO-certified labware manufacturer with customer relationships in an industry where trust is the primary purchasing criterion.
The numbers confirm the structural quality. Gross margins of 68–70%, sustained through COVID and normalization. Standalone EBITDA margins consistently above 30%, even in the current down cycle. Cash PAT growing 25–38% year-on-year as reported PAT is artificially suppressed by depreciation on assets whose revenue hasn't arrived yet.
The ₹600 crore capex program has taken longer than planned — COVID-era machinery delays, market normalization, geopolitical disruptions. But the facility is almost entirely built. Bioprocess lines commissioned. Cell culture lines online in Q4 FY26. Fixed costs already running through the P&L.
What comes next is revenue. With 70% gross margins and largely absorbed fixed costs, the operating leverage is significant. Reported PAT will recover sharply as Panchla top-line builds.
At ₹992 crore market cap and 9.55x EV/EBITDA against a historical median of 18.2x, the market is pricing Tarsons as if Panchla revenue never arrives. Operational ramp of bioprocess lines, management's FY27 acceleration guidance, improving domestic demand, and export tailwinds suggest the discounting is overdone.
Turn research into action — trade smarter on CubePlus.
Disclaimer: The information provided in our blogs is for informational purposes only and should not be construed as financial, investment, or trading advice. Trading and investing in the securities market carries risk. Always conduct your own research and consult with a qualified financial advisor before making any investment decisions. Past performance is not indicative of future results. Copyrighted and original content for your trading and investing needs.
© 2026 — Tradejini. All Rights Reserved.