


The fertilizer industry in India is not a typical manufacturing sector. Its relevance is anchored in food security, rural incomes, and fiscal policy rather than free-market pricing or discretionary demand. As the fertilizer industry in India enters 2026, the sector remains one of the world’s largest consumers of crop nutrients, functioning as a policy-supported backbone of agricultural productivity rather than a free-market manufacturing industry.
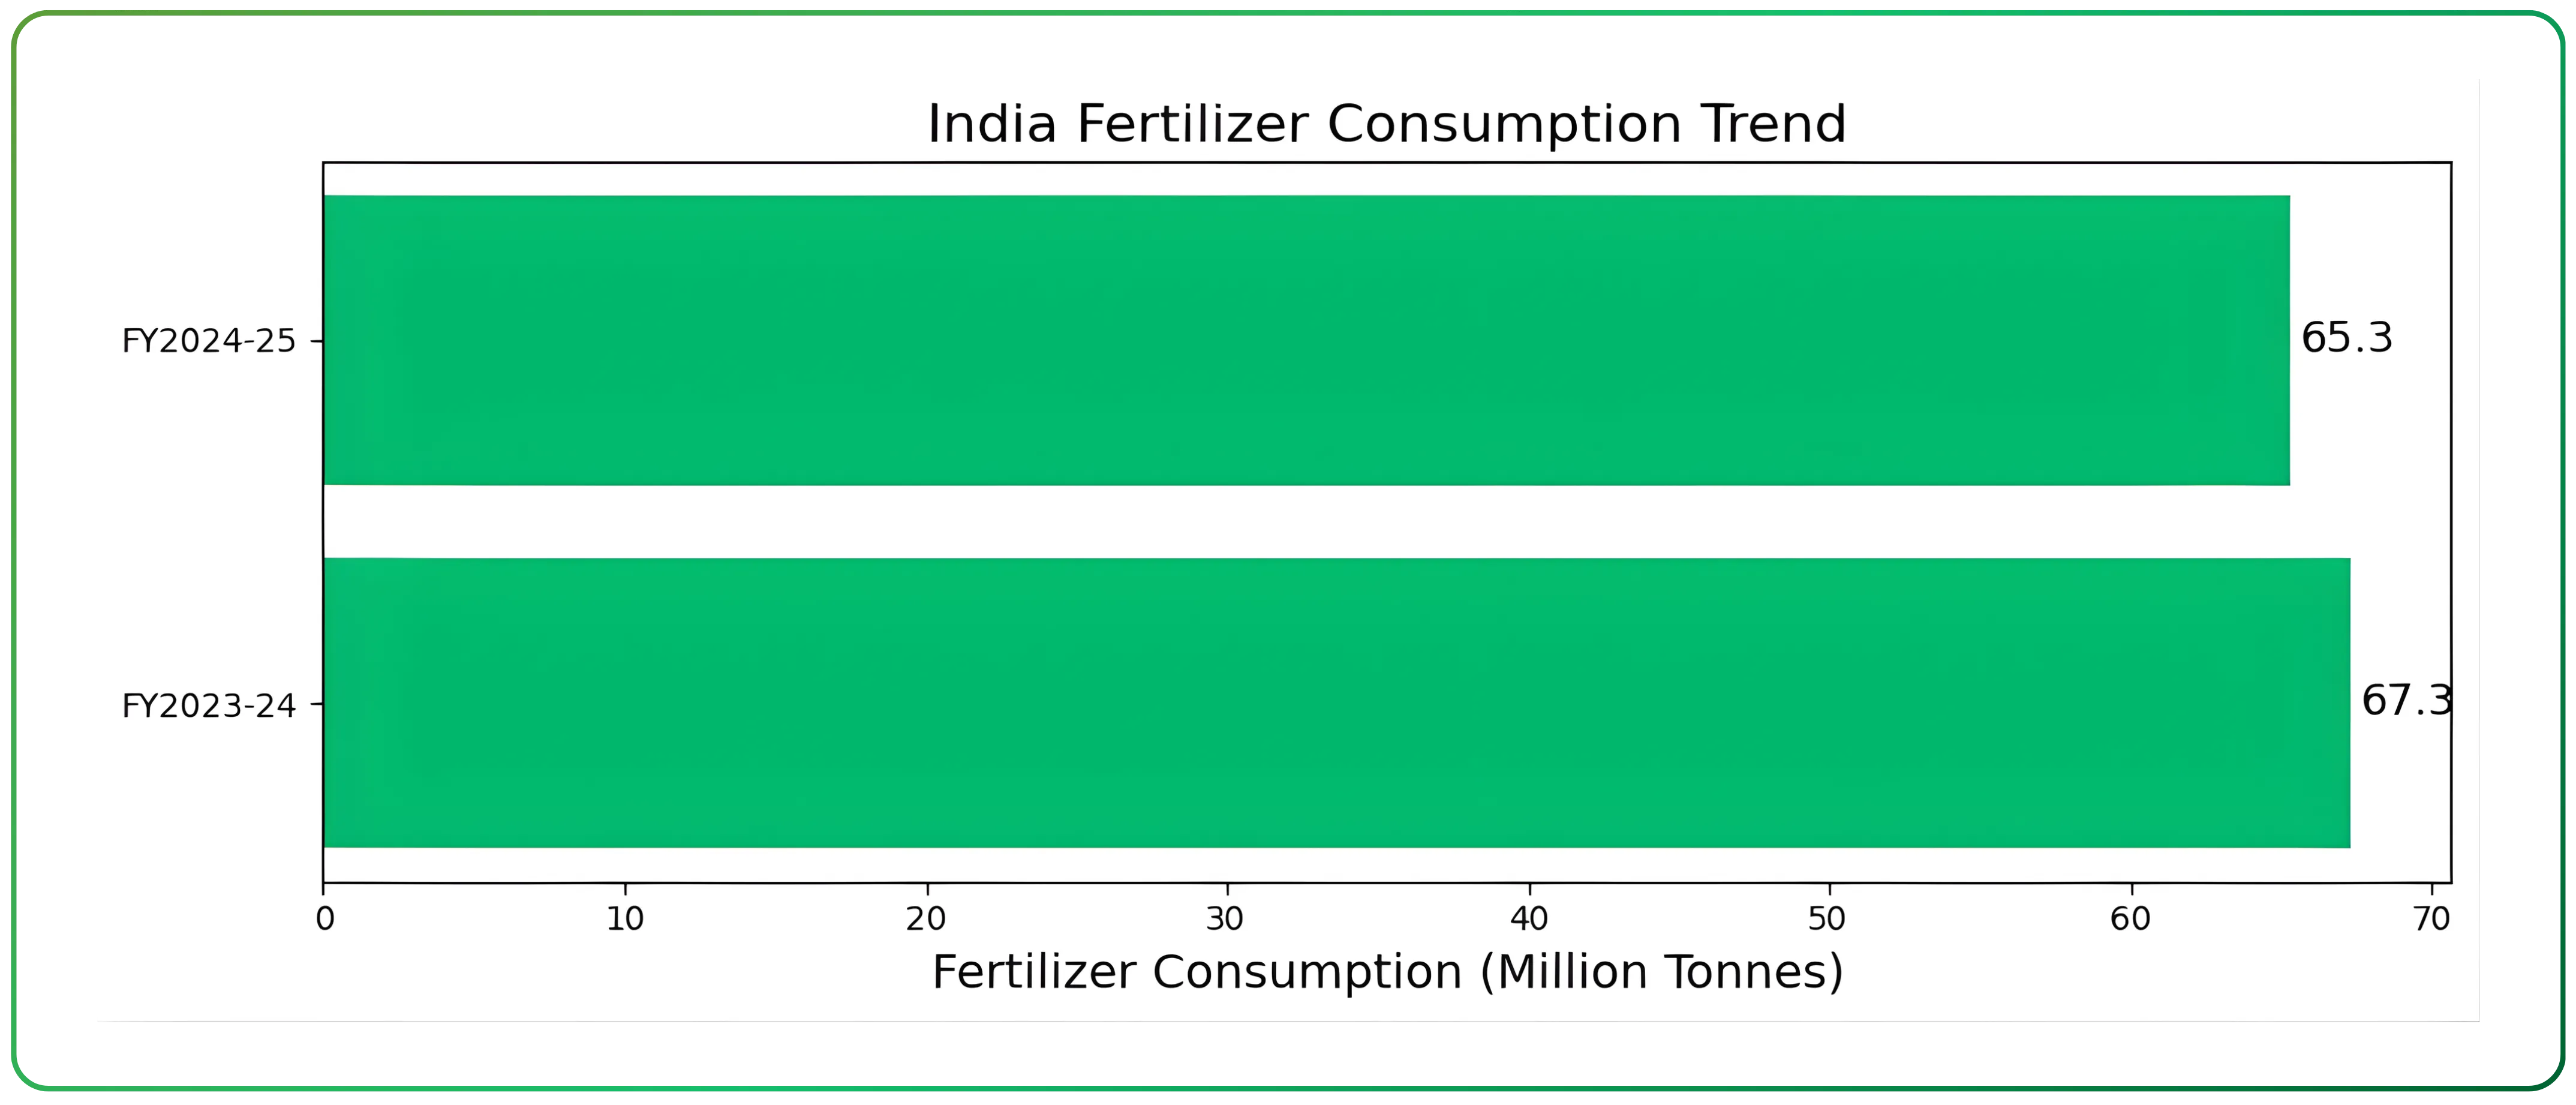
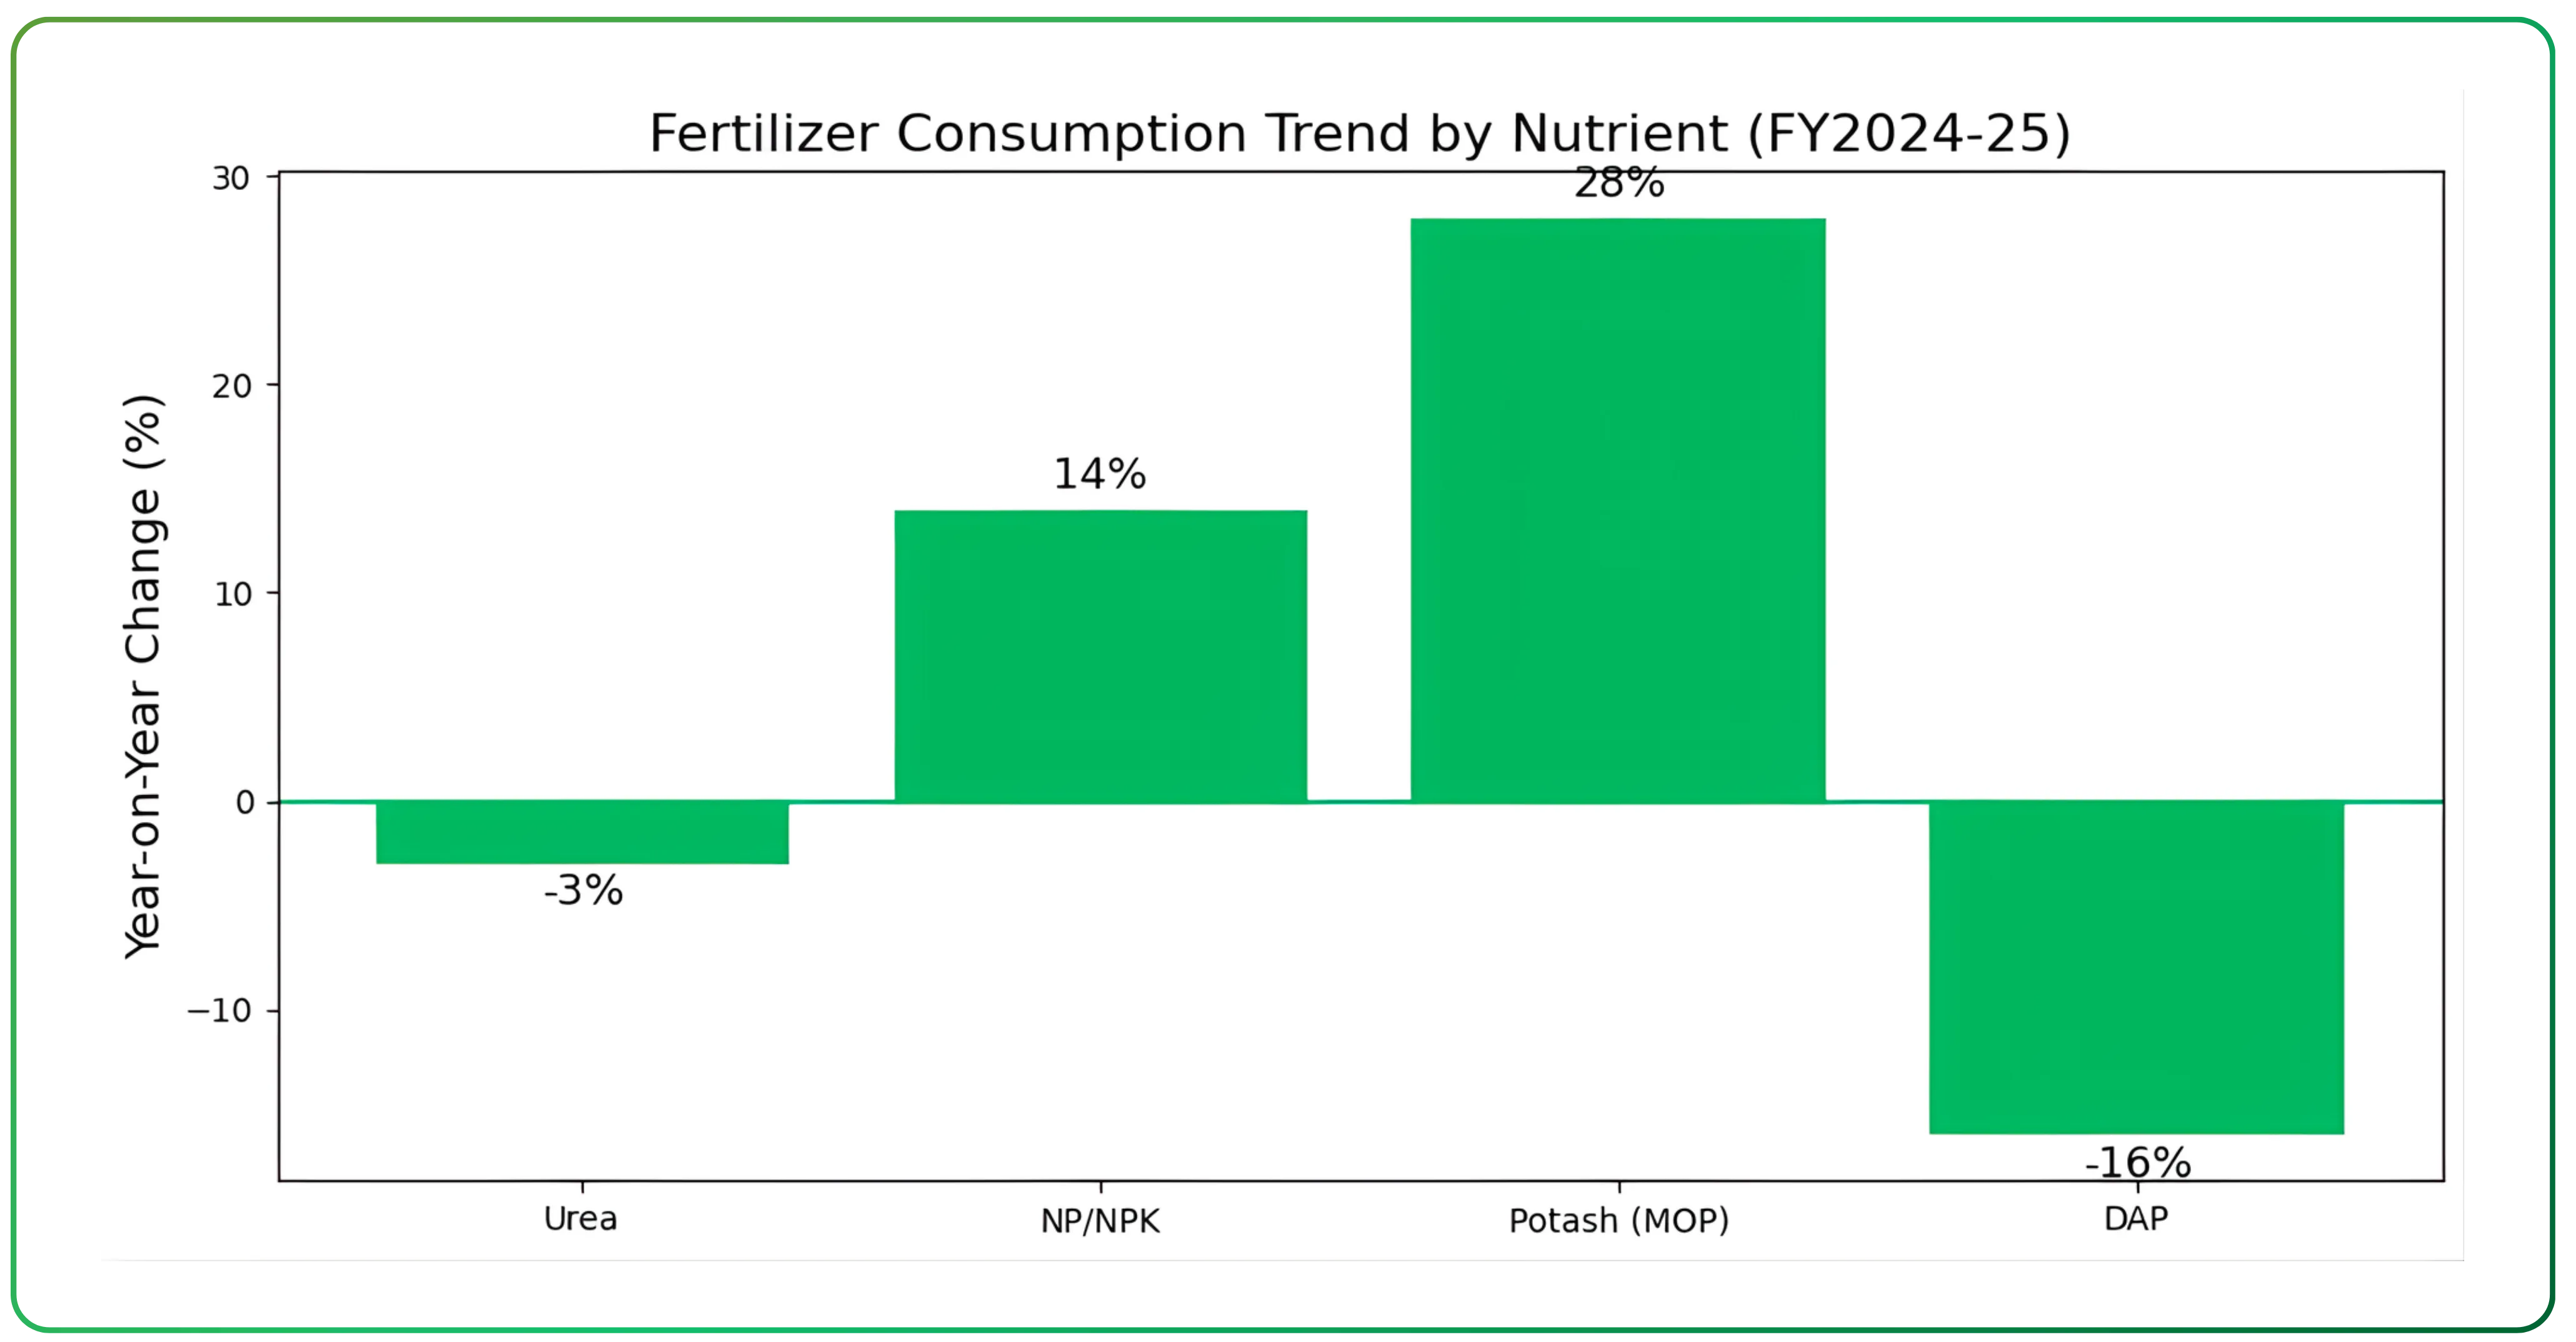
In FY2024-25, total fertilizer consumption stood at around 65.3 million tonnes, marginally lower than the 67.3 million tonnes recorded in the previous year. This headline number, however, conceals sharp shifts within nutrient categories. Urea consumption declined by nearly 3%, while NP/NPK fertilizer consumption increased by about 14% and potash consumption rose by over 28%. At the same time, DAP consumption fell sharply by nearly 16%, reflecting a combination of higher global prices, supply constraints, and substitution toward alternative complex fertilizers
These shifts signal an important transition in fertilizer usage. While urea remains the dominant nutrient due to its low price and widespread use in cereal crops, prolonged overuse has led to soil nutrient imbalance in several regions. As a result, policy efforts and farmer behaviour are gradually tilting toward more balanced fertilization, even if total nutrient application remains relatively stable.
NP/NPK and DAP are common chemical fertilizers used by farmers to nourish crops. Think of them as plant "vitamins" that provide essential nutrients missing from soil. NP/NPK are fertilizers providing Nitrogen (leaf growth), Phosphorus (roots/flowers), and Potassium (plant health); DAP is Di-Ammonium Phosphate (18-46-0) for strong roots at planting.
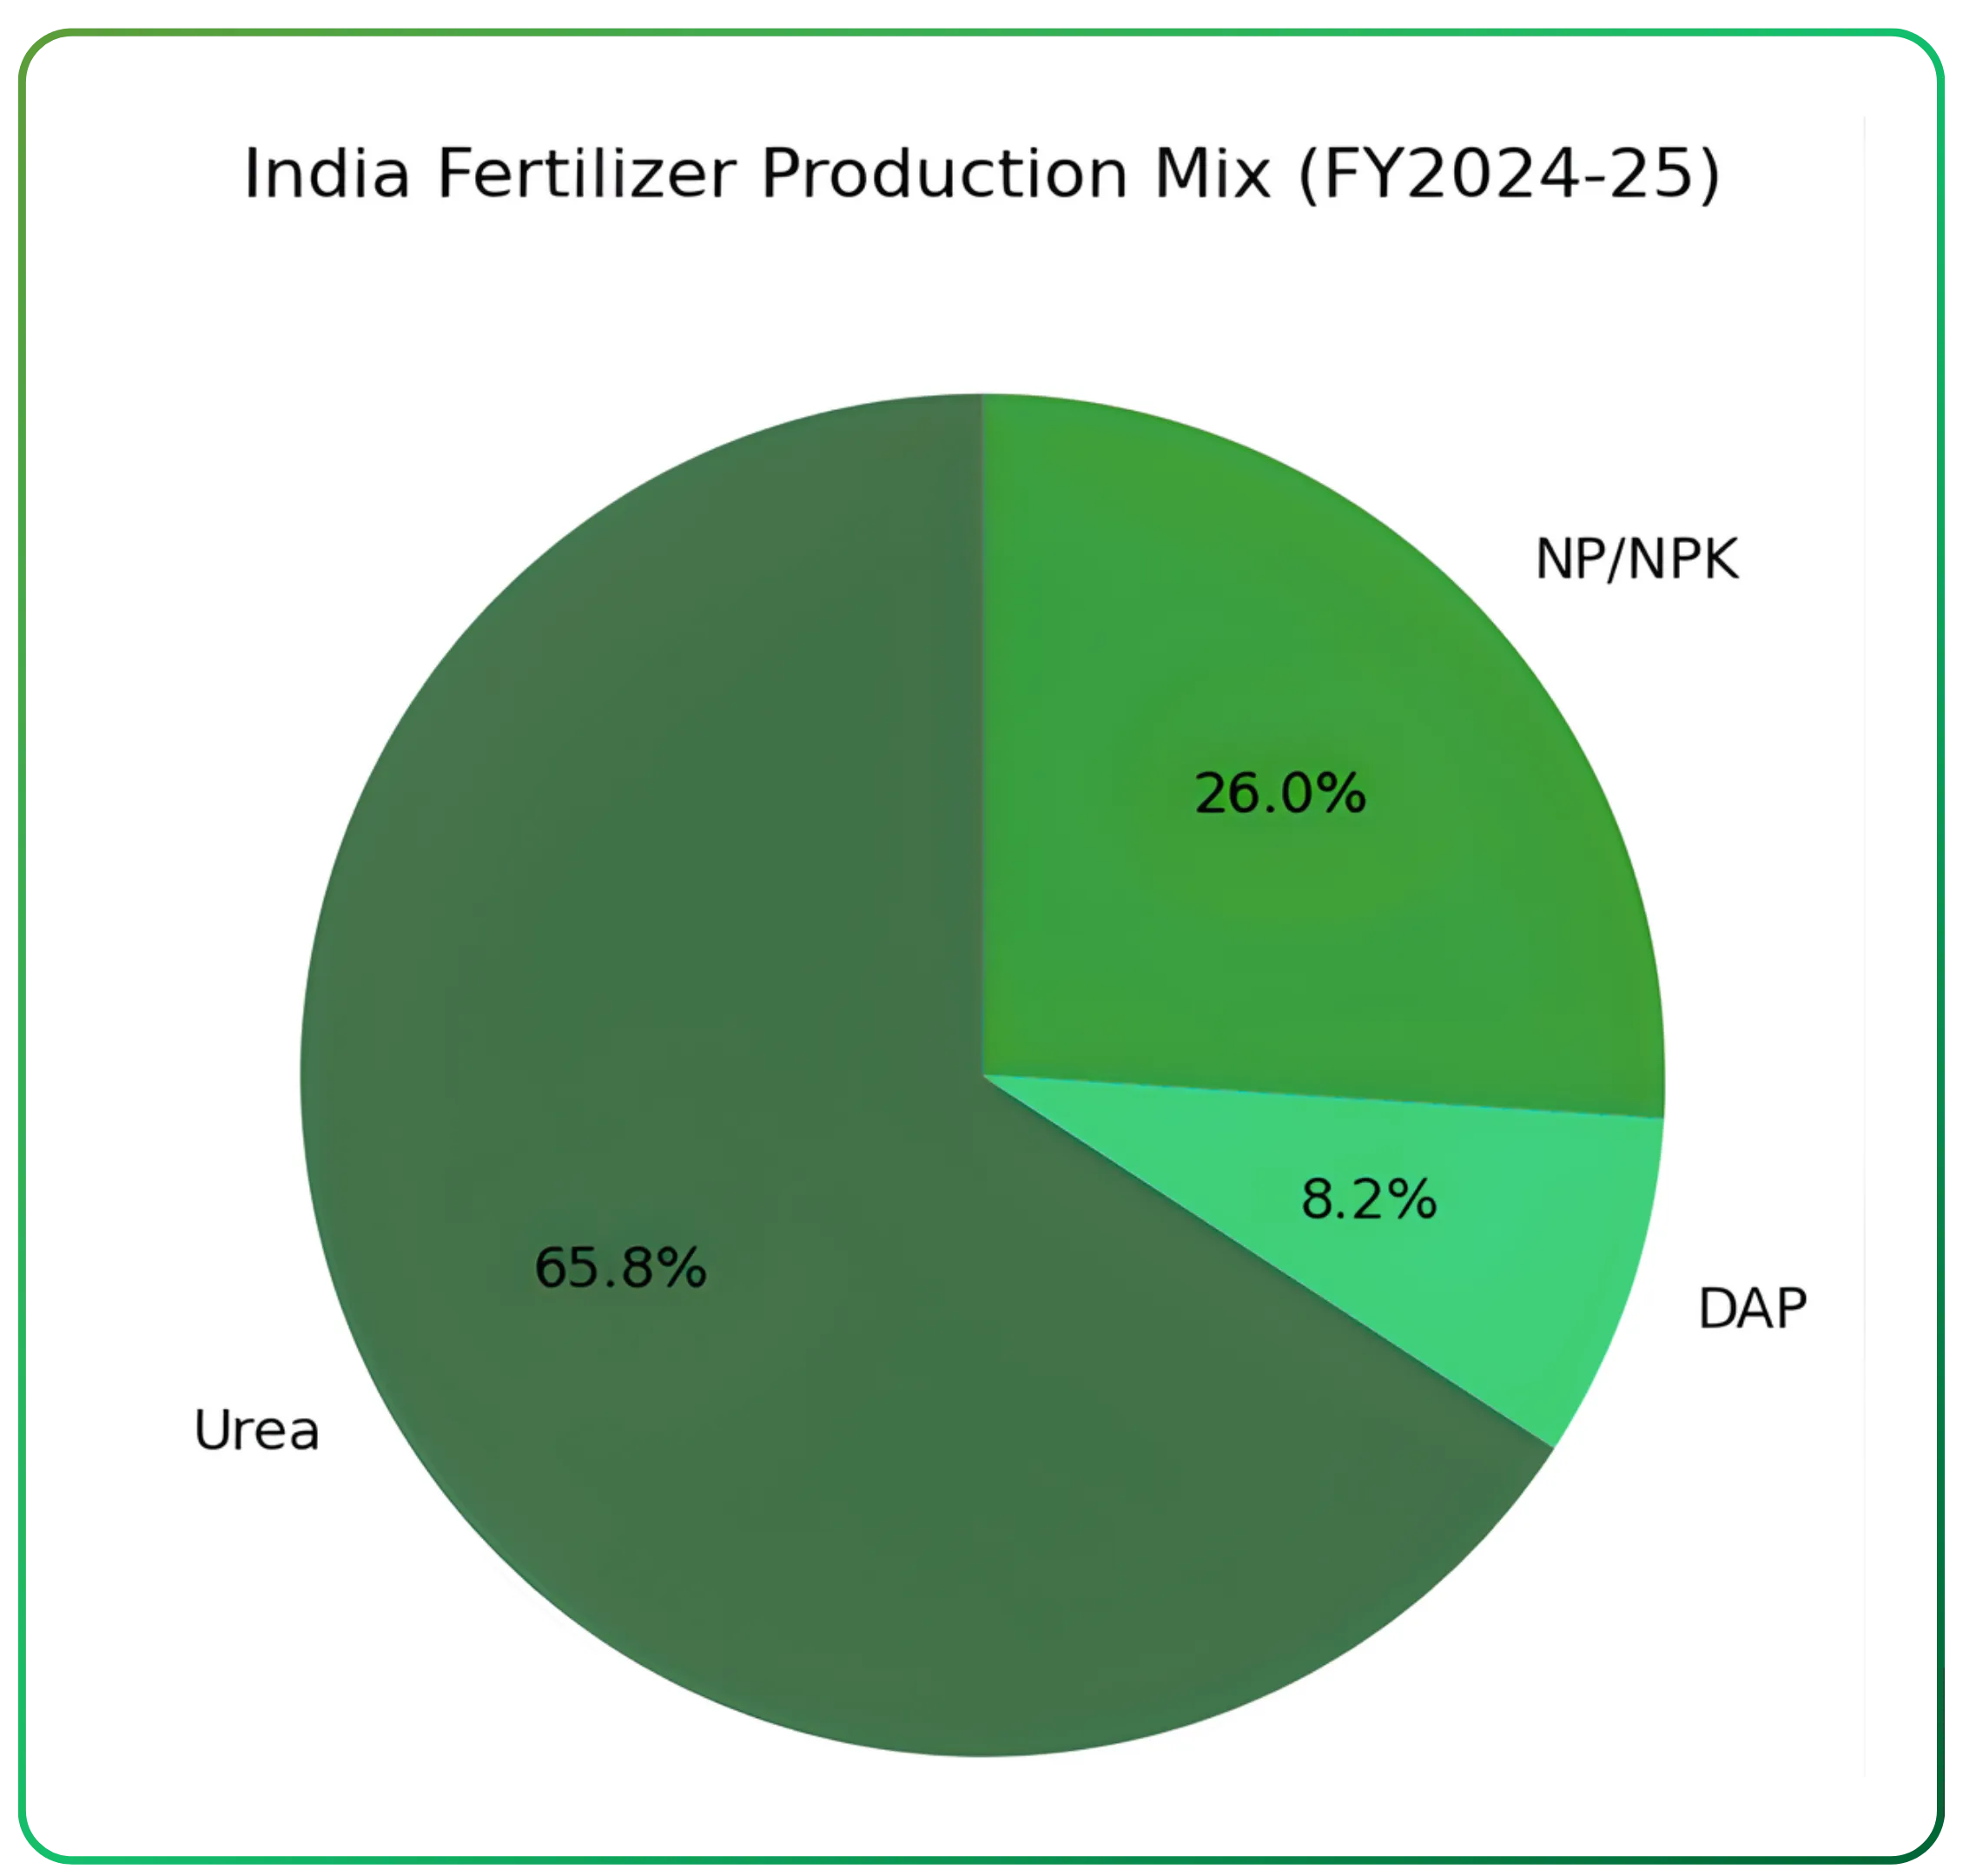
On the production side, India manufactured approximately 30.6 million tonnes of urea, 3.8 million tonnes of DAP, and 12.1 million tonnes of NP/NPK fertilizers during FY2024-25. Overall fertilizer production increased modestly, driven primarily by higher output of complex fertilizers and SSP, while urea and DAP production declined year-on-year.
Government policy is the central determinant of industry economics. Urea prices remain fully controlled, with subsidies compensating manufacturers for the gap between costs and farm-gate prices. Phosphatic and potassic fertilizers operate under the Nutrient Based Subsidy framework, where subsidy rates vary by nutrient content and market prices have limited flexibility. Fertilizer subsidy outlays have remained elevated in recent years, reflecting volatility in global energy and fertilizer prices. Actual subsidy requirements remain highly sensitive to global energy and fertilizer prices .
Demand Drivers and Consumption Patterns
Fertilizer demand in India is undefined by long-term trends and determined by short-term conditions such as monsoons, cropping choices, and policy support. Farmers respond primarily to affordability, availability, and expected crop realisations rather than nutrient theory, which makes consumption patterns uneven across nutrients and seasons.
Weather remains the most immediate demand driver. In FY2024-25, favourable reservoir levels and improved rabi sowing supported higher offtake of complex fertilizers and potash, even though overall fertilizer consumption declined by around 3%. These urea vs NPK consumption trends highlight a gradual shift toward balanced fertilization, even as total fertilizer demand remains broadly stable.
Cropping patterns reinforce this divergence. Cereals such as rice and wheat continue to dominate acreage, structurally supporting urea consumption. However, prolonged and excessive urea use has reduced soil responsiveness in many regions, prompting gradual shifts toward phosphatic and complex fertilizers.
Seasonality further distorts consumption trends. During the kharif season, urea demand softened while MOP (Muriate of Potash) and complex fertilizer usage rose. In contrast, the rabi season saw higher consumption across most nutrients except urea. These seasonal swings mean that quarterly volume movements often reflect timing and inventory adjustments rather than structural demand changes, a nuance that matters when interpreting company performance.
(Kharif = Monsoon crops, Rabi = Winter crops)
Structural drivers are slowly gaining importance. Rising rural incomes, wider access to institutional credit, and increased awareness of soil health are encouraging more targeted nutrient application. At the same time, fertilizer penetration remains uneven across states, leaving room for growth through better distribution and agronomic practices.
Supply Side Dynamics and Import Dependence
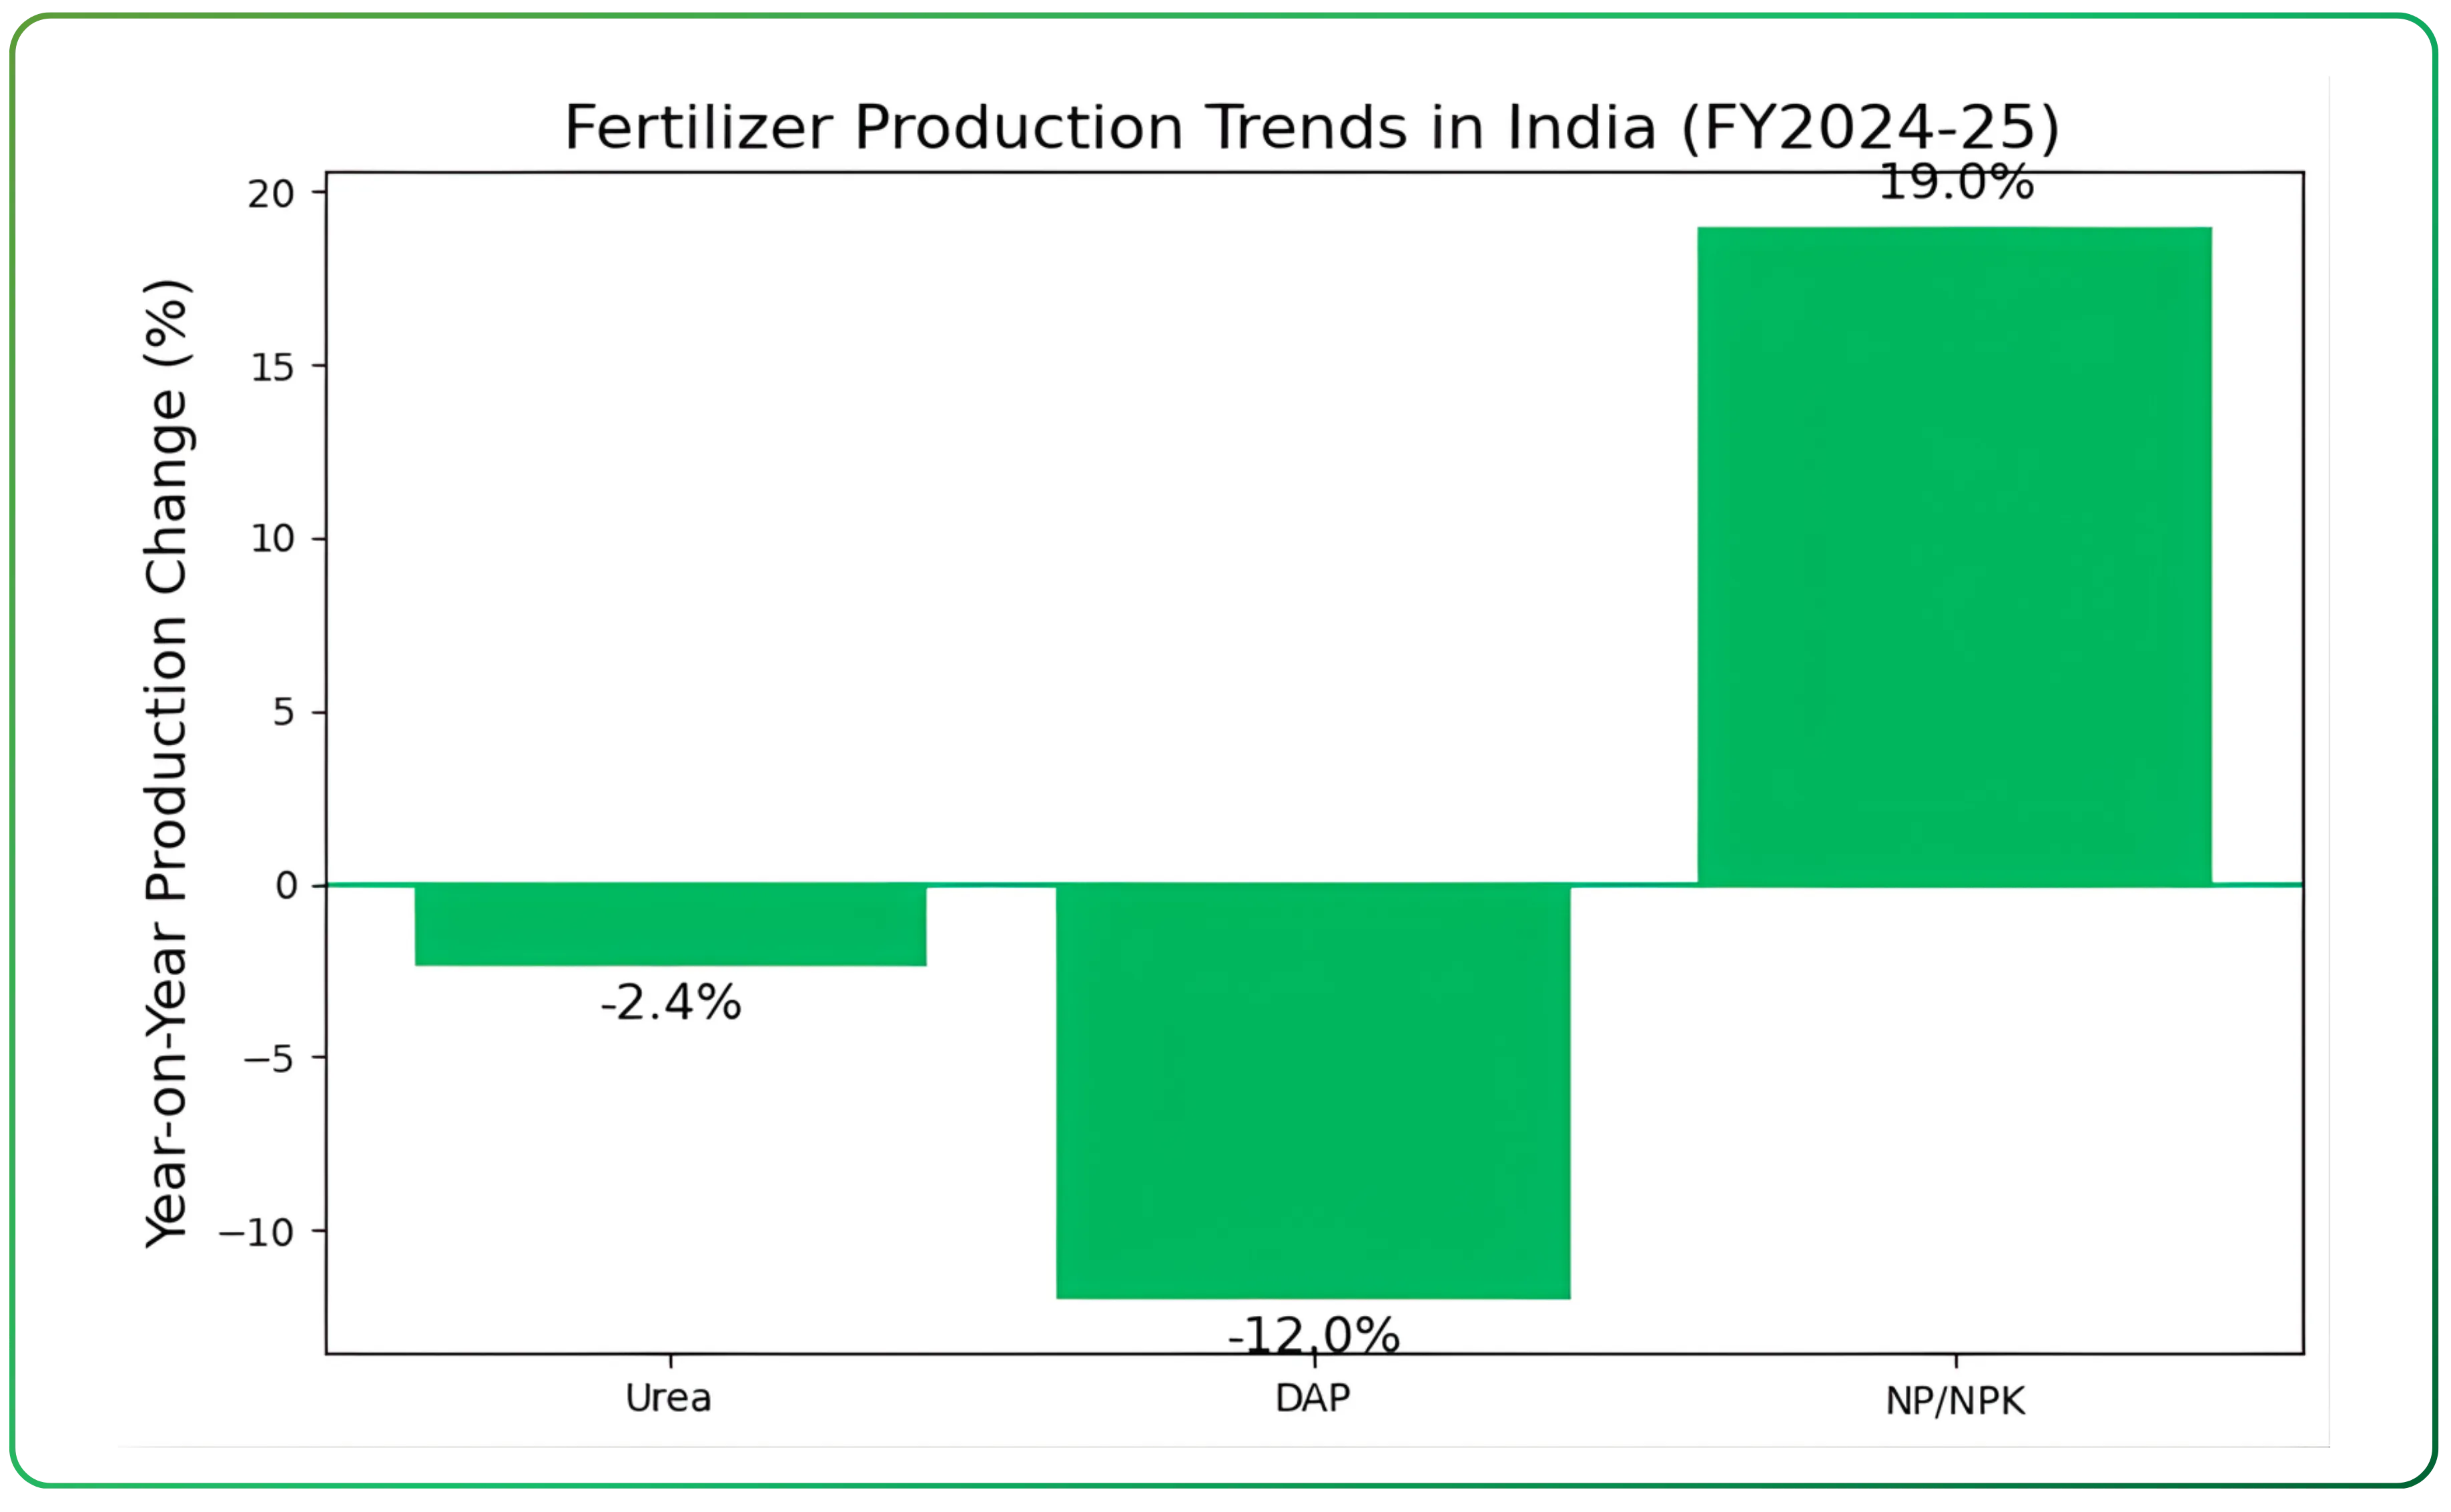
During FY2024-25, domestic production showed divergent trends. Urea production declined by about 2.4% to roughly 30.6 million tonnes, while DAP output fell sharply by over 12% to around 3.8 million tonnes. In contrast, production of NP/NPK fertilizers increased by nearly 19%, supported by higher demand and substitution away from DAP.
Fertilizer import dependence in India remains a structural feature of the industry, particularly for phosphatic fertilizers and potash. In FY2024-25, urea imports declined by nearly 20%, reflecting improved domestic availability, moderated consumption, and increased use of alternative products such as nano urea. India still relies on imports for around 15% of urea demand, and supply tightness can quickly re-emerge if domestic production or gas availability is disrupted.
Import dependence is significantly higher in non-urea fertilizers. More than half of India’s DAP requirement is met through imports, while potash is entirely imported. During FY2024-25, DAP imports declined by nearly 18% due to higher global prices and supply constraints, particularly from China. At the same time, MOP imports rose by over 23% to meet rising domestic demand. This contrasting movement underscores the industry’s exposure to global supply chains rather than domestic demand conditions alone .
Raw material availability remains the core structural risk. India lacks domestic reserves of phosphate rock and potash, forcing manufacturers to depend on imported rock phosphate, phosphoric acid, ammonia, sulphur, and finished fertilizers. Geopolitical tensions, sanctions on key exporting countries, and logistical disruptions have repeatedly impacted availability and pricing over recent years. These risks are persistent and cannot be fully mitigated through incremental domestic capacity additions.
Energy economics add another layer of complexity, particularly for urea producers. Natural gas is the primary feedstock for urea, and although the pooled gas mechanism has helped stabilise costs across producers, declining domestic gas availability has increased reliance on imported LNG. While gas costs are largely treated as a pass-through under the subsidy framework, volatility still affects working capital cycles and operational planning .
Capacity expansion has therefore been uneven across segments. While urea capacity has seen additions under policy support, investments in phosphatic and potassic fertilizers have remained limited due to lower returns, higher import dependence, and regulatory uncertainty. Several phosphoric acid plants continue to operate below capacity because of inadequate raw material supply and competition from imported finished fertilizers.
Subsidy Framework and Industry Economics
The economics of the Indian fertilizer industry are defined almost entirely by government policy. Urea sits at the most regulated end of the spectrum. Its maximum retail price is fixed by the government at levels well below production and import costs. Manufacturers are compensated through subsidies, with natural gas costs largely treated as a pass-through. While this framework ensures stable demand and predictable volumes, it also caps margins and makes earnings sensitive to policy revisions and subsidy disbursement timelines rather than operational efficiency .
Phosphatic and potassic fertilizers operate under the Nutrient Based Subsidy framework, where subsidies are linked to nutrient content rather than product prices. This provides limited pricing flexibility compared to urea but exposes manufacturers to volatility in raw material prices such as phosphoric acid, ammonia, sulphur, and potash. Periodic revisions in NBS rates, including higher subsidies for phosphorus and sulphur in recent years, have helped stabilise margins during periods of global price stress, but have not eliminated earnings volatility. The Nutrient Based Subsidy (NBS) impact is therefore most visible in non-urea segments, where margins, volumes, and working capital cycles are directly influenced by periodic subsidy revisions.
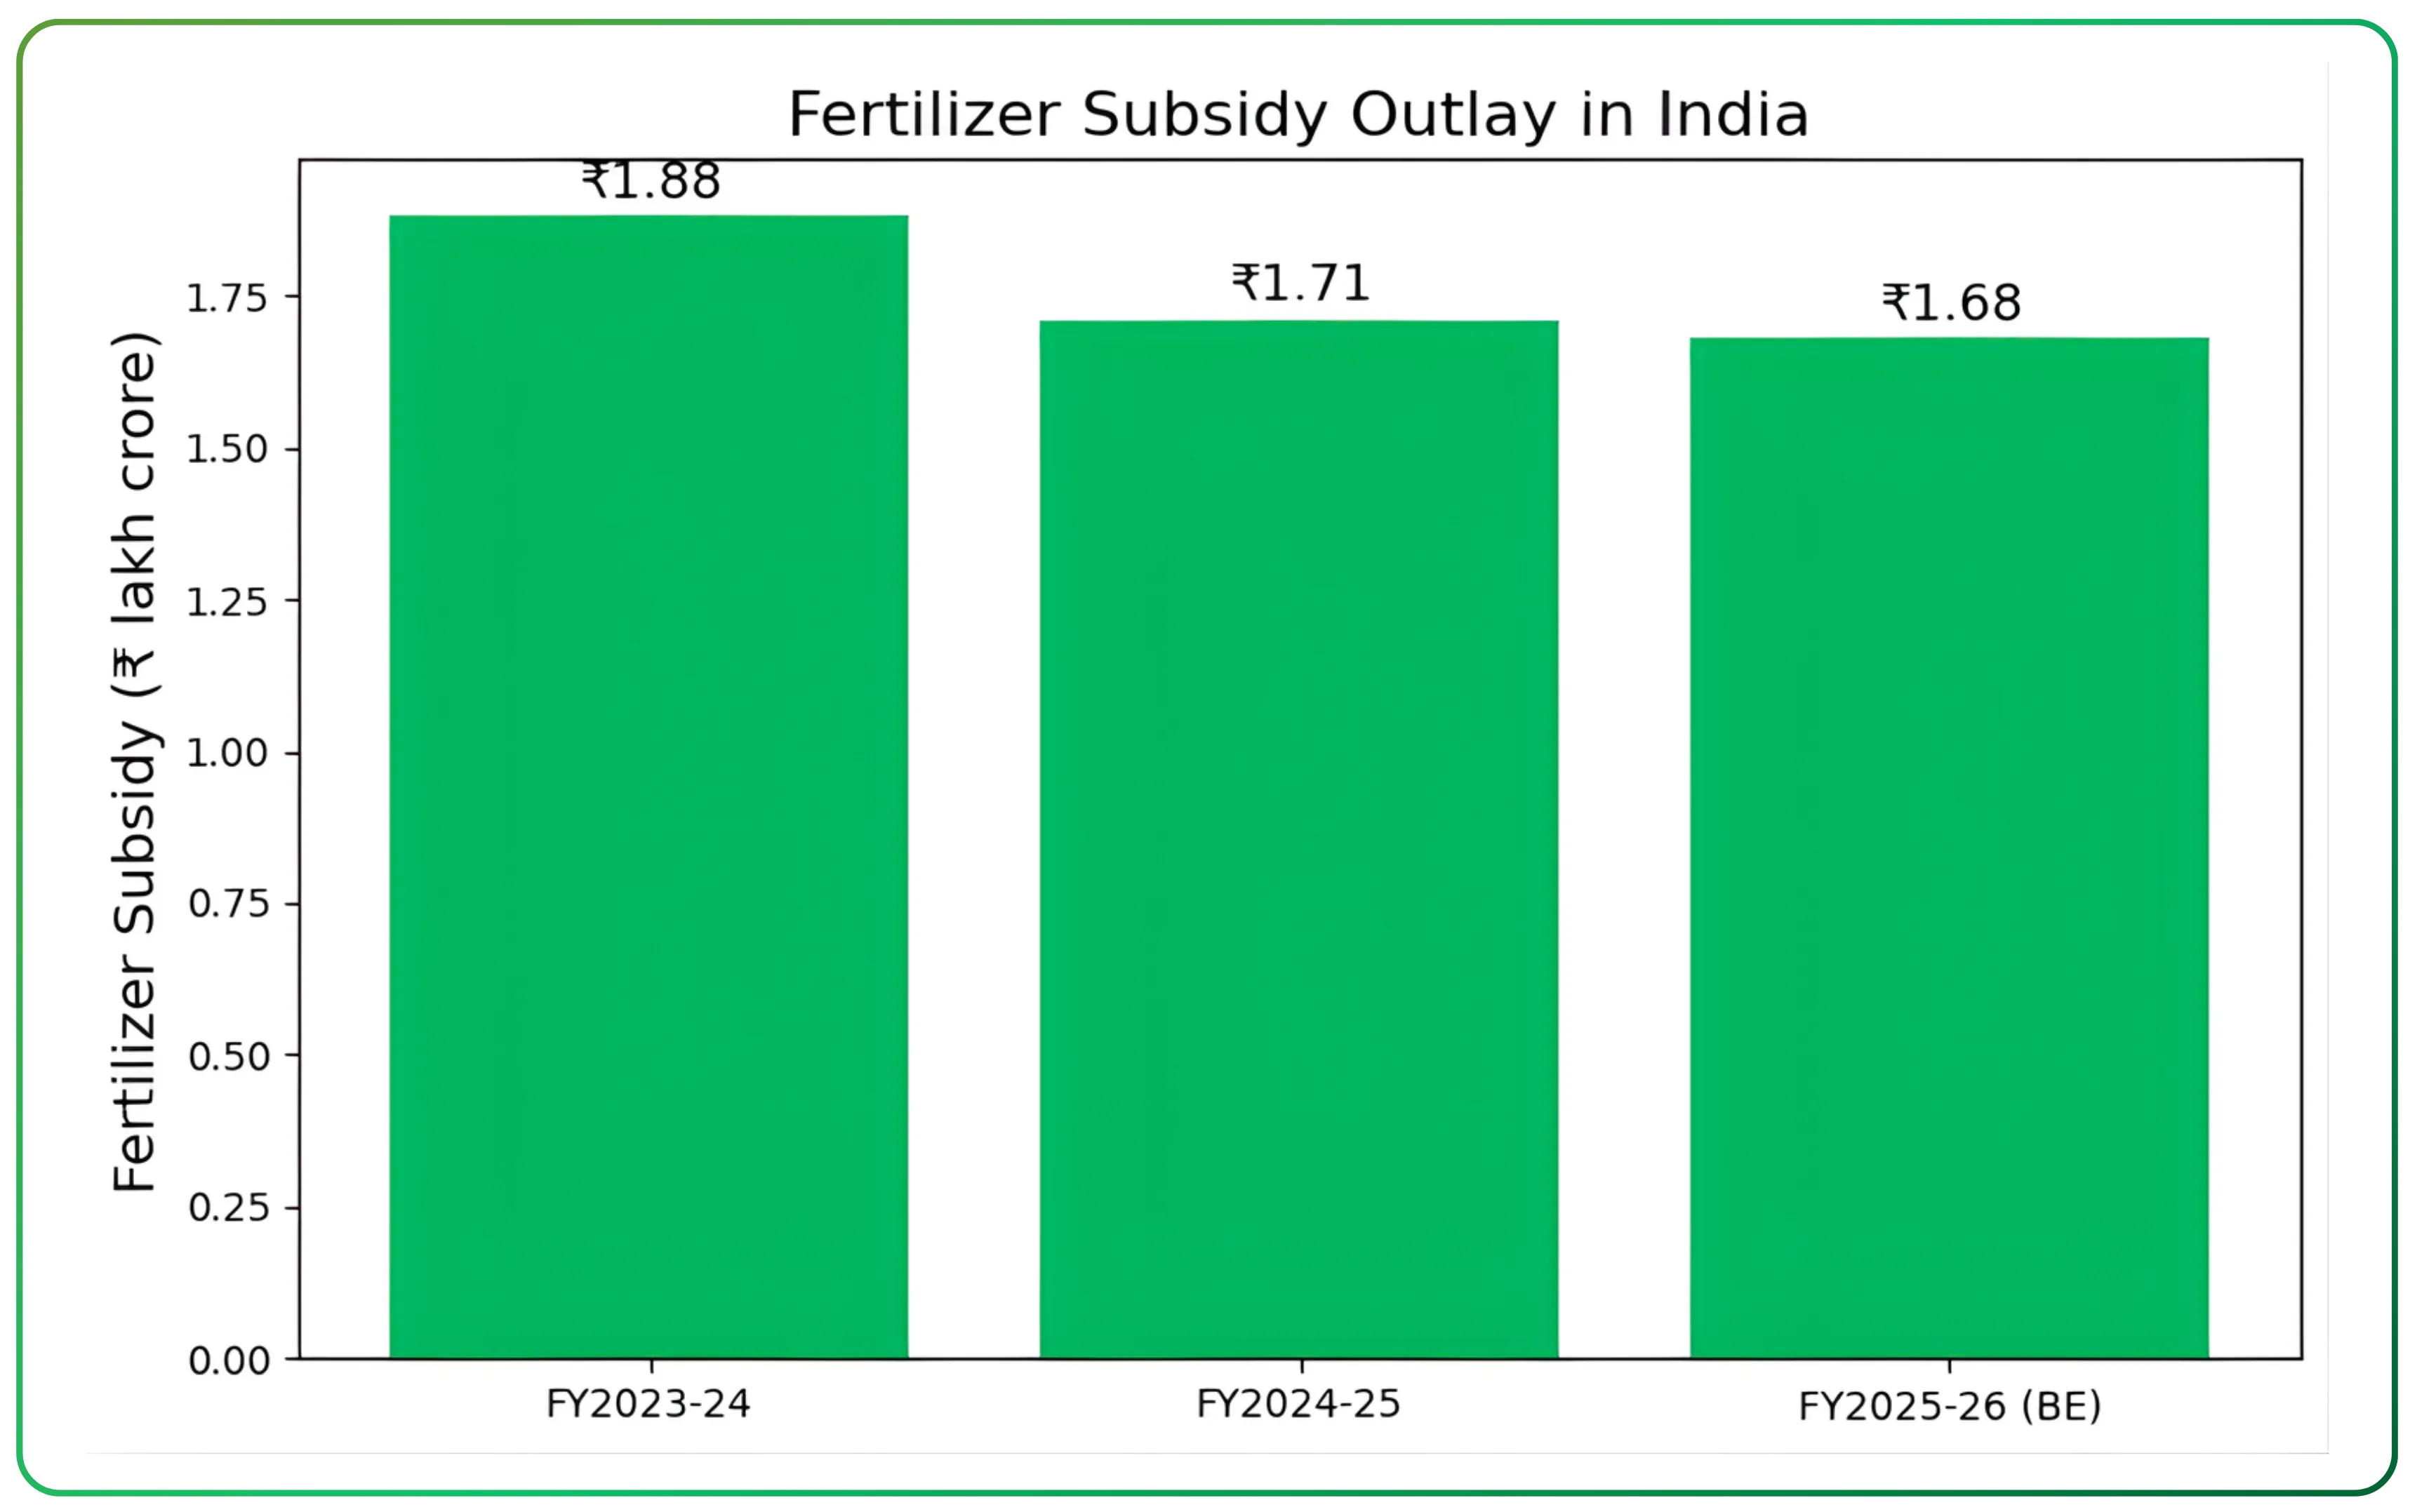
Fertilizer subsidy outlays have fluctuated sharply in recent years, reflecting global energy prices rather than domestic consumption trends. Subsidy expenditure rose to ₹1.88 lakh crore in FY2023-24 before moderating to ₹1.71 lakh crore in FY2024-25. The fertilizer subsidy budget for FY26 stands at ₹1.68 lakh crore, though actual requirements will continue to depend on global fertilizer and fuel prices. Historically, the government has stepped in with additional allocations when required, reducing long-term solvency risk for the sector.
Direct Benefit Transfer has altered working capital dynamics across the industry. Subsidies are now released based on actual point-of-sale transactions rather than dispatches, improving transparency but extending cash conversion cycles. Delays in subsidy receipts often translate into higher short-term borrowing, even in years of healthy reported profitability. This explains why balance sheet stress can emerge despite stable operating margins.
Cost structures remain largely outside management control. Raw material imports, foreign exchange movements, freight costs, and gas availability exert a stronger influence on profitability than plant-level efficiency. While energy norms and pooling mechanisms have improved operational discipline, they have also narrowed margin dispersion across players, making differentiation harder on cost alone.
You may also read Zuari Industries Limited Viewed Through Assets and Capital Returns, a standalone company-focused analysis.
Industry Structure and Competitive Landscape
| Company | Core Fertilizer Segment | Key Products | Subsidy Exposure | Import Dependence | Diversification Beyond Fertilizers | Business Nature |
|---|---|---|---|---|---|---|
| National Fertilizers Limited | Urea-dominant | Urea, NPK | High | Medium (gas, some inputs) | Limited | PSU |
| Rashtriya Chemicals and Fertilizers Limited | Urea + Complex | Urea, DAP, NPK | High | Medium | Limited | PSU |
| Chambal Fertilisers and Chemicals Limited | Urea + Non-urea | Urea, DAP, NPK, CPC | Medium–High | Medium | Yes (CPC, seeds, specialty nutrients) | Private |
| Paradeep Phosphates Limited | Phosphatic-focused | DAP, NPK | Medium | High (rock phosphate, phosphoric acid) | Limited | Private |
| Coromandel International Limited | Diversified fertilizers | NPK, SSP, CPC, SN | Medium | Medium | Yes (CPC, agri-retail, specialty nutrients) | Private |
| Deepak Fertilisers and Petrochemicals Corporation Limited | Non-urea / Industrial-linked | NPK, TAN, industrial chemicals | Low–Medium | Medium | Yes (industrial & mining chemicals) | Diversified |
| Bayer CropScience Limited | Non-fertilizer agri-inputs | Crop protection, seeds, biologicals | Low | Low | Core business | MNC |
The Indian fertilizer industry operates across public sector enterprises, private manufacturers, and diversified agri-input companies. While all participants function under the same regulatory framework, their business models, product mix, and exposure to policy risk vary meaningfully. Understanding these differences is essential to interpreting financial performance and risk profiles within the sector.
At the core of the industry are large urea producers, many of which operate under heavy government oversight. Public sector players such as National Fertilizers Limited and Rashtriya Chemicals and Fertilizers Limited play a stabilising role in ensuring national availability of urea. Their operations are volume-driven, margins are tightly regulated, and profitability is largely insulated from market forces but exposed to subsidy timing and policy changes. These companies typically exhibit stable demand but limited earnings flexibility.
Among private sector urea manufacturers, Chambal Fertilisers and Chemicals Limited stands out as the largest private urea producer in the country. Its business model combines regulated urea manufacturing with a growing portfolio of non-urea fertilizers, crop protection chemicals, and specialty nutrients. This diversification helps moderate regulatory risk, although urea volumes continue to anchor overall stability. The company’s scale and integrated agri-input presence allow it to absorb demand and supply fluctuations more effectively than smaller, single-product players.
The non-urea fertilizer segment is more fragmented and more exposed to global raw material cycles. Paradeep Phosphates Limited is a key private-sector player in phosphatic fertilizers, with a strong focus on DAP and complex fertilizers. Its positioning benefits from proximity to ports and backward integration into intermediates such as phosphoric acid and sulphuric acid. However, its earnings remain sensitive to global phosphate prices, import availability, and subsidy revisions under the Nutrient Based Subsidy regime.
Coromandel International Limited represents a more diversified model within the fertilizer space. While fertilizers remain central to its operations, the company has built a sizeable presence in crop protection chemicals, specialty nutrients, and agri-retail. This reduces dependence on any single fertilizer category and provides relative insulation from sharp swings in subsidy economics. As a result, its performance is influenced as much by farm economics and distribution reach as by fertilizer policy alone.
A structurally different participant is Deepak Fertilisers and Petrochemicals Corporation Limited. Unlike traditional fertilizer manufacturers, its exposure to fertilizers is balanced by significant operations in industrial chemicals, mining chemicals, and specialty products. This diversification reduces direct dependence on fertilizer subsidies and allows the group to offset volatility in crop nutrition with demand from mining, infrastructure, and industrial end markets. For investors, this model behaves differently from pure-play fertilizer companies despite operating in the same regulatory ecosystem.
On the agri-input side, Bayer CropScience Limited operates primarily in crop protection, seeds, and biologicals rather than bulk fertilizers. While not a fertilizer manufacturer in the conventional sense, its presence is relevant because growth in crop protection and biological solutions increasingly competes for farmer wallet share. This reflects a broader industry trend where fertilizer usage is gradually being complemented by higher-value, efficiency-oriented agri-inputs.
Taken together, the competitive landscape reveals that the Indian fertilizer sector is not homogeneous. Companies differ sharply in their exposure to regulated pricing, global raw material volatility, subsidy dependence, and diversification beyond fertilizers. For investors, comparing companies purely on volumes or reported margins can be misleading. A more useful lens is to assess how each business model absorbs policy risk, manages working capital stress, and balances regulated and non-regulated revenue streams.
Structural Shifts and Emerging Trends
Nitrogen use efficiency in India remains low, estimated at around 30–40%, with the remainder lost to air and water. To address this, the government and industry have promoted alternatives such as nano urea, sulphur-coated urea, and fortified complex fertilizers. Nano urea, in particular, has been positioned as a partial substitute for conventional urea, with one bottle designed to replace a standard bag. While adoption is still evolving, wider acceptance could moderate conventional urea volumes over time. Looking ahead to 2026, nano urea adoption is expected to remain gradual rather than disruptive, supplementing conventional fertilizers rather than replacing them outright.
The rise of specialty nutrients, micronutrients, and water-soluble fertilizers is another structural trend. As farmers shift toward horticulture, cash crops, and yield optimisation rather than acreage expansion, demand for crop- and stage-specific nutrition has increased. These products operate outside core price controls, face lower subsidy dependence, and offer higher value per tonne. Although volumes are smaller, they contribute disproportionately to revenue growth and margin stability for diversified players.
Biological and organic inputs are beginning to complement chemical fertilizers rather than replace them. Government schemes promoting organic farming, bio-fertilizers, and integrated nutrient management aim to improve soil health and sustainability. While these inputs currently account for a small share of total nutrient application, their adoption reflects a broader shift toward efficiency and environmental considerations. For fertilizer manufacturers, this trend represents both competition for farmer spending and an opportunity to expand into adjacent agri-input categories.
Another structural change lies in sourcing strategy. Persistent global disruptions have reinforced the need for supply security. Indian companies and the government have pursued joint ventures abroad, long-term supply agreements, and backward integration into intermediates such as phosphoric acid and ammonia. While these measures reduce short-term supply risk, they do not eliminate exposure to global price cycles and geopolitical events.
For readers interested in a company-specific study, see Laurus Labs Ltd – A Year of Execution and Strategic Transformation.
Risks and Challenges
Policy risk remains the most significant. Changes in subsidy rates, delays in notifications, or shifts in nutrient prioritisation can alter profitability without any change in operational performance. While the government has historically stepped in to ensure sector stability, the timing and structure of such support can still create short-term stress for manufacturers .
Raw material dependence is another structural challenge. This exposes manufacturers to global price volatility, foreign exchange risk, freight disruptions, and geopolitical events. Periods of global supply tightness can compress margins even when domestic demand remains stable
Working capital intensity is a recurring pressure point. The shift to Direct Benefit Transfer has improved transparency but extended cash conversion cycles. Subsidy receivables can accumulate during periods of delayed disbursement, forcing companies to rely on short-term borrowing. As a result, interest costs can rise even in years when reported operating performance appears healthy. For investors, this creates a gap between accounting profitability and actual cash generation.
Climatic variability adds another layer of uncertainty. Fertilizer demand is closely linked to monsoon performance, reservoir levels, and sowing patterns. Erratic rainfall, delayed monsoons, or extreme weather events can disrupt seasonal demand, leading to inventory build-up or sudden volume swings. These effects are often uneven across regions and nutrients, complicating demand forecasting
Finally, structural inefficiencies in fertilizer use pose long-term challenges. Imbalanced nutrient application, declining soil health, and low fertilizer use efficiency reduce the marginal productivity of fertilizers. While policy initiatives aim to address these issues through balanced fertilization and alternative products, the transition is gradual and can create uncertainty for traditional volume-driven business models.
Long-Term Outlook
The Indian fertilizer industry is defined by continuity rather than disruption. Fertilizers will remain central to India’s food security, given population growth, limited scope for expansion of cultivable land, and the need to sustain crop yields. Demand is therefore structurally supported, even as year-to-year consumption fluctuates due to weather, prices, and policy conditions.
Growth, however, is unlikely to be linear. Fertilizer consumption in several regions has reached a mature stage, with future expansion driven more by changes in nutrient mix than by outright volume growth. Rising use of NP/NPK fertilizers, potash, specialty nutrients, and efficiency-oriented products reflects this shift, reinforced by policy emphasis on balanced fertilization and soil health.
From a supply perspective, India will continue to face structural import dependence, particularly for phosphatic and potassic fertilizers and their raw materials. While sourcing diversification and overseas arrangements can reduce vulnerability at the margin, exposure to global prices and geopolitics will remain a defining feature of the sector.
Government policy will continue to anchor industry economics. Fertilizer subsidies are fiscally significant and politically sensitive, making abrupt withdrawal unlikely. At the same time, evolving subsidy design and disbursement timelines ensure that earnings and cash flows remain closely tied to policy execution rather than purely operational performance.
For investors and readers approaching fertilizer stock analysis in India, conventional growth metrics offer limited insight in isolation. A more useful lens is to focus on product mix, regulatory exposure, working capital discipline, and balance sheet resilience. In this context, the fertilizer sector is best viewed as a strategic utility rather than a conventional growth industry, offering demand stability but persistent earnings and cash-flow volatility.
Turn research into action — trade smarter on CubePlus.
Disclaimer: The information provided in our blogs is for informational purposes only and should not be construed as financial, investment, or trading advice. Trading and investing in the securities market carries risk. Always conduct your own research and consult with a qualified financial advisor before making any investment decisions. Past performance is not indicative of future results. Copyrighted and original content for your trading and investing needs.
© 2026 — Tradejini. All Rights Reserved.