


Zuari Industries Limited presents a contrarian value opportunity, trading at approximately 40% of estimated intrinsic value. The company is transitioning from a loss-making operating business to a stabilized enterprise with substantial hidden asset value. Zuari Industries Limited is the apex holding company of the Adventz Group, a diversified Indian conglomerate with interests spanning agri-business, engineering and infrastructure, real estate, and financial services. Over time, the company has transitioned from being a largely operating-centric entity to a hybrid structure combining operating businesses with strategic investments and asset-backed value.
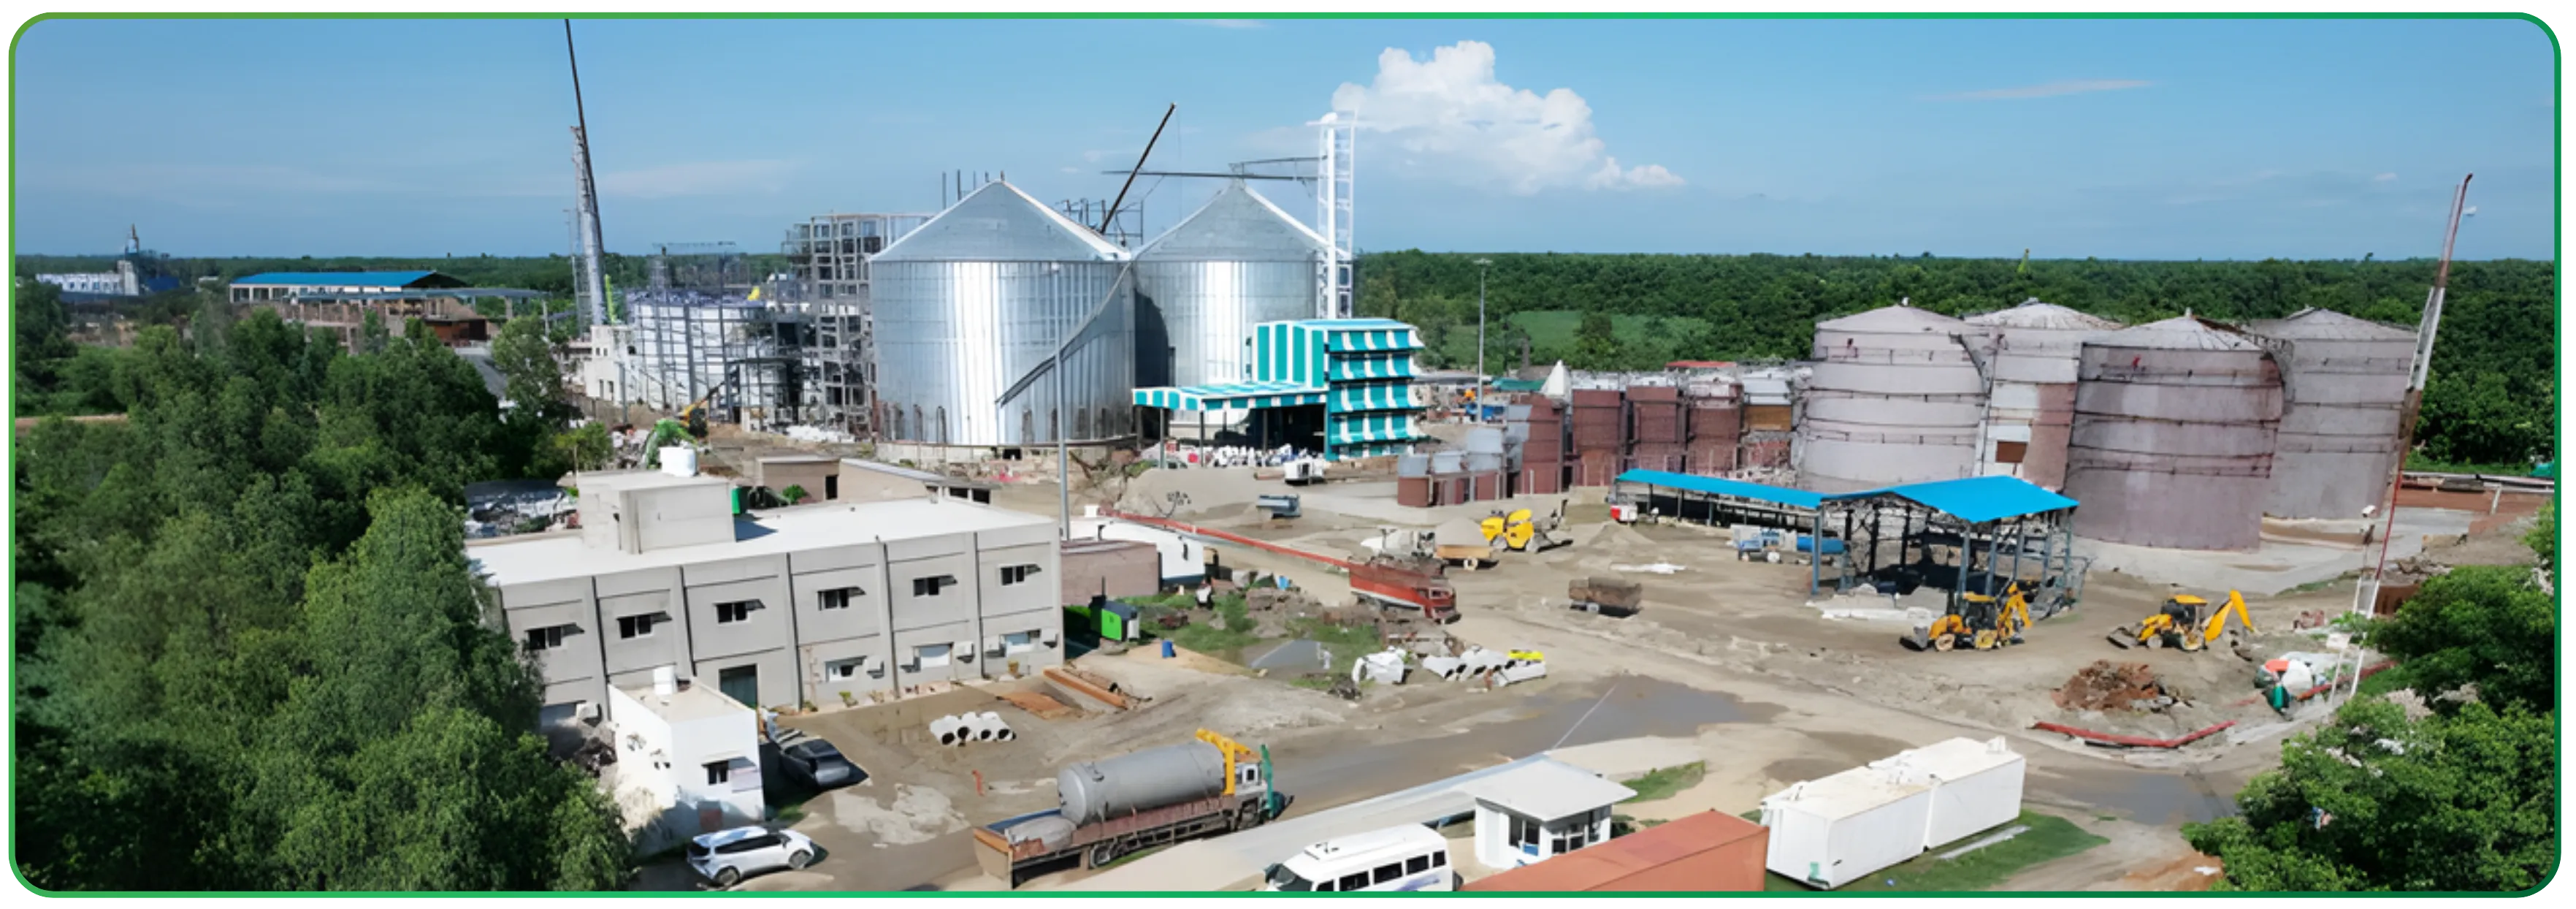
The company’s operating footprint is anchored in its Sugar, Power, and Ethanol (SPE) division, which became part of Zuari Industries following the merger of Gobind Sugar Mills and Zuari Sugar & Power into the parent entity. This has created a fully integrated sugar operation with forward linkages into cogeneration and ethanol, improving earnings stability relative to a standalone sugar mill.
Alongside this, Zuari Industries functions as a long-term capital allocator within the Adventz Group. It holds strategic stakes in listed and unlisted group companies across fertilizers, rail engineering, infrastructure, and real estate, generating dividend income, interest income, and periodic monetisation gains. As a result, consolidated profitability is influenced not only by operating performance but also by investment income and balance sheet actions.
These strategic investments form the core of Zuari investments, represent substantial book value on the balance sheet, and derive their market value primarily from stakes held across group companies.
Business Model and Operating Verticals Across Group Companies
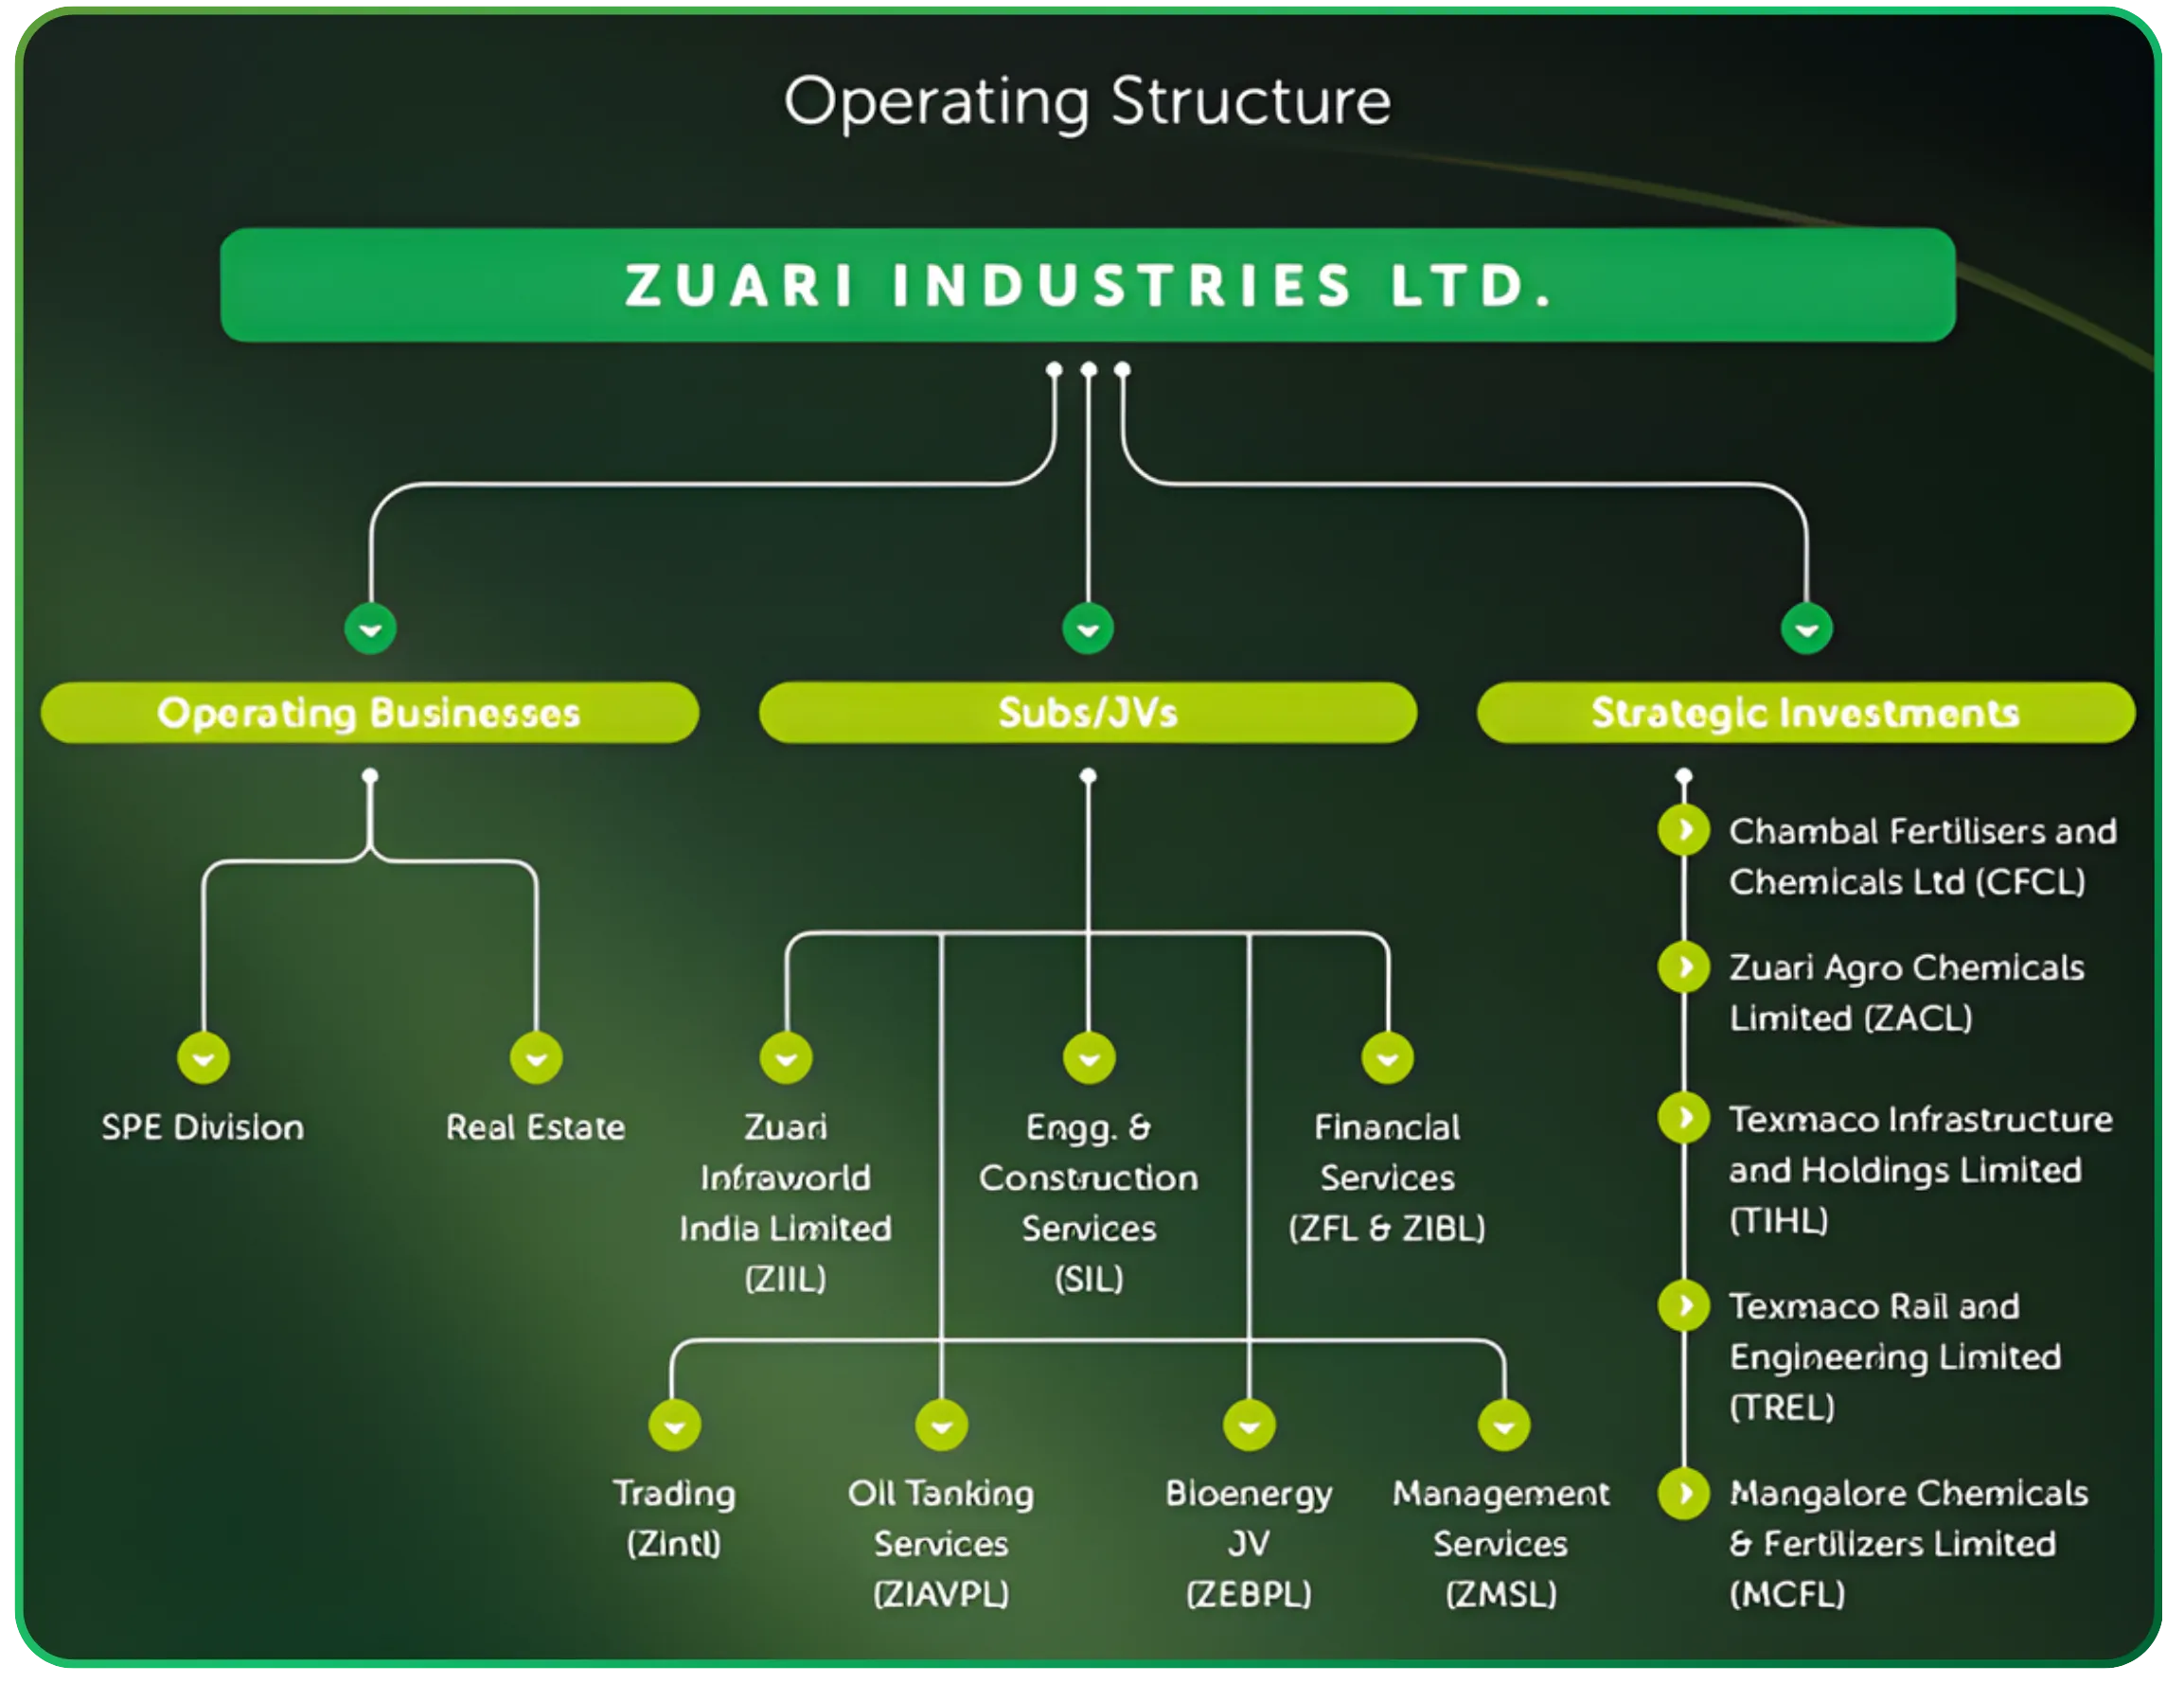
Zuari Industries operates through a dual-engine model:
- Core operating businesses that generate recurring operating cash flows
- A portfolio of strategic investments and subsidiaries that contribute dividends, interest income, and episodic value creation
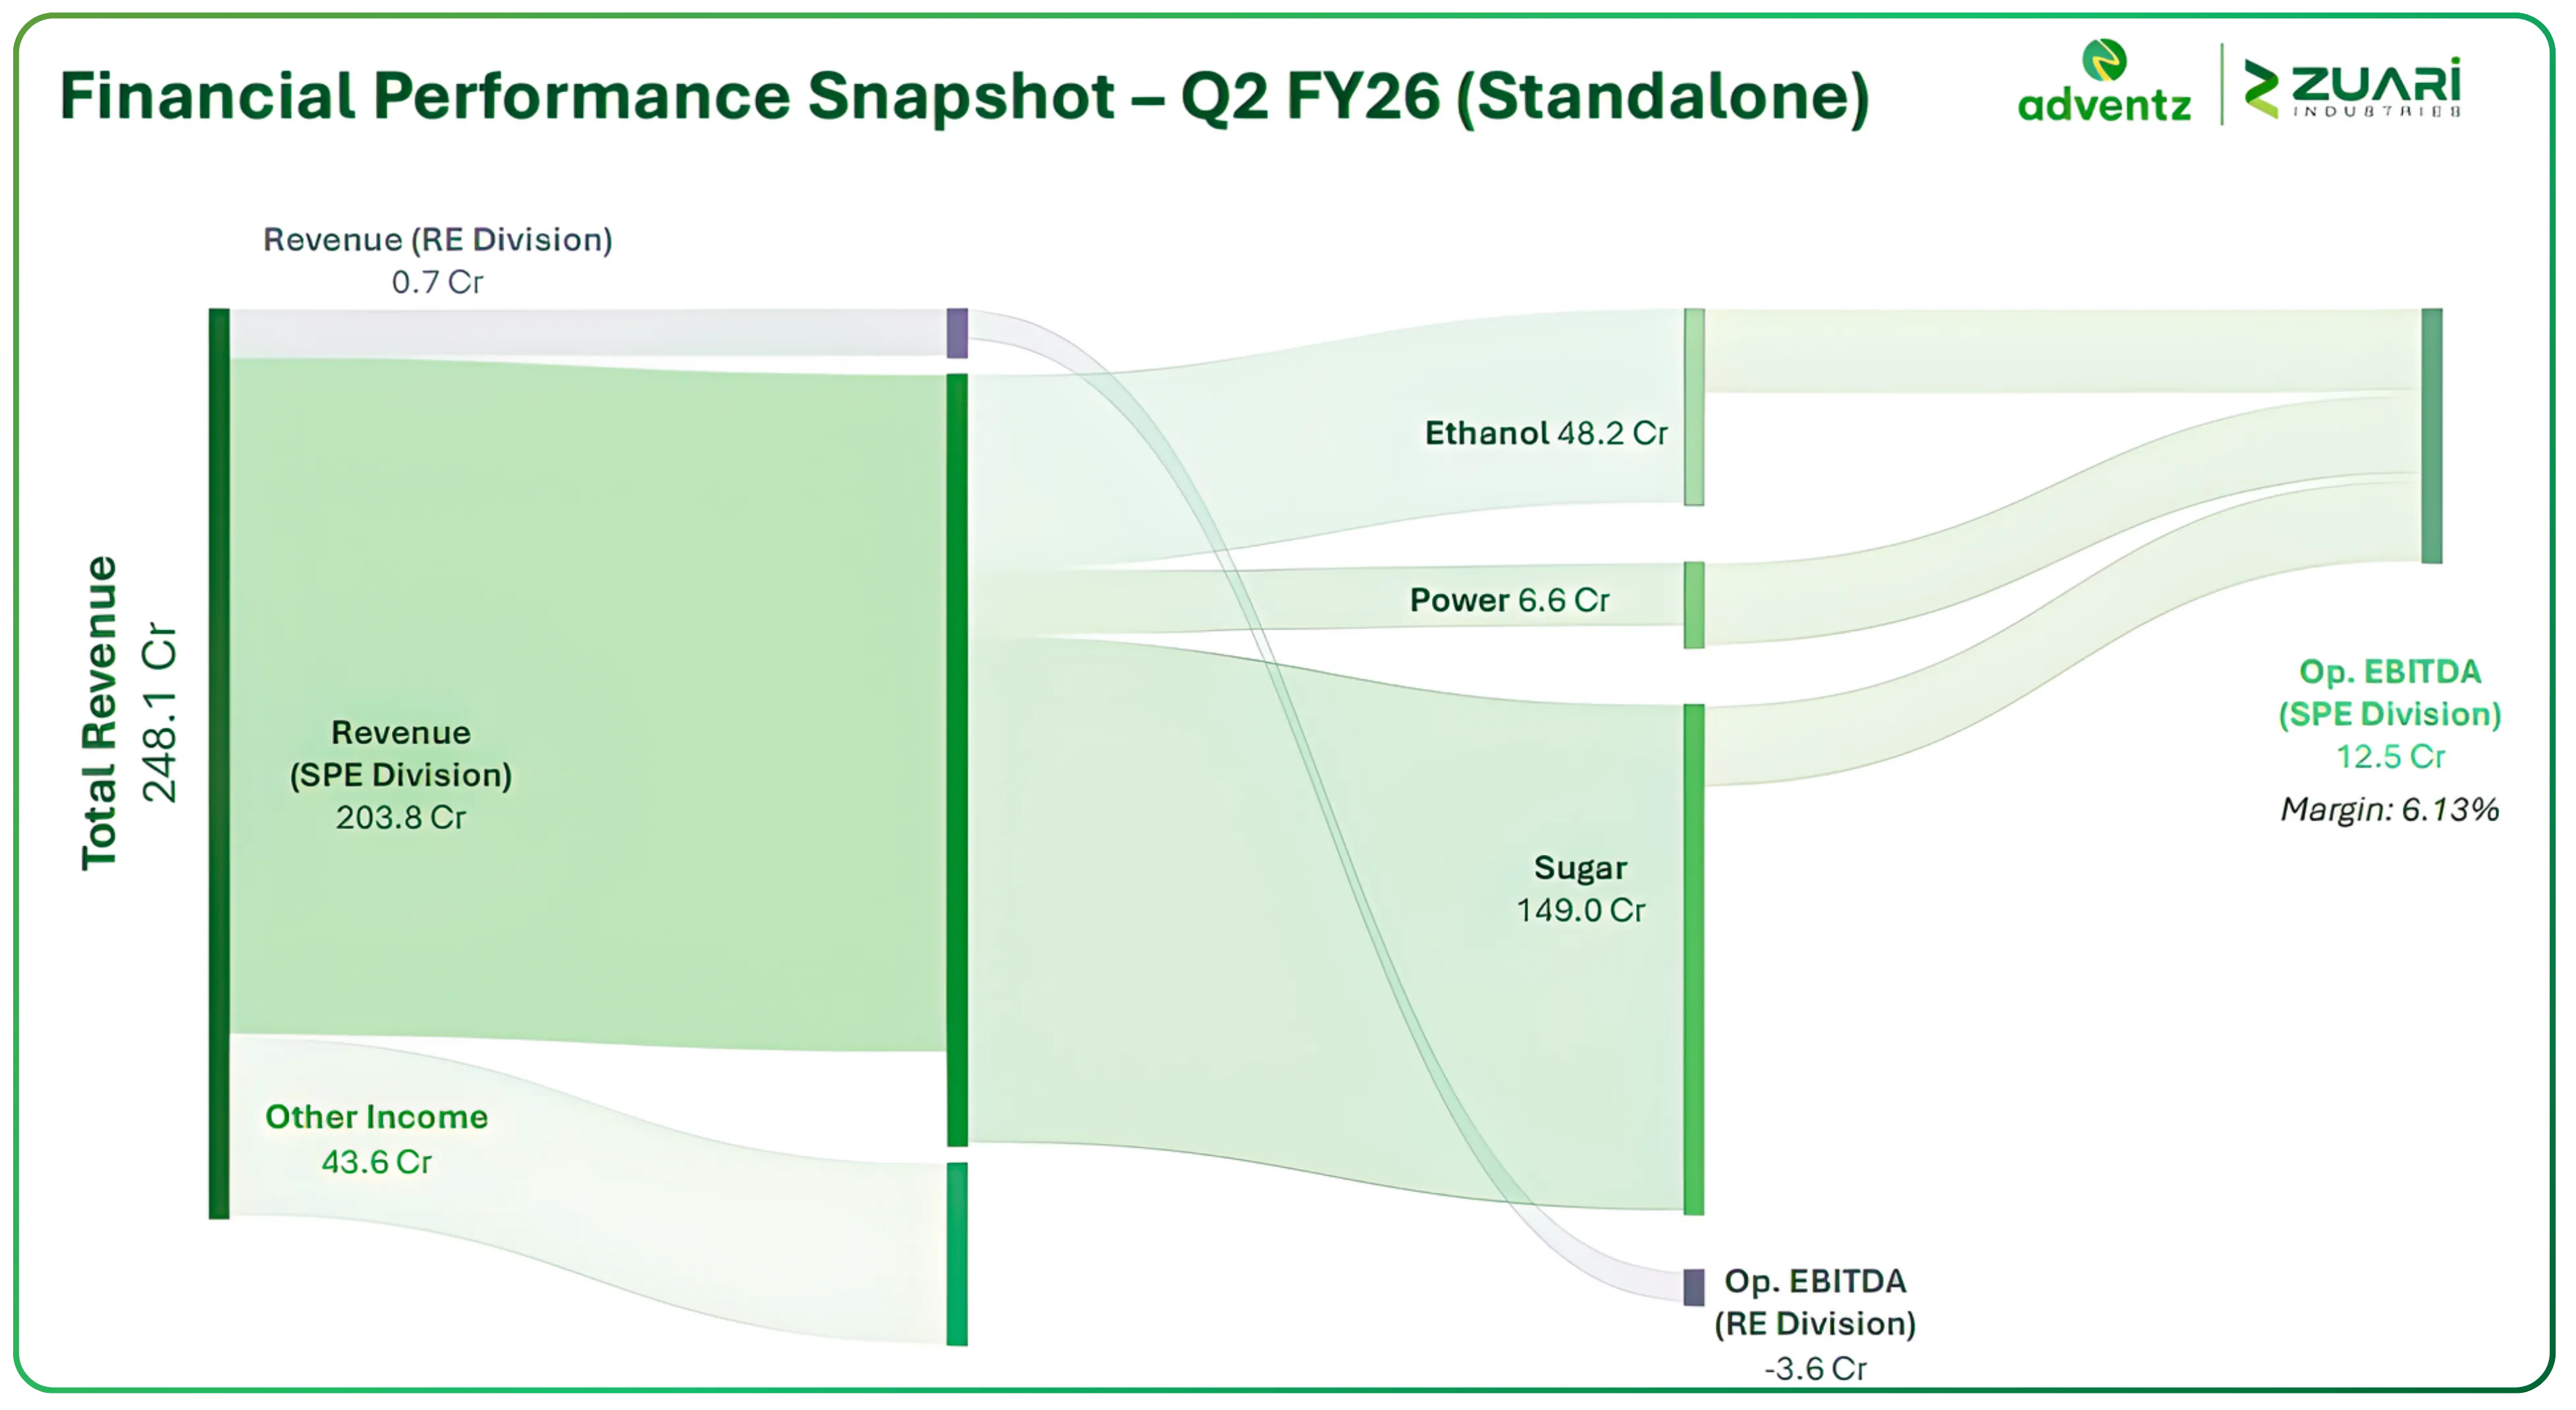
Sugar, Power, and Ethanol (SPE) Division
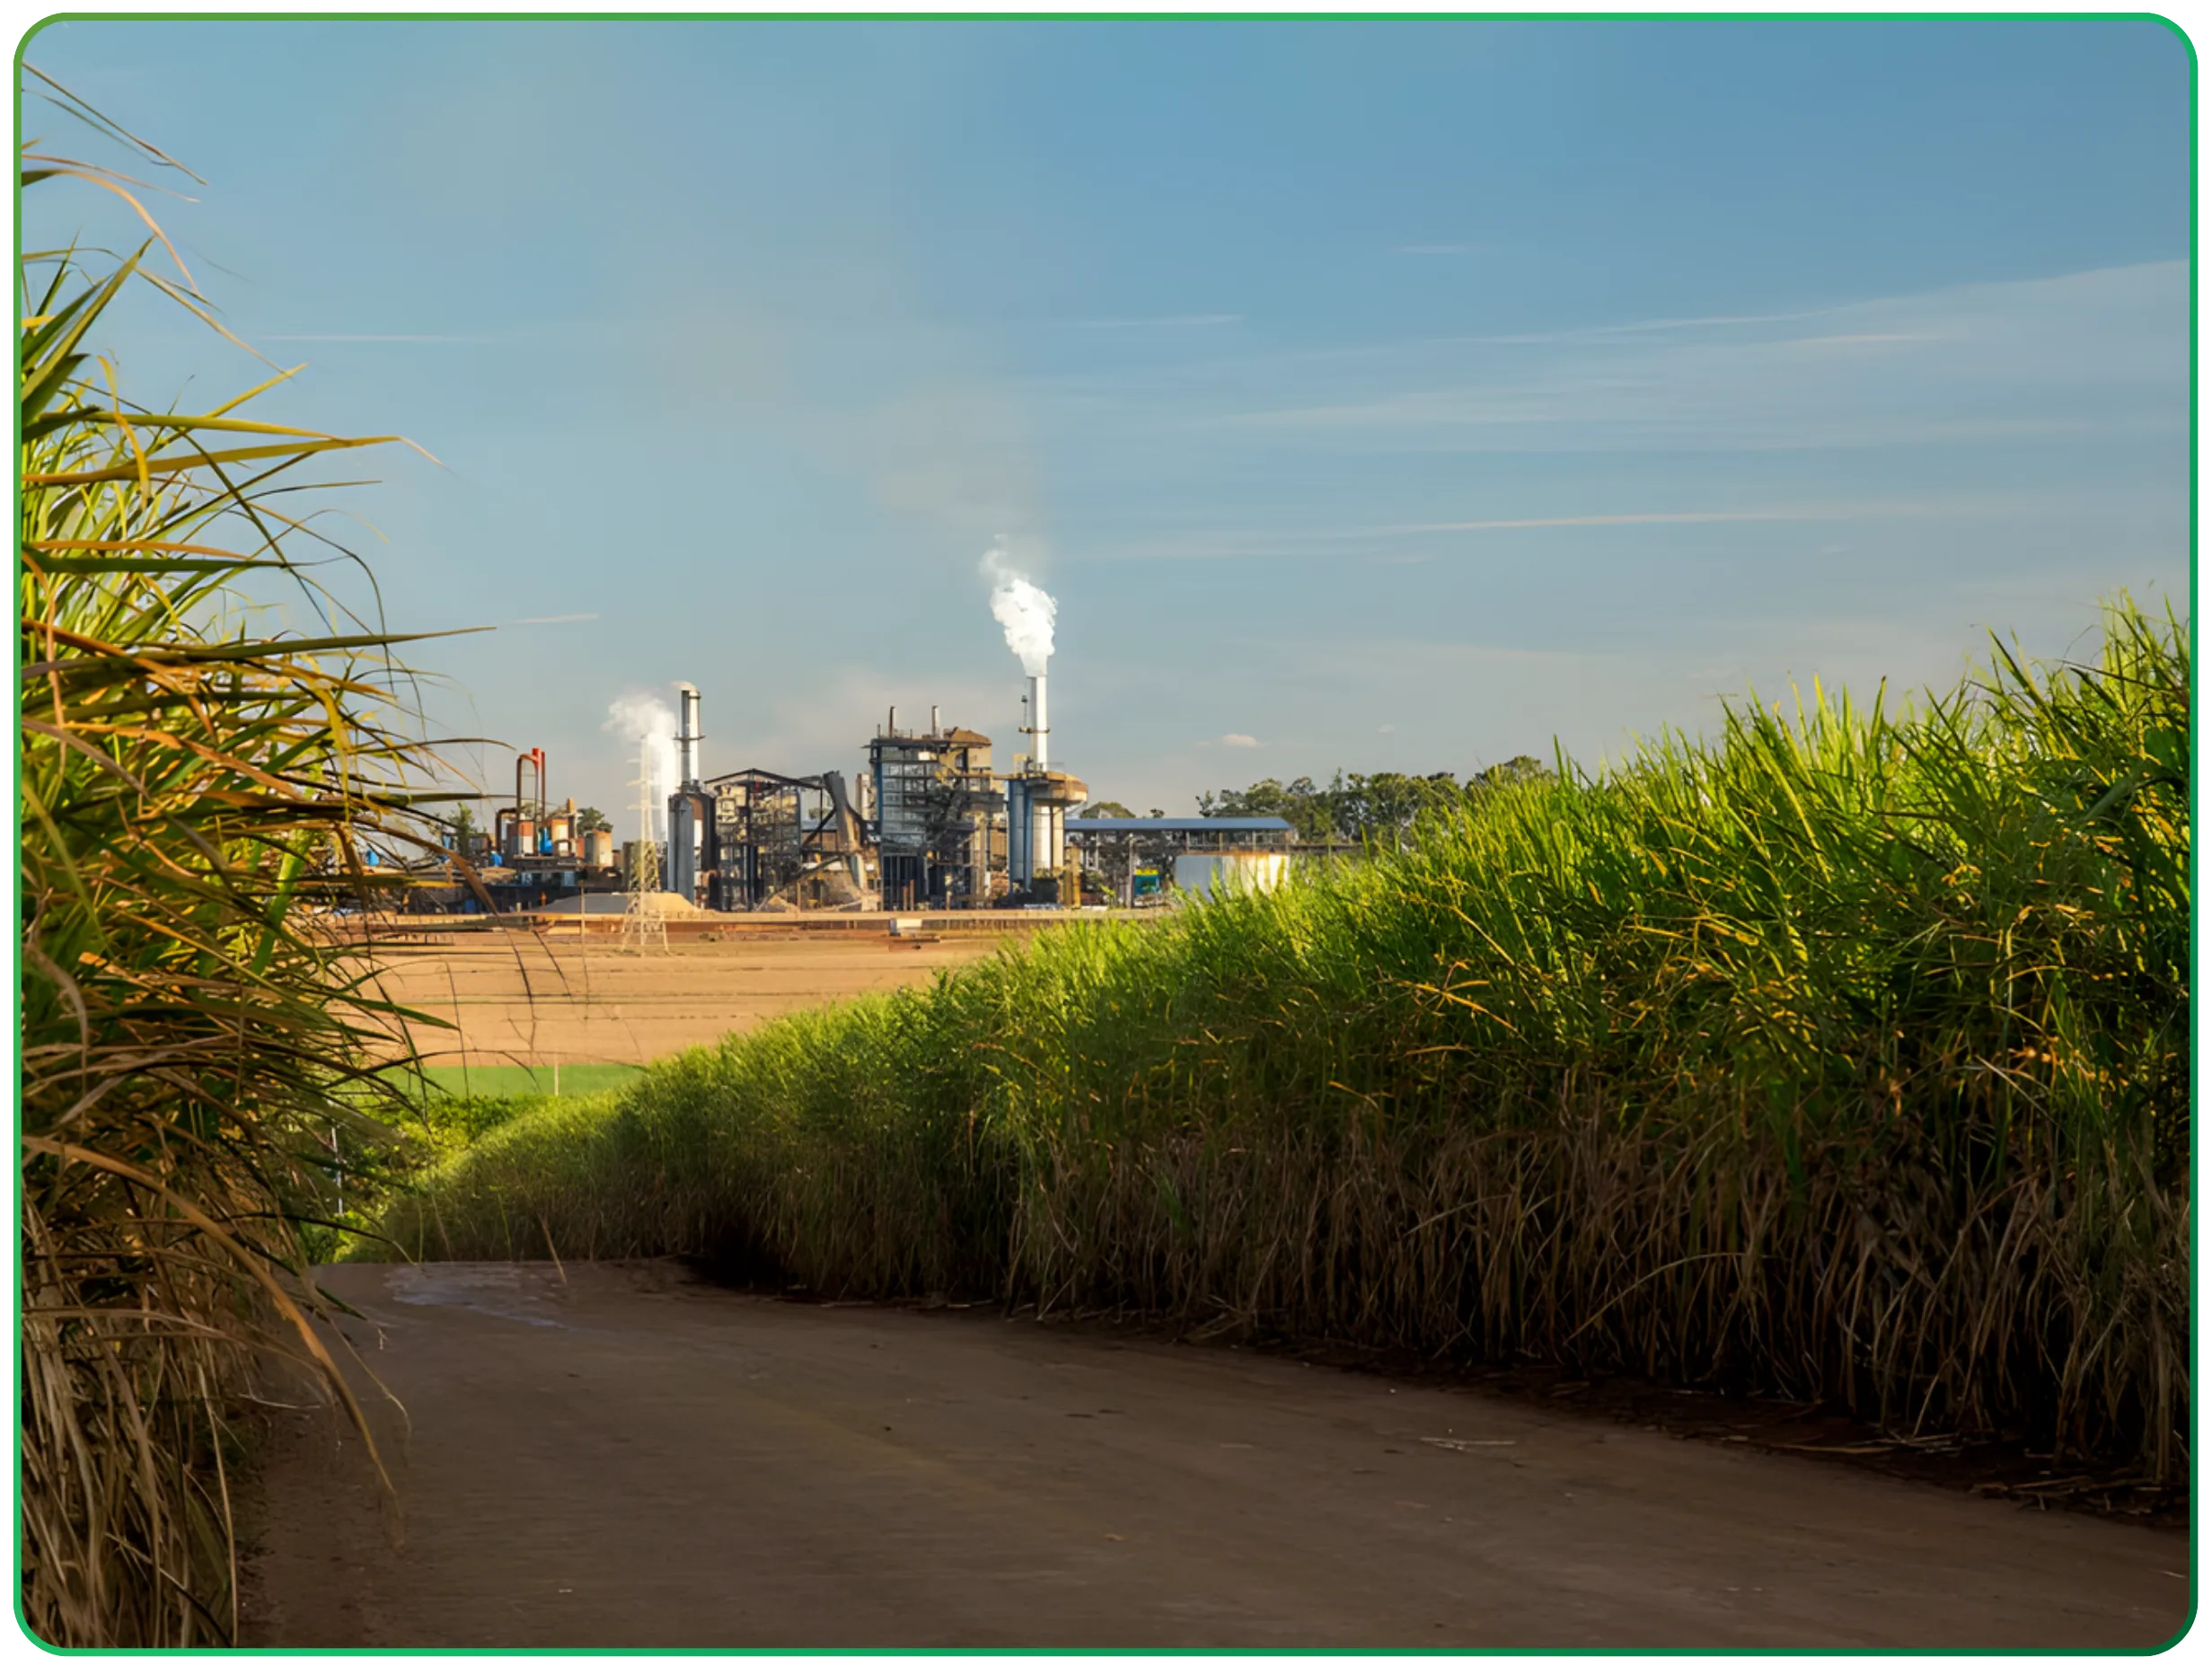
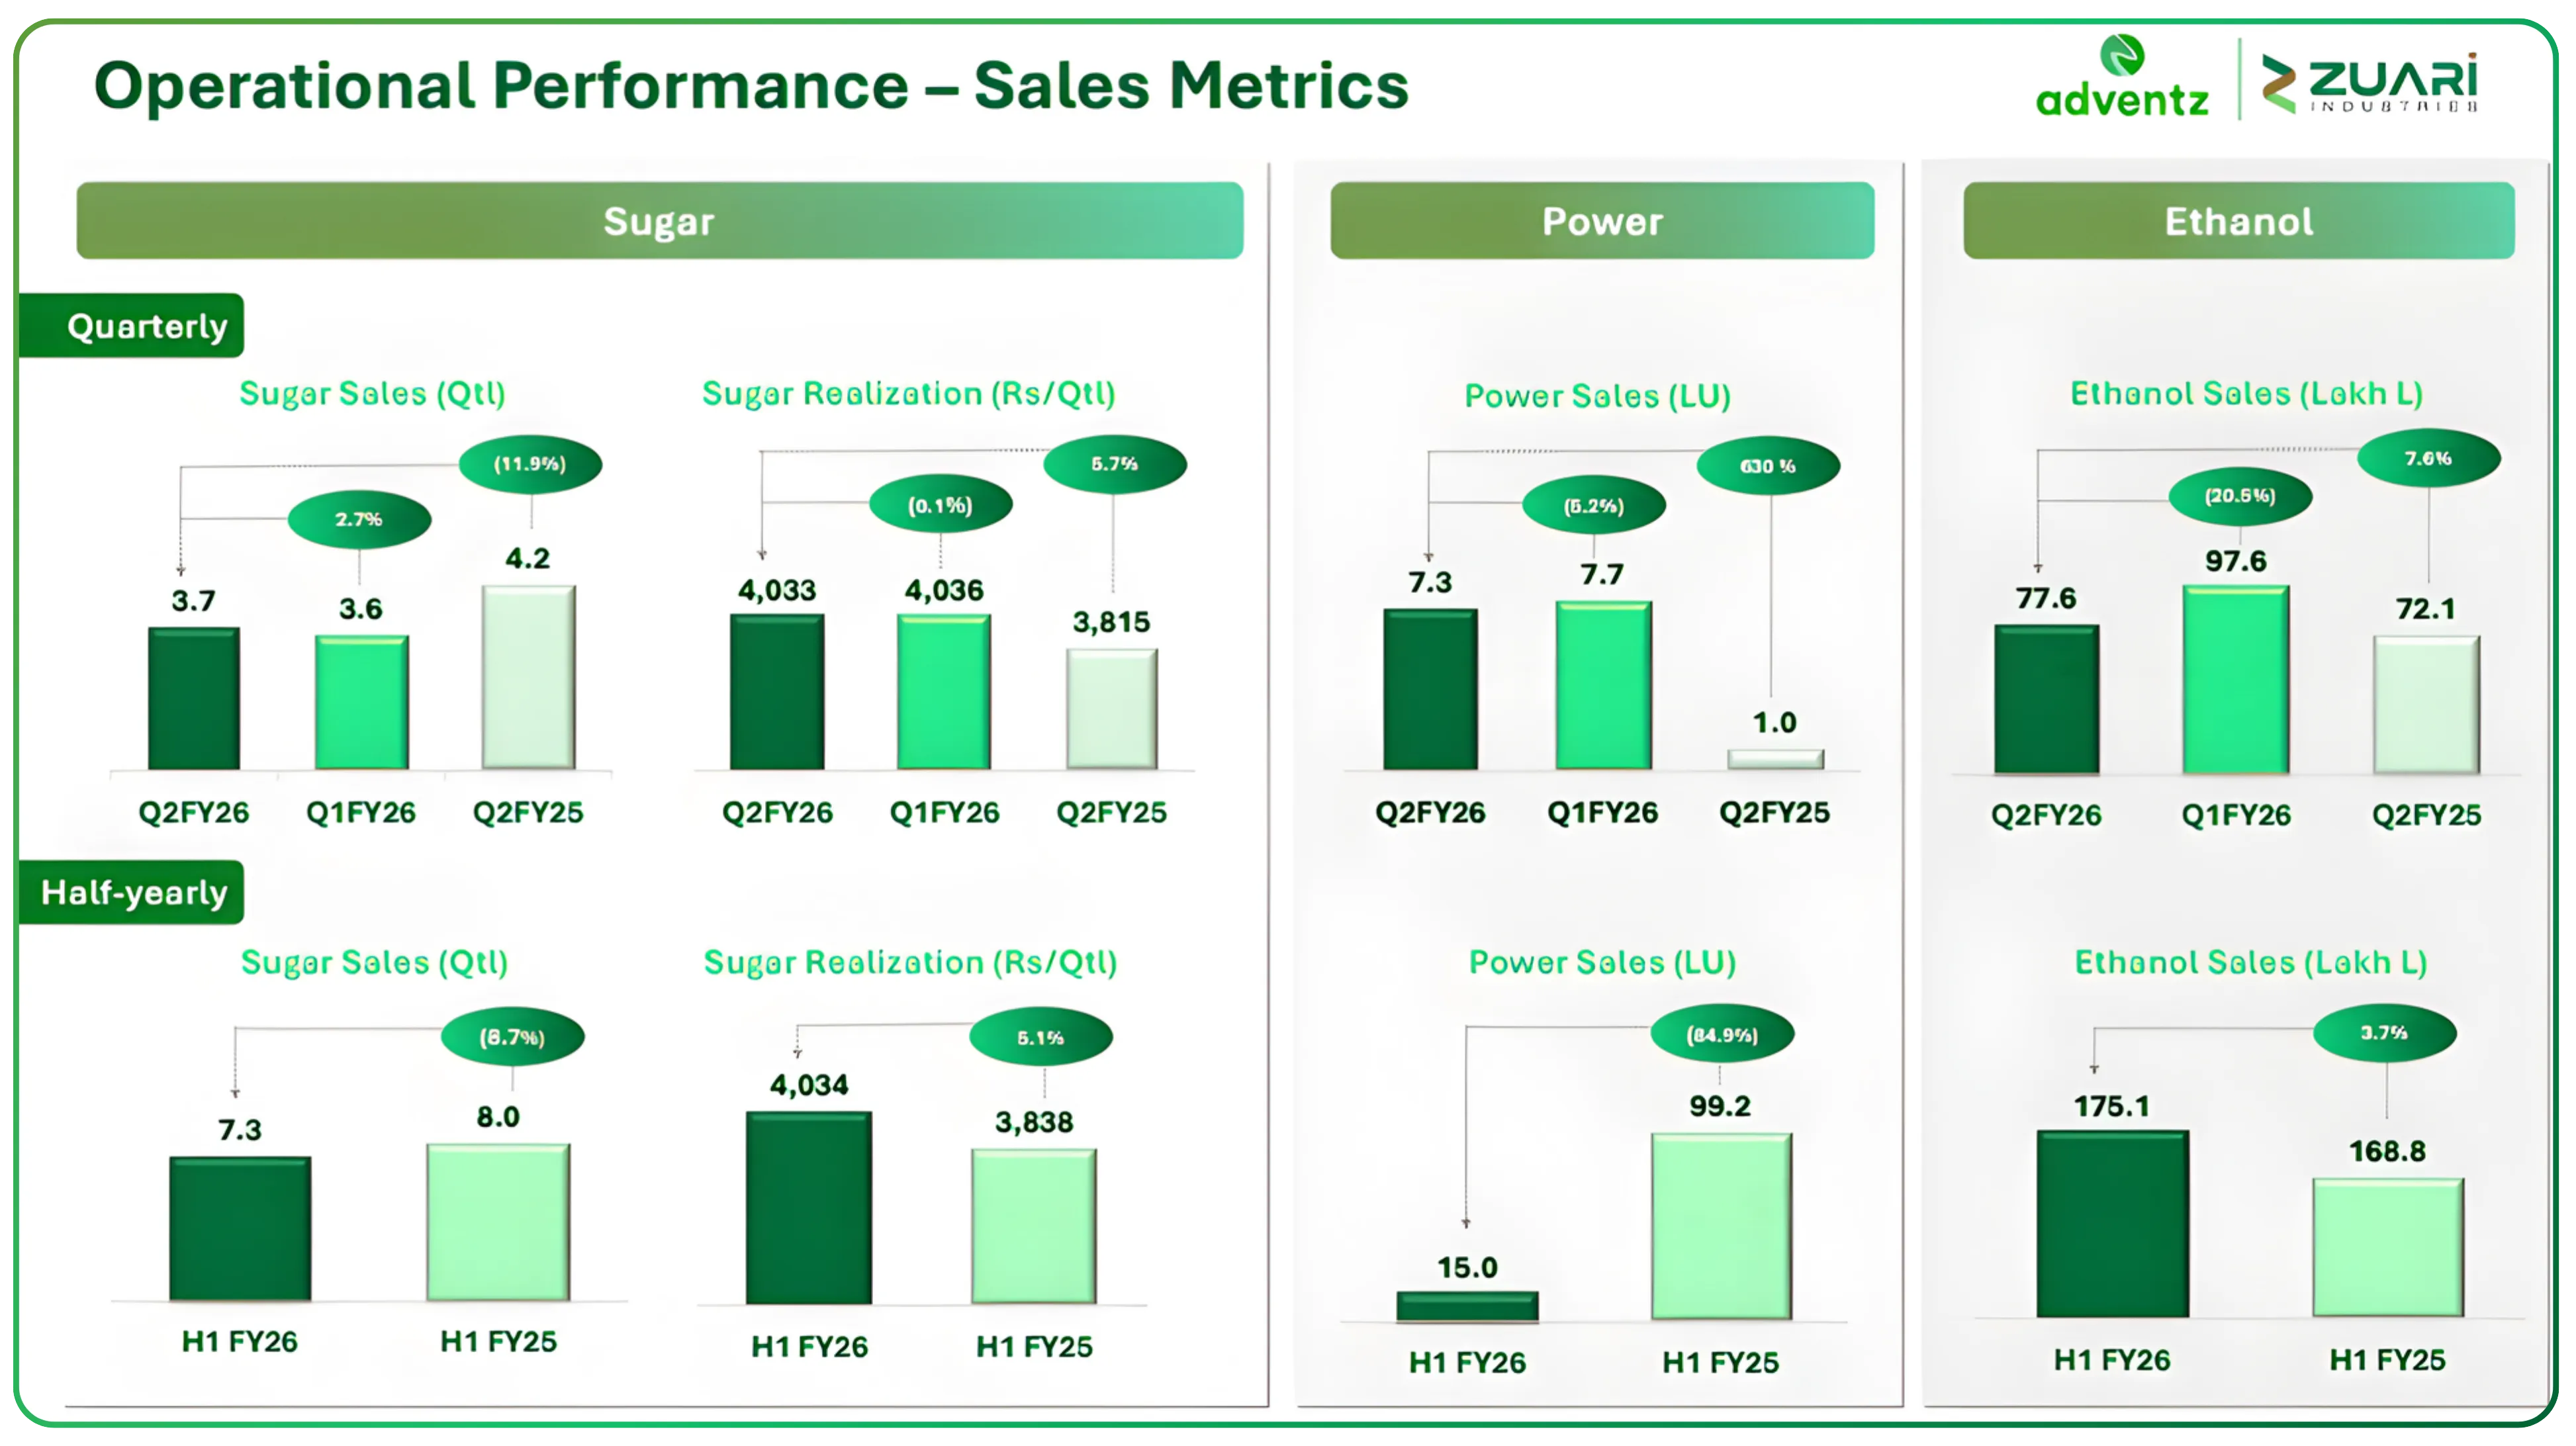
The company operates an integrated Sugar, Power, and Ethanol business that crushes sugarcane to produce sugar, generates electricity through cogeneration with surplus power sold to the grid, and produces ethanol for oil marketing companies under government blending mandates. This integration is strategically important, as ethanol and power revenues provide stability during periods of weak sugar prices, while higher sugar realisations allow the company to capture upside when the cycle turns. The division has also increased ethanol production materially in recent periods, reflecting improving utilisation and favourable blending economics.
The integration across sugar, power, and ethanol partially mitigates the inherent cyclicality of the sugar business, as ethanol blending and cogeneration revenues provide counter-cyclical support during periods of weak sugar price realisations.
Real Estate
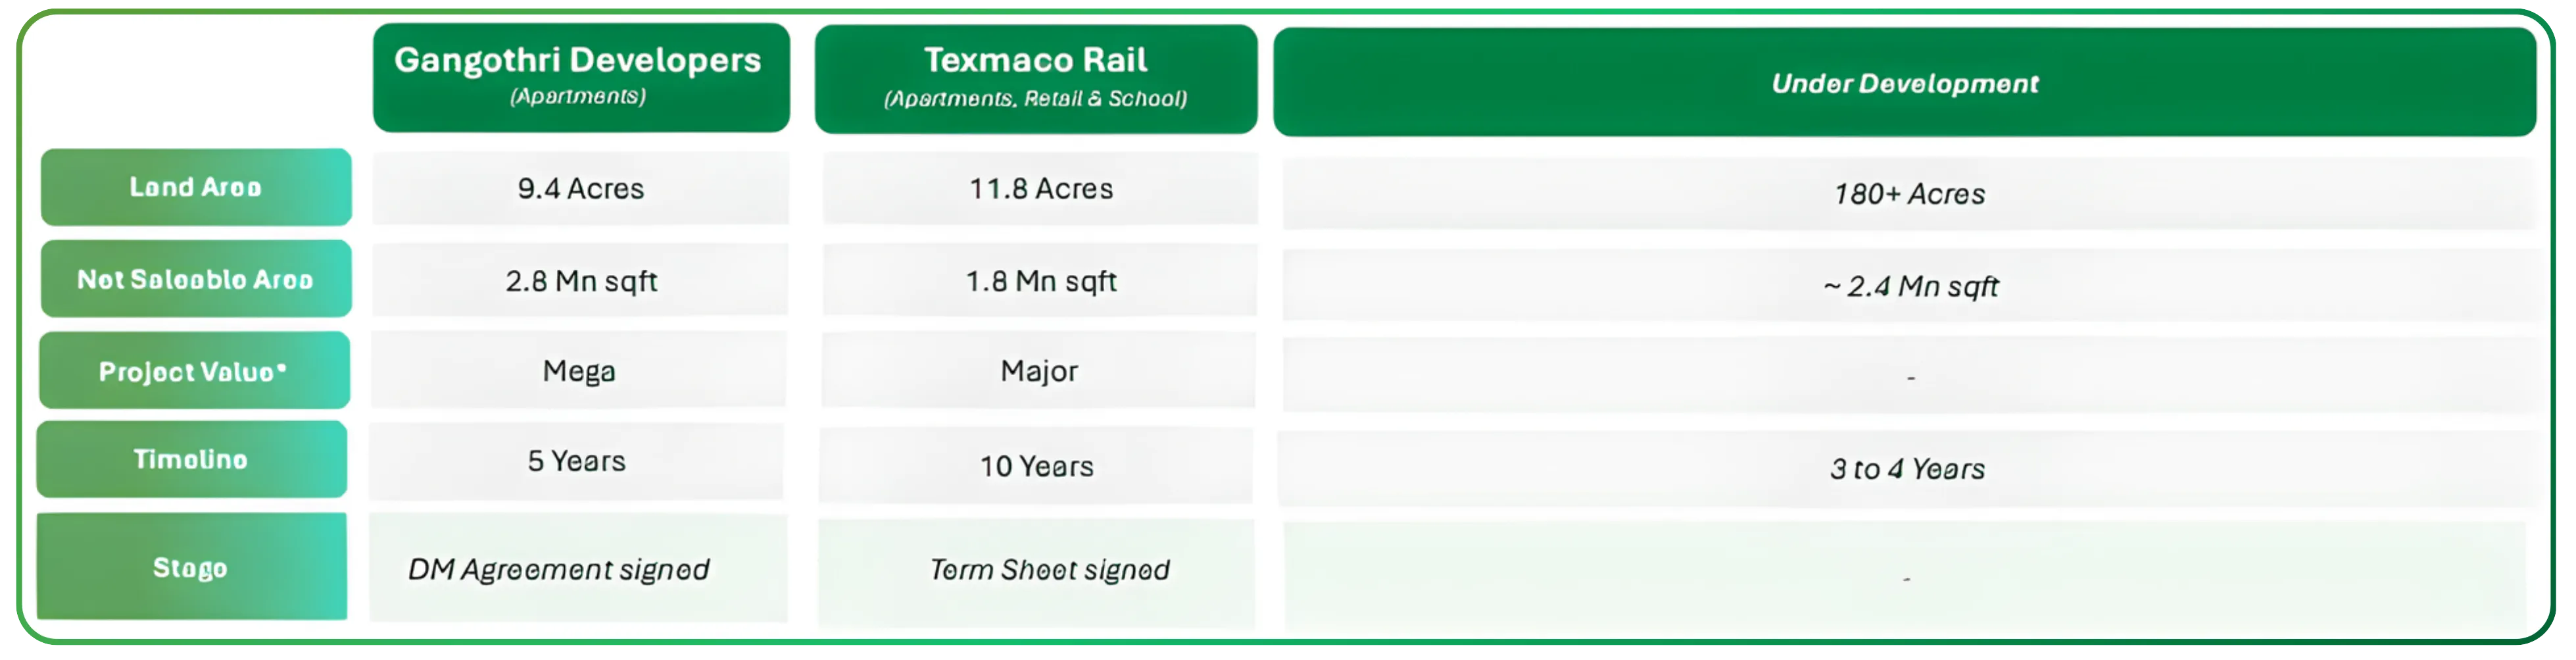
Zuari Industries participates in real estate primarily through development management and selective project ownership, both in India and overseas. The business follows an asset-light development management model that generates fee-based income, complemented by selective exposure to high-value international projects. Over time, the company also seeks to unlock value through the monetisation of legacy land banks. Revenue recognition in this segment remains uneven and is largely dependent on project milestones, foreign exchange movements, and the timing of asset monetisation.
Financial Services and Other Businesses
This segment includes subsidiaries engaged in financial product distribution, insurance broking, and management services. While these businesses are relatively small in revenue terms, they are capital-light in nature and contribute steady, recurring income to the consolidated profile.
Strategic Investments
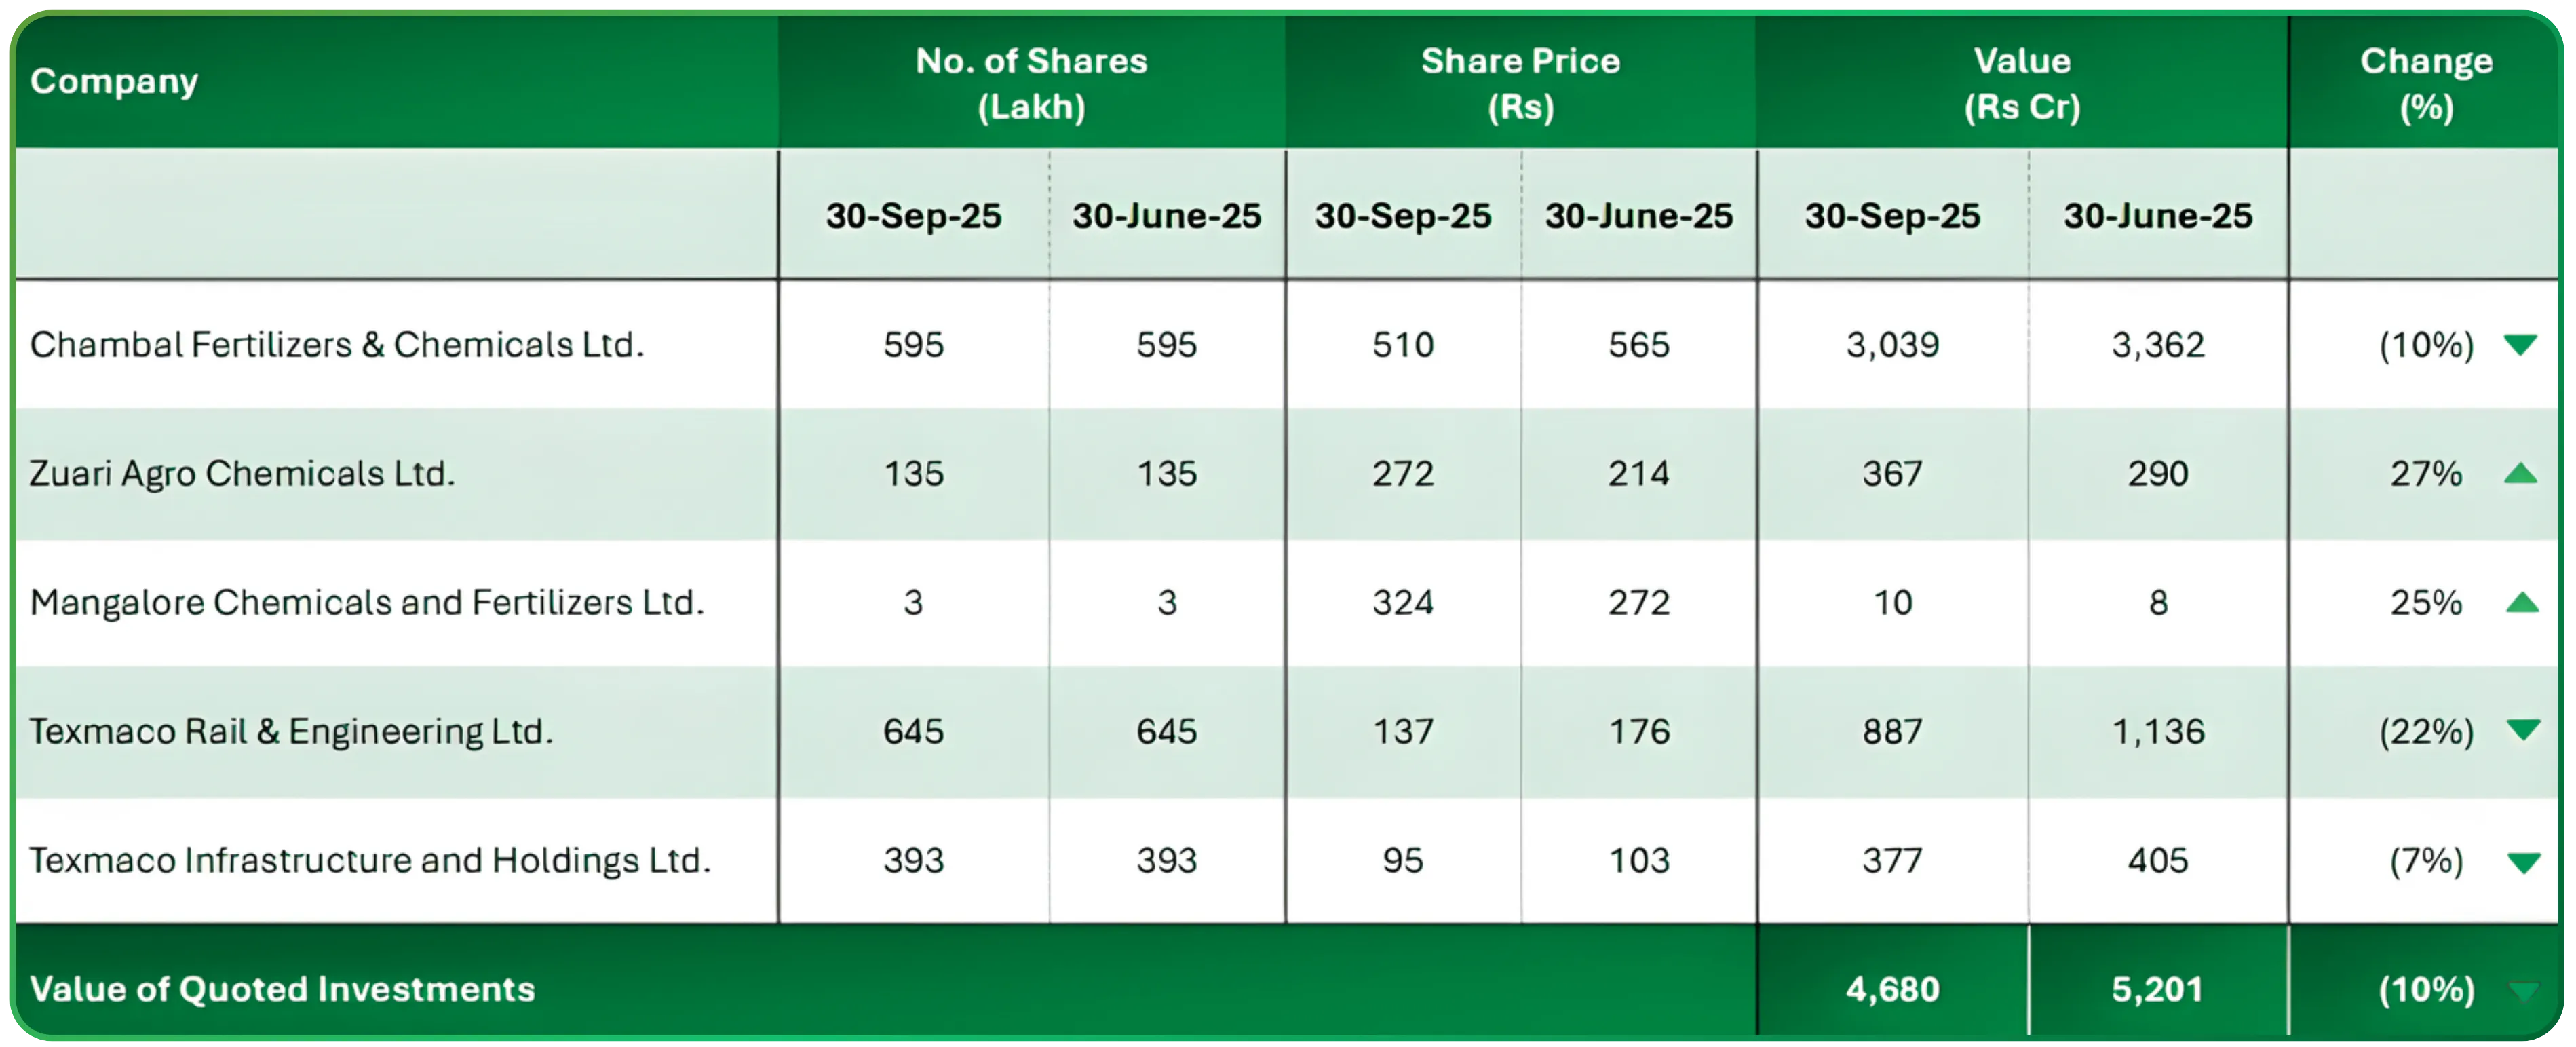
Zuari Industries holds significant equity investments in listed group companies, particularly in the fertilizers and rail engineering segments. These investments generate dividend income and interest income through inter-corporate deposits, while also contributing meaningfully to balance sheet value accretion. As of FY25, the market value of strategic investments accounted for a substantial portion of the company’s net worth, with a reported book value of ₹6,379 crore, reinforcing the view that Zuari Industries functions as much as a holding company as an operating business.
You may also explore Control Print Ltd at the Center of India’s Coding and Marking Ecosystem, a focused analysis of a niche manufacturing business built around technology, compliance, and recurring demand drivers.
Financial Performance Analysis
Consolidated Income Statement Trends
| Financial Year | Revenue (₹ cr) | Operating Margin (%) | Net Profit (₹ cr) |
|---|---|---|---|
| FY21 | 834 | -1% | -98 |
| FY22 | 722 | 2% | -35 |
| FY23 | 955 | 3% | 309 |
| FY24 | 838 | 6% | 713 |
| FY25 | 970 | 5% | -94 |
| TTM | 1,006 | 6% | 118 |
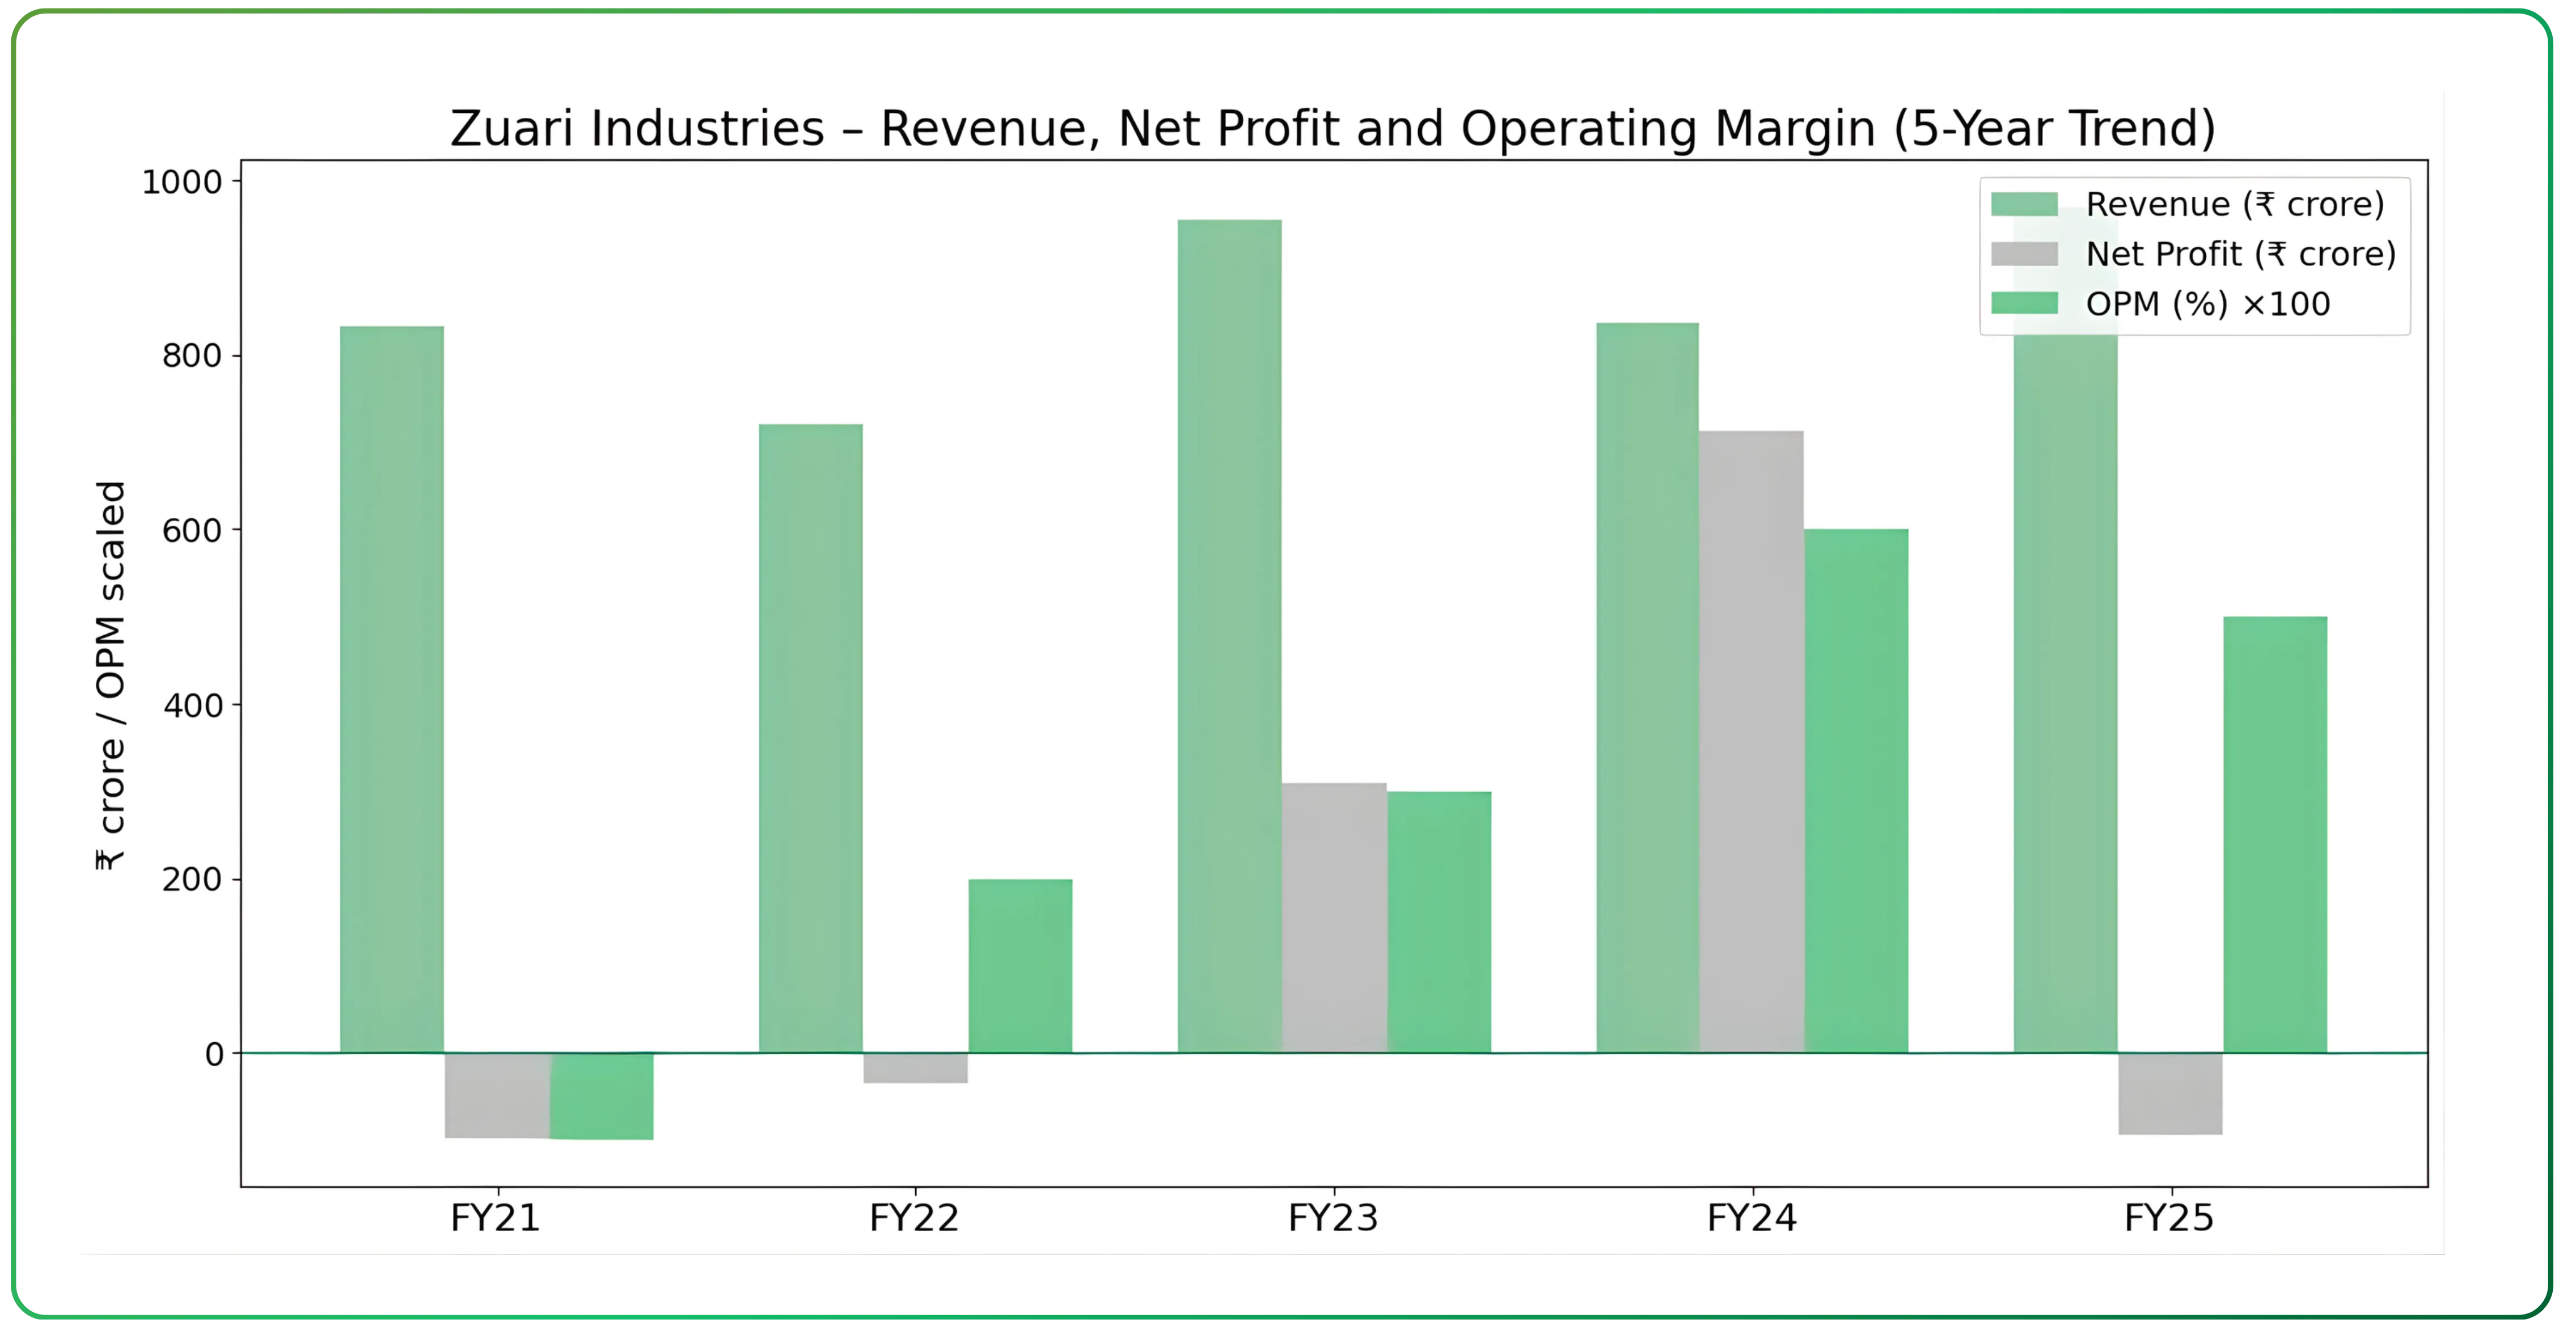
Historical data indicates that reported net income has been volatile, reinforcing the need to interpret financial ratios in the context of non-operating income and balance sheet movements.
Revenue
Revenue has remained volatile over the past decade, reflecting the cyclical nature of the sugar business, variability in real estate income, and the episodic contribution of investment-related income. Between FY21 and FY25, consolidated revenue ranged from ₹722 crore to ₹970 crore, with FY25 revenue reported at ₹970 crore. On a trailing twelve-month basis, revenue increased to ₹1,006 crore.
Operating Margin (OPM)
Operating margins have historically been weak and volatile, with losses recorded across several years, including FY16 and the period from FY18 to FY21. A gradual improvement has been visible from FY22 onwards, supported by better operating performance. Operating margin improved to 6% in FY24 before moderating slightly to 5% in FY25, while the trailing twelve-month margin stands at 6%. The recovery in margins has been driven by improved ethanol utilisation, better sugar realisations, and tighter cost control, consistent with management commentary.
Net Profit
Net profit has been highly erratic over the years, reflecting the influence of other income, investment-related gains, and exceptional items. The company reported sustained losses between FY15 and FY22, followed by a sharp turnaround in FY23 with net profit of ₹309 crore. Profitability increased further in FY24 to ₹713 crore, largely driven by non-operating income. In FY25, the company reported a net loss of ₹94 crore, while trailing twelve-month net profit stood at ₹118 crore.
Balance Sheet Trends
The capital structure increasingly reflects an asset-heavy profile, with equity backed by investment holdings rather than operating assets alone, and book value driven largely by strategic stakes.
| Year | Investments (₹ cr) | Borrowings (₹ cr) |
|---|---|---|
| FY21 | 1,877 | 2,288 |
| FY22 | 3,180 | 2,512 |
| FY23 | 2,586 | 2,691 |
| FY24 | 4,852 | 2,436 |
| FY25 | 6,379 | 2,568 |
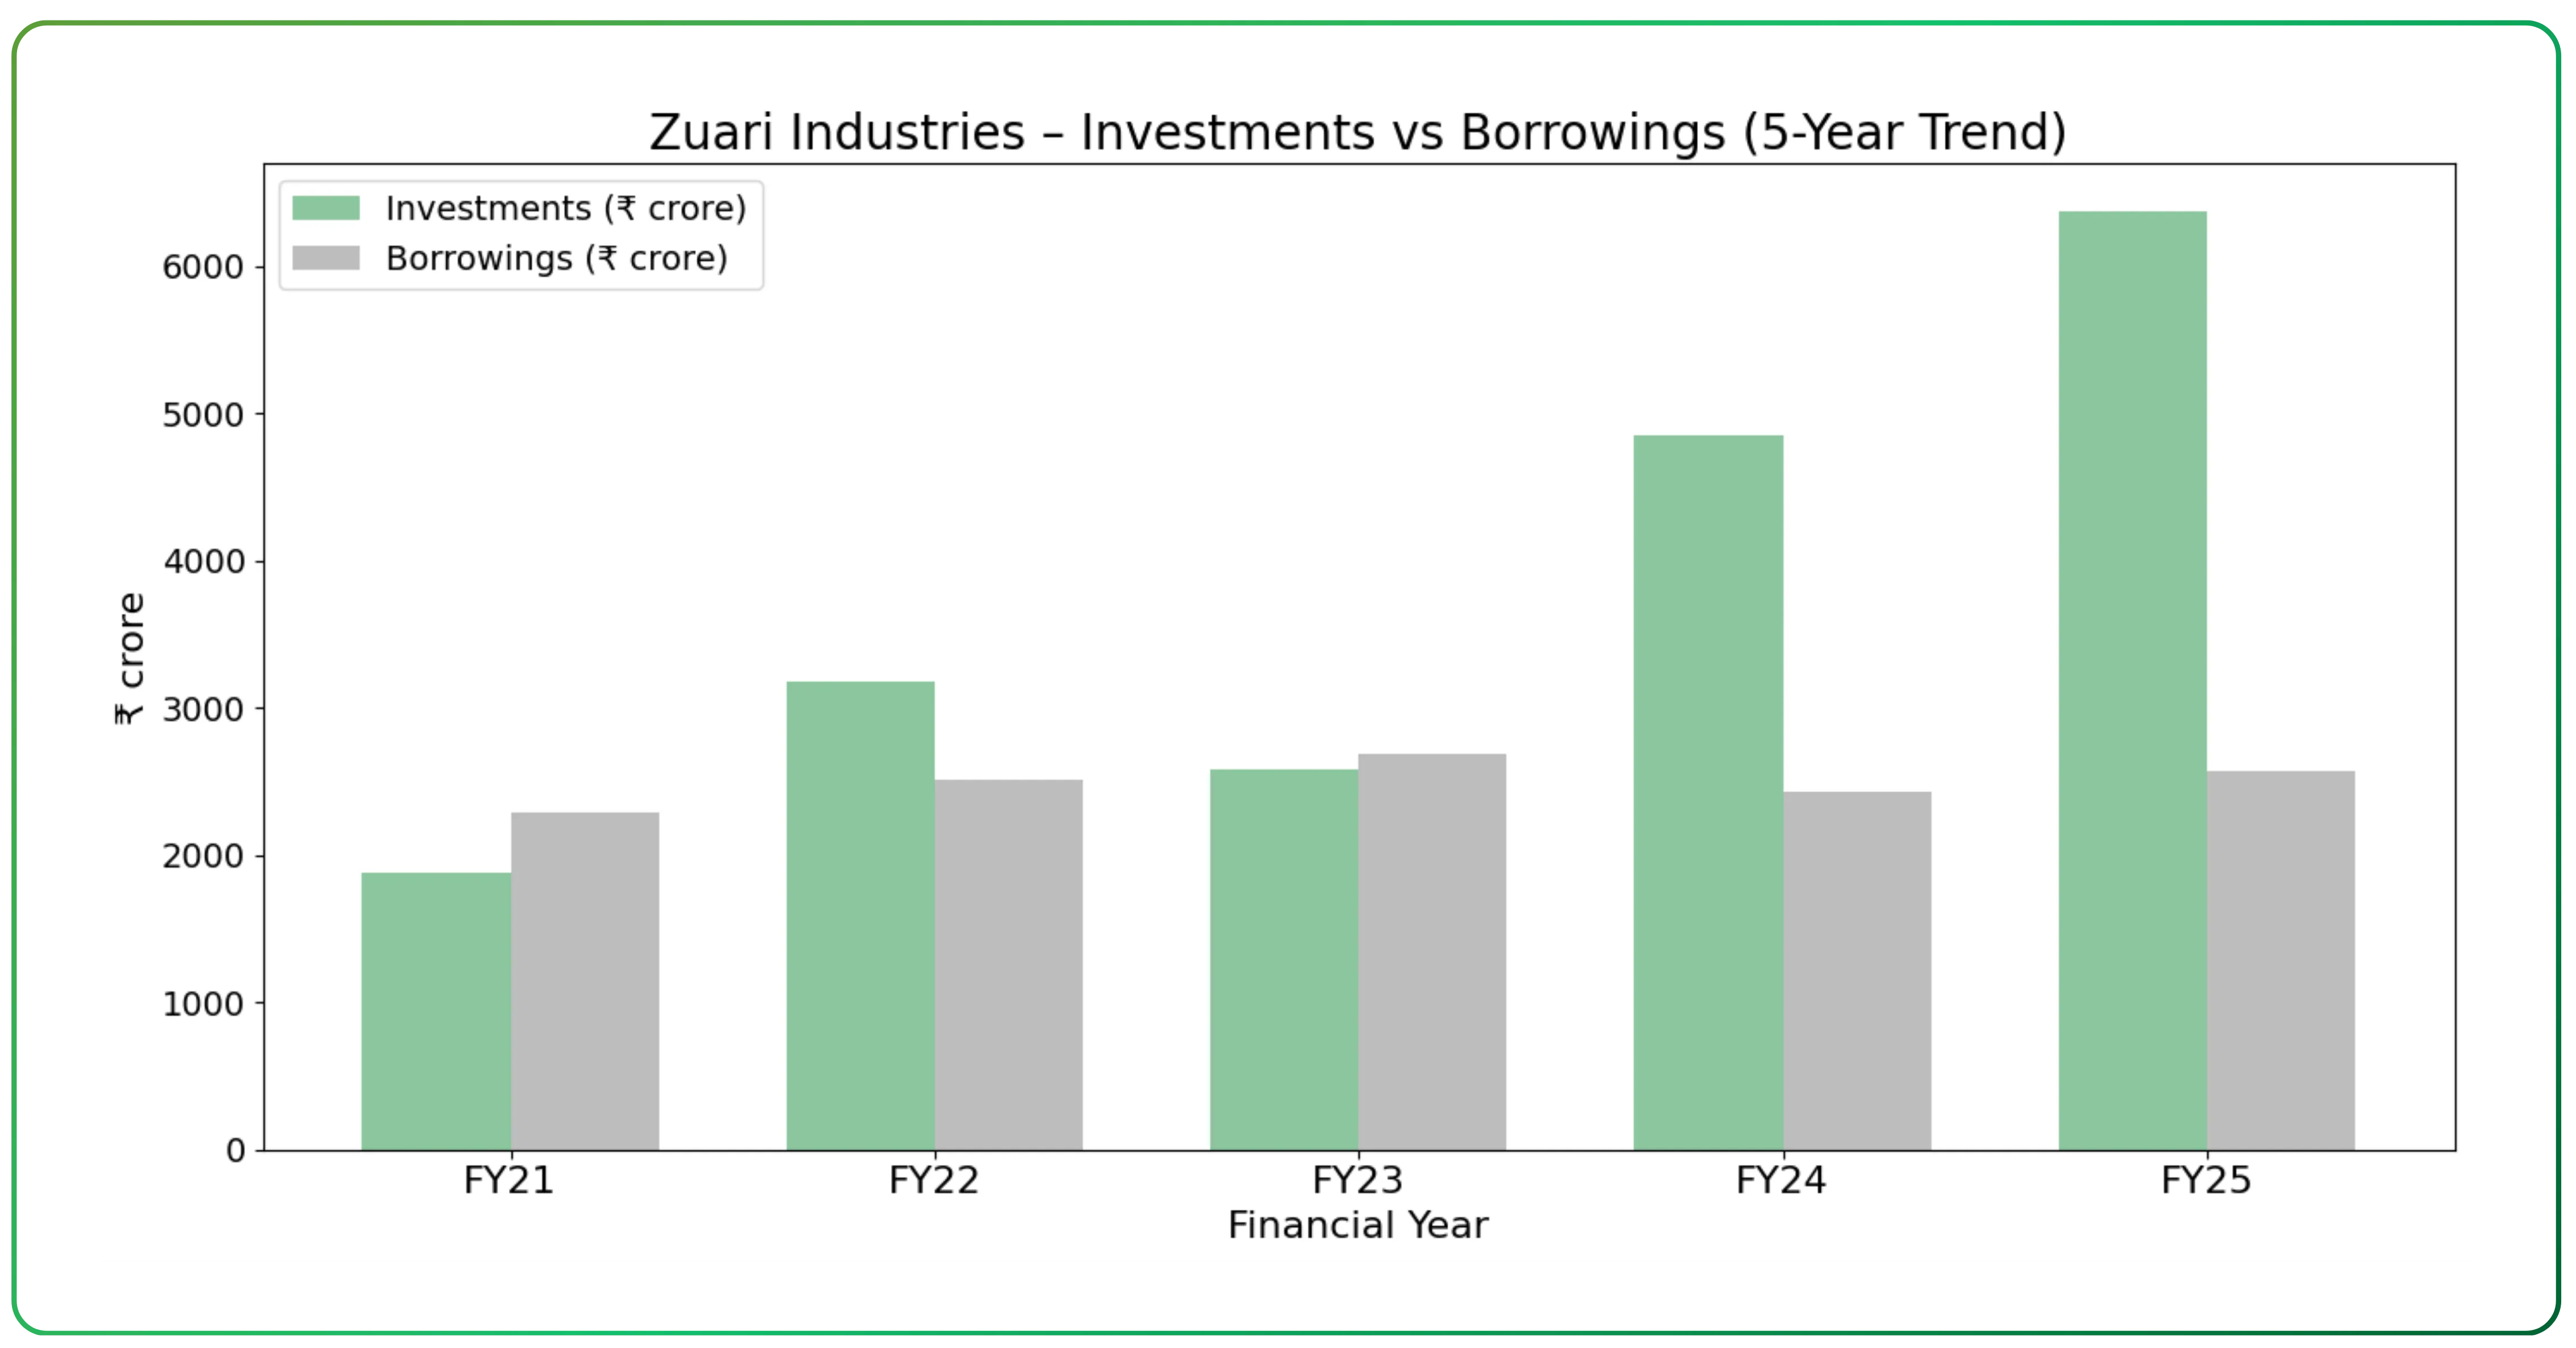
Net worth expanded materially over the period, with reserves increasing from ₹1,137 crore in FY20 to ₹4,959 crore in FY25. This growth was driven largely by investment revaluations and the accumulation of retained earnings during years of elevated non-operating income.
Investments increased sharply from ₹1,877 crore in FY21 to ₹6,379 crore in FY25. As of September 2025, the investment portfolio stood at ₹6,025 crore, making it the most significant line item on the balance sheet and central to the company’s overall valuation profile.
Borrowings also increased over the period, rising from ₹1,940 crore in FY20 to ₹2,568 crore in FY25. While leverage remains elevated in absolute terms, it is partly supported by liquid quoted investments on the balance sheet. Debt levels continue to be a key consideration in assessing financial flexibility, as reflected in credit assessments.
Cash Flow Analysis
| Financial Year | Operating Cash Flow (₹ Cr.) | Investing Cash Flow (₹ Cr.) | Financing Cash Flow (₹ Cr.) | Net Cash Flow (₹ Cr.) |
|---|---|---|---|---|
| FY21 | 109 | -204 | 90 | -5 |
| FY22 | 62 | 69 | -87 | 44 |
| FY23 | 269 | -159 | -89 | 22 |
| FY24 | 71 | 475 | -583 | -36 |
| FY25 | -1 | 183 | -163 | 18 |
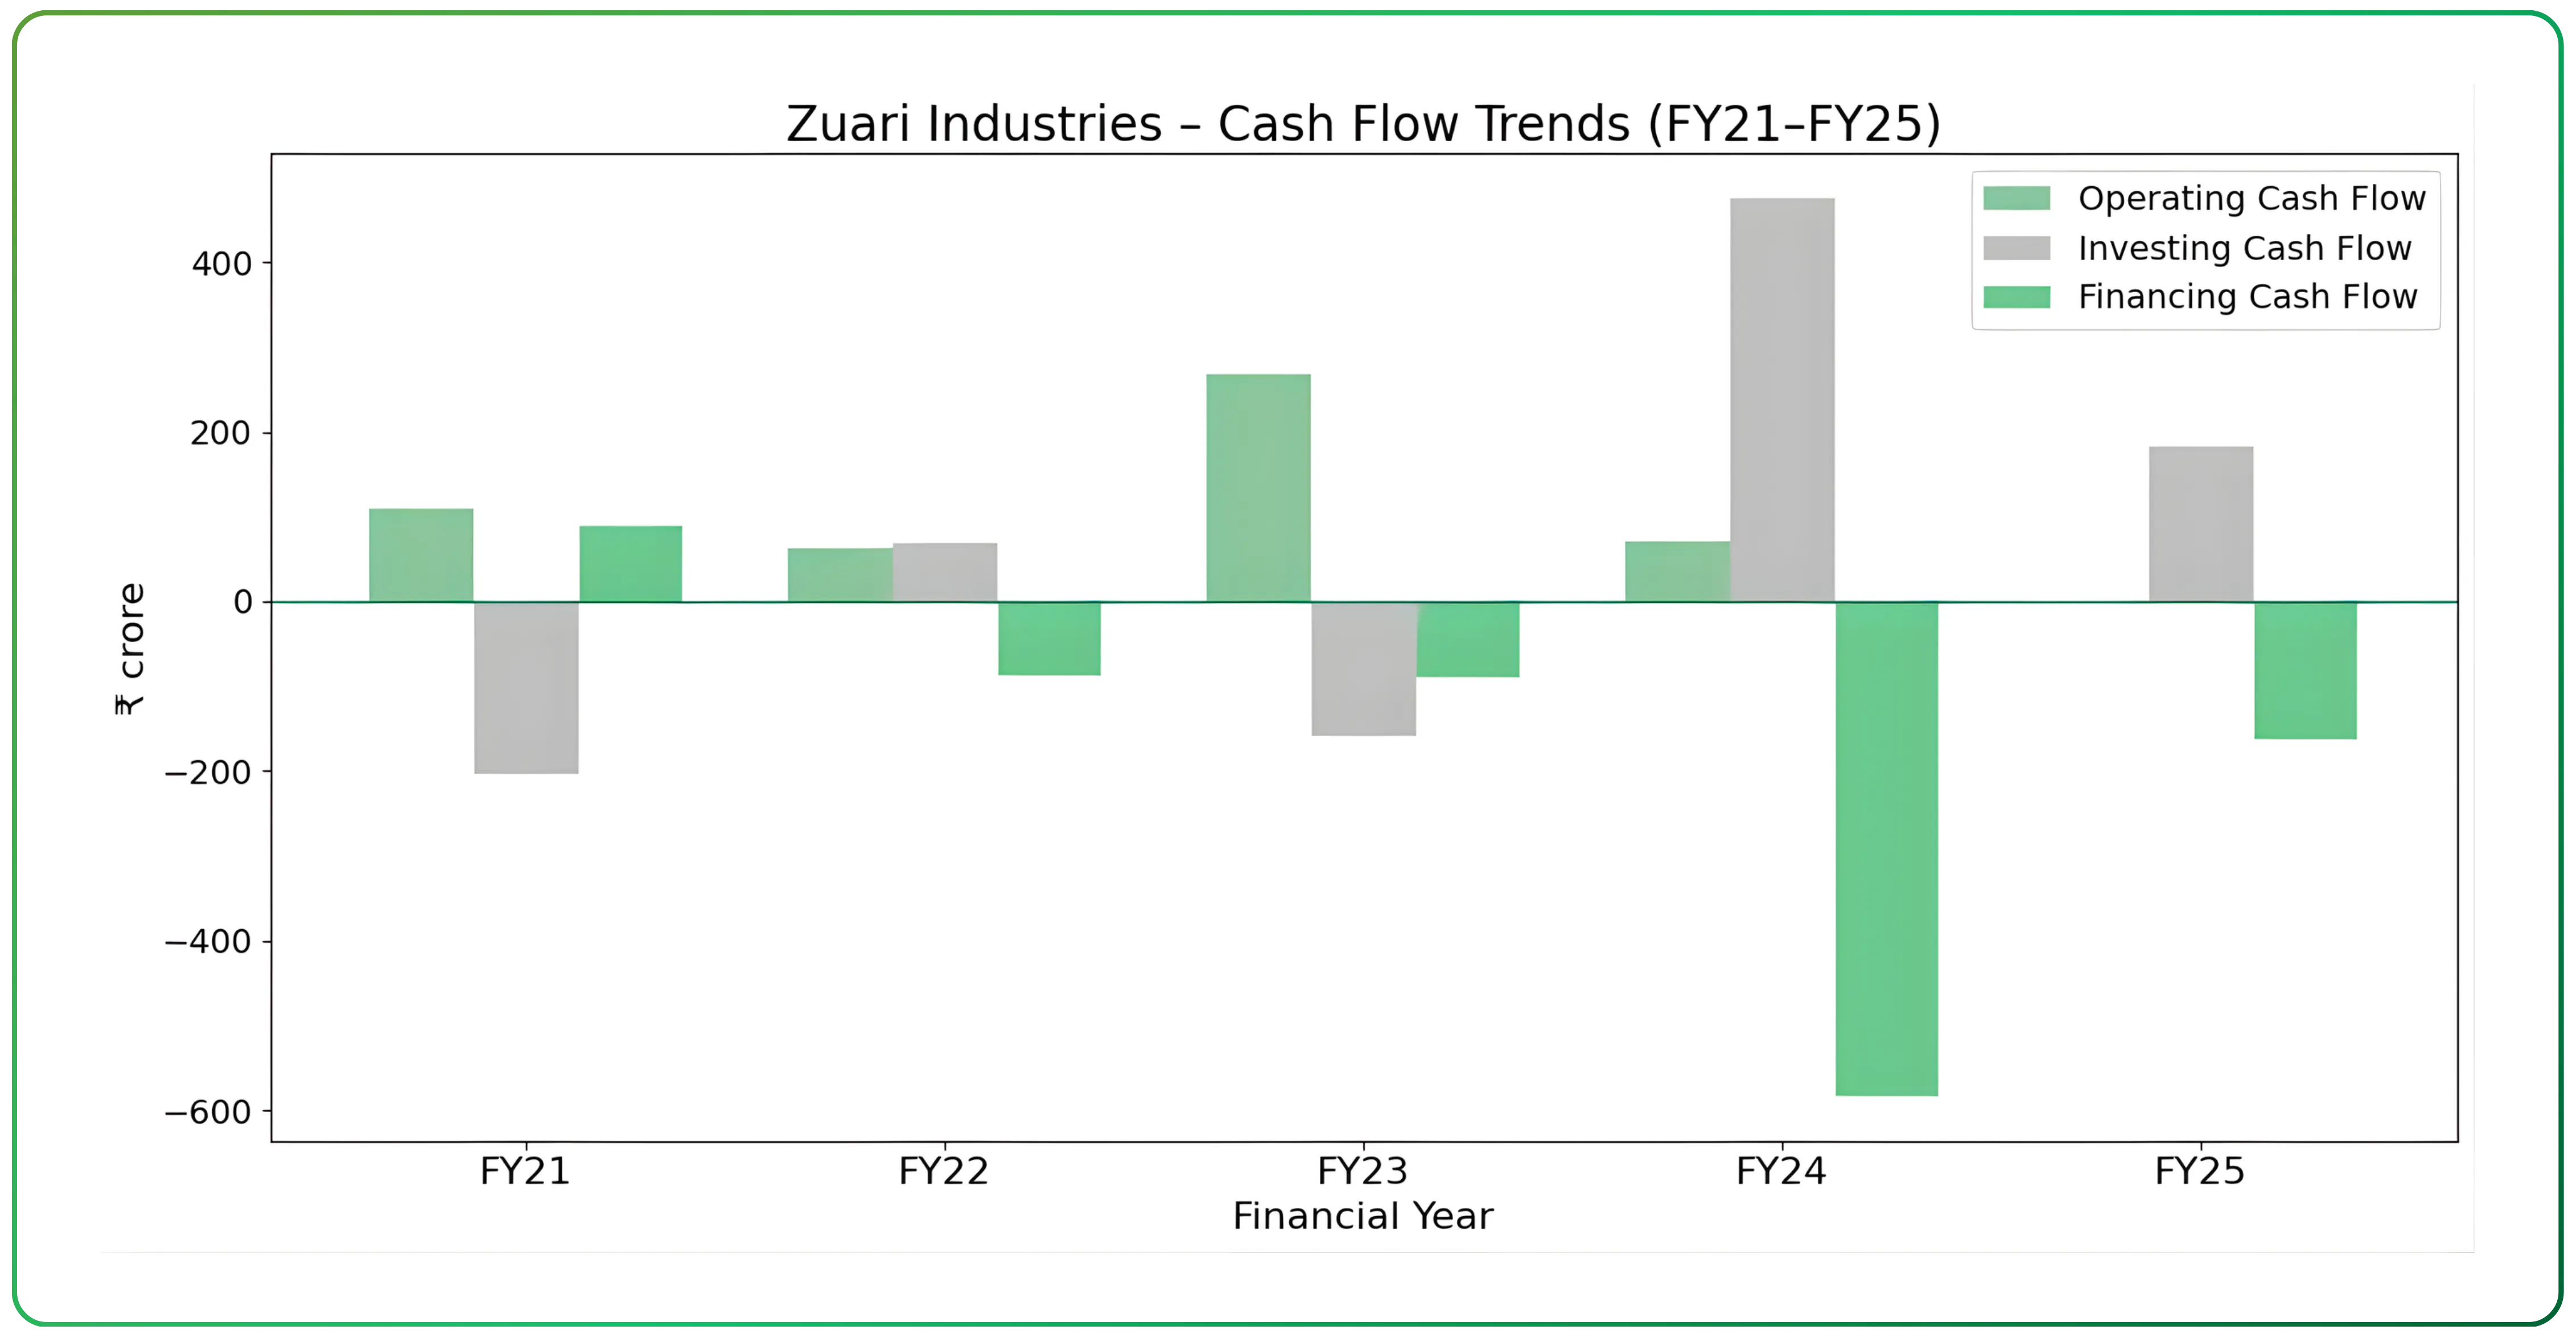
Cash flow patterns reflect the company’s mixed character as both an operating business and a holding entity. Operating cash flows have been inconsistent over the years, turning positive in FY17, FY20, FY21, and FY23, before reverting to negative territory in FY25. This variability mirrors fluctuations in operating profitability as well as movements in working capital.
Investing and financing cash flows have shown large swings across periods, driven primarily by investment purchases and sales, refinancing and repayment of borrowings, and periodic asset monetisation. These movements highlight the role of capital allocation and balance sheet actions in shaping cash flows, alongside underlying operating performance.
What the Financial Profile Indicates
The financial profile reflects a business that combines operating activities with significant investment holdings. Reported earnings have shown considerable variability over time, influenced by both operating performance and non-operating income. The balance sheet, particularly the investment portfolio, represents a substantial component of the company’s overall value. As a result, any assessment of the business benefits from evaluating operating performance separately from the value of investments and other balance sheet assets.
For a different example of an asset-driven business model, you may also read Seamec Ltd Operating an Asset-Driven Offshore Services Business, a focused analysis from the offshore services sector.
Valuation – Assessing Intrinsic Value and Fair Value Through SOTP
As of January 2026, Zuari Industries trades around at a share price of ₹285–₹290, with a market capitalisation of approximately ₹850–₹875 crore and within a 52-week range of ₹212 to ₹416.
Zuari Industries is valued using a Sum-of-the-Parts framework, with the valuation of the operating business anchored in return-on-capital considerations and translated into value using a conservative EV/EBITDA multiple. This approach reflects the company’s capital-intensive structure, cyclical earnings profile, and the dominant role of balance sheet assets in determining intrinsic value. Unlike discounted cash flow models that rely on long-term cash flow projections, this analysis focuses on intrinsic value derived from balance sheet assets and historical valuation behaviour.
Operating business: ROIC as the quality filter
The core operating business comprises the Sugar, Power, and Ethanol division. While operating margins have recovered to the 5–6% range in recent years, returns on capital employed have remained modest and volatile over the cycle. Even in stronger operating years, returns have not consistently exceeded the estimated cost of capital, reflecting the regulated nature of the sugar sector, high working capital intensity, and the capital-heavy asset base.
This return profile is central to the valuation. A business that does not sustainably earn returns above its cost of capital does not merit a premium valuation, regardless of short-term margin improvement. As a result, the operating segment is valued on a through-the-cycle basis, without capitalising peak earnings or assuming structurally higher returns.
Translating ROIC into value: conservative EV/EBITDA
EV/EBITDA is used as the valuation tool for the operating business, not as a standalone metric, but as a way to express the return profile in valuation terms. Given the low and inconsistent ROIC, the multiple applied is intentionally conservative and aligned with mid-cycle valuations for integrated sugar and ethanol businesses.
Using FY25 operating profit of ₹50 crore as a normalised base and applying an EV/EBITDA multiple of 6x results in an implied enterprise value of approximately ₹300 crore for the operating business. This valuation reflects replacement-value-like economics rather than growth-driven upside and is consistent with the business’s historical return characteristics.
Strategic investments: primary source of intrinsic value
Strategic investments form the largest component of Zuari Industries’ intrinsic value. As of FY25, reported investments stood at ₹6,379 crore and include equity stakes in listed group companies and other long-term holdings. These assets generate dividend and interest income, provide liquidity support, and underpin the company’s financial flexibility.
However, as these investments are held within a holding company structure, value realisation is subject to monetisation timing, potential tax leakage, and capital allocation decisions. To reflect these structural constraints, a holding company discount is applied rather than valuing investments at face value.
Applying a 30% holding company discount to the reported investment value results in an adjusted investment valuation of approximately ₹4,465 crore.
Treatment of non-core businesses
The real estate and service businesses operate under asset-light models and contribute modestly to consolidated profitability. Given the absence of stable, separable earnings disclosures and the variability in revenue recognition, no standalone valuation is assigned to these segments. Any optionality from these businesses is implicitly captured within the holding company discount applied to the investment portfolio.
Net debt adjustment
As of FY25, consolidated borrowings stood at ₹2,568 crore. No assumptions are made regarding accelerated deleveraging or asset sales beyond disclosed plans. Borrowings are therefore deducted at face value for valuation purposes.
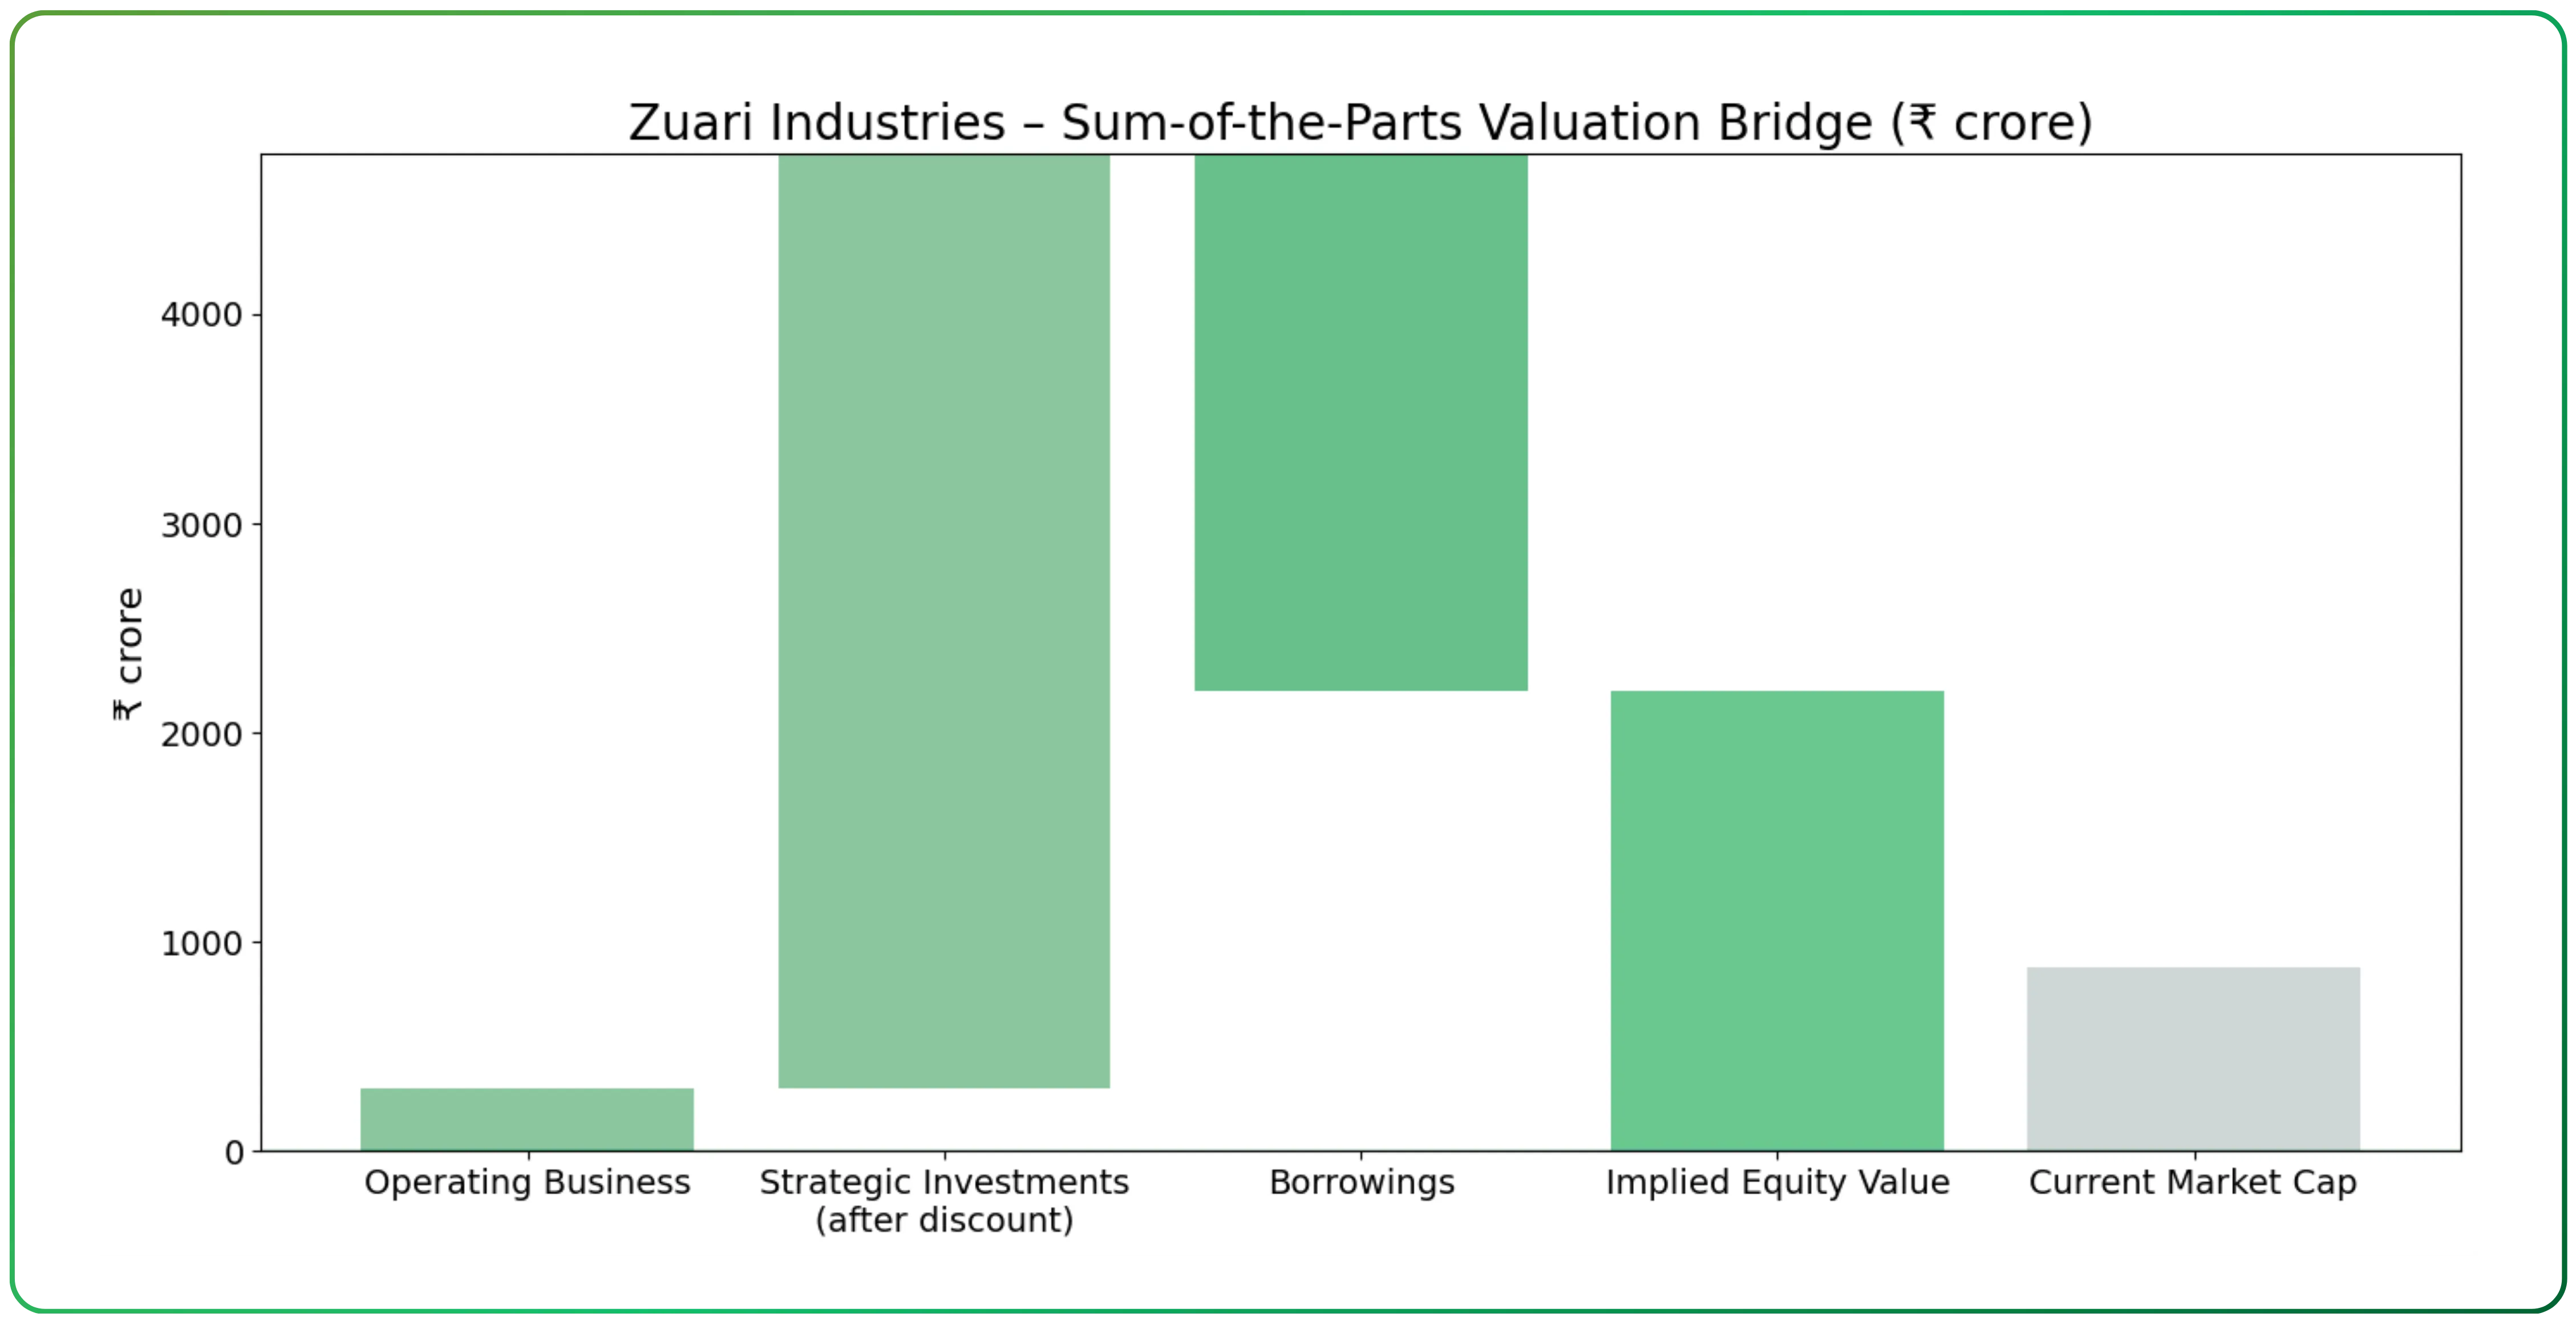
SOTP summary (₹ crore)
Operating business value: ₹300 crore
Adjusted value of strategic investments: ₹4,465 crore (30% discounted value)
Gross asset value: ₹4,765 crore
Less: borrowings: ₹2,568 crore
Implied equity value: ₹2,200 crore
Based on an outstanding share count of approximately 3.0 crore shares, this corresponds to an implied value of ₹730 per share.
→ Value being added
Operating Business
Strategic Investments (after discount)
→ Value being deducted
- Borrowings
→ Resulting value
- Implied Equity Value
→ Market reference
- Current Market Capitalisation
Valuation Perspective
For context, Zuari Industries currently trades at a share price of approximately ₹290, implying a market capitalisation of about ₹875 crore. This is materially lower than the estimated Sum-of-the-Parts equity value of ₹2,200 crore derived in this analysis. The gap reflects the market’s assessment of low operating returns, elevated leverage, and uncertainty around the timing and manner of value realisation from strategic investments.
Zuari Industries trades at a significant discount to its estimated Sum-of-the-Parts value, reflecting the market’s assessment of low operating returns, earnings volatility, and uncertainty around the timing of value realisation from investments. The valuation is supported primarily by balance sheet assets rather than operating cash flow visibility.
Sustained improvement in returns on capital, visible deleveraging, or clearer pathways to monetising investment holdings would be necessary for a meaningful narrowing of this discount. In the absence of these developments, the holding company structure and return profile are likely to continue to constrain valuation.
Related read: You may also explore ABS Marine Services Anchoring Growth with Long-Term Offshore Contracts, a focused analysis of a contract-driven offshore services business.
What Creates Value? Key Levers
Value creation at Zuari Industries is driven by operational efficiency, financial optimisation, and selective balance sheet actions. In the near term, operating performance can improve through higher ethanol contribution, better capacity utilisation, and incremental margin expansion. Ethanol blending targets support volume visibility, while grain-based capacity reduces exposure to sugar cyclicality. Operating margins, currently in the mid-single digits, leave room for improvement through higher utilisation, improved sugar recovery, and lower power and fuel costs. Power cogeneration provides additional upside as surplus capacity remains underutilised and improved contracting structures could enhance realisations.
Financial levers offer more immediate impact. Continued refinancing of borrowings and disciplined liability management can lower interest costs, while tighter working capital control in the sugar business, particularly through inventory monetisation during favourable price cycles and improved receivables management, can release liquidity and strengthen cash flows.
Over the longer term, strategic actions around the investment portfolio and real estate assets have the potential to materially reshape the balance sheet. Partial monetisation of investments could accelerate deleveraging, while structural simplification may help reduce the holding company discount. Legacy land assets, not reflected in the current valuation, represent additional optionality given the company’s asset-light operating approach.
Competitive Advantages and Strategic Positioning
Zuari Industries’ positioning is shaped less by operating scale and more by structure, asset ownership, and capital allocation flexibility. The company functions as a hybrid of an operating business and a holding company, and its strengths need to be assessed accordingly.
In the Sugar, Power, and Ethanol division, forward integration reduces exposure to sugar cyclicality, with ethanol and cogeneration providing more stable revenue streams. Improved utilisation and operating efficiency have strengthened this business, though it remains subject to regulatory and commodity risks.
The real estate business follows an asset-light development management model, enabling participation in large projects with limited capital deployment. This approach reduces balance sheet risk but also constrains operating leverage.
A key strength lies in the strategic investment portfolio, which contributes dividend and interest income and enhances liquidity and refinancing flexibility. These assets provide financial resilience, particularly during periods of stress.
In addition, the company’s ability to refinance high-cost debt has supported lower borrowing costs over time, reflecting balance sheet quality and lender confidence. Association with the Adventz Group further supports execution and capital allocation.
These strengths improve resilience but do not ensure predictable earnings, with profitability remaining sensitive to policy, cycles, and monetisation timing.
Investment Risks and Capital Structure Sensitivities
Zuari Industries is exposed to regulatory risk across sugar and ethanol, where government intervention through stock limits, export controls, ethanol pricing, or higher cane prices can materially affect margins and cash flows. While ethanol diversification reduces dependence on sugar, policy risk remains inherent to the business model.
Leverage represents a second key risk. Elevated debt levels mean weaker-than-expected operating cash flows could constrain refinancing flexibility and increase reliance on asset monetisation. In adverse conditions, this could lead to value-destructive outcomes. As a holding company, there is also the risk of value being trapped within the investment portfolio, with dividend flows, monetisation, and capital allocation outcomes dependent on management decisions rather than operating performance alone.
Industry cyclicality remains relevant, particularly in sugar, where a global surplus or demand shock could reverse recent improvements. Ethanol expansion carries execution risk related to feedstock costs, utilisation ramp-up, and competitive intensity, while real estate income remains lumpy and project-dependent.
Finally, governance and ESG considerations warrant monitoring, including capital allocation discipline, related-party transactions, and environmental scrutiny of sugar and power operations, all of which can influence long-term value realisation. Low returns on capital employed and elevated leverage continue to constrain valuation and increase sensitivity to policy and operating cycles.
Business Outlook and Perspective
Zuari Industries is positioned as a diversified, asset-backed business with a clear focus on improving operating stability and strengthening its balance sheet. Management’s priorities centre on disciplined execution within the Sugar, Power, and Ethanol division, where higher ethanol contribution, better utilisation, and ongoing operational initiatives are expected to support resilience despite the inherent cyclicality of sugar.
The commissioning of the grain-based ethanol facility marks an important medium-term development aligned with national blending objectives, while the real estate business continues to follow a capital-light development management approach with selective monetisation opportunities. Subsidiary and service businesses are expected to contribute steady, low-capital-intensity income, supporting the consolidated profile.
Overall, the company’s strategy emphasises financial prudence, gradual deleveraging, and measured value creation. Outcomes are likely to be progressive rather than linear, shaped by operating execution, policy developments, and the pace of balance sheet optimisation. From a long-term investment perspective, sustained revenue growth will depend on operating discipline, balance sheet optimisation, and the pace of value realisation from strategic assets.
Turn research into action — trade smarter on CubePlus.
Disclaimer: The information provided in our blogs is for informational purposes only and should not be construed as financial, investment, or trading advice. Trading and investing in the securities market carries risk. Always conduct your own research and consult with a qualified financial advisor before making any investment decisions. Past performance is not indicative of future results. Copyrighted and original content for your trading and investing needs.
© 2026 — Tradejini. All Rights Reserved.