Before you buy or sell an option, it helps to know whether options are cheap or expensive right now. IV and IVP charts answer that question.
As of 9 October 2026, both Nifty and Power Grid show the same picture: option premiums have moved from cheap to fairly expensive over the last few weeks, while the underlying prices have been falling. For a trader, that shifts the edge away from buying options and towards selling them, with a hedge.
This article explains how to read these charts, walks through both examples, and shows where to find them on NxtOption.
How to read the chart
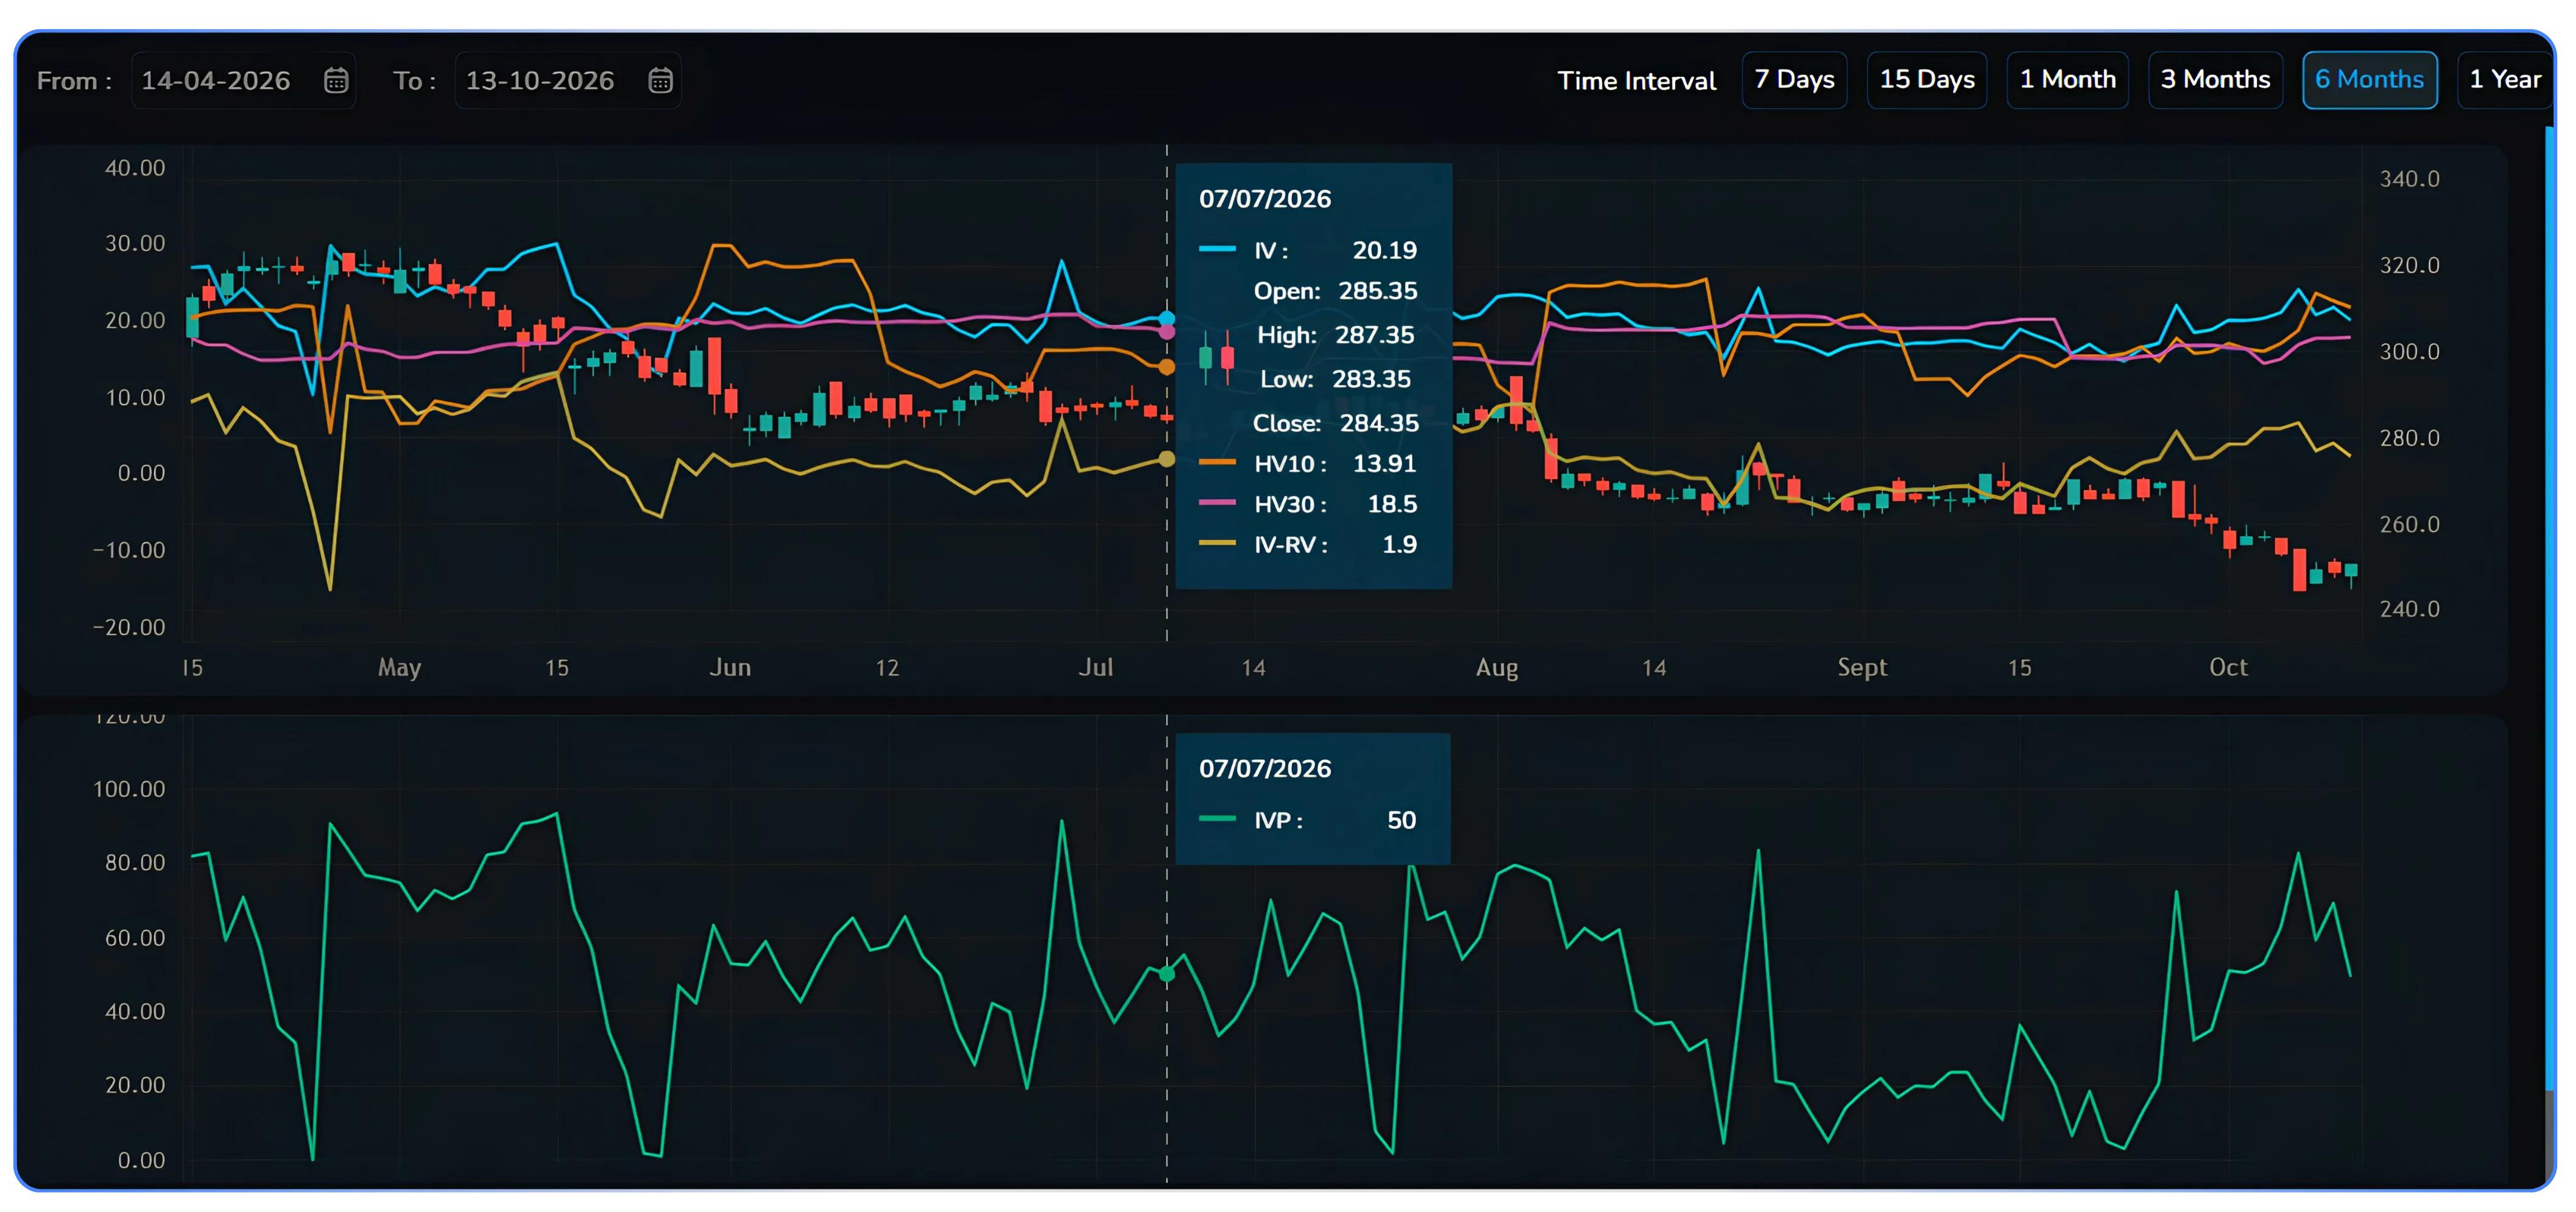
The IV chart puts five pieces of information on one screen. The candles show the price (right-hand axis); the lines show volatility in % (left-hand axis).
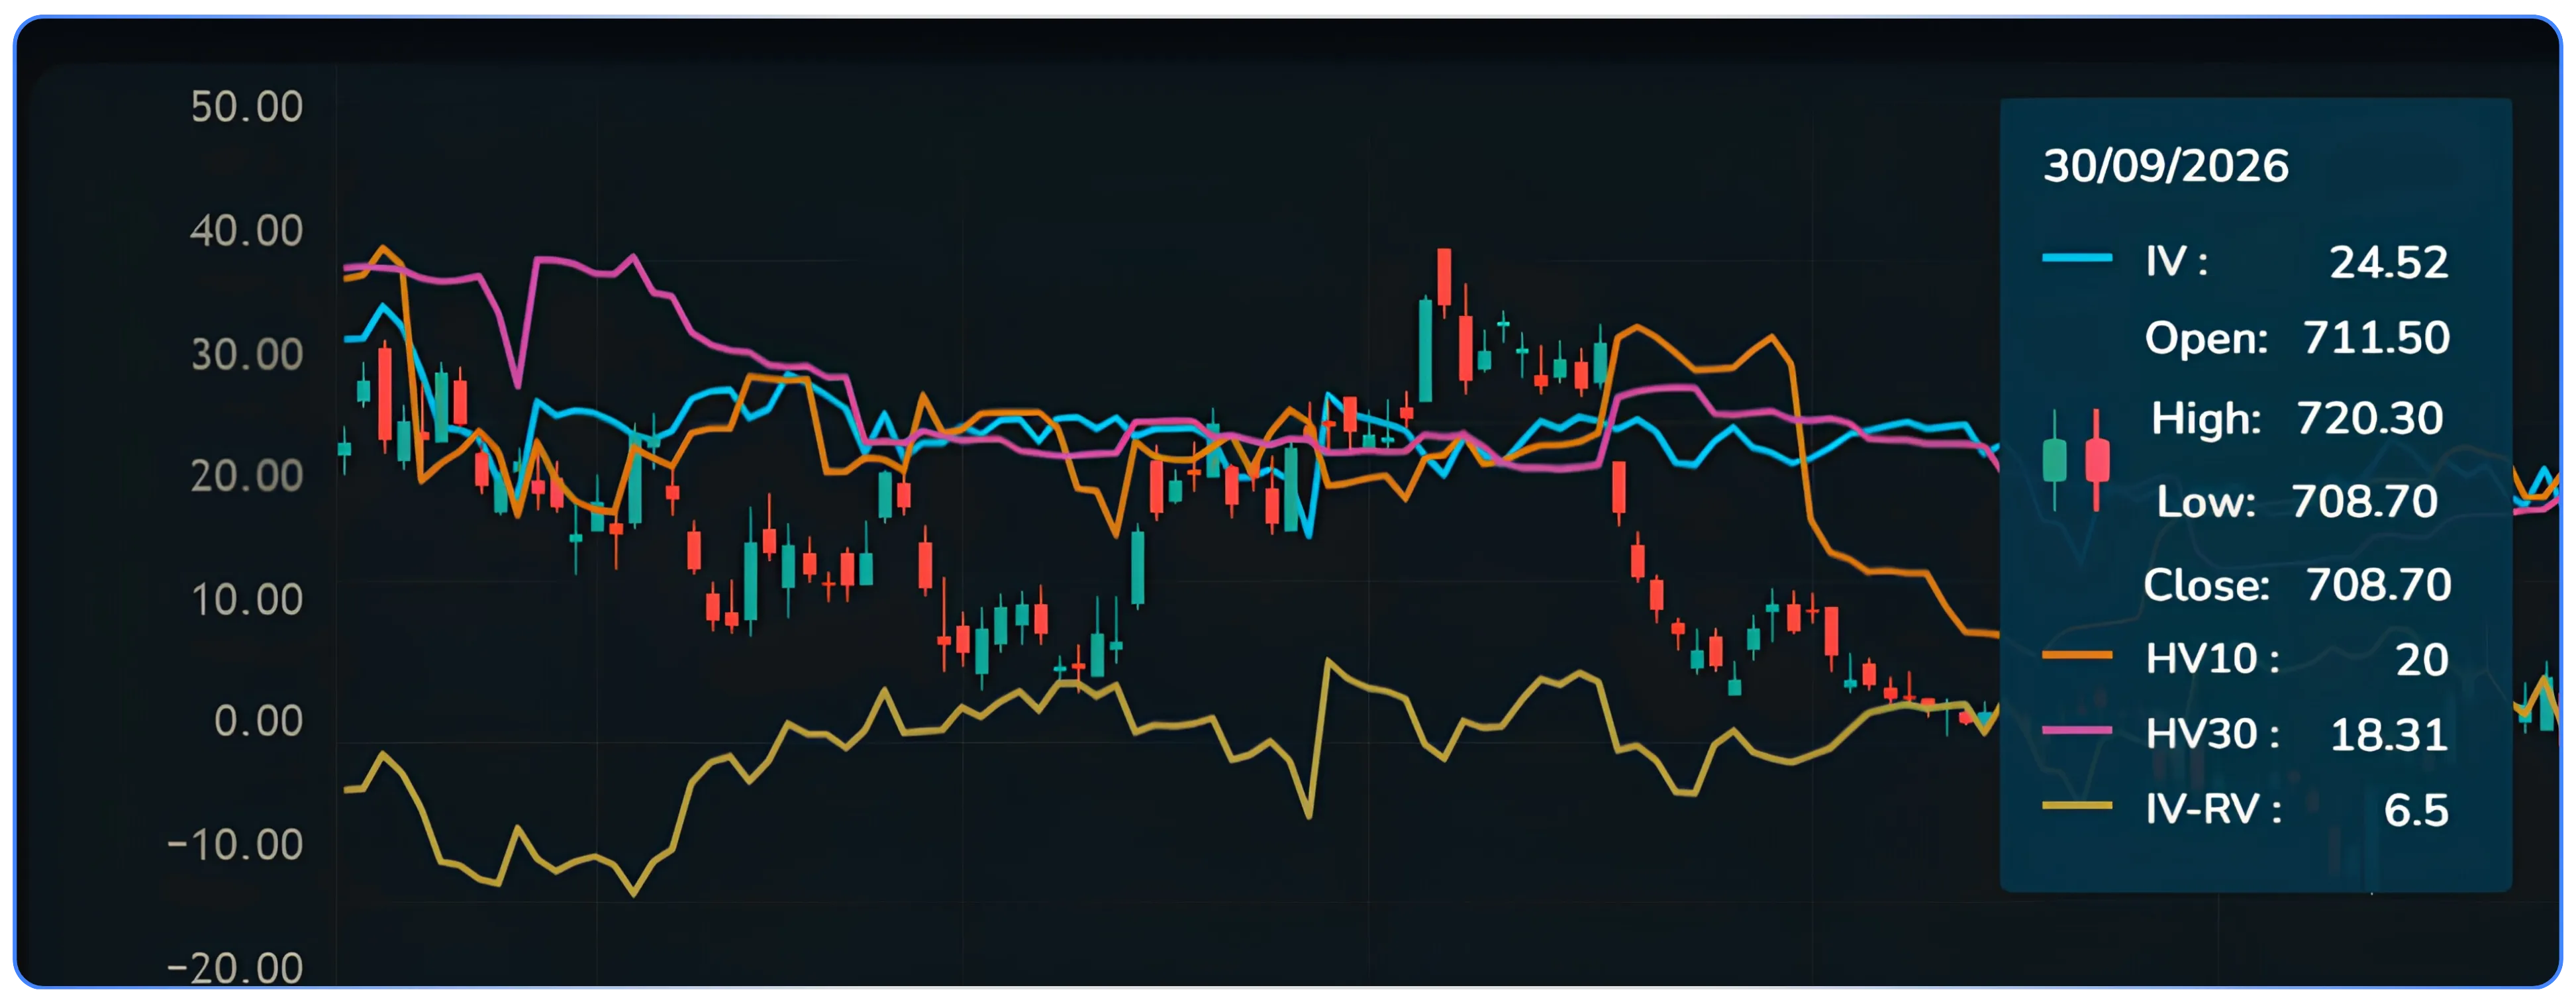
| Line | What it is | In plain words |
|---|---|---|
| IV (blue) | Implied volatility | The movement the option market is pricing in. Higher IV means costlier premiums. |
| HV10 (orange) | 10-day historical volatility | How much the price actually moved over the last 10 trading days. |
| HV30 (pink) | 30-day historical volatility | How much the price actually moved over the last 30 trading days. |
| IV-RV (olive) | Implied minus realised volatility | Positive: options are priced above actual movement. Negative: options are priced below it. |
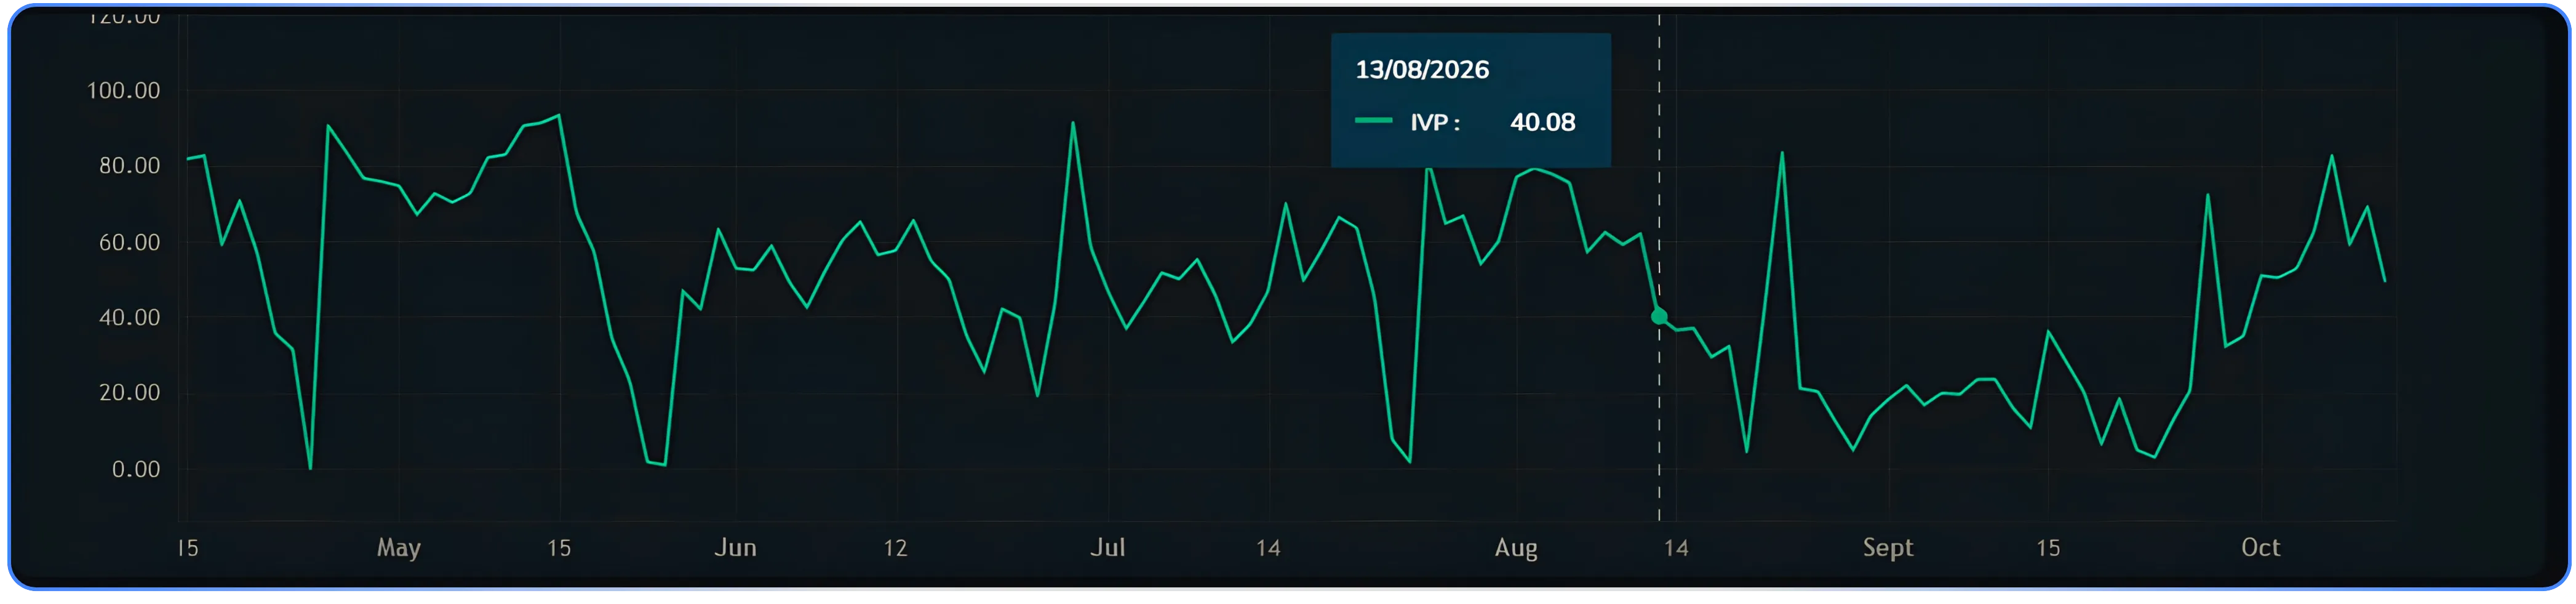
IVP ( green, lower panel) : IV percentile shows the share of days in the past year when IV was lower than today. An IVP of 70 means IV was lower on 70% of days.
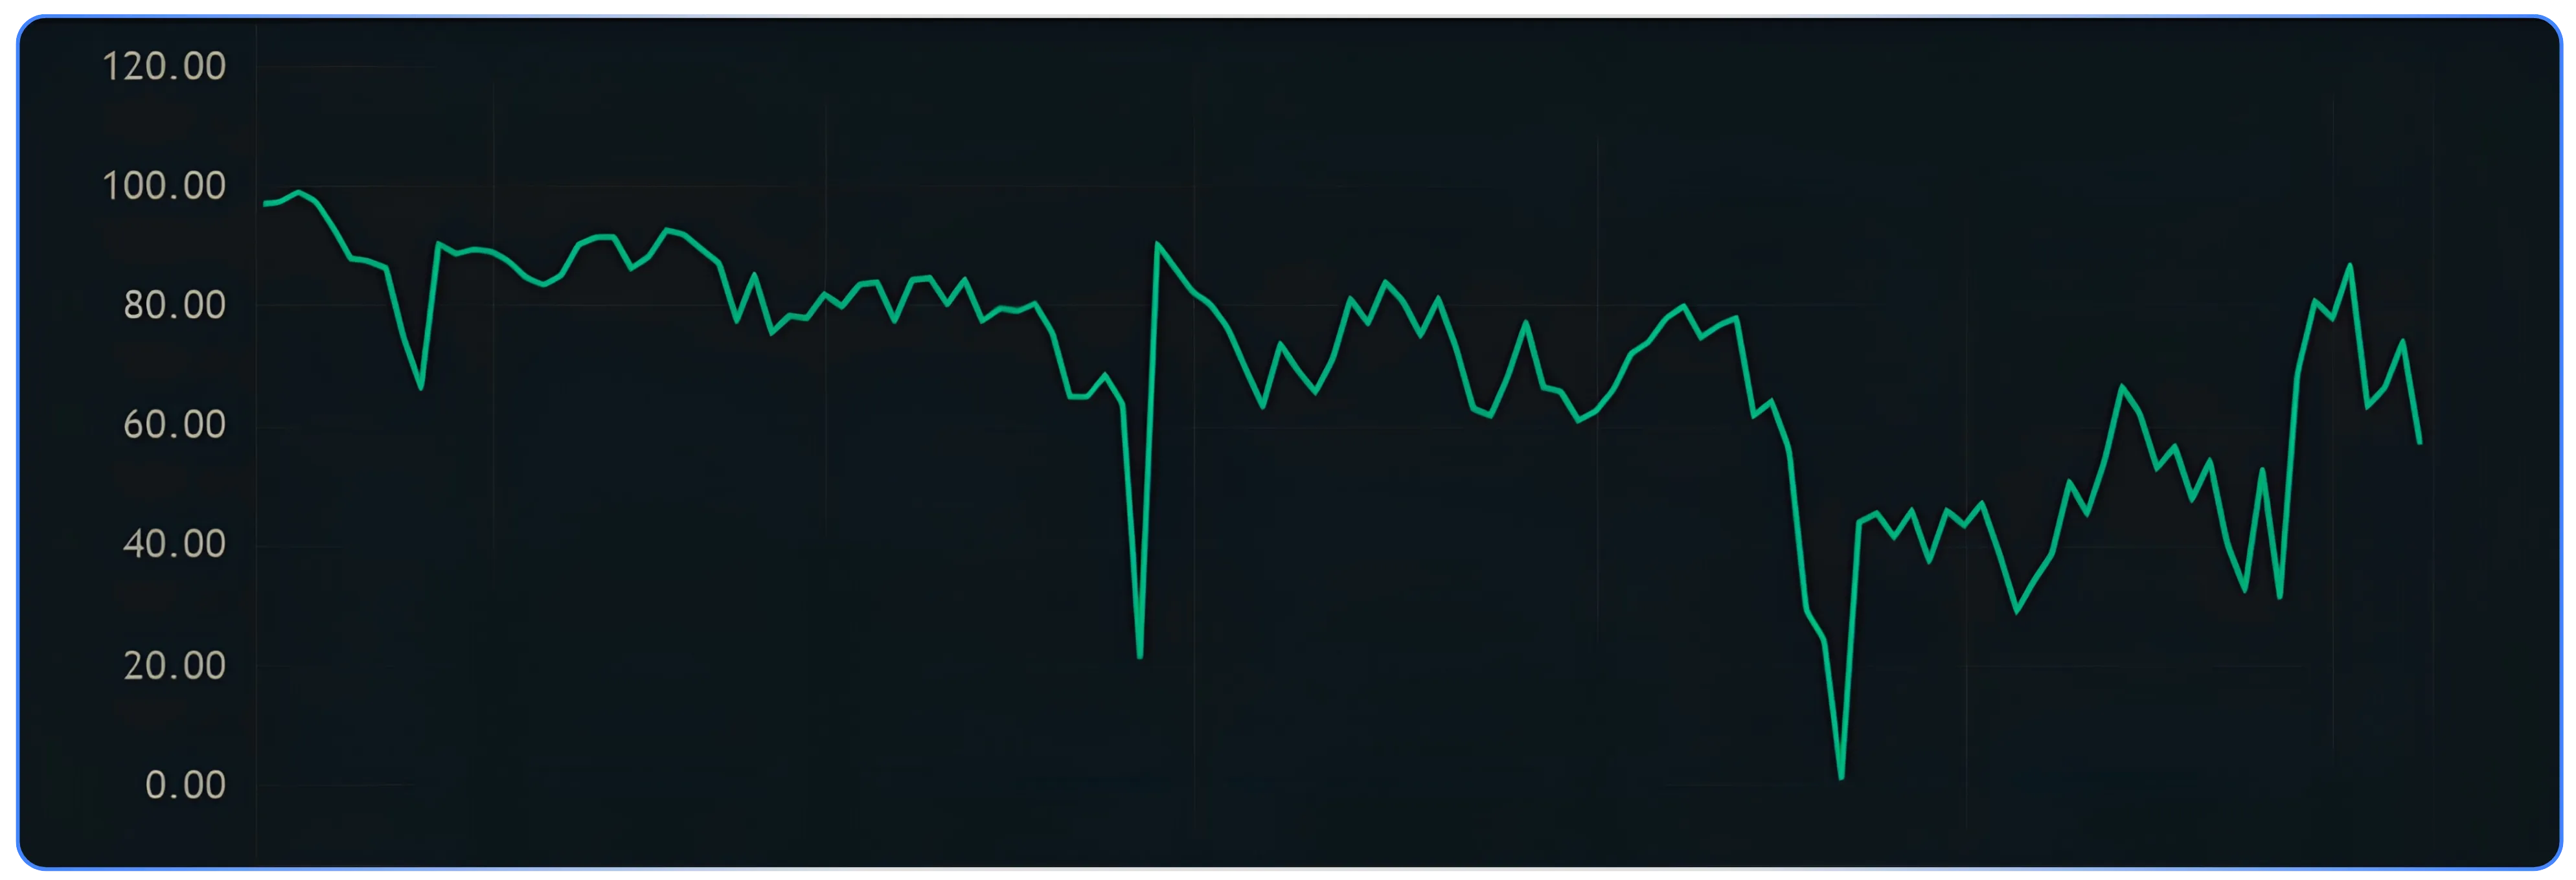
Two questions sum up the chart:
1. Is IV high or low compared with its own past? IVP answers this.
2. Is IV high or low compared with how much the price is actually moving? IV versus HV, and the IV-RV line, answer this.
When both say "high", option premiums are rich. When both say "low", they are cheap.
Example 1: Nifty
Nifty options are moderately expensive by their own one-year history (IVP 67), but not expensive compared with how fast Nifty has moved in the last two weeks.
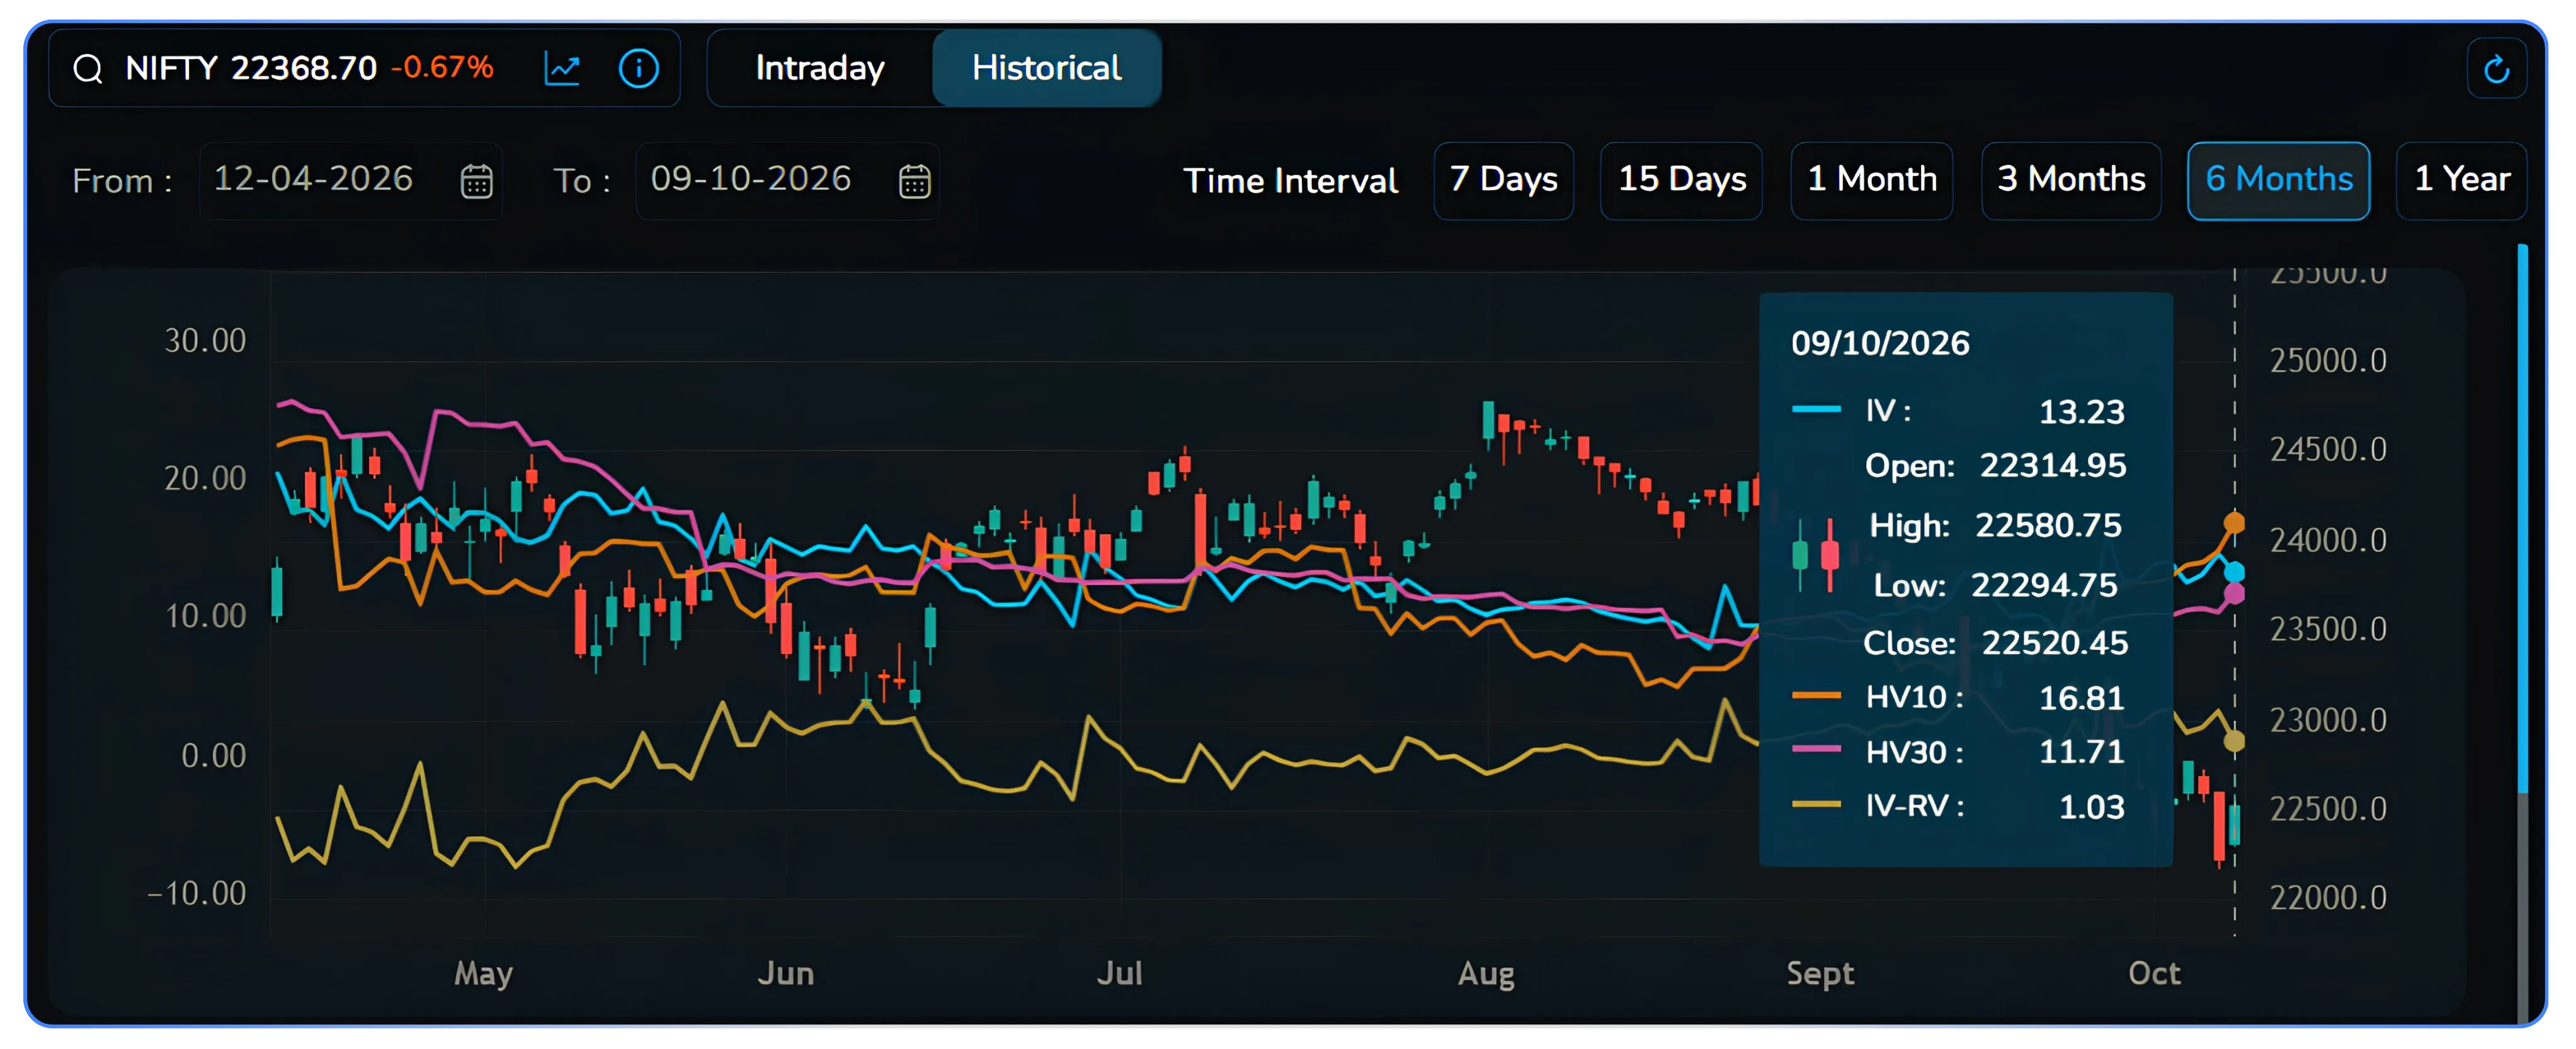
Readings on 9 October 2026 (close 22,520.45):
| Measure | Value | What it says |
|---|---|---|
| IV | 13.23% | What the market is pricing in |
| HV10 | 16.81% | Last 10 days moved more than IV implies |
| HV30 | 11.71% | Last 30 days moved less than IV implies |
| IV-RV | 1.03 | Options priced slightly above realised movement |
The price story: Nifty peaked near 24,500 in early August and has slid to around 22,300–22,500. The decline sped up in October, which is why the 10-day HV jumped above IV.
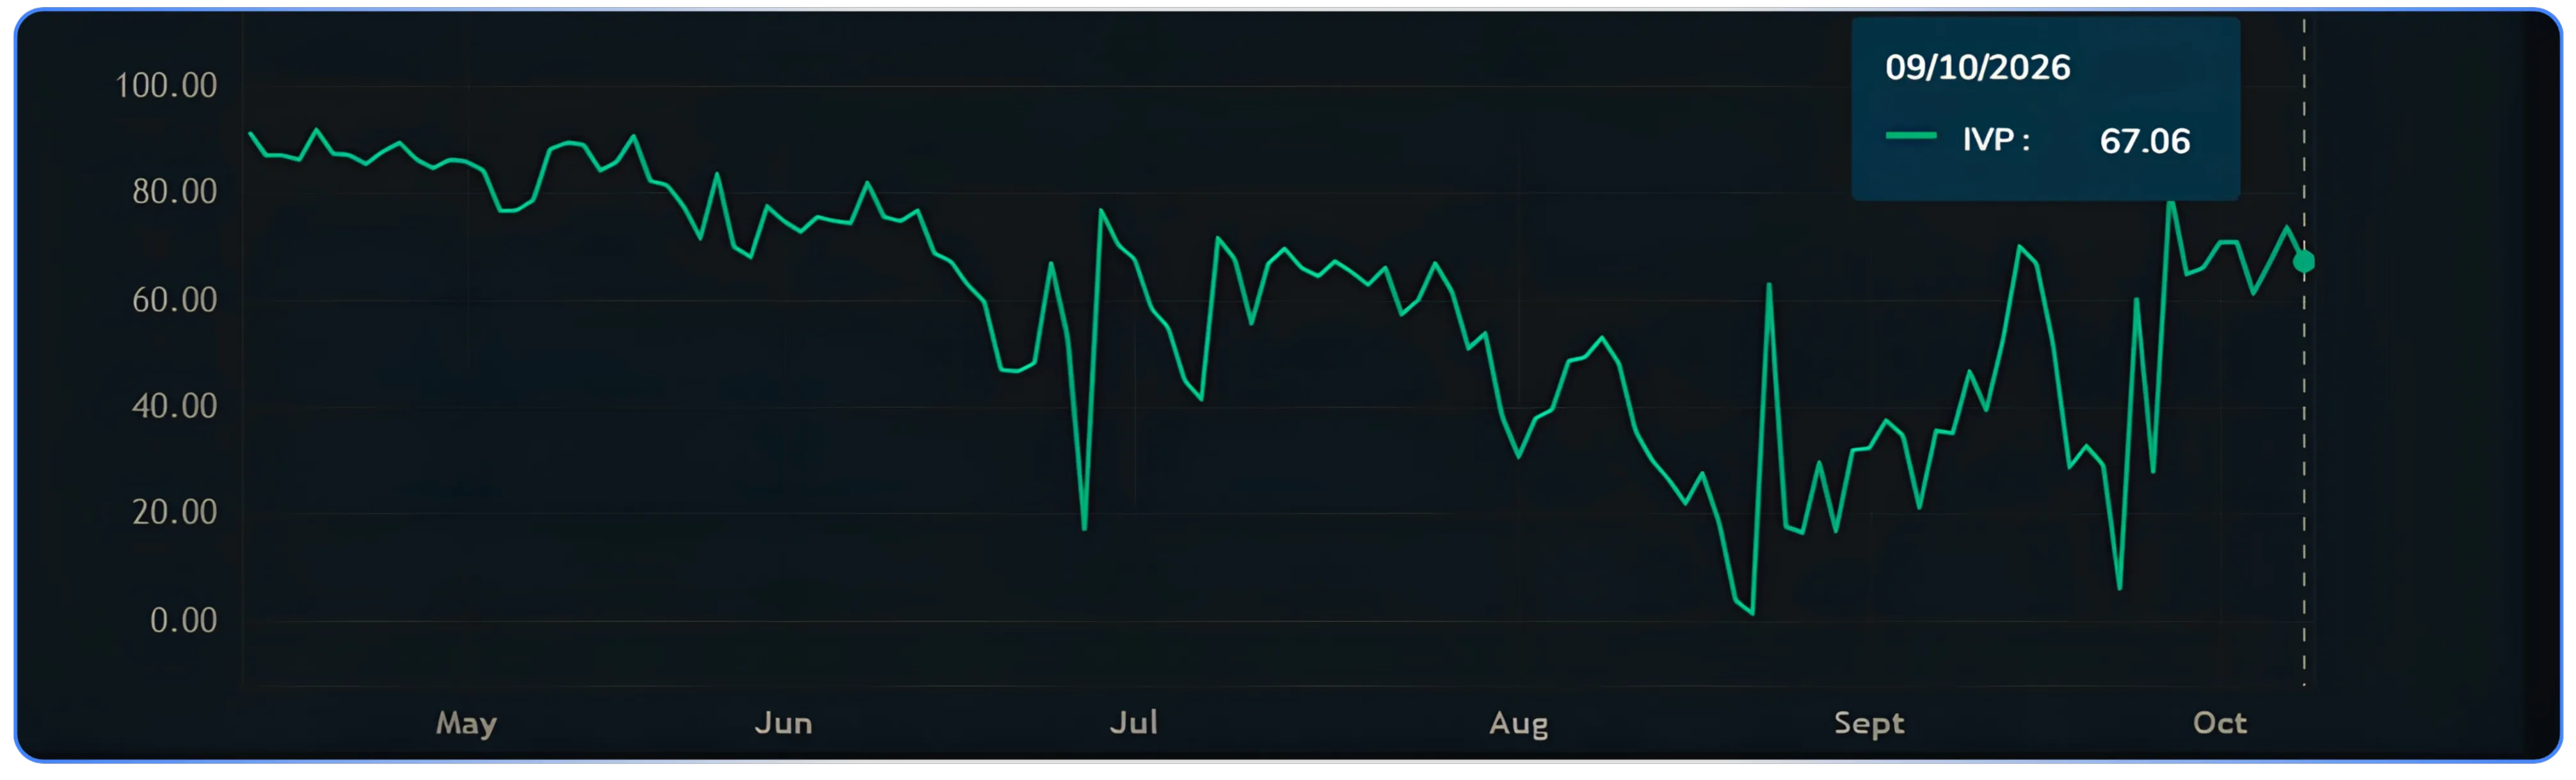
The IVP story: IVP sat at 80–90 in April and May, when options were expensive. It fell close to zero in late August, when options were very cheap. It has since climbed back to the 60–80 range, standing at 67.06 on 9 October.
What a trader takes away:
- Late August was the cheap window for buying options; that window has closed.
- Premiums are now rich enough to make selling attractive, but HV10 above IV warns that recent moves are larger than the market is pricing. Naked selling is risky here; defined-risk spreads are safer.
- If the fall continues, IV can rise further. Sellers should size small and keep stop-losses.
Example 2: Power Grid
Power Grid options are also on the expensive side (IVP around 60), but a single stock's volatility jumps around far more than an index's, so its signals need more care.
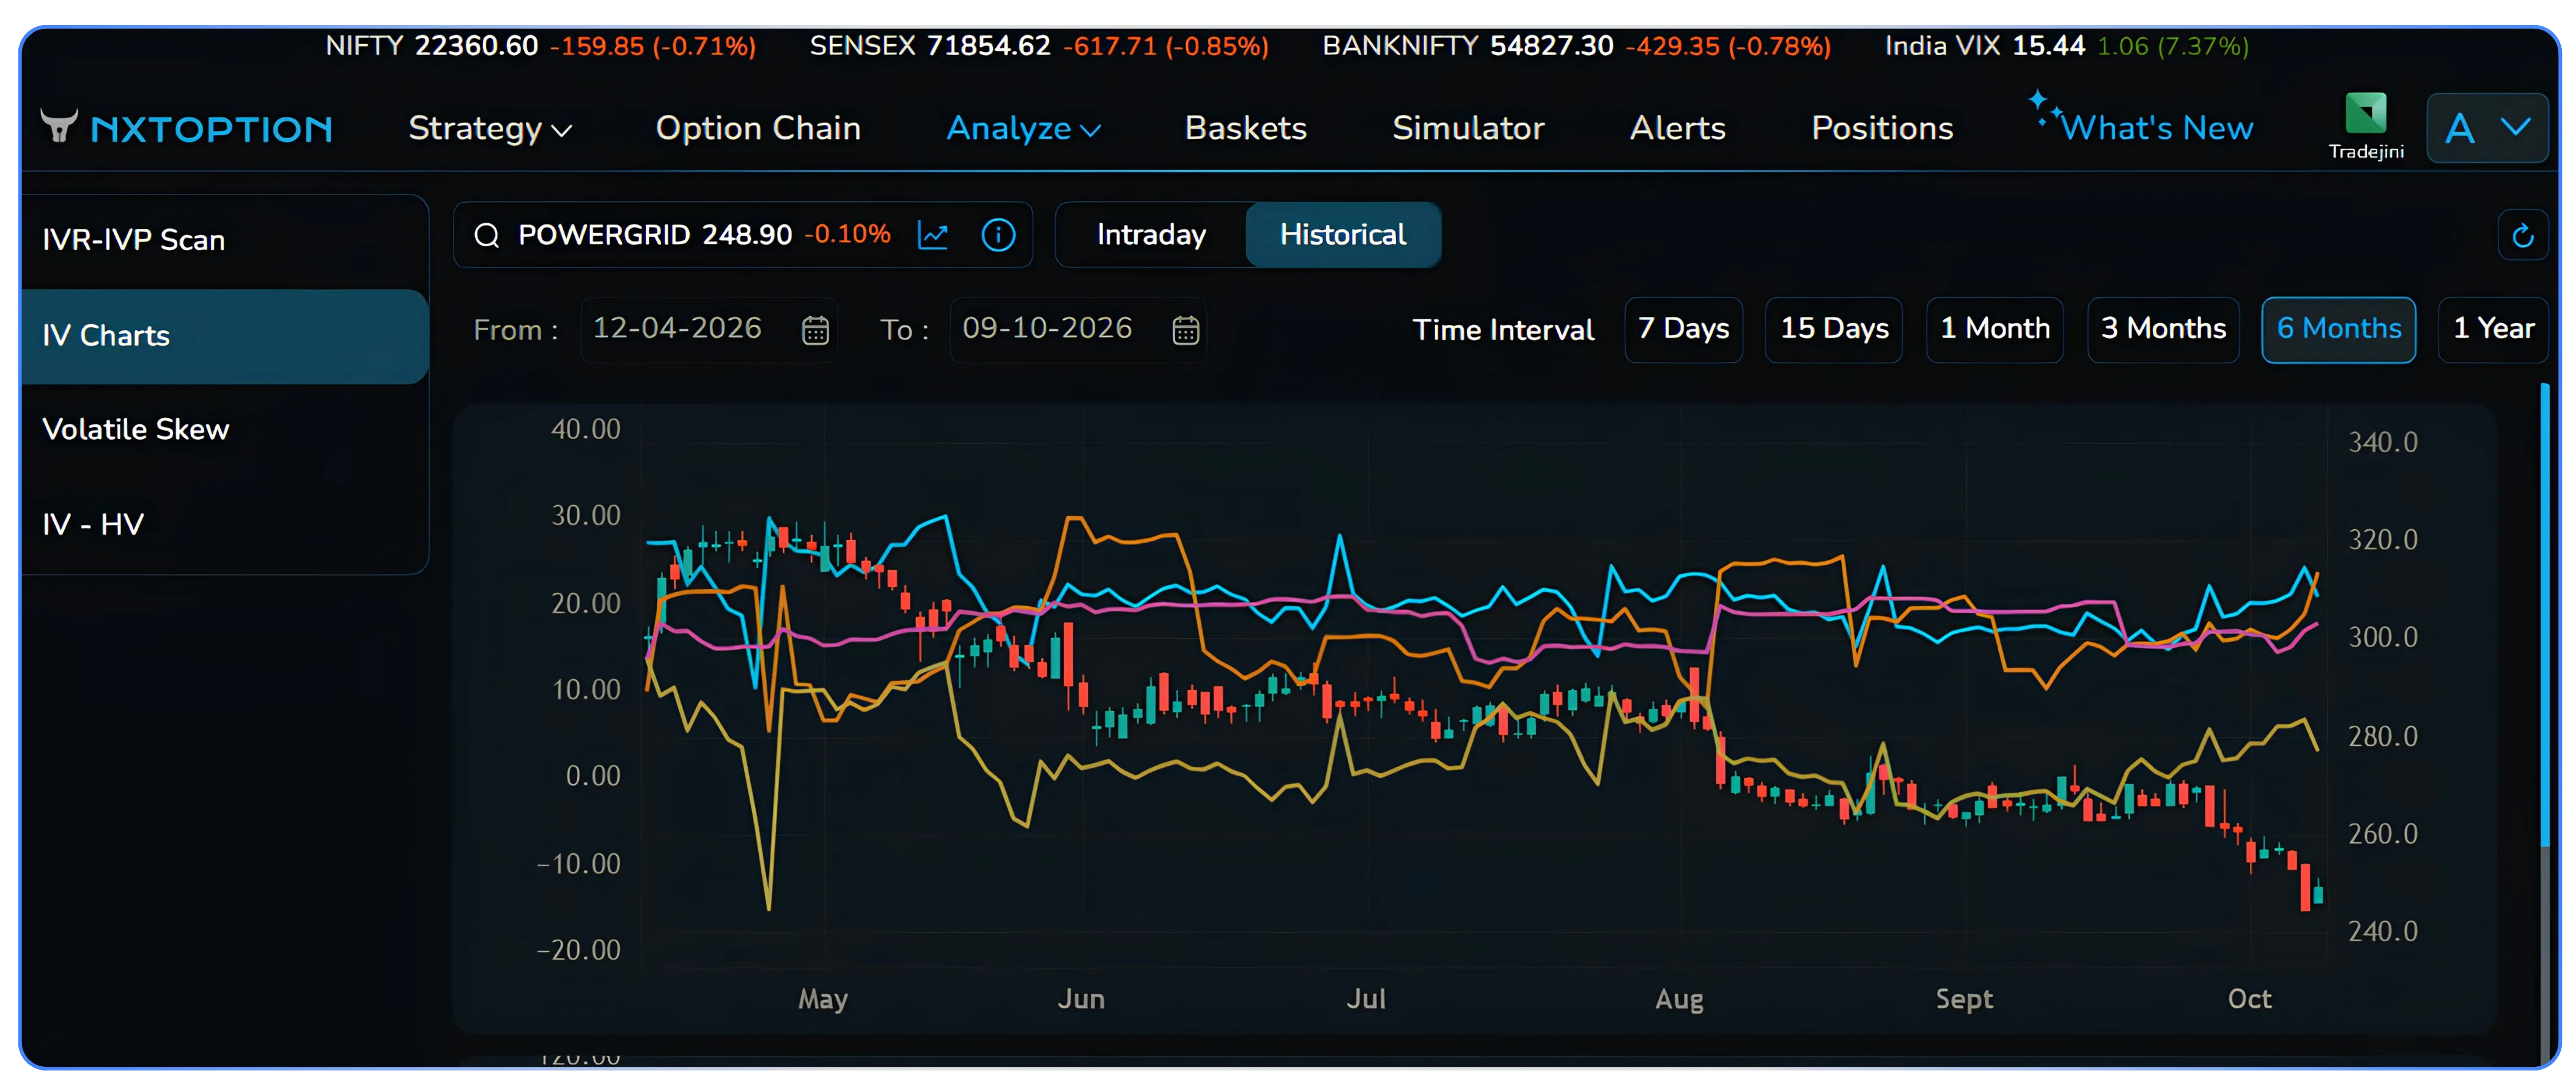
The price story: Power Grid has drifted from about ₹320 in late April to ₹248.90 now. There was a sharp gap down in early August, from about ₹300 to ₹265, and a further fall in October.
The volatility story (values read off the chart, so approximate):
- IV has mostly stayed between 20% and 27%, and is rising again in October, near 25%.
- HV30 has been steady around 20%. HV10 has spiked to about 30% twice, in June and August, on sharp price moves.
- IV-RV dropped to about -15 in late April, when the stock moved far more than options had priced. Most of the time since, it has stayed between 0 and +10, and is now mildly positive.
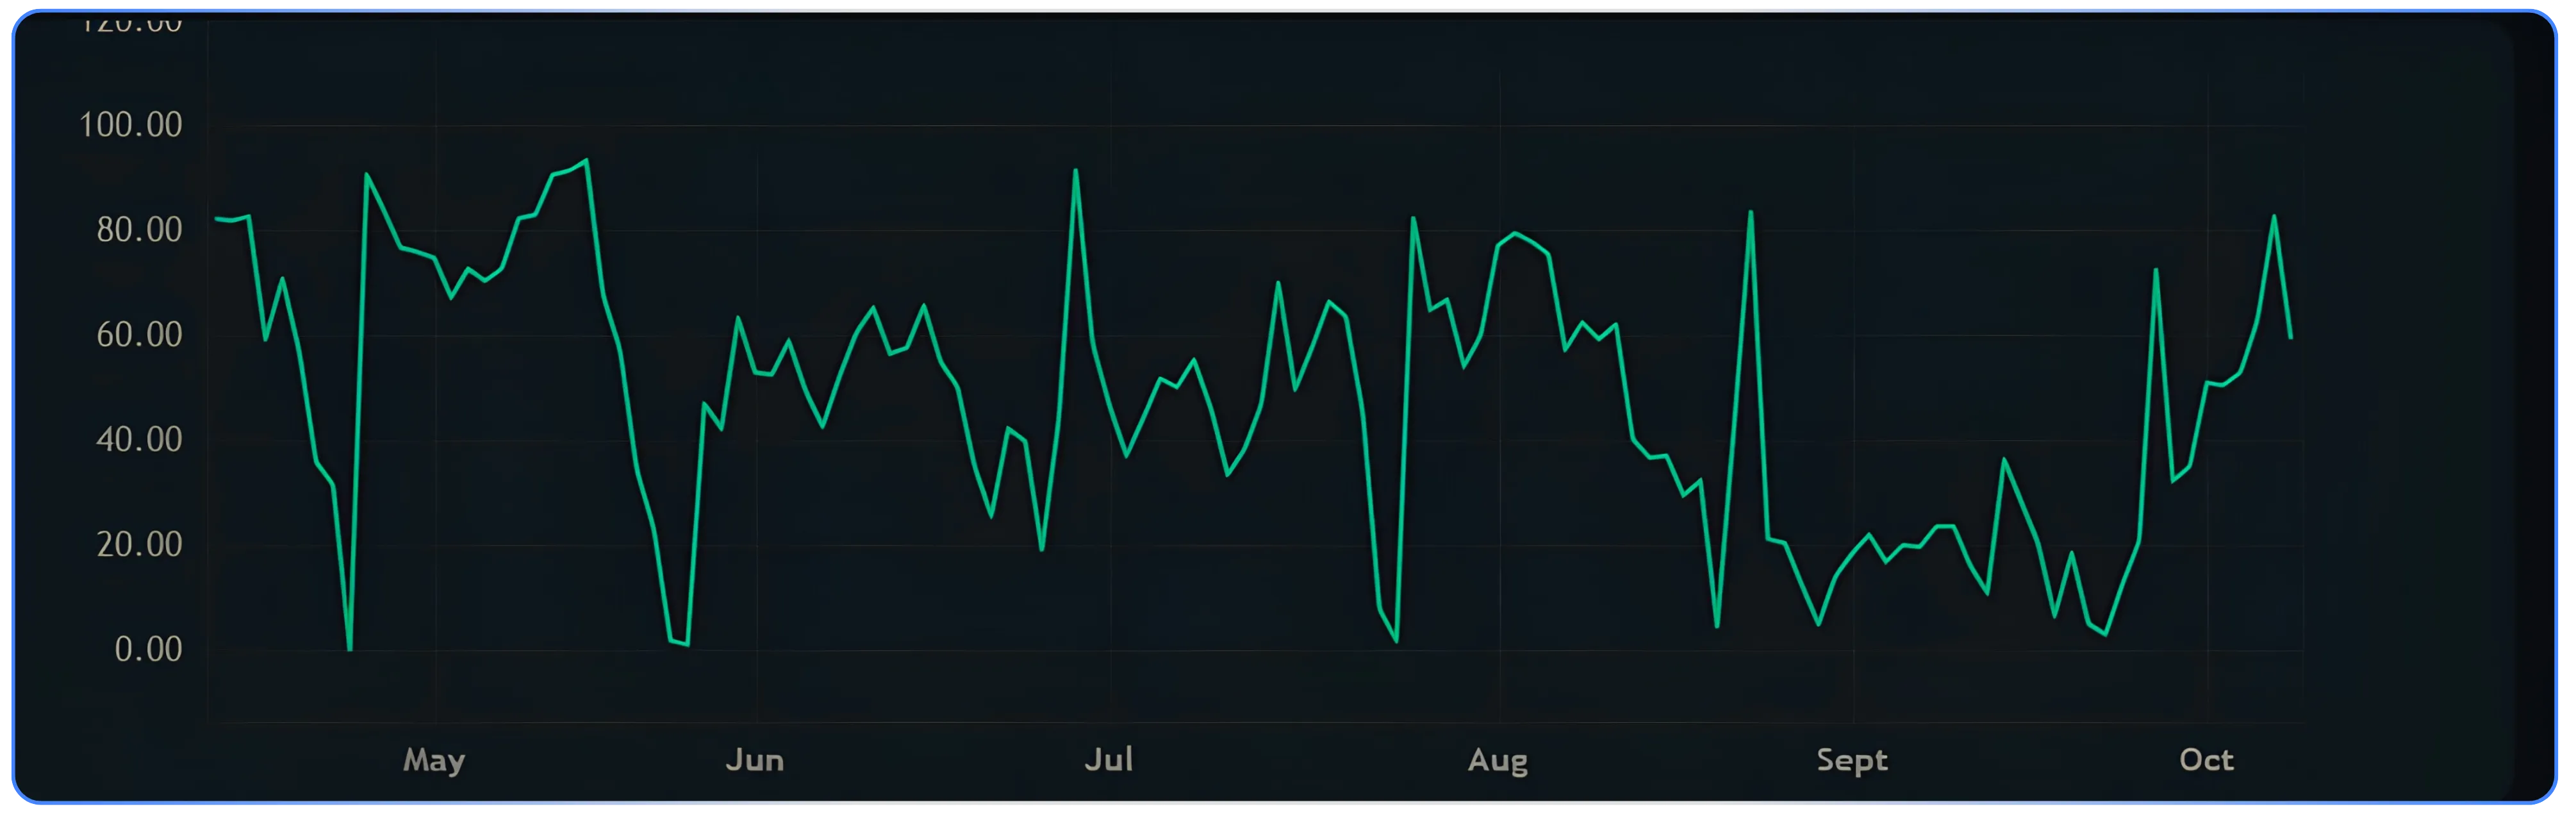
The IVP story: Power Grid's IVP has swung between near 0 and above 80 several times in six months. Stock IV often rises before quarterly results and collapses after them, which produces these swings. It reached about 83 in early October before easing to about 60.
What a trader takes away:
- With IVP high and IV slightly above realised volatility, selling premium has a mild edge, but less than the IVP alone suggests.
- Check the results date. If results are near, high IV is expected and will usually drop after the announcement. Selling into that drop is a common strategy; buying options just before results often loses money even when the direction is right.
- The trend is down. A seller might prefer bearish call spreads to neutral strategies.
How traders can use this
The simplest rule: buy options when they are cheap, sell them when they are expensive, and use IVP plus IV-RV to judge which is which.
| Situation | What it means | Strategies that tend to suit |
|---|---|---|
| IVP above 70, IV above HV (IV-RV positive) | Premiums are rich on both measures | Option selling with defined risk: credit spreads, iron condors, covered calls |
| IVP above 70, IV below HV10 | Premiums are high, but the price is moving even faster | Cautious selling with wider strikes, smaller size; or stay out |
| IVP below 30, IV below HV | Premiums are cheap on both measures | Option buying: long calls or puts, debit spreads, long straddles before expected moves |
| IVP below 30, IV above HV | Cheap by history, but still above actual movement | Calendar spreads (buy the next month, sell the near month) |
| IVP 30–70 | No strong volatility edge | Trade on your price view; use spreads to keep cost and risk balanced |
Things to keep in mind:
- High IV can go higher. In a falling market, IV often keeps rising. Selling just because IVP is high, without a stop-loss, is how sellers take large losses. - Events drive stock IV. Results, dividends and policy news push IV up beforehand and down afterwards. Always check the calendar. - Use the right time frame. The 6-month view shows the regime; the 7-day and 15-day views help with entry timing. - Volatility is one input. Combine it with your view on price direction, support and resistance, and position size.
Also Read: Understanding the Option Chain like a Writer
Finding these charts on NxtOption
The IV and IVP charts are under Analyze → IV Charts on NxtOption.
- Log in to NxtOption with your Tradejini account.
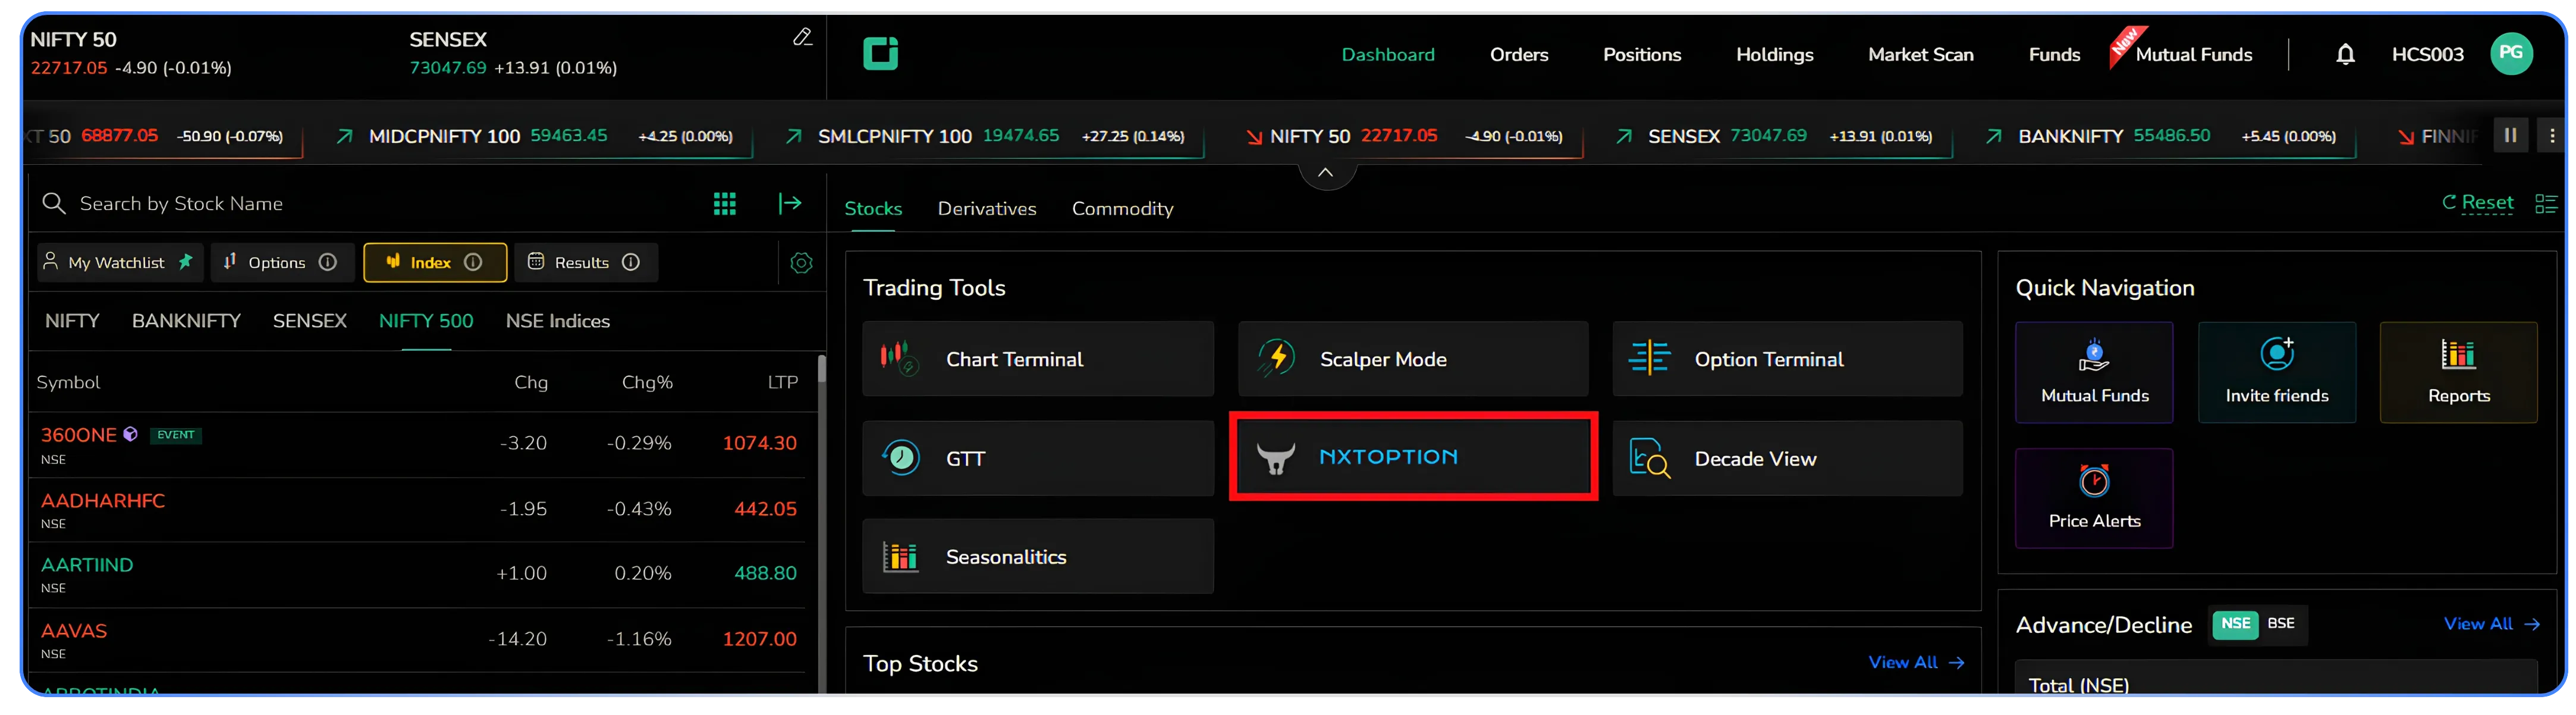
- In the top menu bar, click Analyze.

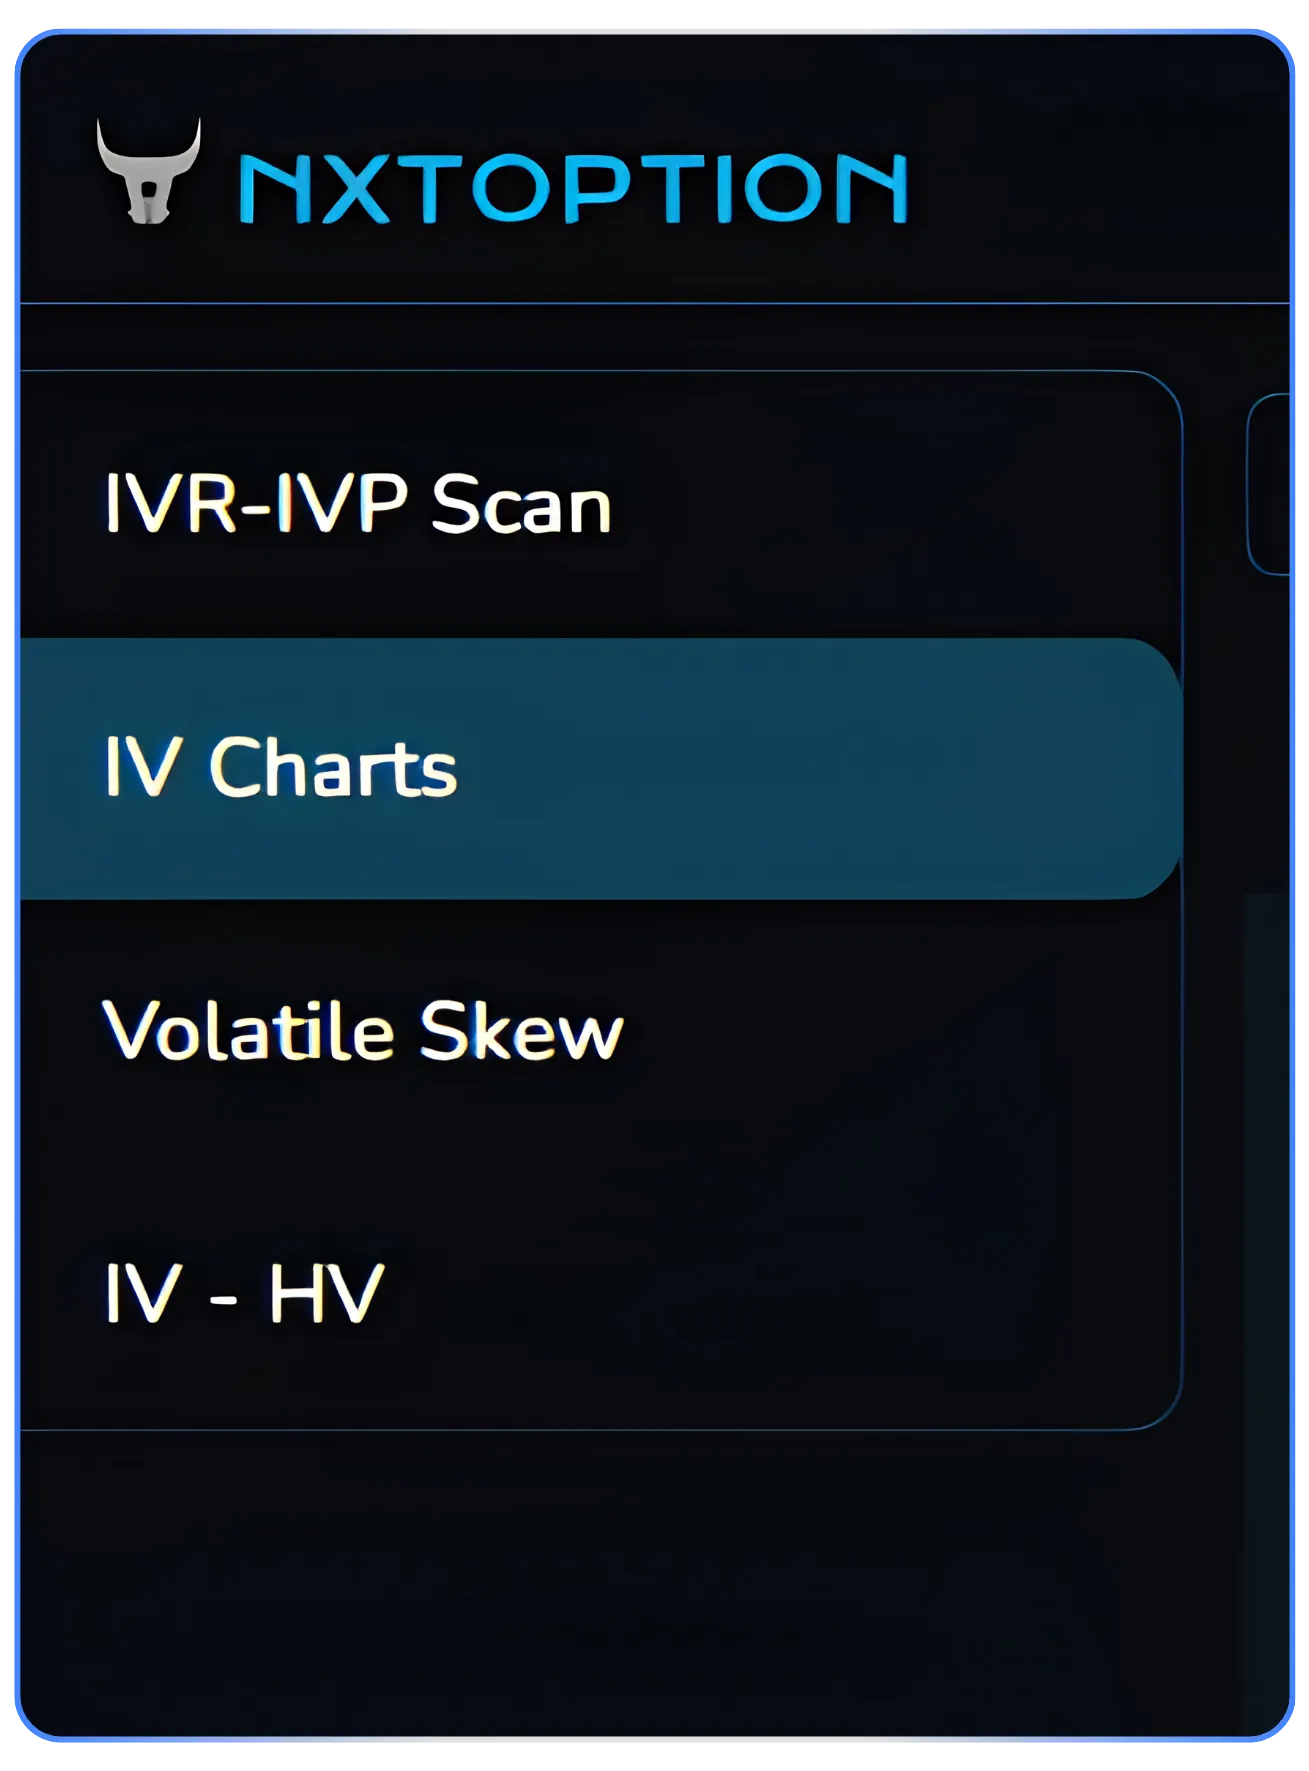
- In the left panel, click IV Charts.
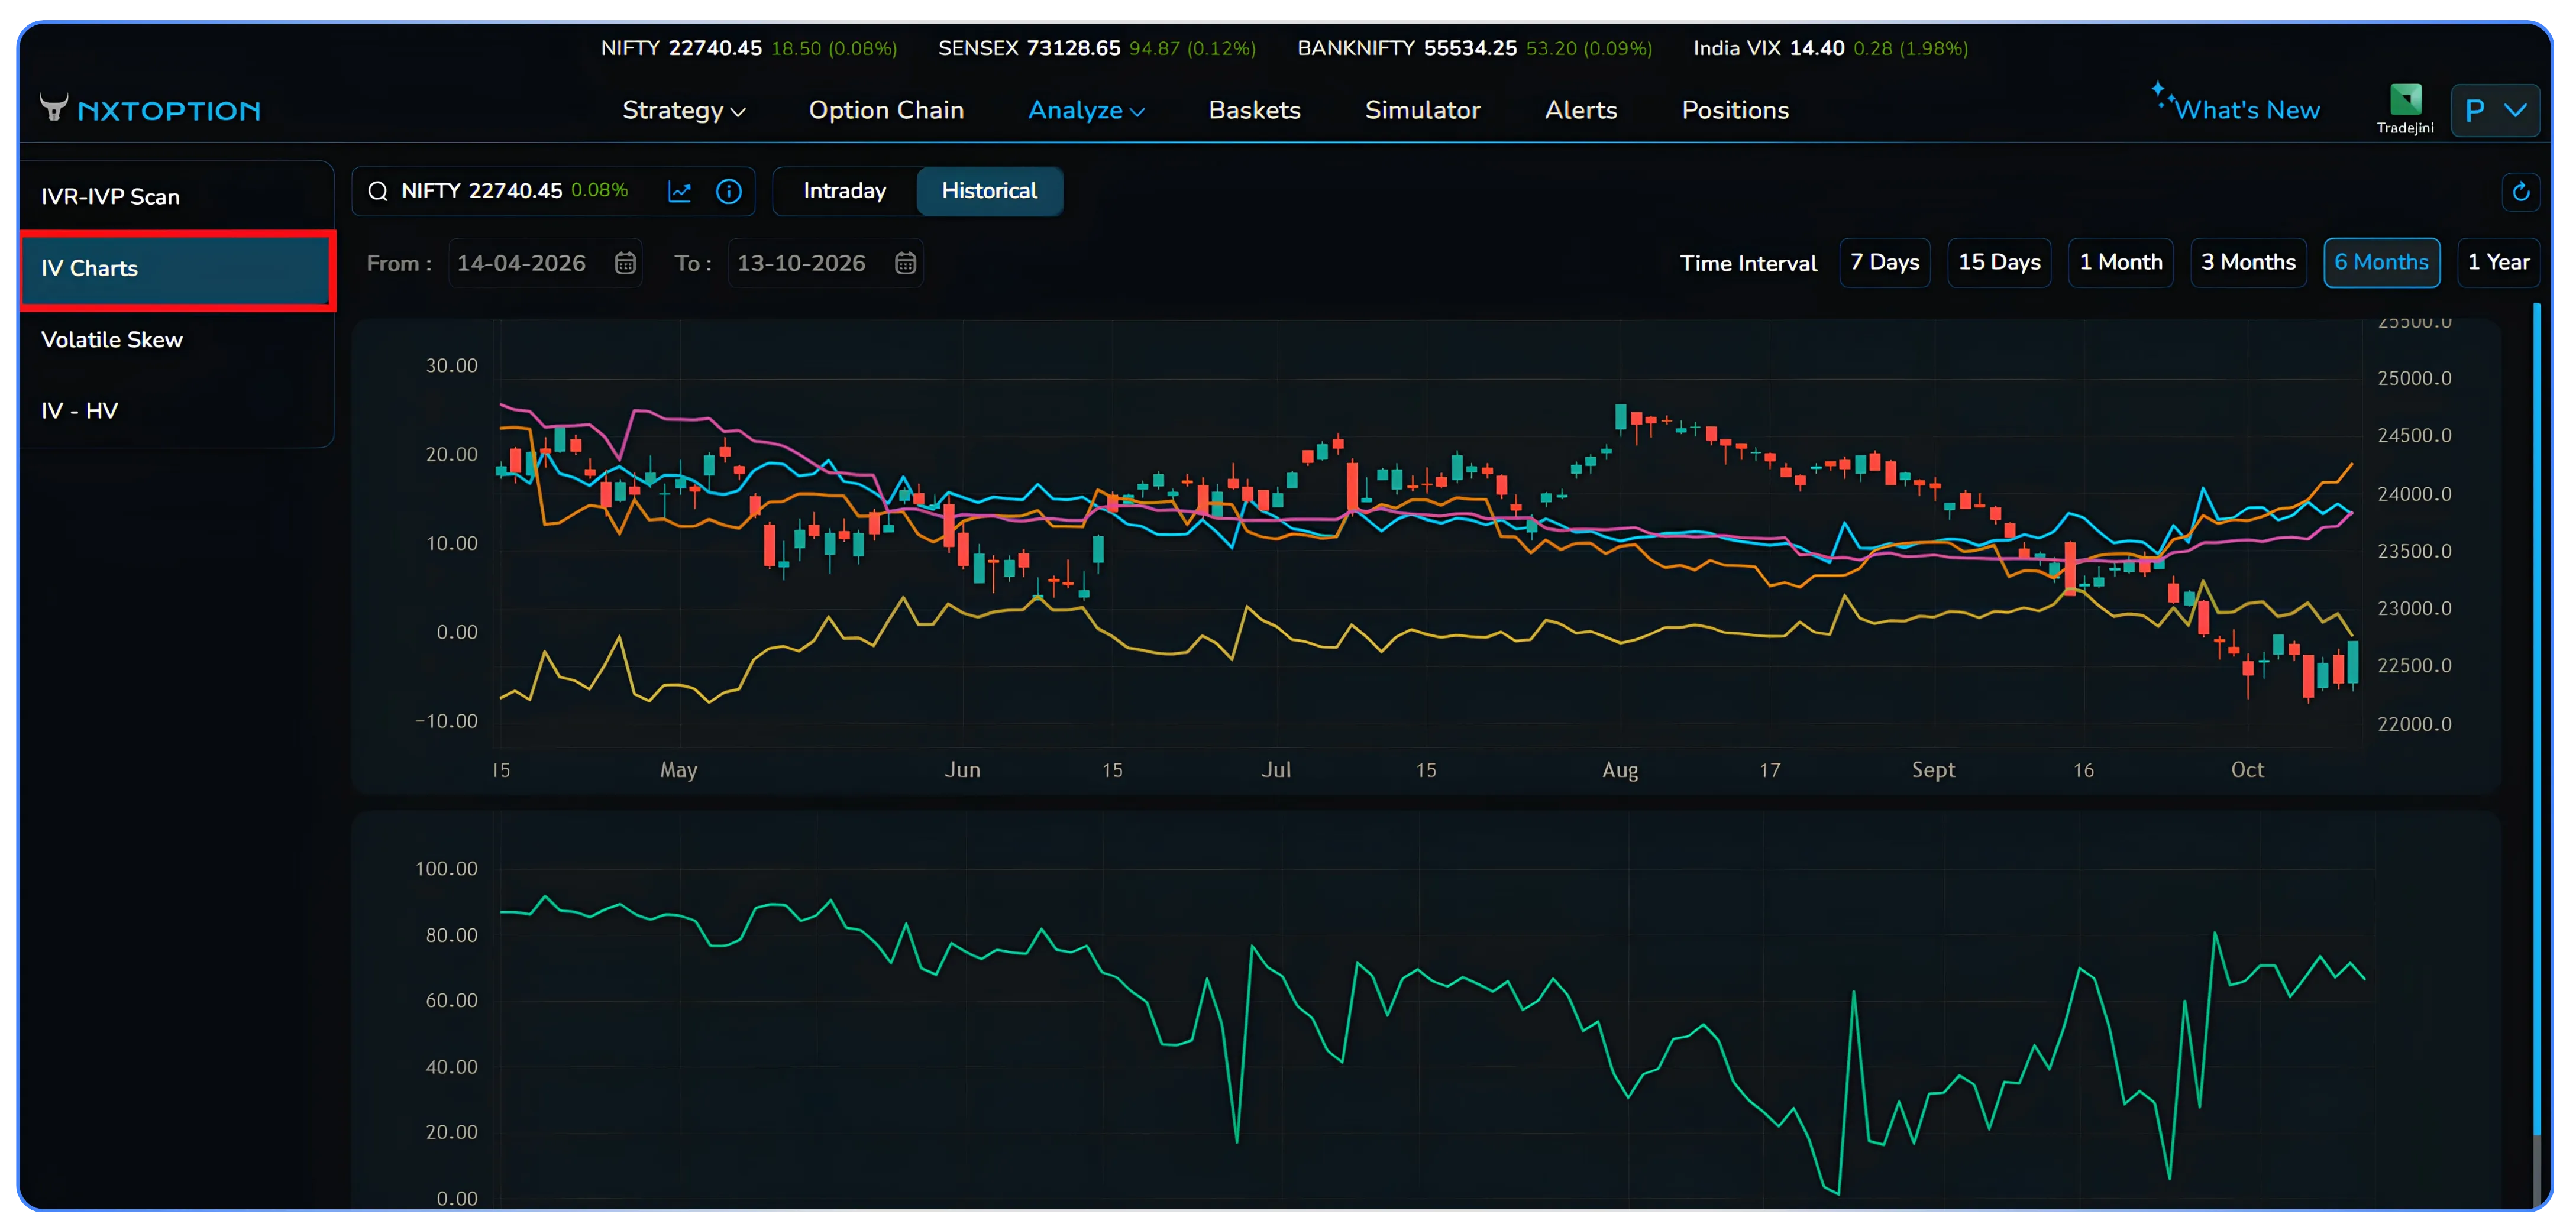
In the search box, type the symbol, for example NIFTY or POWERGRID, and select it.
Choose Historical to see past days, or Intraday to see today's movement.

Pick a range with the Time Interval buttons (7 Days, 15 Days, 1 Month, 3 Months, 6 Months, 1 Year), or set your own From and To dates.
Hover over any day on the chart to see that day's IV, open, high, low, close, HV10, HV30 and IV-RV.
- Scroll down to see the IVP chart for the same period.
The same left panel has three related tools:
- IVR-IVP Scan lists stocks by IV rank and IV percentile, so you can find high- or low-volatility candidates without checking each chart.
- Volatile Skew shows how IV differs across strike prices.
- IV - HV compares implied and historical volatility directly.
A practical routine: run the IVR-IVP Scan to shortlist stocks, open IV Charts for each shortlisted name to check the trend, then build the trade in Strategy and test it in the Simulator before placing it.
Disclaimer: The information provided in our blogs is for informational purposes only and should not be construed as financial, investment, or trading advice. Trading and investing in the securities market carries risk. Always conduct your own research and consult with a qualified financial advisor before making any investment decisions. Past performance is not indicative of future results. Copyrighted and original content for your trading and investing needs.
© 2026 — Tradejini. All Rights Reserved.