


The 3.5% Retirement Withdrawal Rule Explained
Most retirees face a critical question after building their retirement corpus: how much can I withdraw each year without running out of money? This question sits at the heart of retirement corpus sustainability and portfolio longevity risk. The common answer of 4% sounds reasonable, but it might be too aggressive given market realities, sequence of returns risk, and longevity risk.
The 3.5% retirement withdrawal rule offers a safer approach within the broader framework of the safe withdrawal rate (SWR). This rule suggests you withdraw 3.5% of your retirement corpus in the first year, then adjust that amount annually using inflation-adjusted withdrawals. Understanding why this conservative rate makes sense requires looking at actual market behavior rather than optimistic projections.
Also Read: When Financial Decisions Are About More Than Money
Why Not Use Historical Averages for the sake of your Retirement Corpus
Equity markets have delivered strong long-term returns, often cited at around 12% annually. This leads many retirees to assume they can safely withdraw aggressively while their portfolio continues to grow.
The problem is volatility. Markets do not deliver steady returns. A sharp loss early in retirement followed by strong gains later can still leave investors worse off, especially when withdrawals are taken during downturns. Those withdrawals lock in losses and reduce the capital base on which future returns compound. Even if average returns look healthy over time, the portfolio may never fully recover, directly impacting portfolio longevity risk.
This sequence of returns risk is what makes retirement withdrawals tricky. A bad market year early in retirement can permanently damage your ability to sustain withdrawals even if markets recover later, undermining retirement corpus sustainability.
The Math Behind 3.5% Systematic Withdrawal Rate (SWR)
The calculation works backwards from what you are trying to preserve. We begin with a normalized assumption that long-term equity returns moderate to around 11.5% annually, closer to historical norms than recent outsized performance.
However, investors never earn this headline return in practice. The first reduction comes from volatility drag. Because returns fluctuate year to year, the compound growth rate is lower than the simple average. This mathematical effect alone reduces returns by roughly 3.5% points.
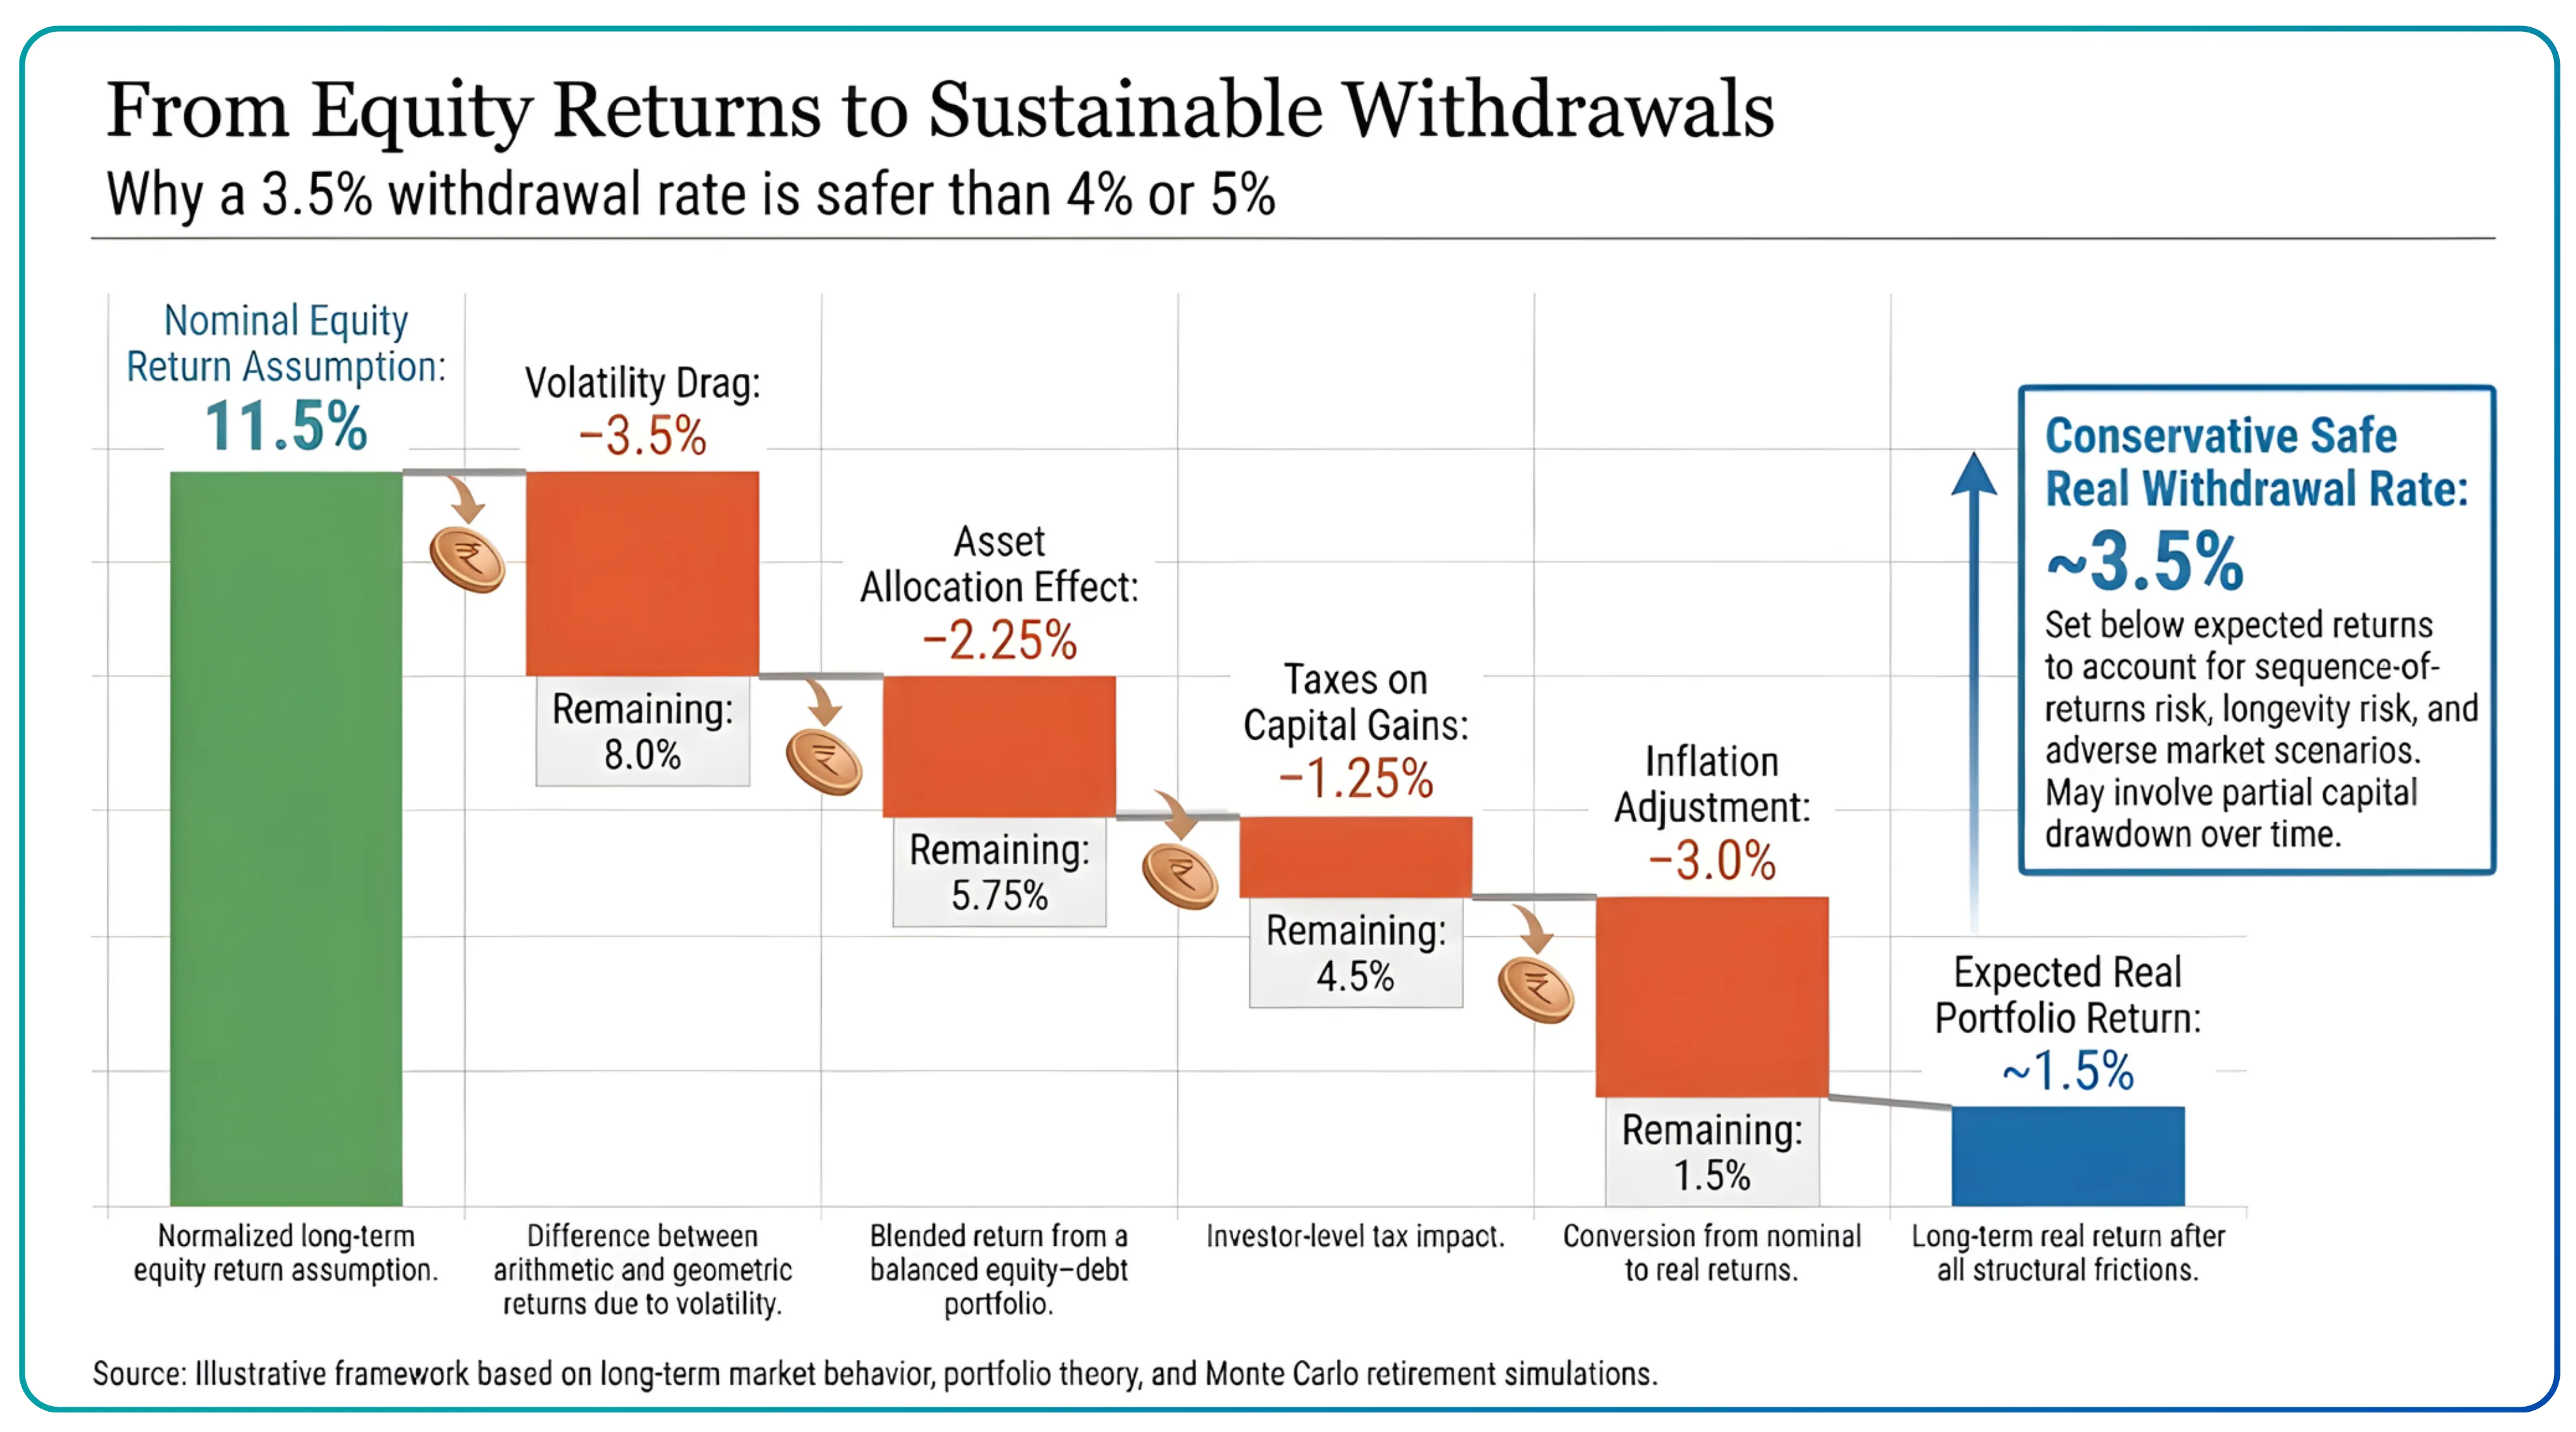
Next comes asset allocation. Most retirees do not, and should not, hold 100% equity. A more balanced 50–50 equity–debt portfolio lowers expected returns by an additional 2.25 percentage points.
Returns are further reduced by taxes. Long-term capital gains taxation at approximately 12.5% trims another 1.25% points from investor-level returns. Inflation, assumed at 3% annually, then erodes purchasing power, converting nominal returns into real terms through inflation-adjusted withdrawals.
After accounting for volatility, asset allocation, taxes, and inflation, the portfolio’s expected real return is meaningfully lower than the original headline figure. To account for sequence-of-returns risk, portfolio longevity risk, and adverse market conditions, withdrawals must be set conservatively below expected real returns. This leads to a sustainable real withdrawal rate of around 3.5%, designed to preserve purchasing power and retirement corpus sustainability rather than maximize short-term income.
Also Read: The Turtle Trading Approach
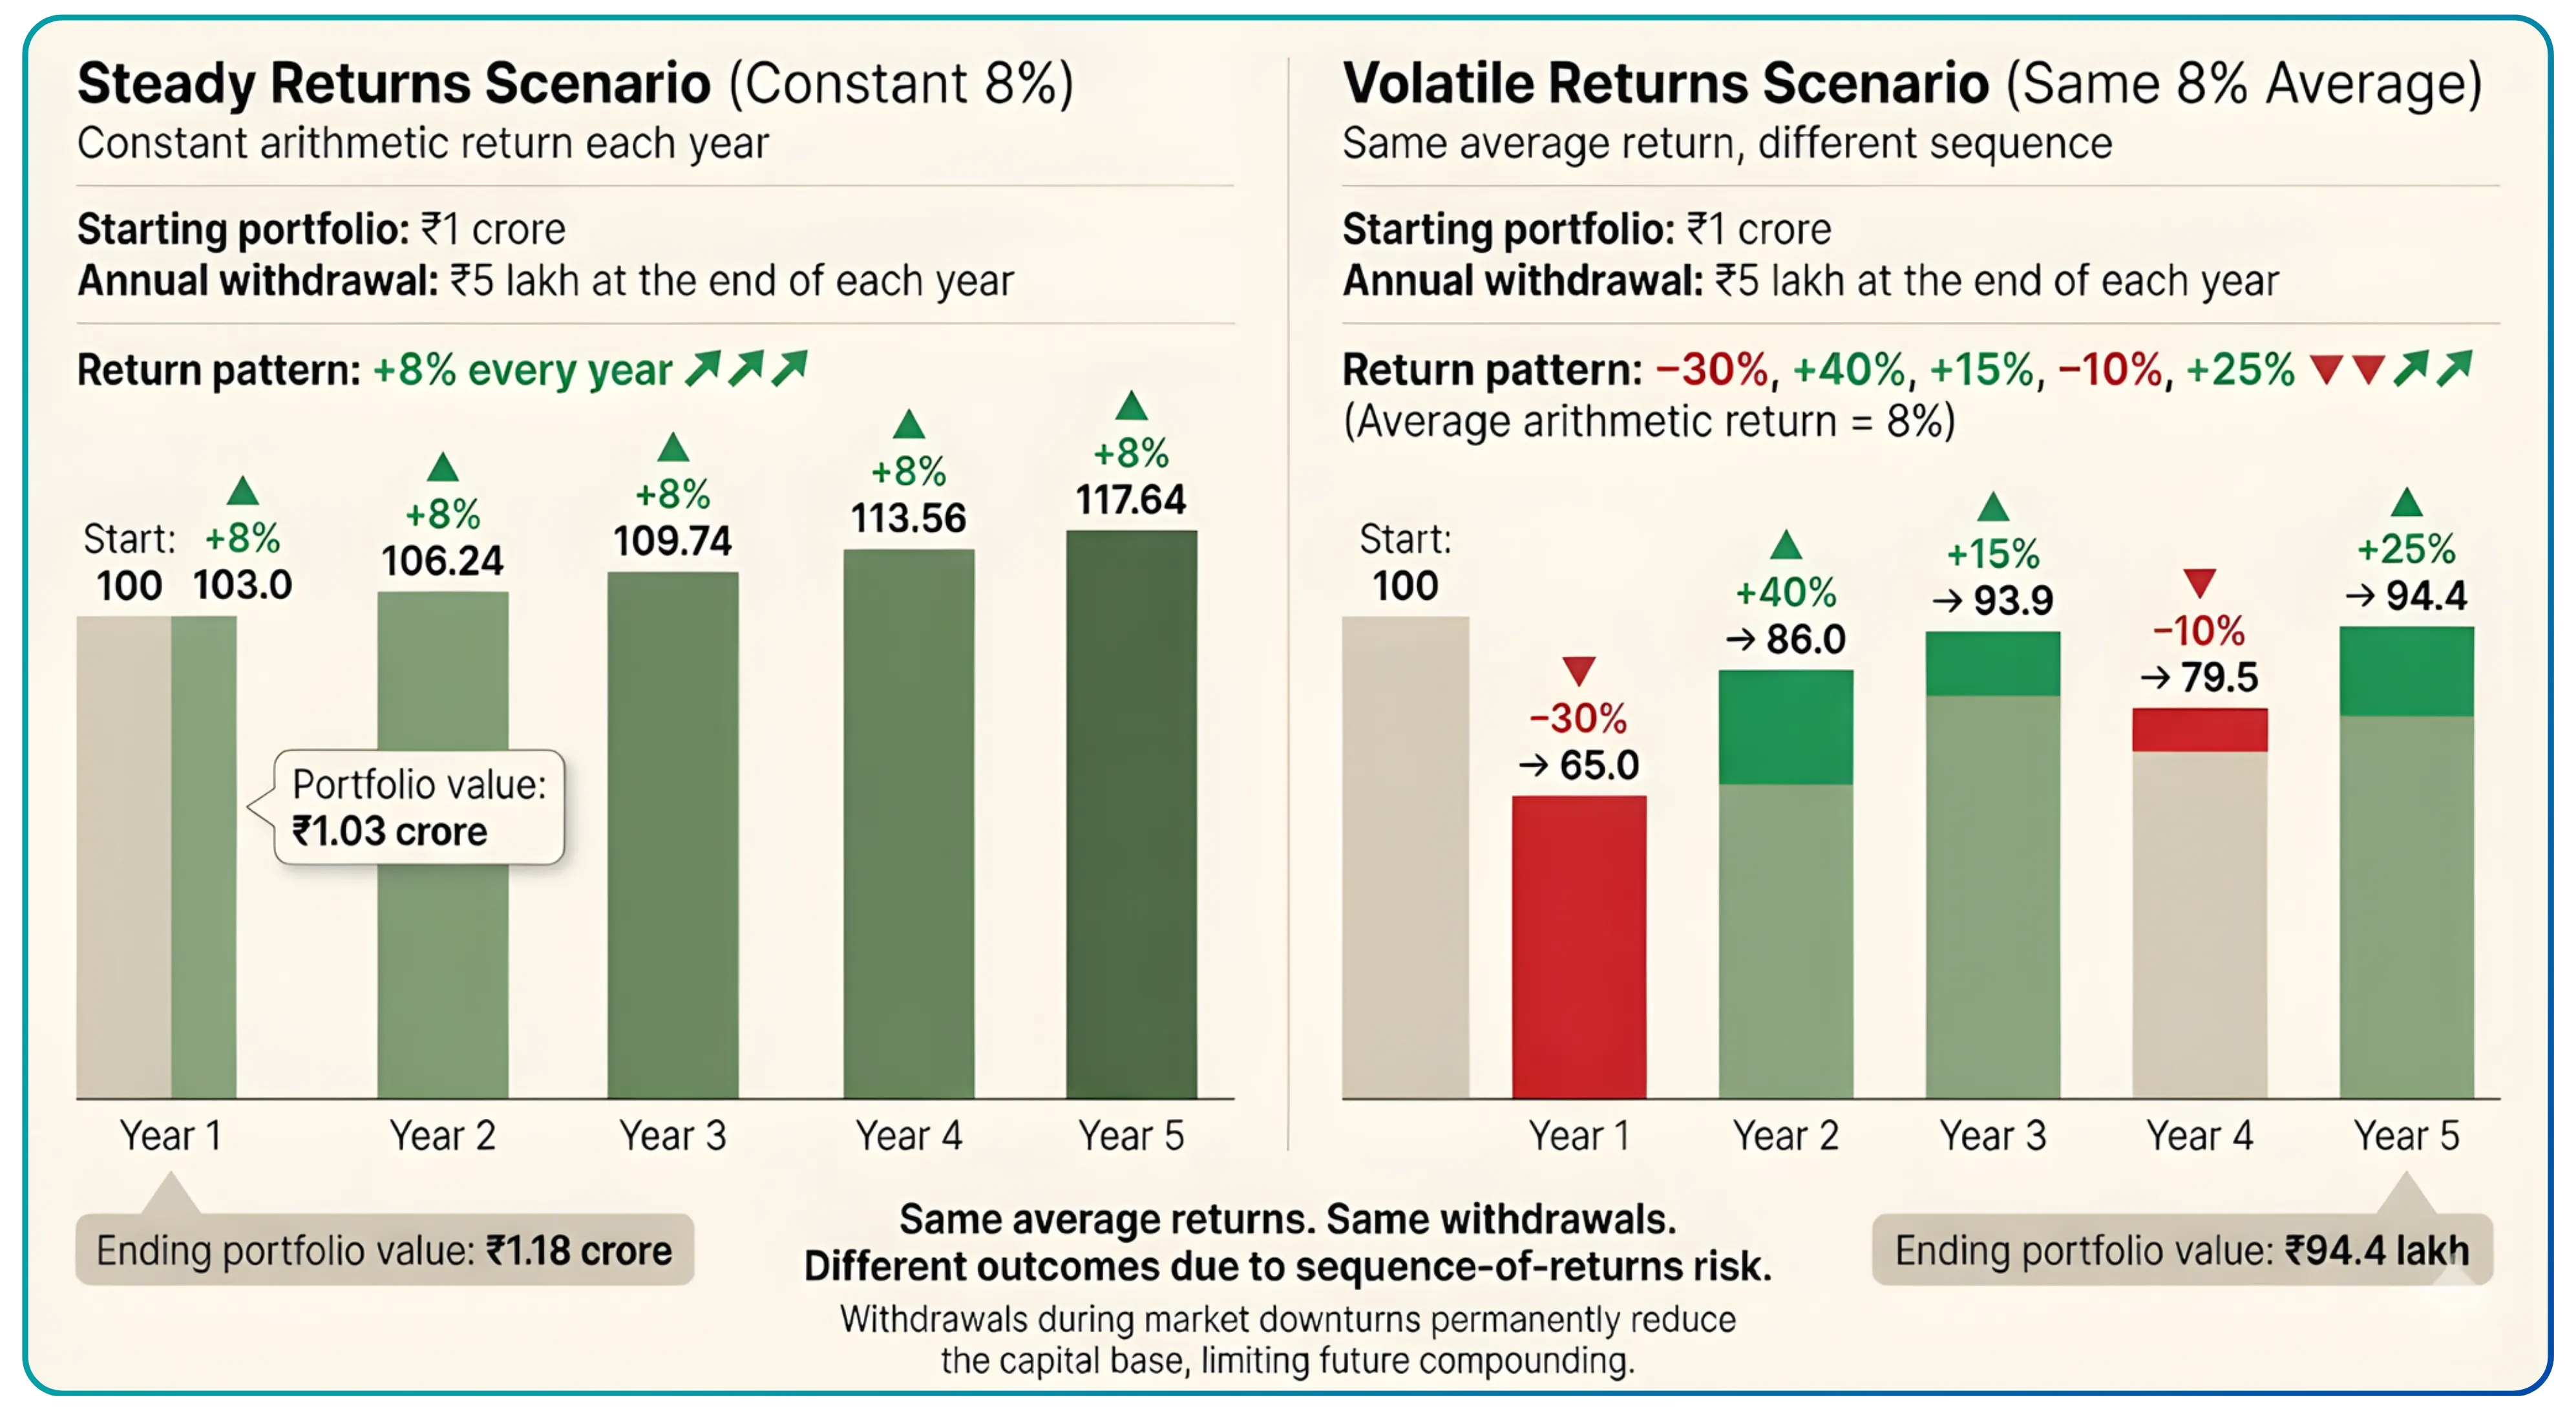
Accounting for Sequence of Return Risk
The order in which returns occur matters enormously in retirement. A simple illustration makes this clear. Consider a portfolio with an expected long-run real return of 8% supporting a withdrawal rate of 5%. In a hypothetical world of smooth, steady returns, this strategy could appear sustainable for decades.
Real markets, however, are volatile. If the early years of retirement experience below-average returns while withdrawals continue at 5%, portfolio value declines sharply. Even if markets recover later, withdrawals taken during downturns permanently reduce the capital base, limiting the portfolio’s ability to compound and sustain future spending. This is the core danger of sequence of returns risk.
Also Read: How much money do you need to retire in India
Monte Carlo simulations across a wide range of market paths highlight this risk. Under typical assumptions, a 3.5% withdrawal rate has historically produced portfolio survival probabilities near 95% over a 30-year retirement horizon. Increasing withdrawals to 4% reduces survival probabilities into the 80–85% range, while a 5% withdrawal rate introduces a materially higher risk of portfolio depletion, placing safe withdrawal rate assumptions under stress.
The Conservative Approach
The 3.5% rule is not about pessimism. It reflects planning for uncertainty rather than best-case outcomes. Markets experience drawdowns, inflation fluctuates, and retirement expenses. Particularly healthcare costs. Often exceed expectations. Building conservatism into withdrawal planning reduces the likelihood of forced spending cuts later in retirement and improves retirement corpus sustainability.
This approach does not imply rigid adherence to a fixed spending rule. In strong market years, discretionary spending may increase, while in weaker years, expenses can be moderated. A 3.5% baseline safe withdrawal rate provides flexibility while prioritizing long-term portfolio longevity risk management.
For most retirees, the risk of outliving their assets is far more damaging than leaving a larger-than-planned estate. A conservative withdrawal strategy reflects this asymmetry by prioritizing sustainability over consumption maximization through inflation-adjusted withdrawals.
Start your investing journey today with CubePlus by Tradejini.
Disclaimer: The information provided in our blogs is for informational purposes only and should not be construed as financial, investment, or trading advice. Trading and investing in the securities market carries risk. Always conduct your own research and consult with a qualified financial advisor before making any investment decisions. Past performance is not indicative of future results. Copyrighted and original content for your trading and investing needs.
© 2025 — Tradejini. All Rights Reserved.