


The new CubePlus home screen changes how you interact with your trading app. Instead of a fixed layout, it gives you full control over what you see and how you see it. From custom sections to deeper market insights, everything is designed to match your workflow, not the other way around.
Before Anything Else – Your Settings, Your Layout
The new home screen is not built around a default layout. It is built around your preferences.
At the top, you will find three tabs: Stocks, Derivatives, and Commodity. Each tab has its own set of sections that you can turn on or off based on what you actually use.
For example, under Stocks, you might see ETFs, Holdings, Market Scan, Results Calendar, and Positions. If something is not relevant to your routine, you can remove it. If your workflow changes later, you can bring it back instantly.
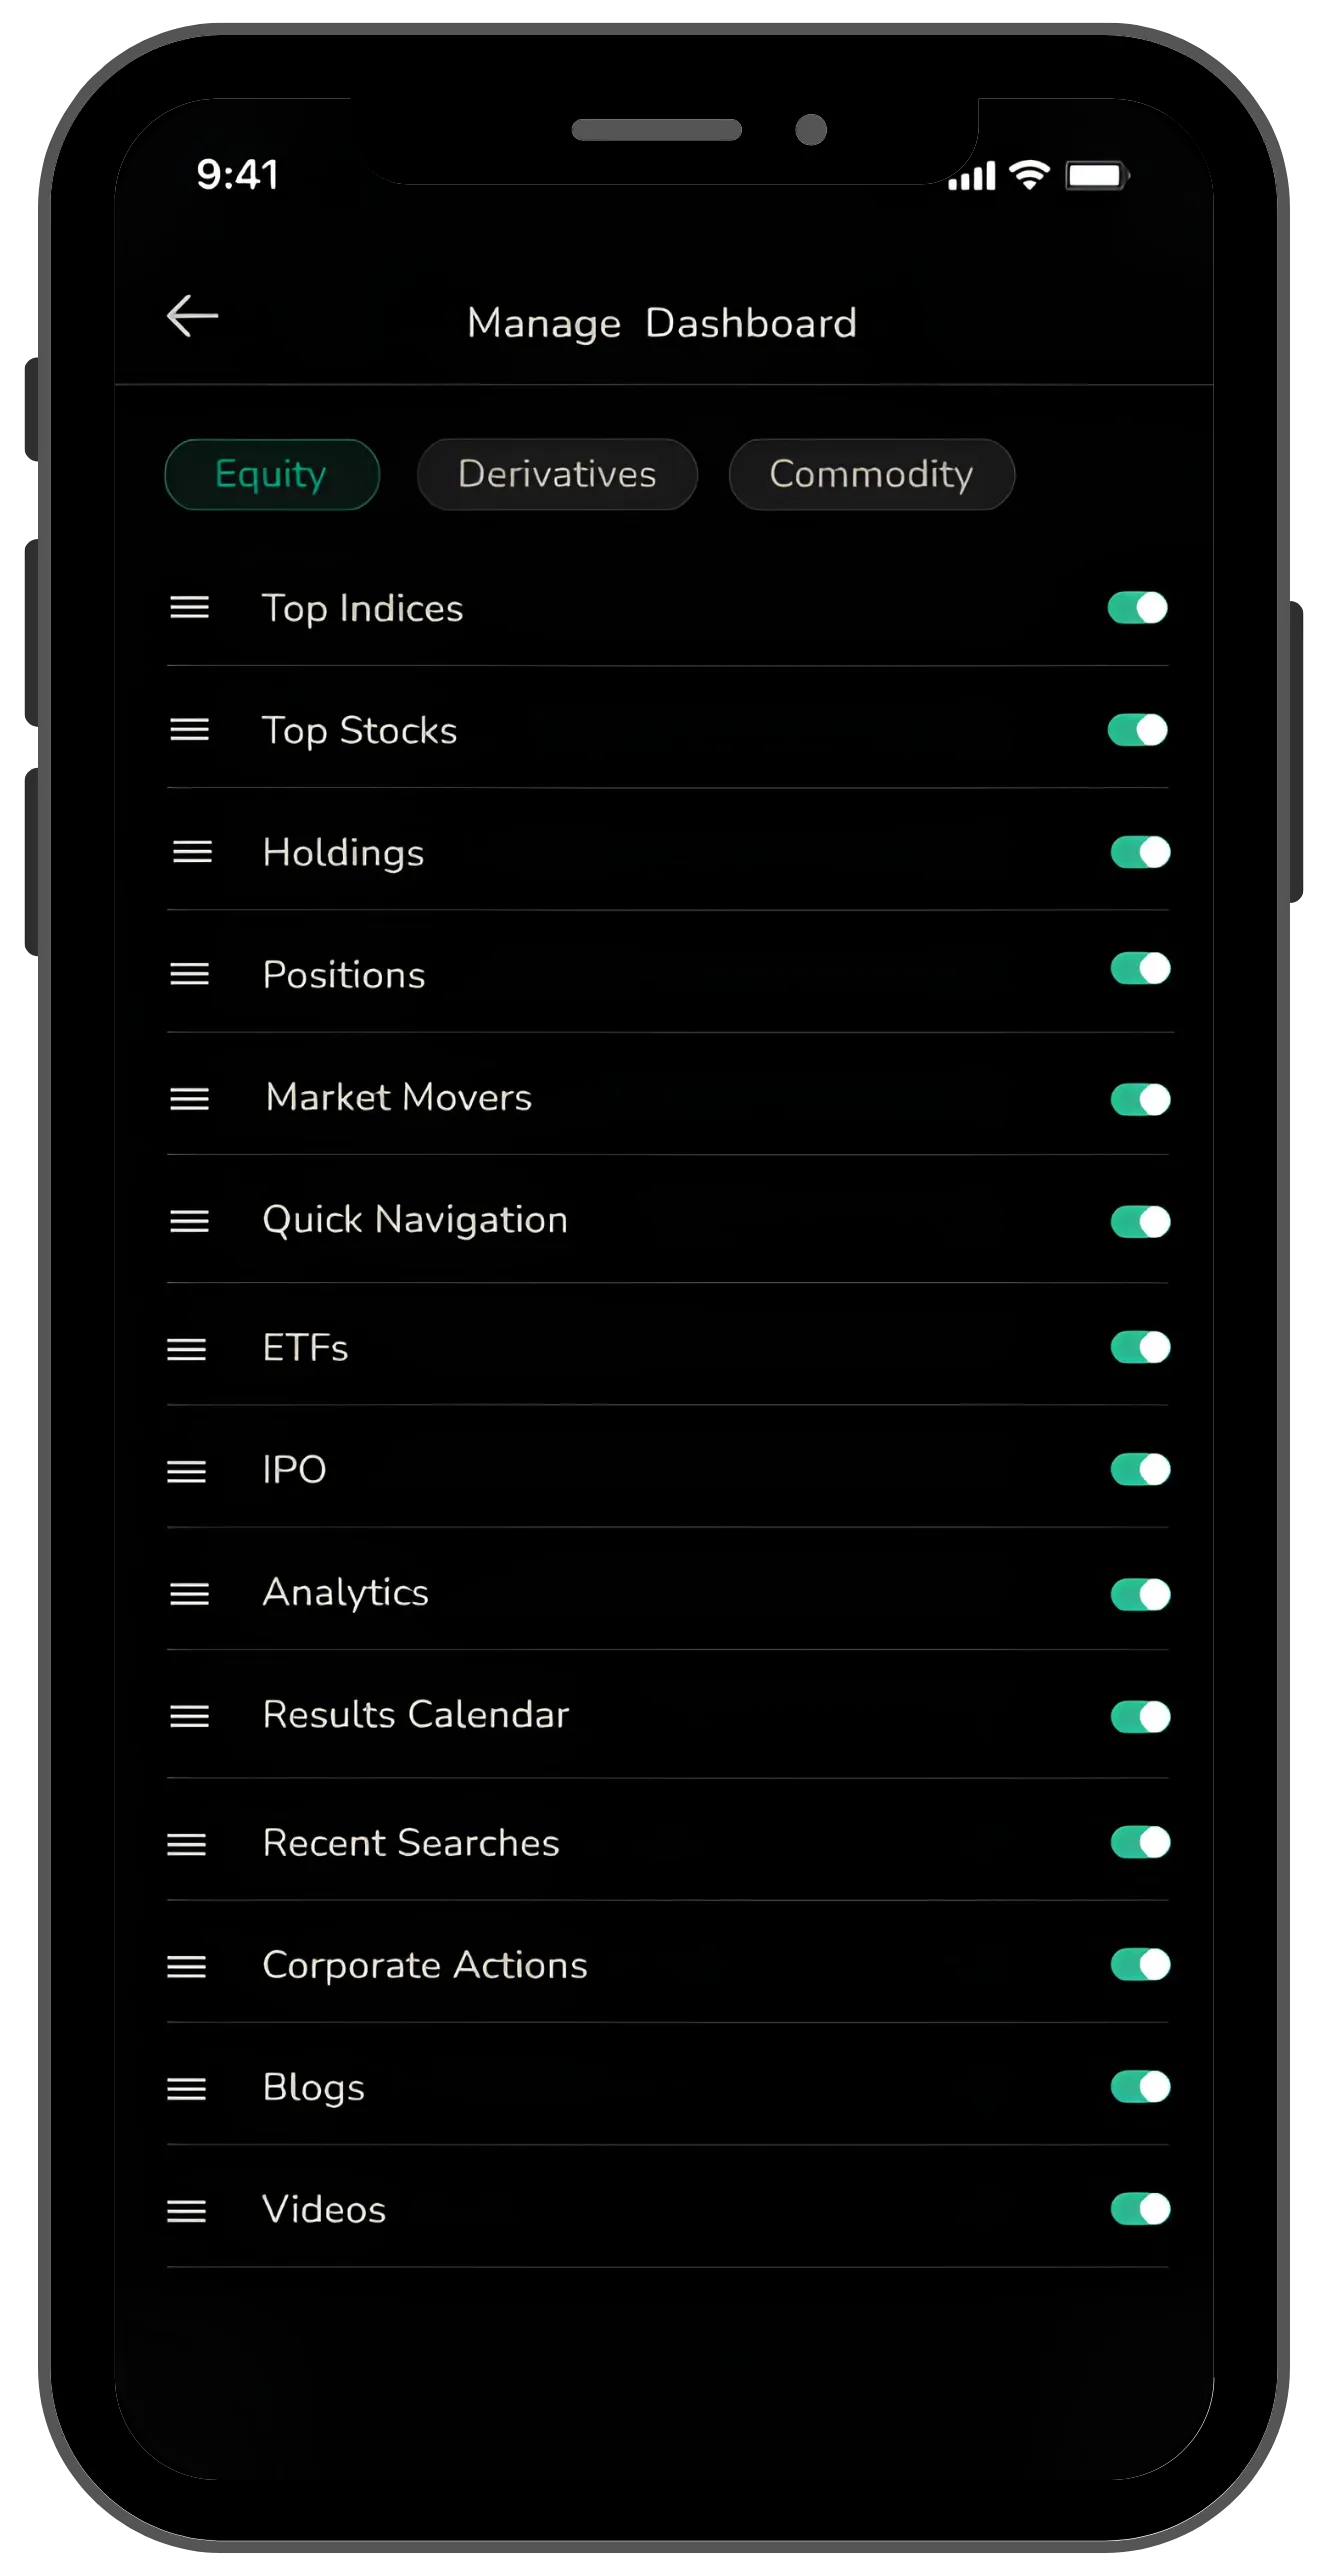
You can also reorder every section. If results matter first thing in the morning, move the Results Calendar to the top. If market scans drive your decisions, place them upfront. The layout saves automatically, so every time you open the app, it feels familiar. Think of it as building your own trading workspace on your phone.
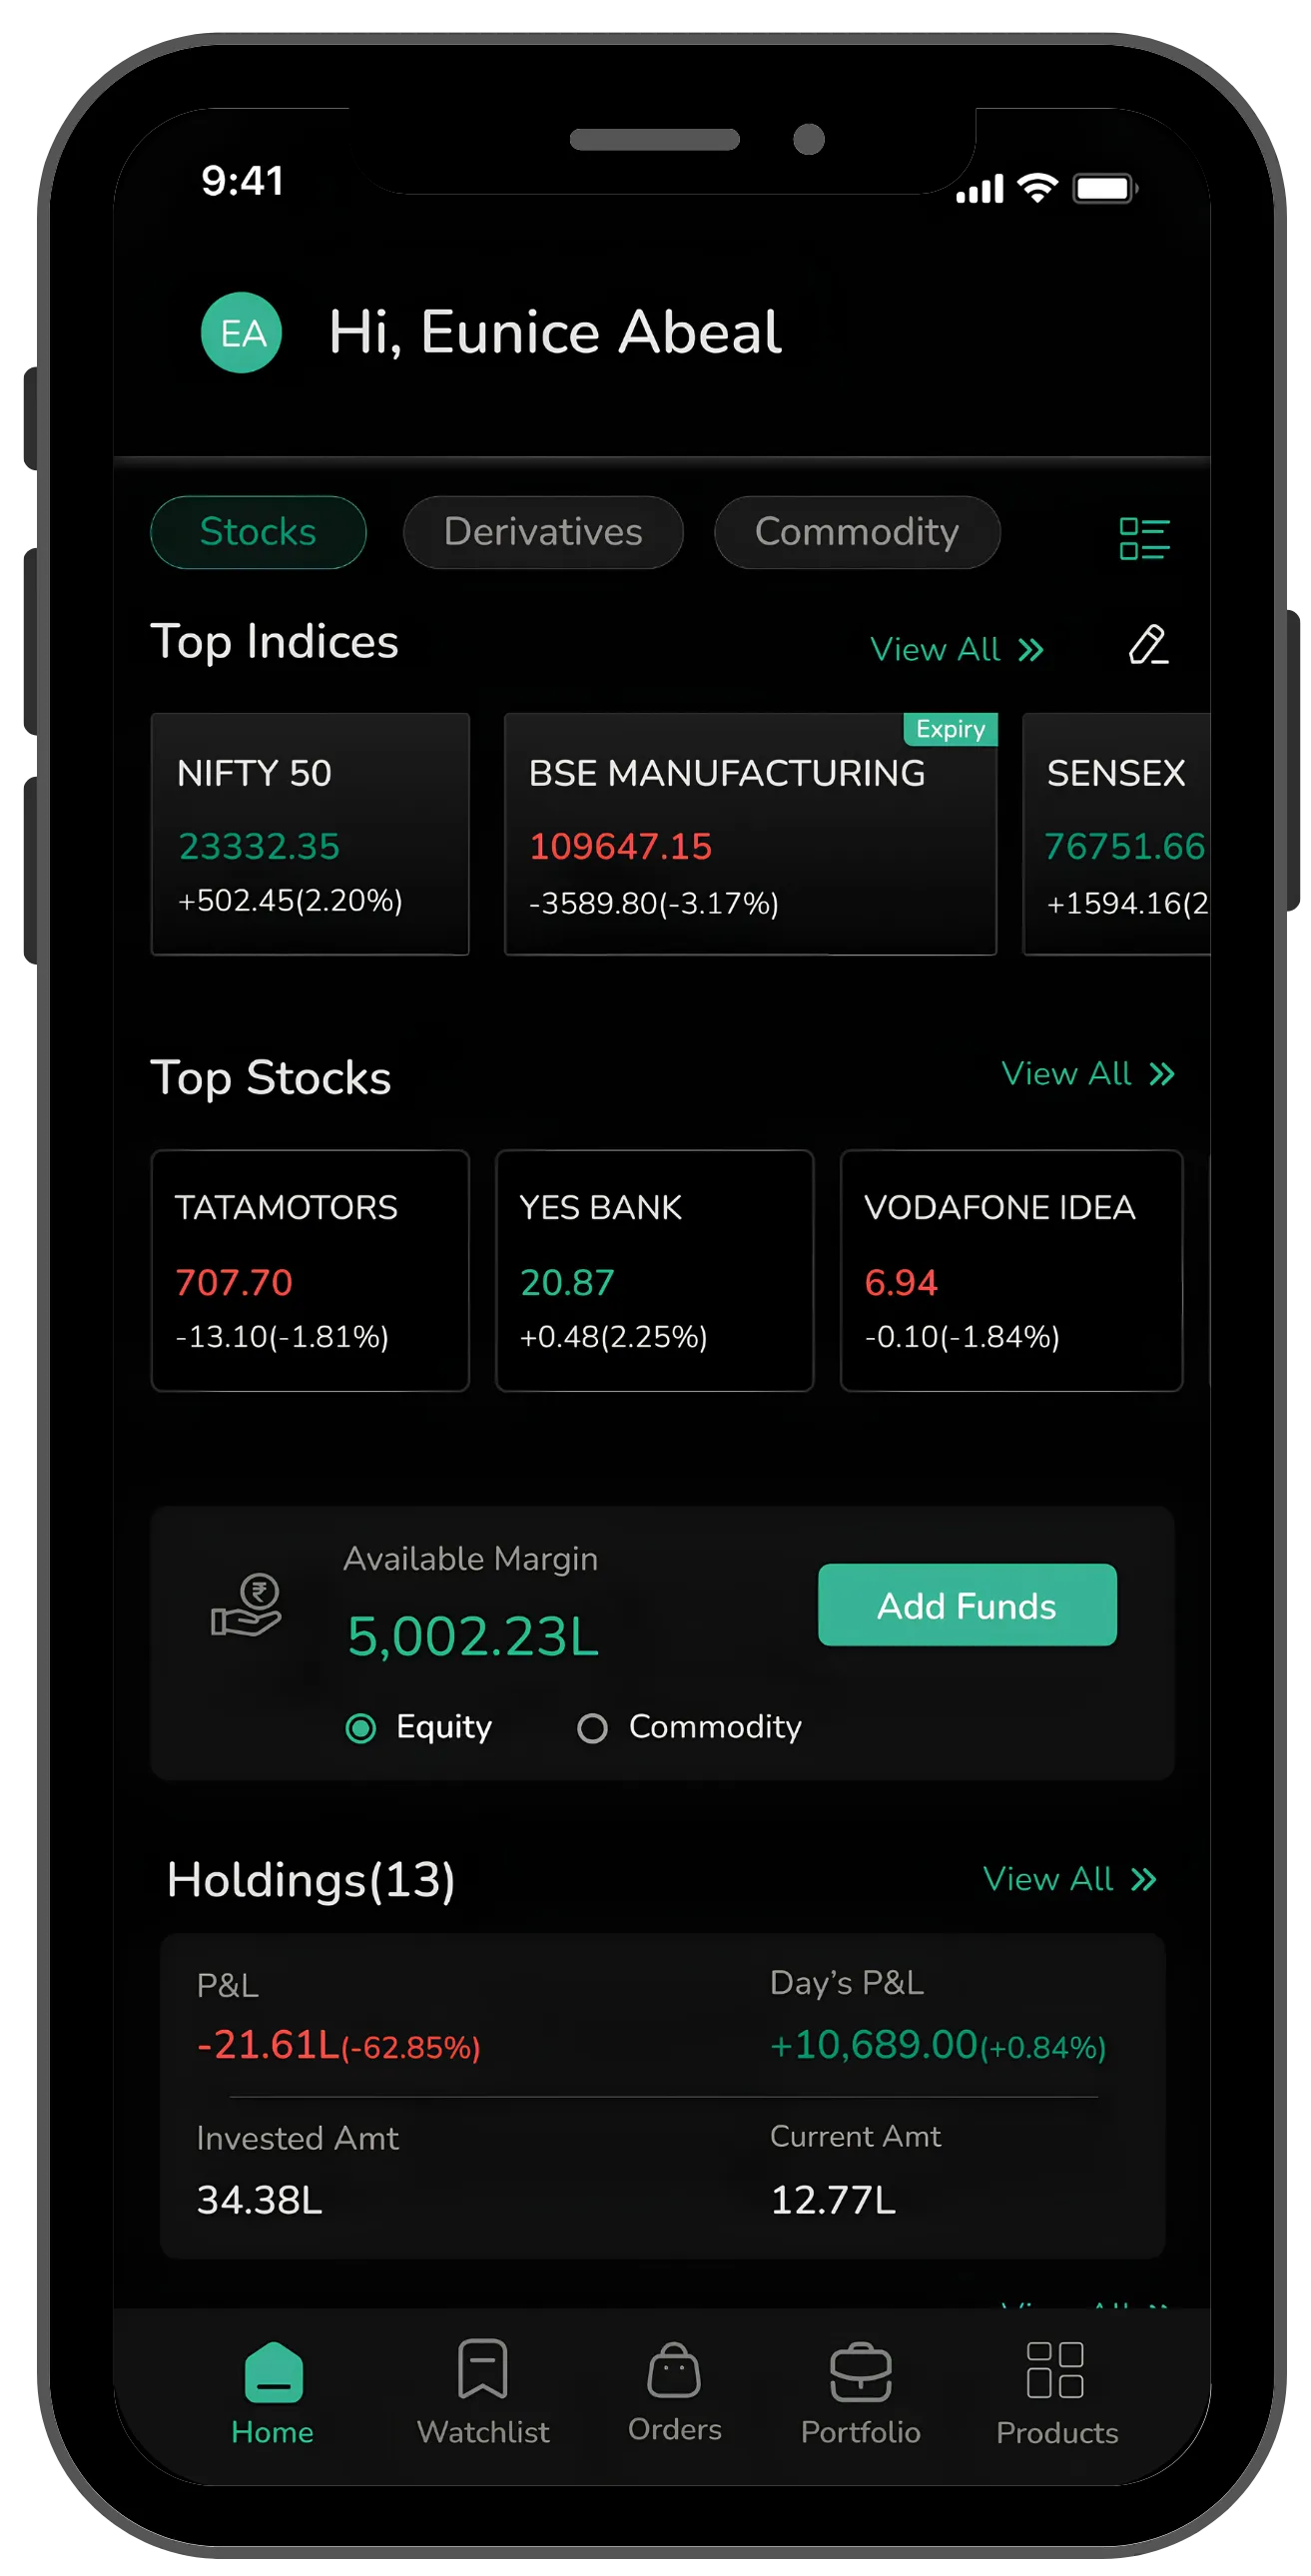
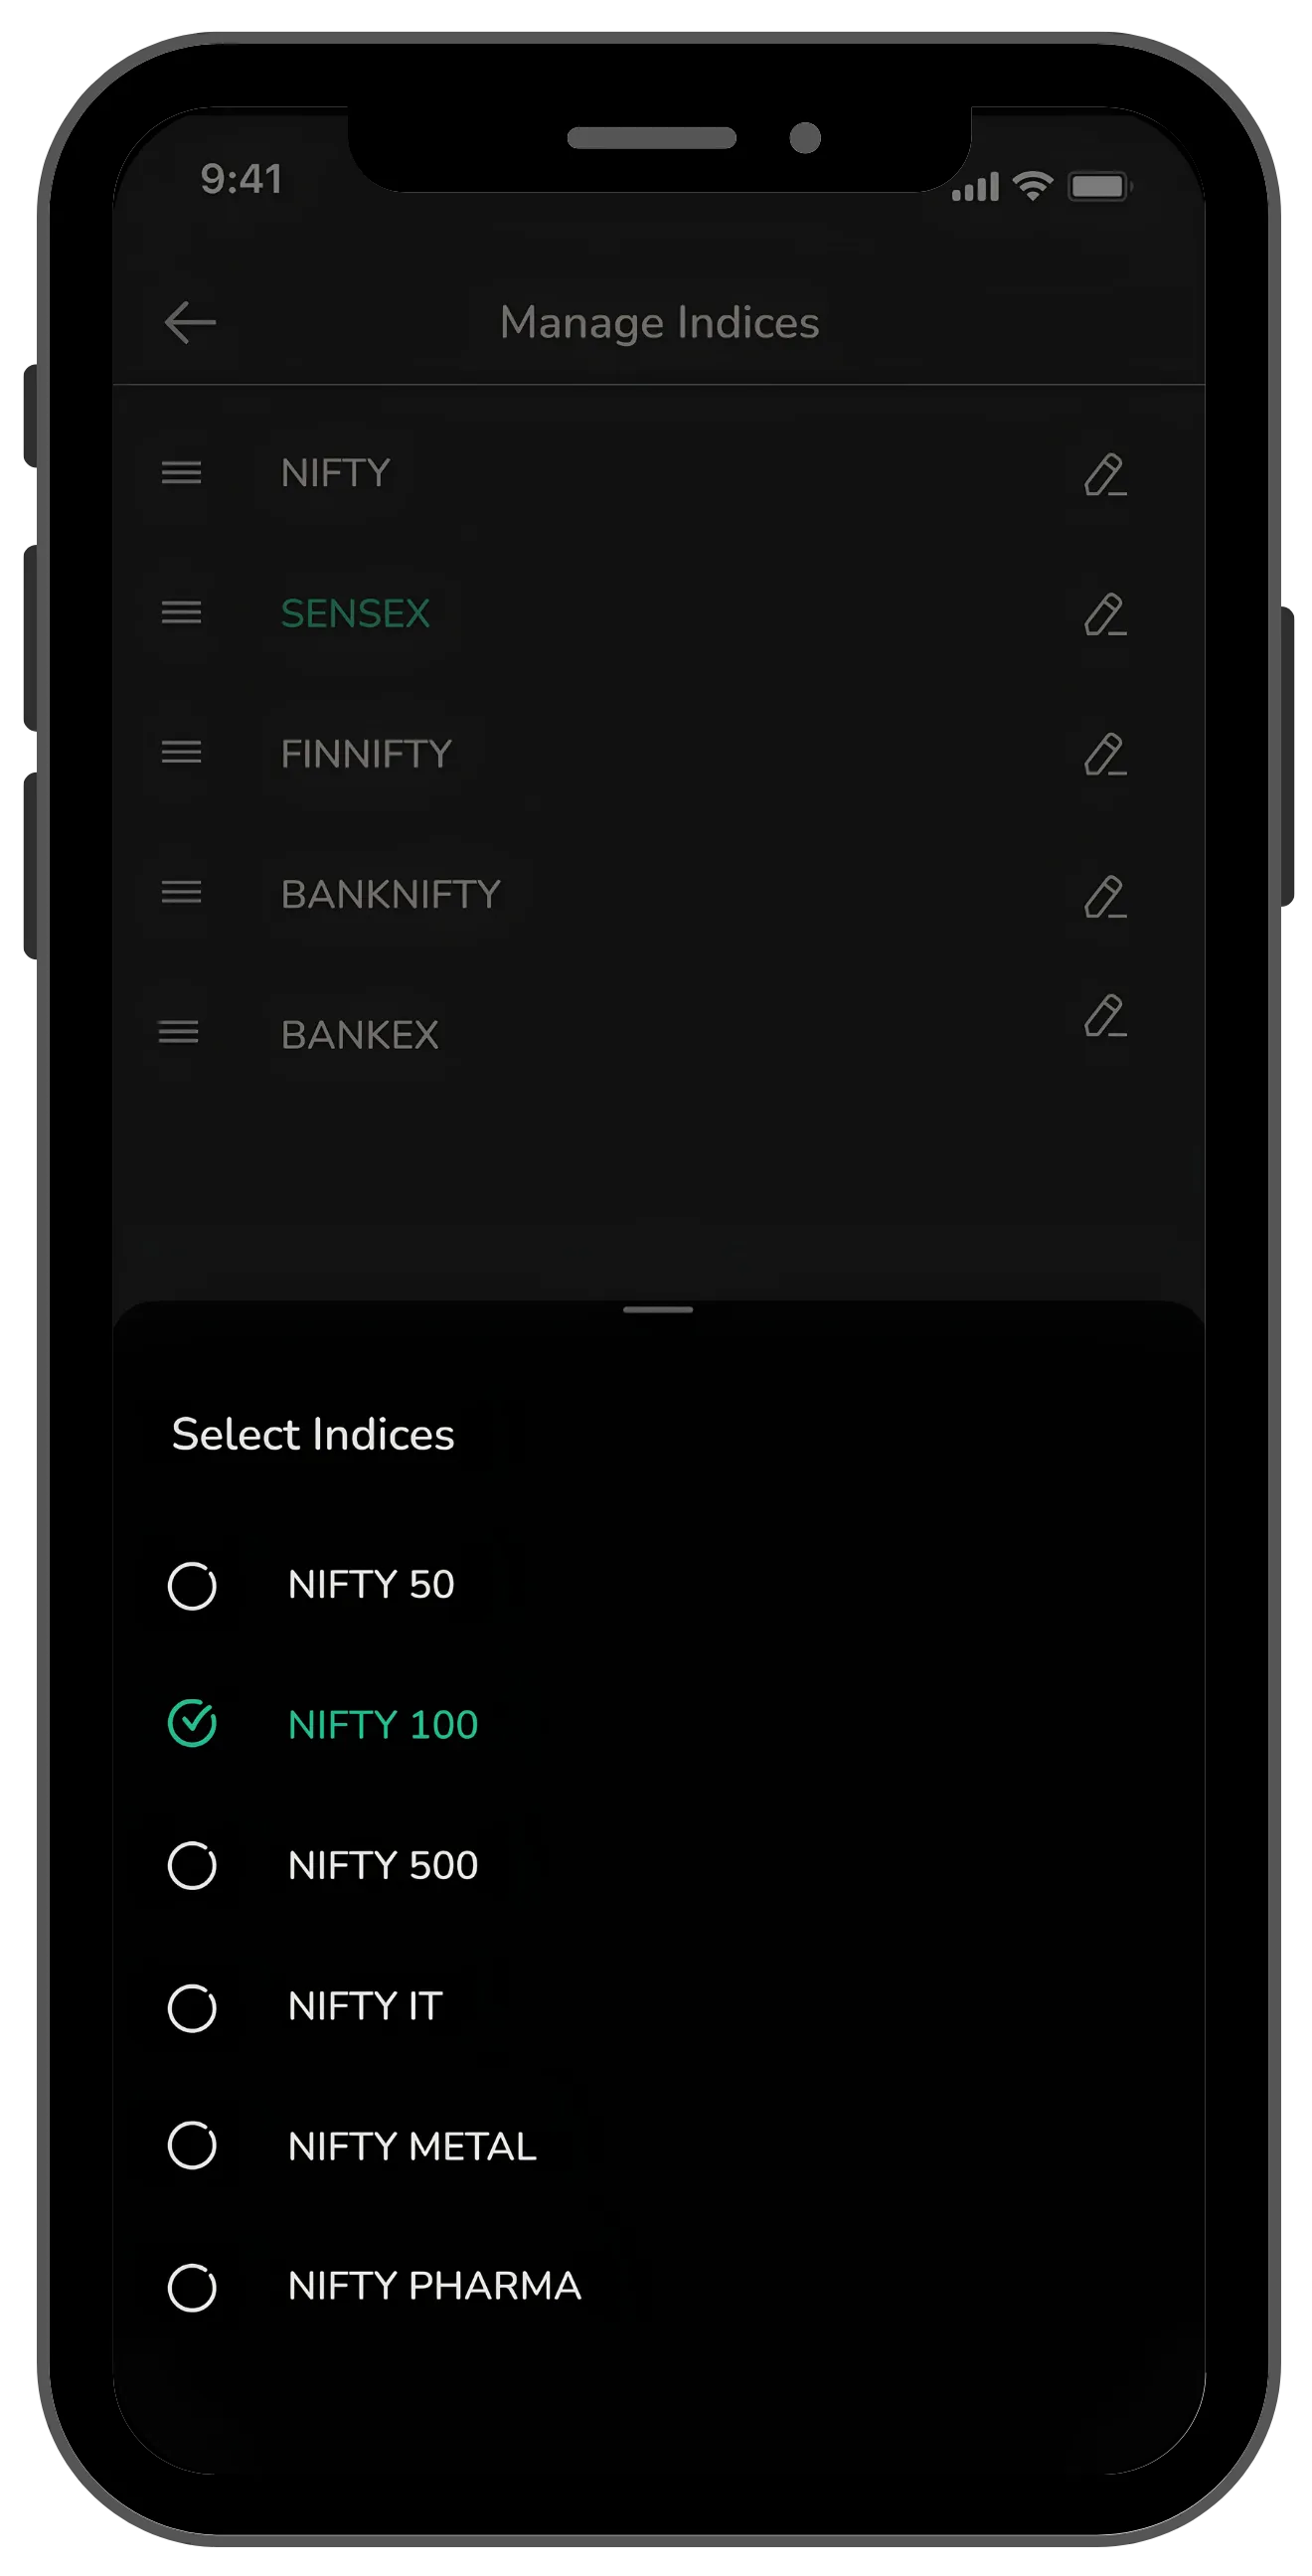
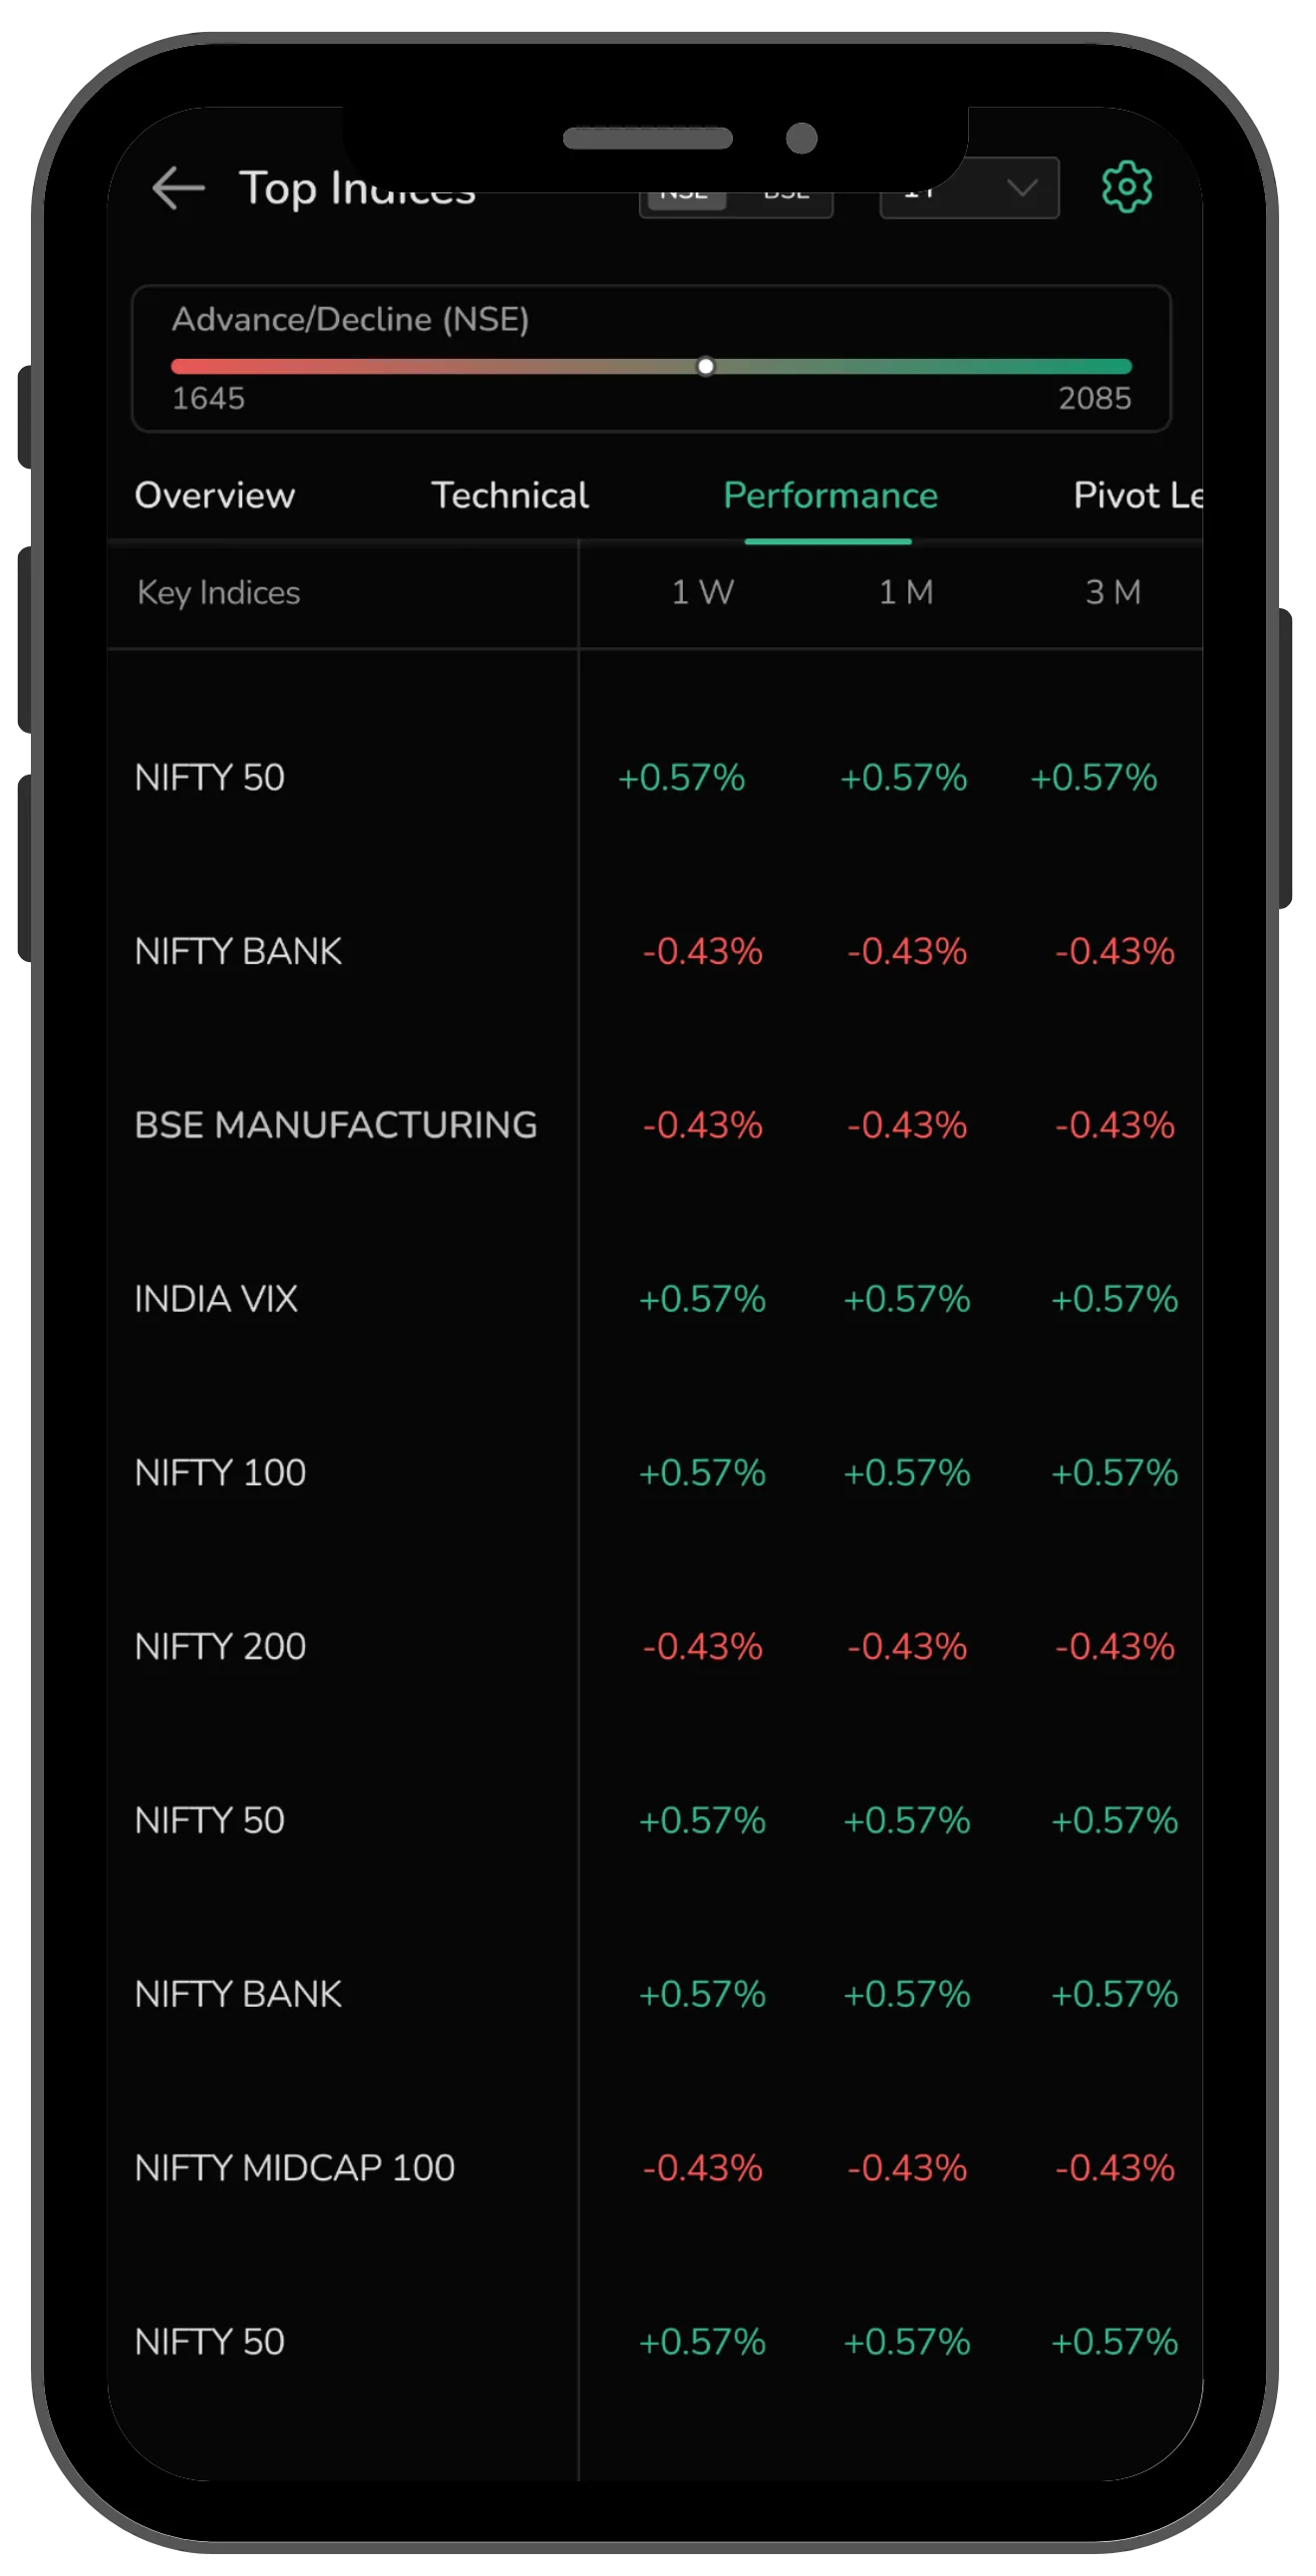
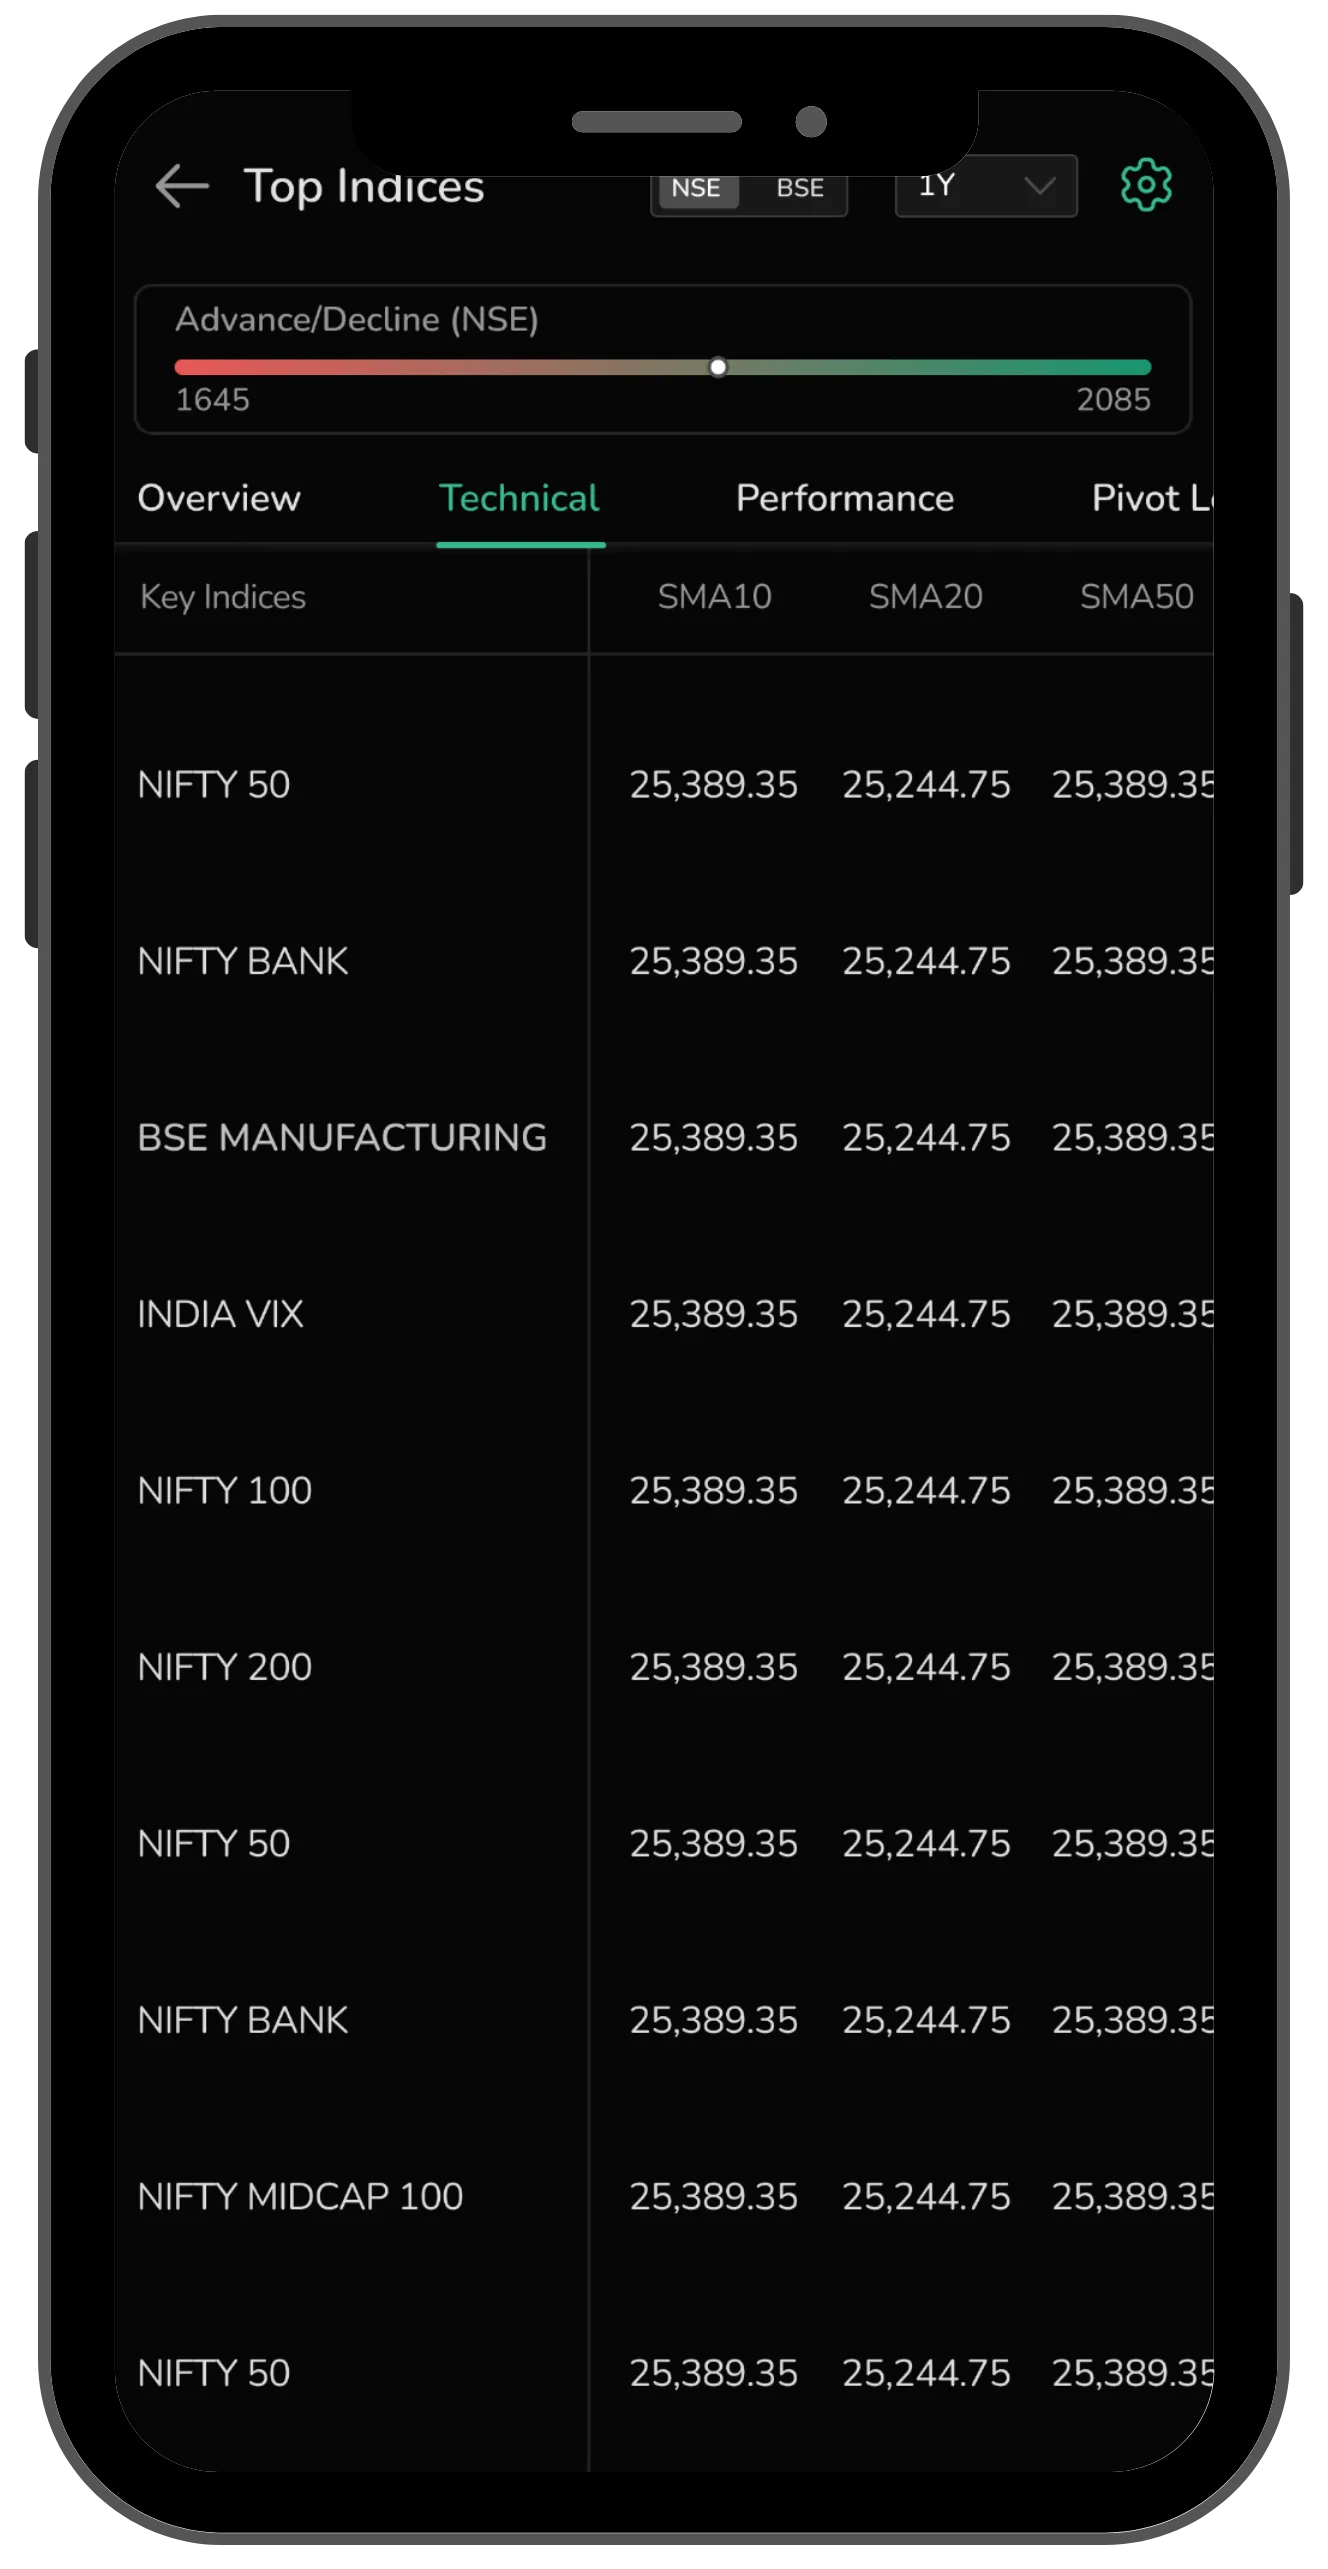
Top Indices
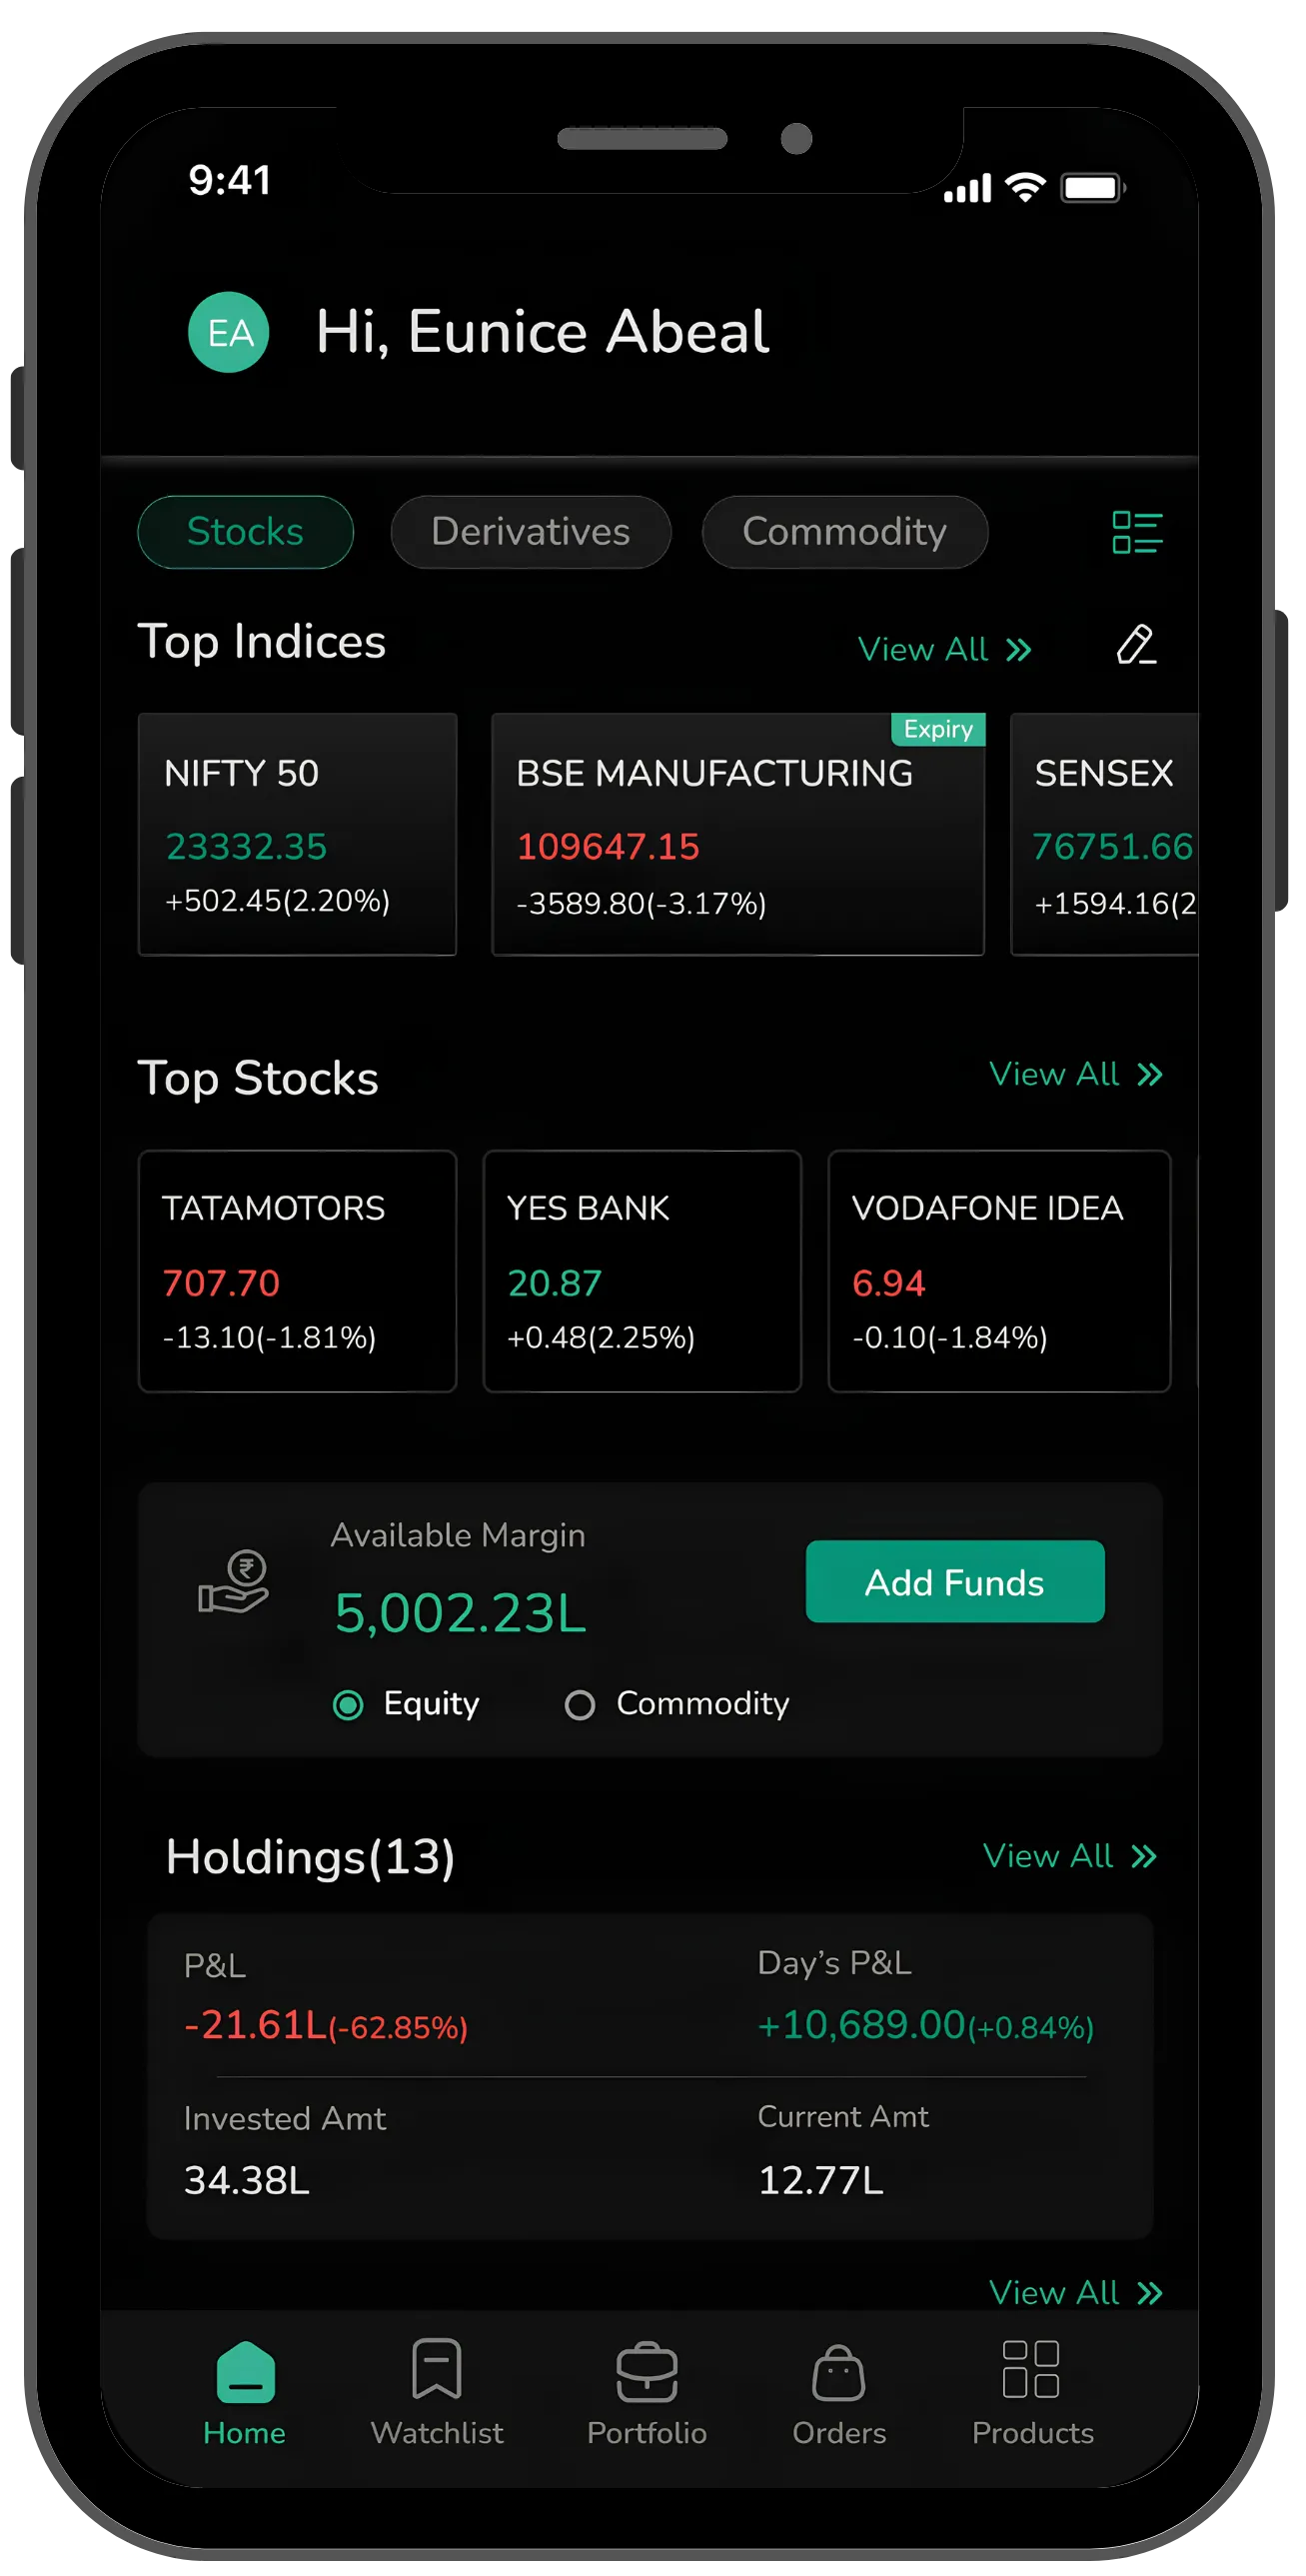
The Top Indices section gives you a snapshot of the market at a glance, but it does not stop there. You can choose which indices appear, whether that is Nifty 50, Bank Nifty, Sensex, India VIX, or even broader indices like Nifty 200 or Midcap. The selection is entirely yours.
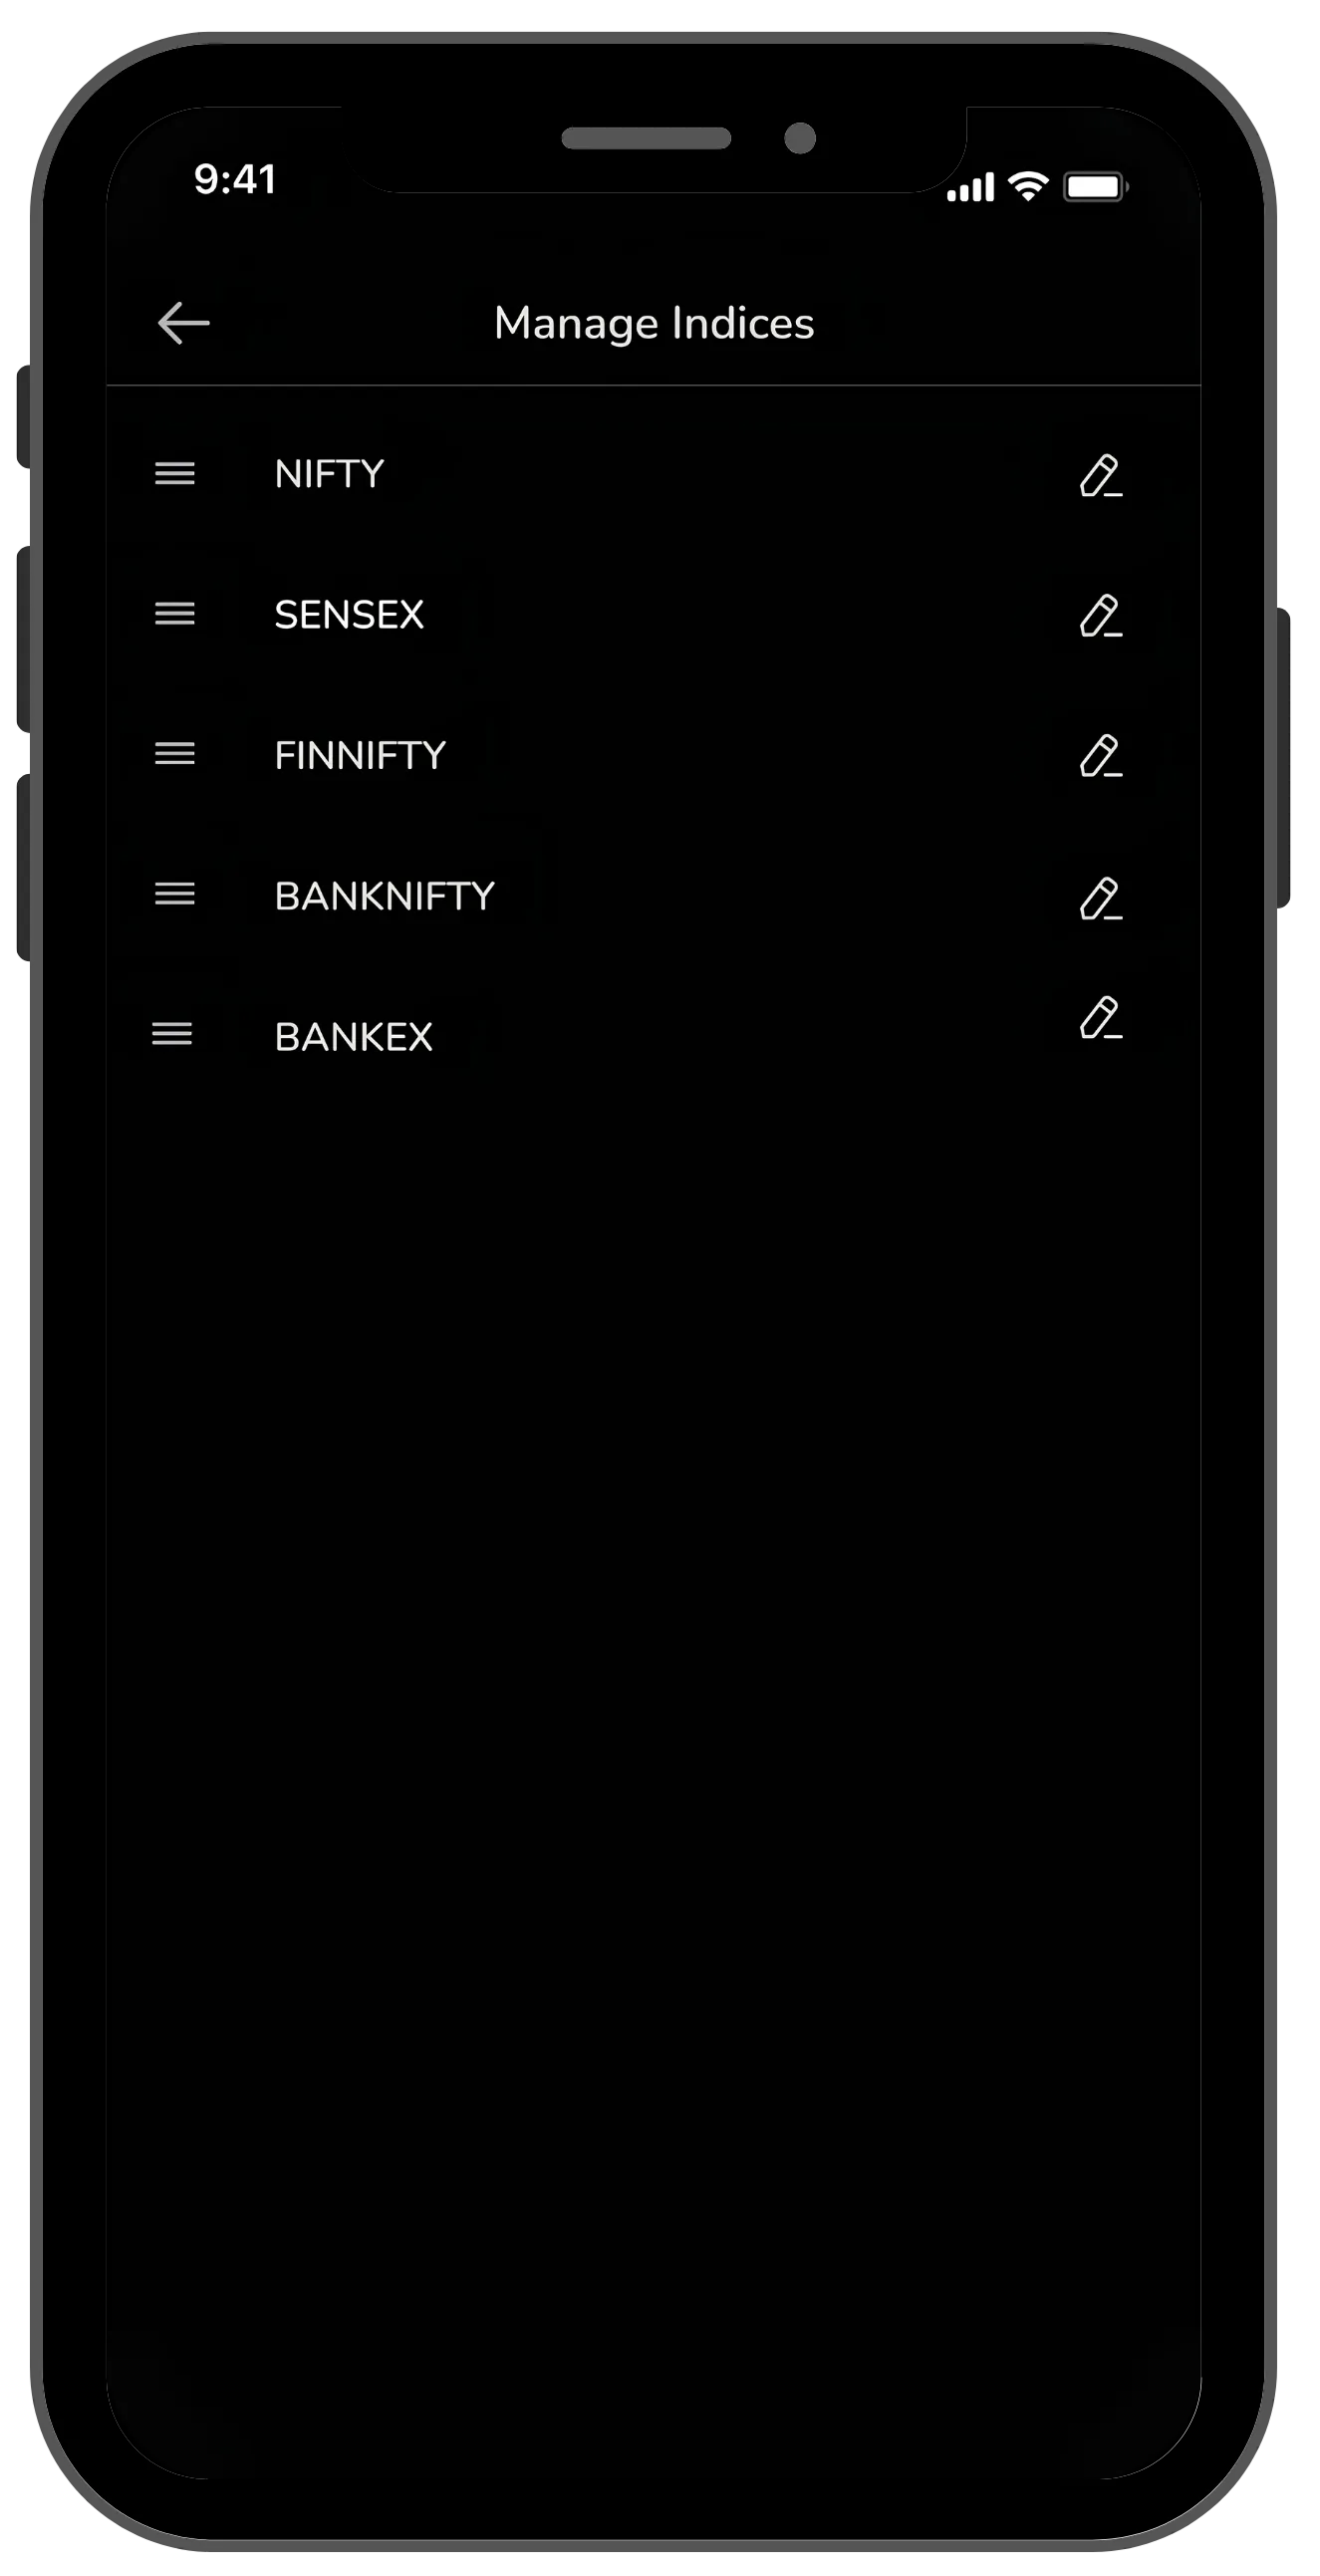
Once you tap into it, the depth becomes clear. You can track advance-decline ratios across NSE and BSE to understand market breadth.
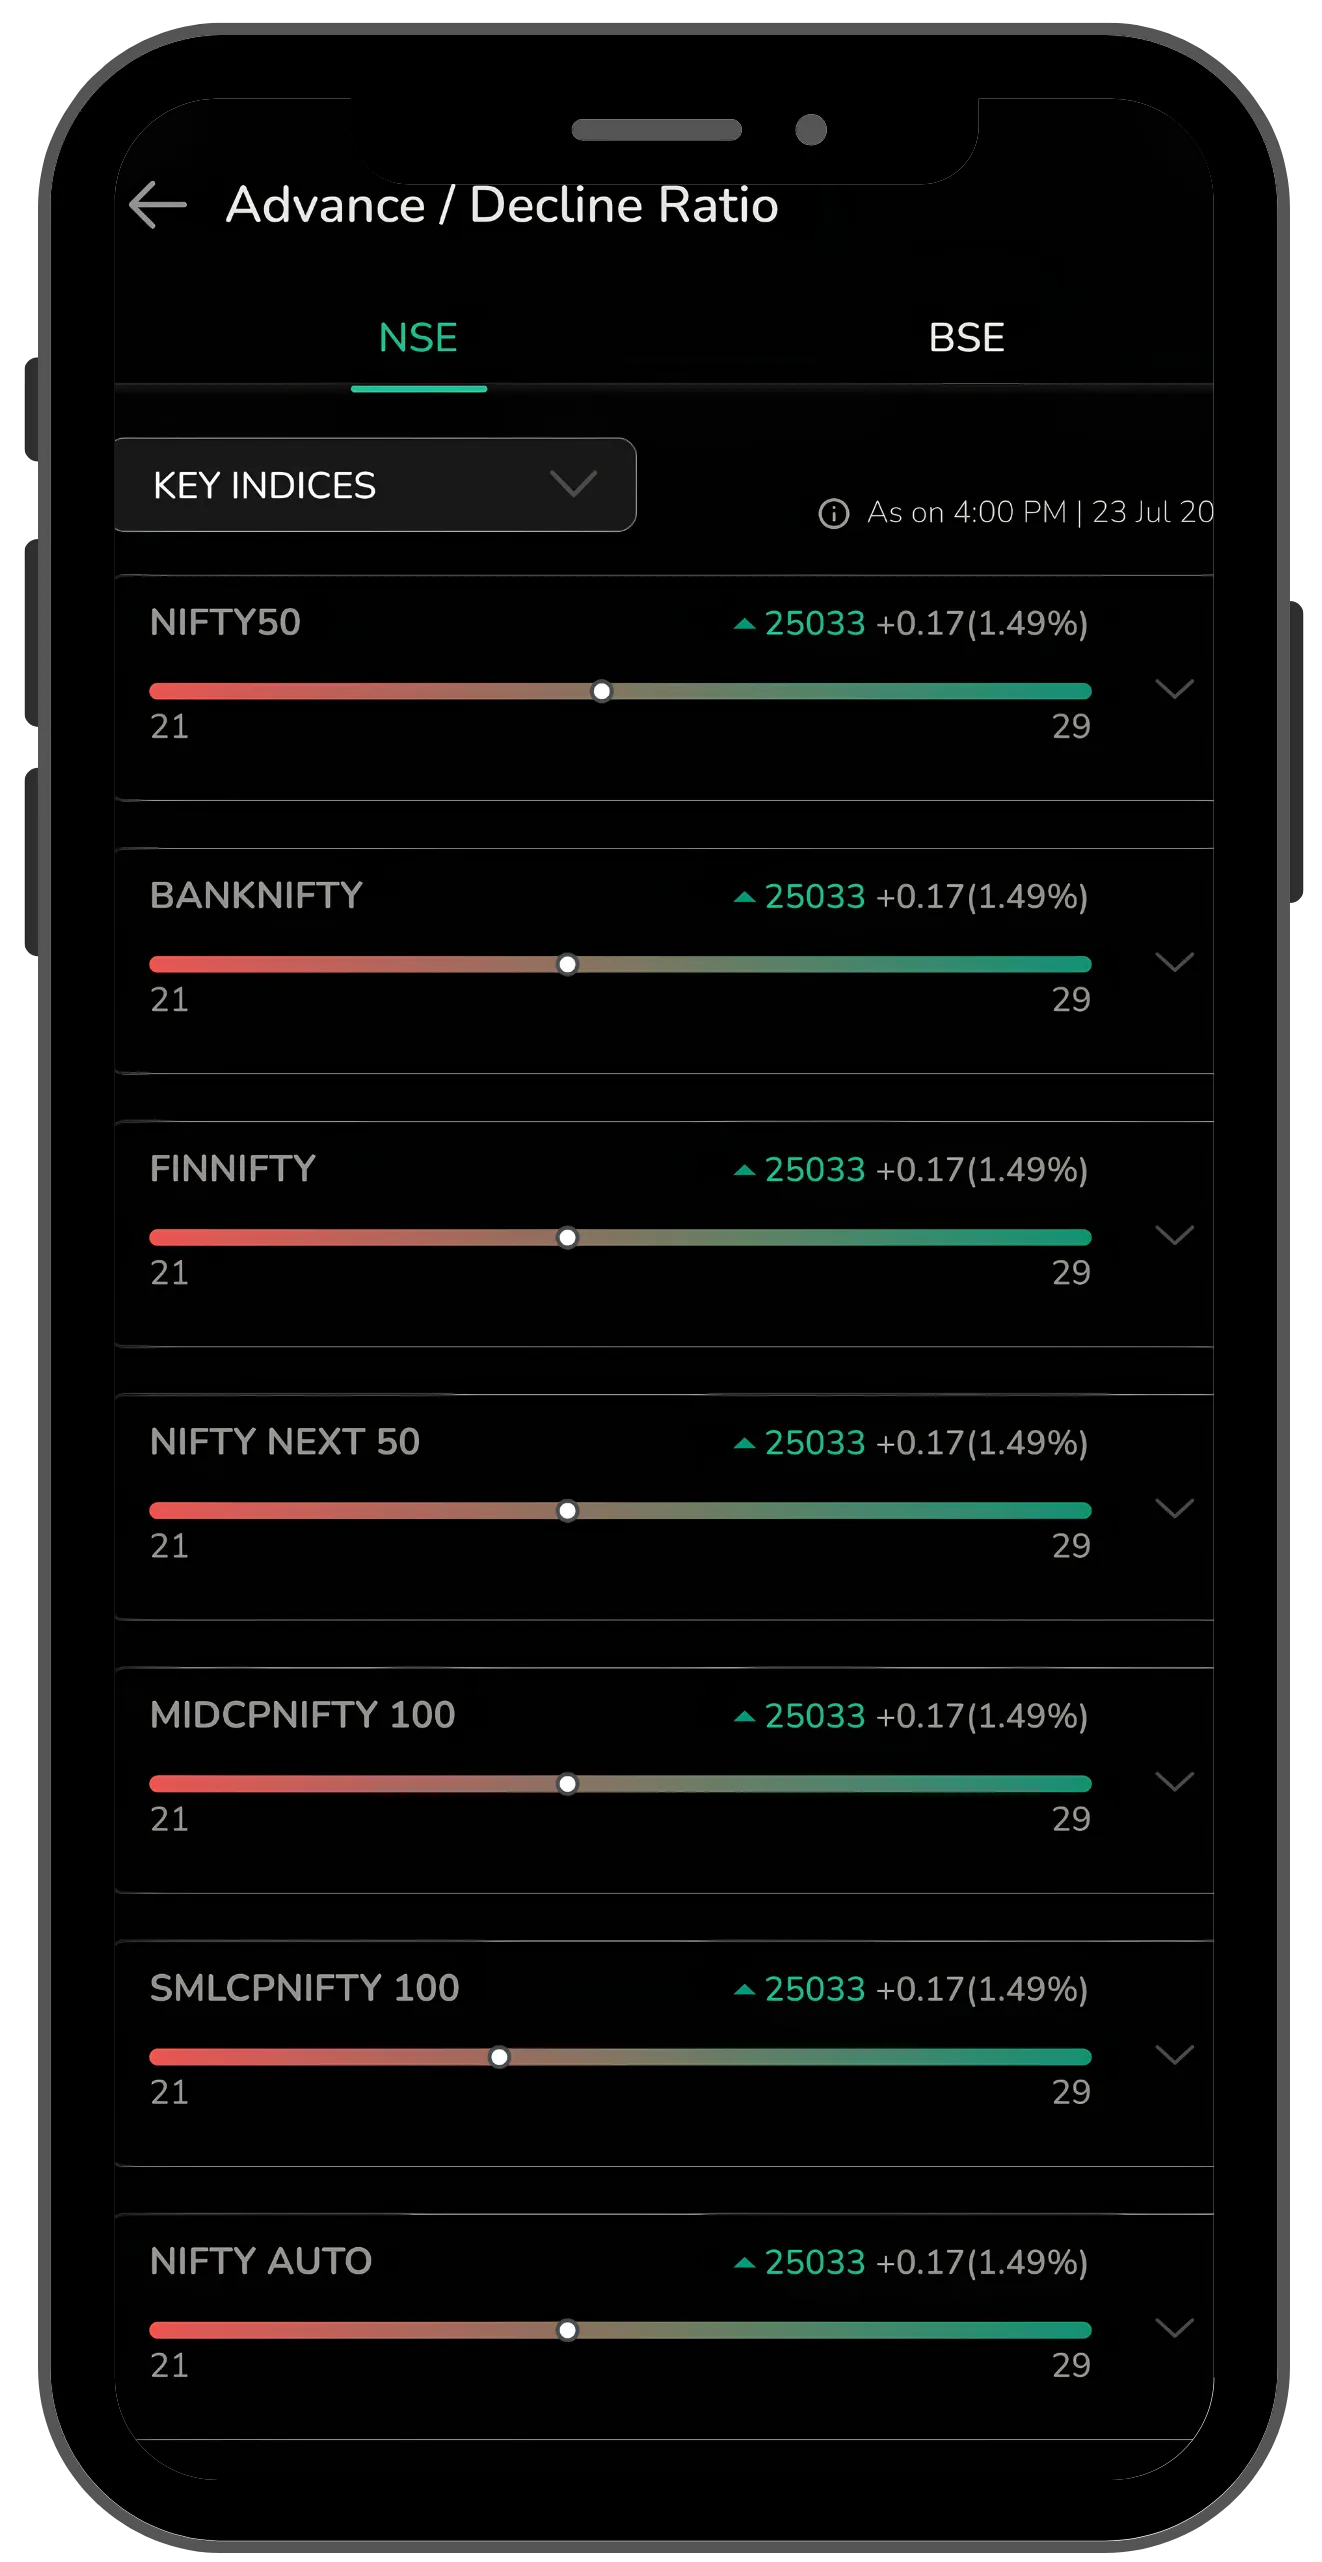
You can switch between timeframes like one day, one week, or one month to see how trends are evolving.
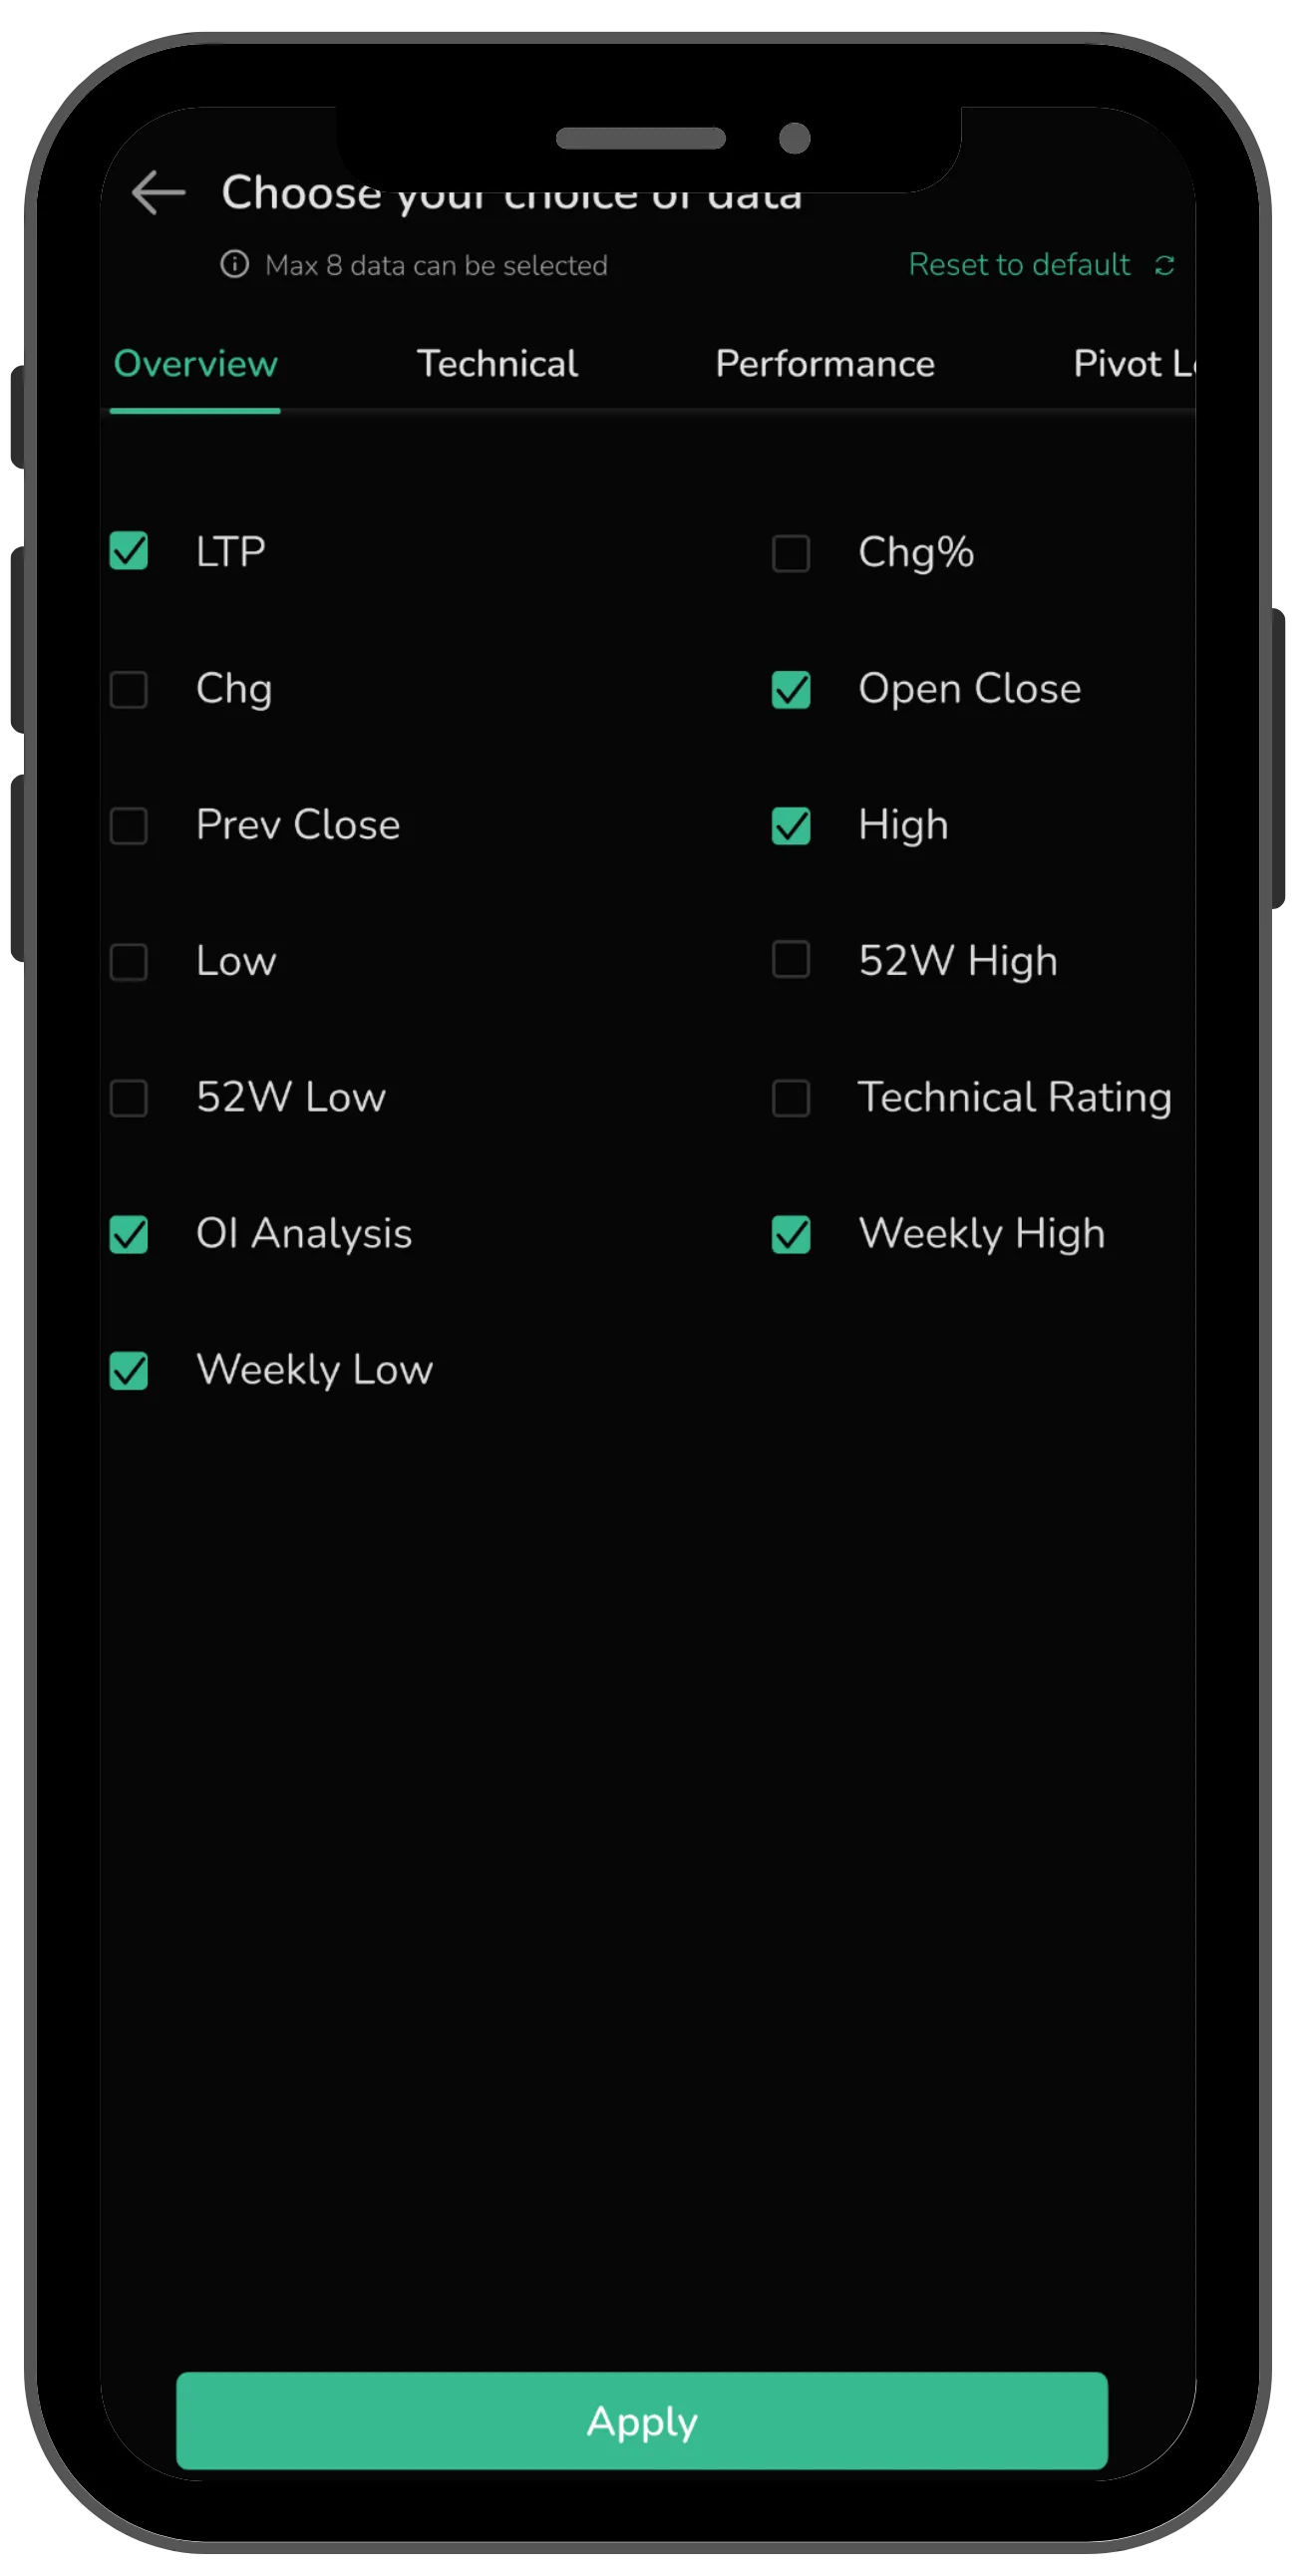
There are also multiple views within the section. Overview lets you customise price-related data points such as 52-week highs and lows.
Technicals allow you to layer indicators like SMA, RSI, and MACD directly into your view.

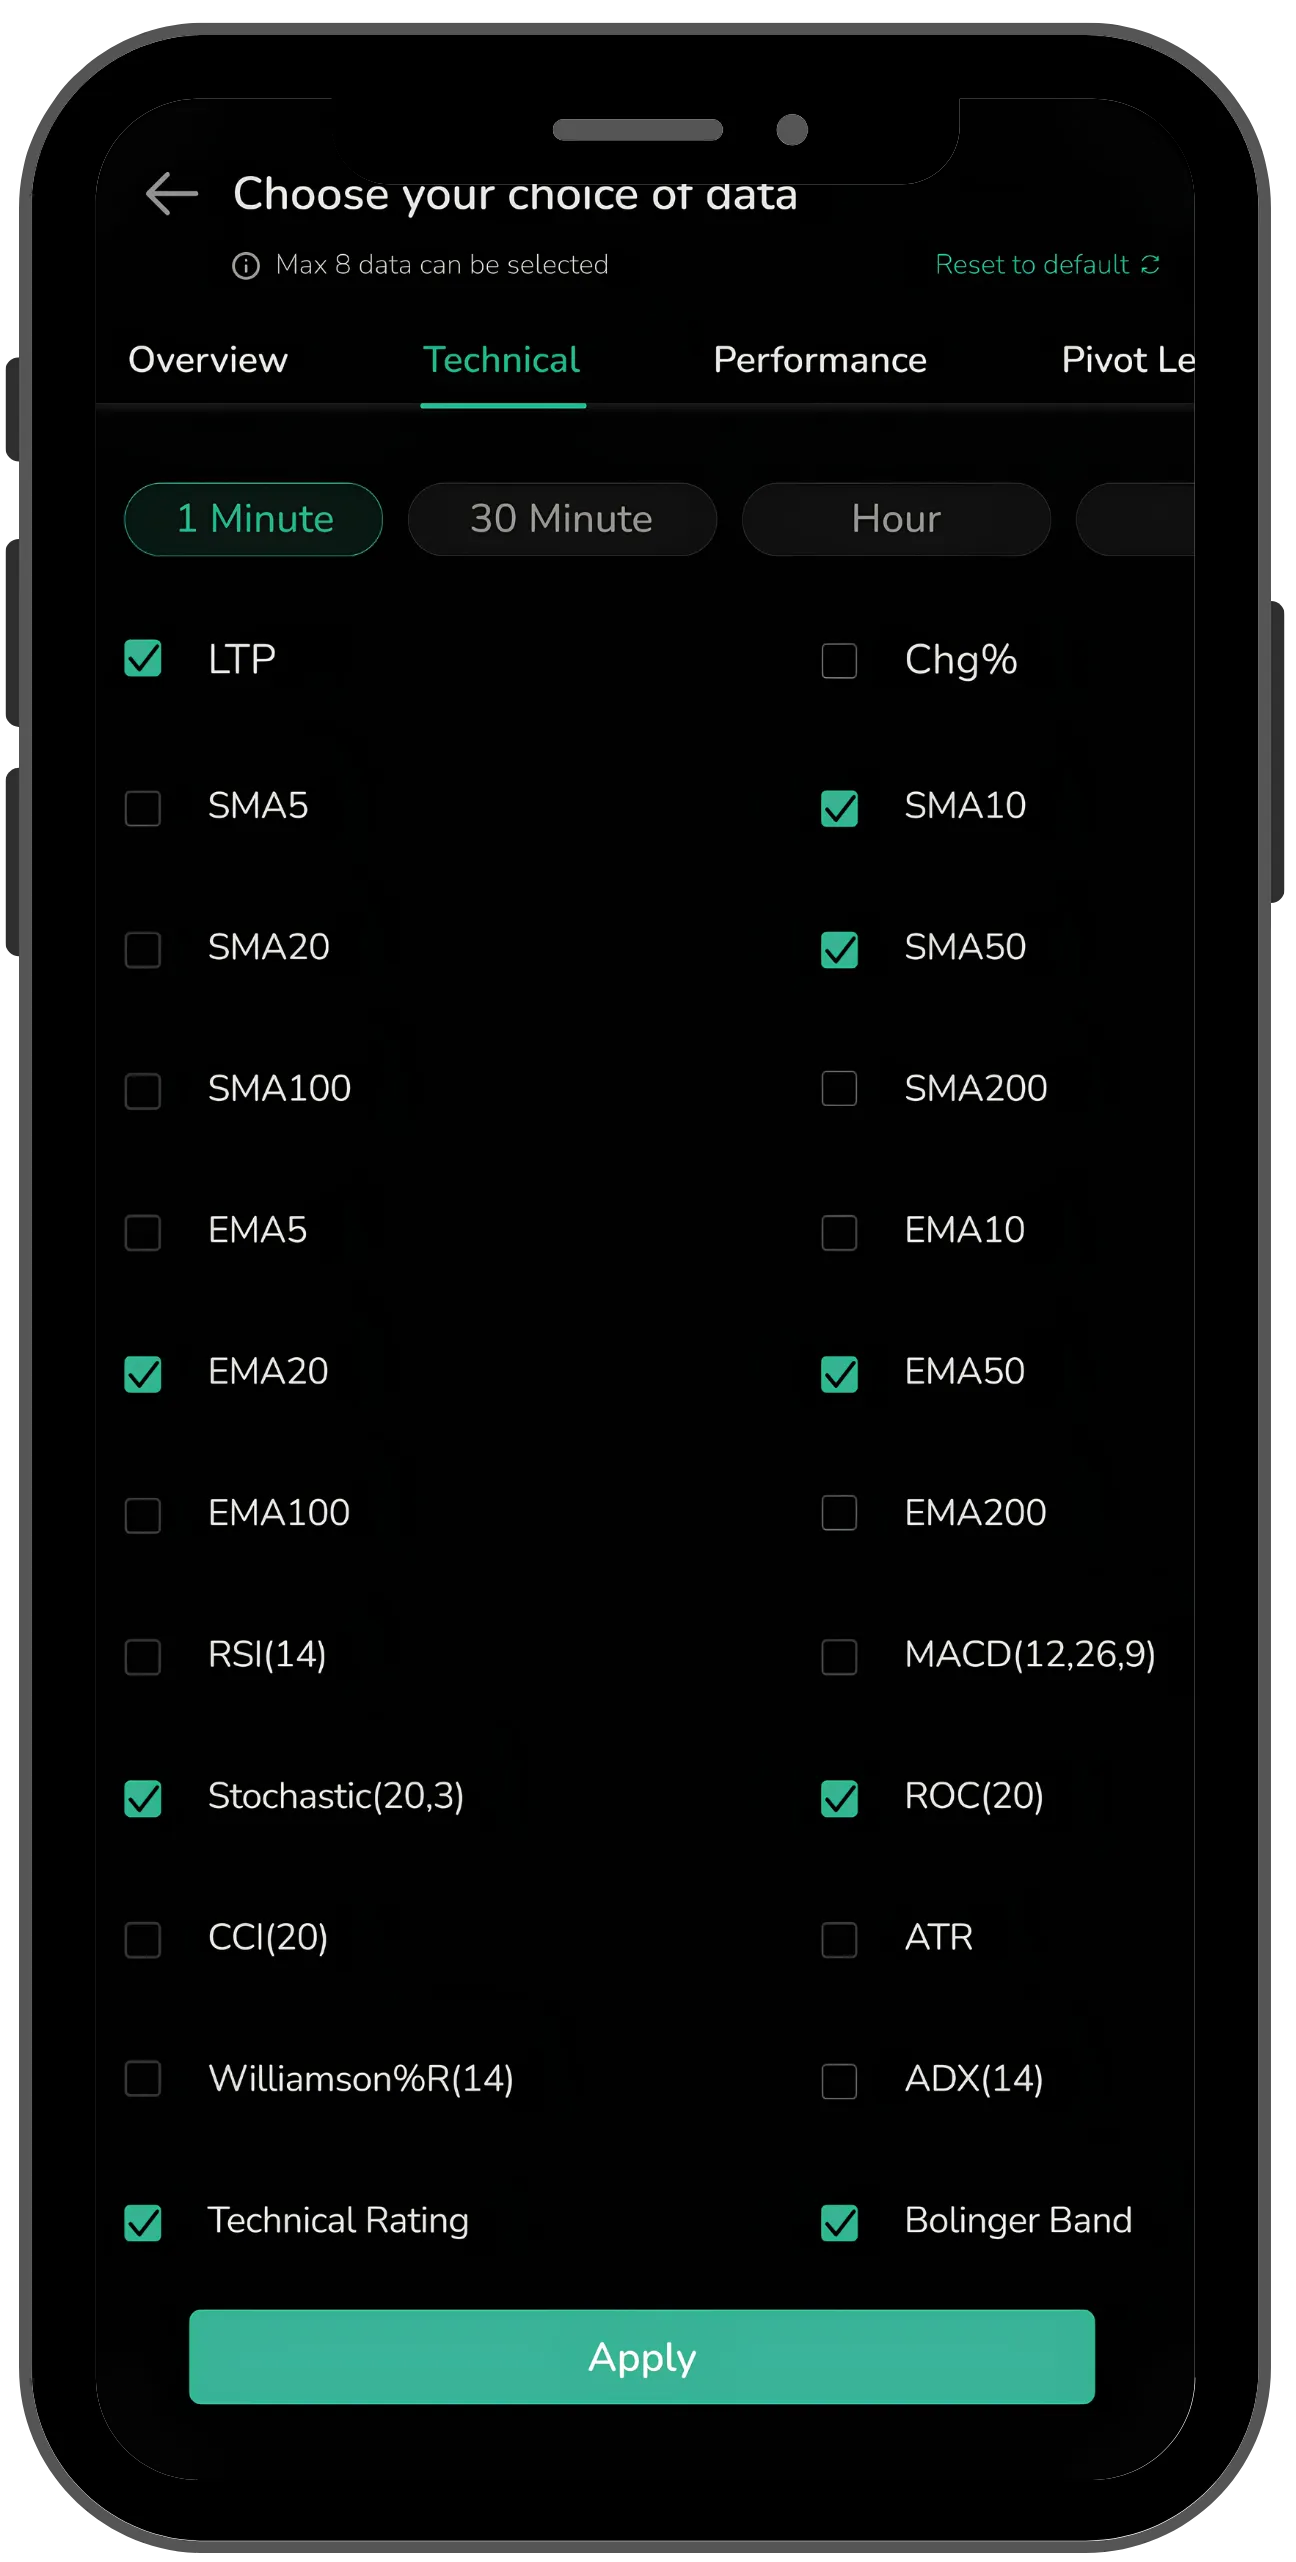
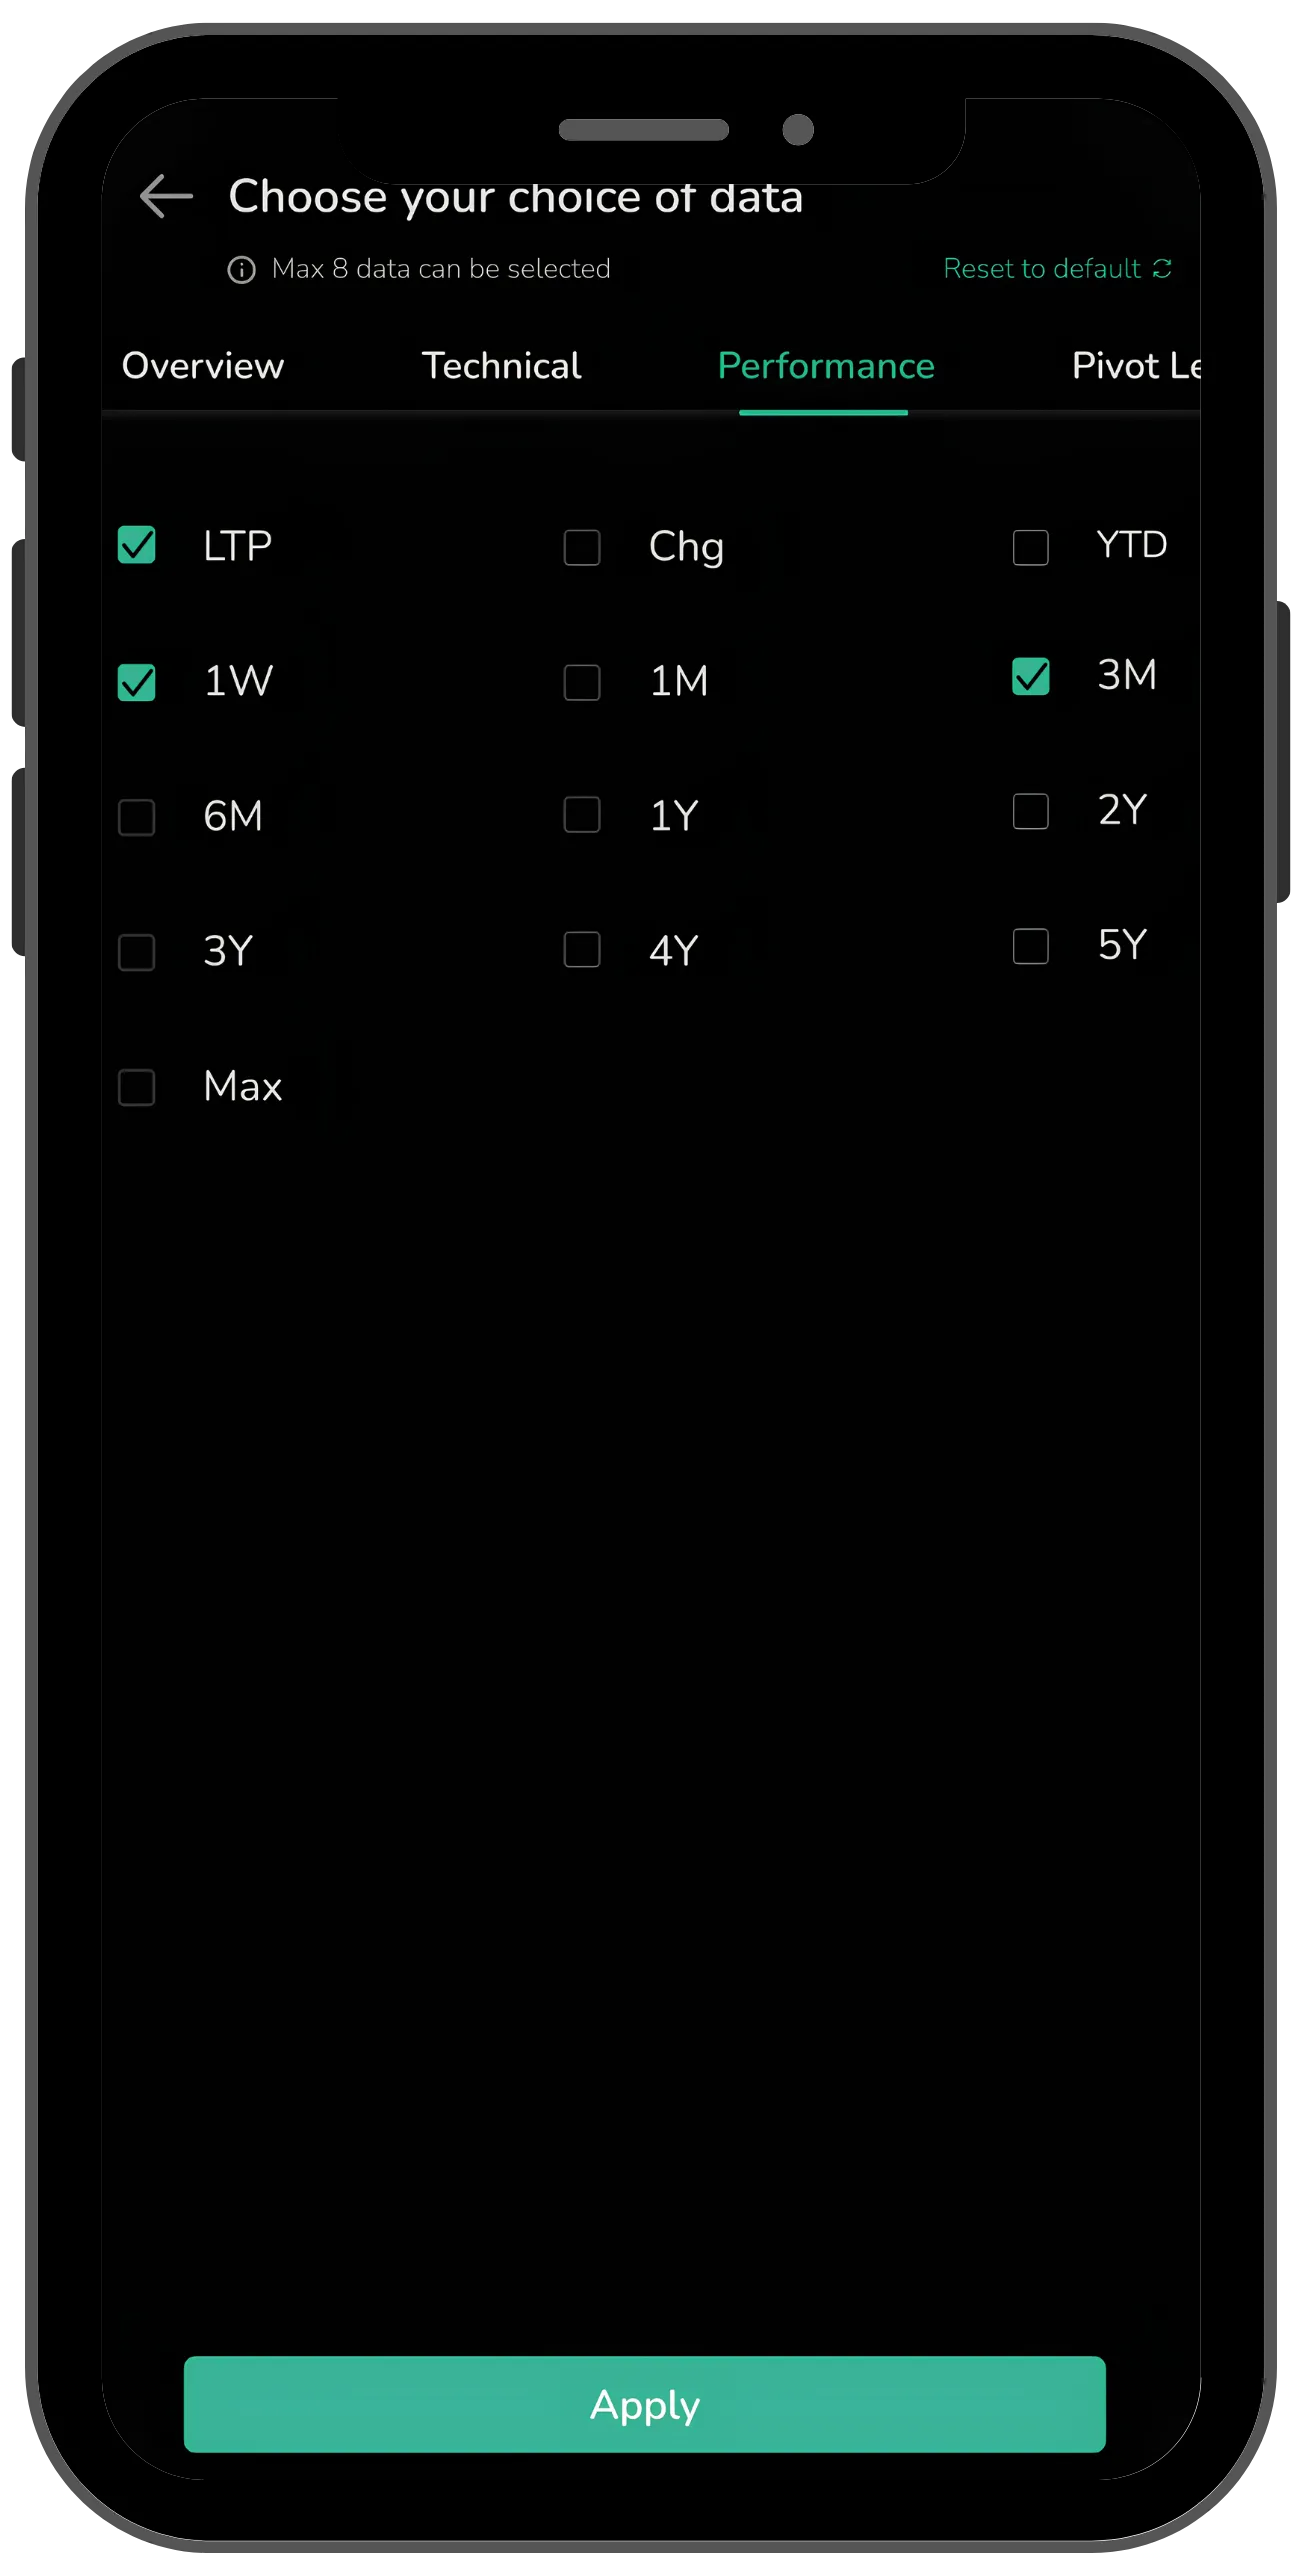
Performance helps you track returns across different periods.
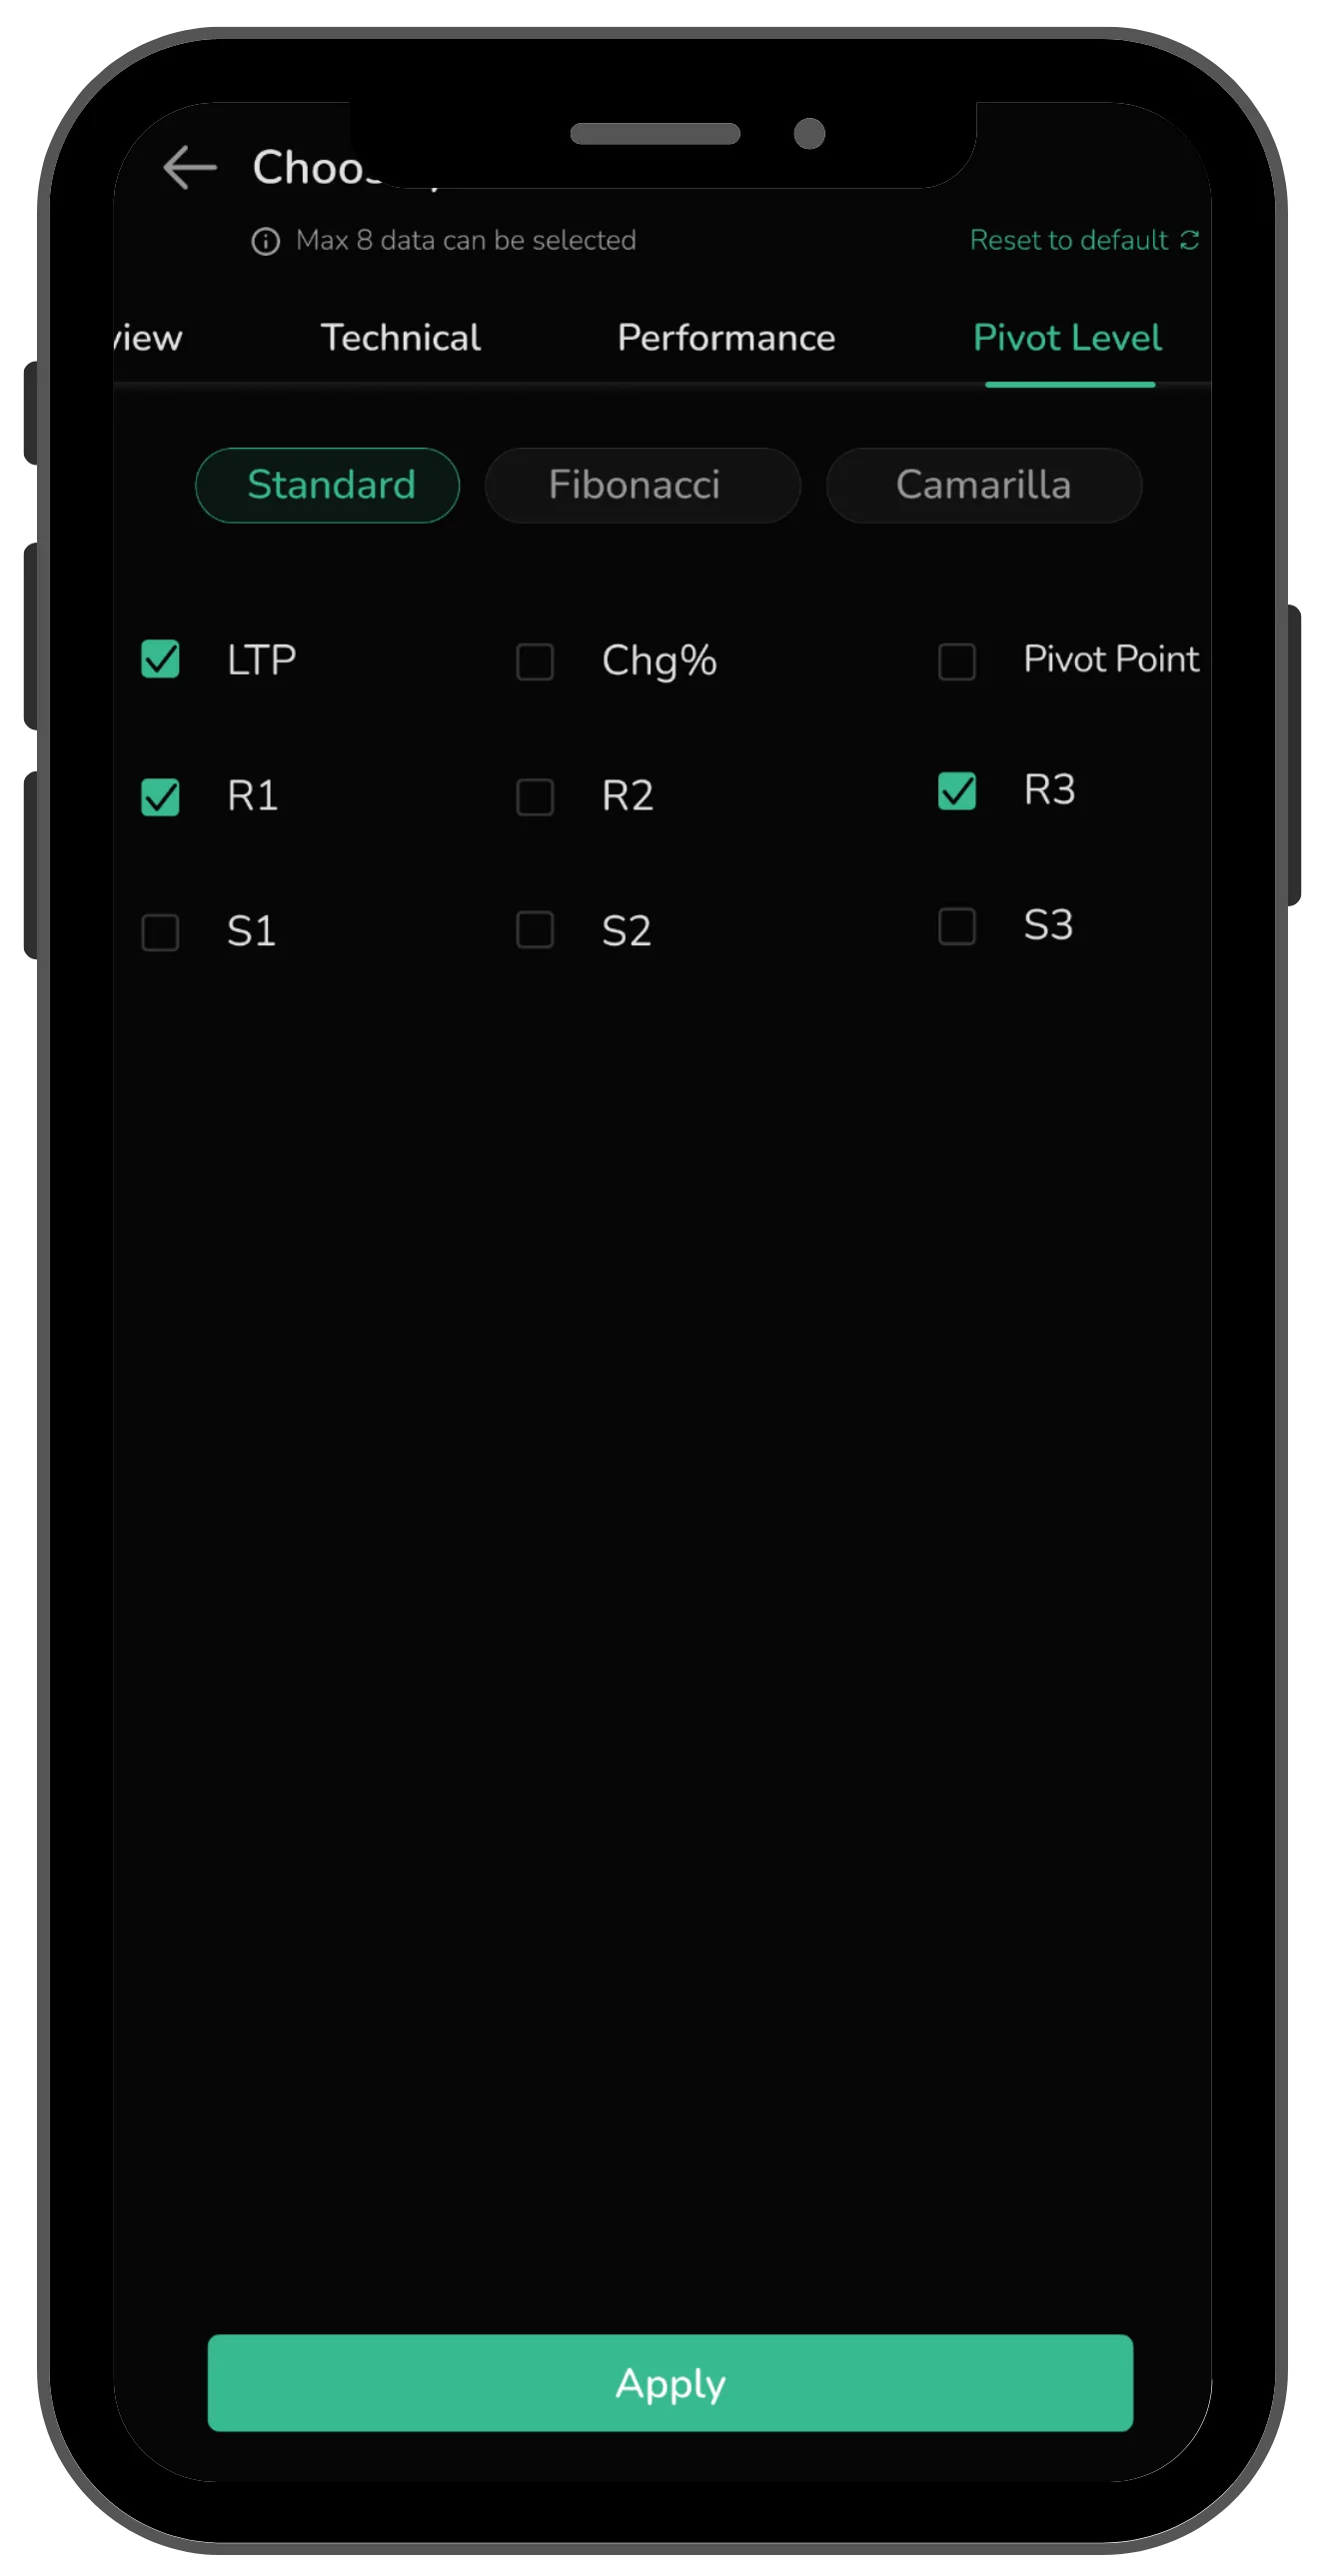
And then there are Pivot Levels. You can switch between Standard, Fibonacci, and Camarilla pivots without opening a separate charting tool. For traders who rely on these levels, having them built into the dashboard saves time and effort.
The foundation of your new CubePlus dashboard is now in place. You have a workspace tailored to your preferences and indices that give you the market clarity you need. But there is more. In Part 2, we look into the tools that active traders rely on most comprehensive research, scans, and signals, all built into your home screen.
Disclaimer: The information provided in our blogs is for informational purposes only and should not be construed as financial, investment, or trading advice. Trading and investing in the securities market carries risk. Always conduct your own research and consult with a qualified financial advisor before making any investment decisions. Past performance is not indicative of future results. Copyrighted and original content for your trading and investing needs.
© 2026 — Tradejini. All Rights Reserved.

%252FCubePlus%2520Mobile%2520App%2520Just%2520Got%2520a%2520Major%2520Upgrade%2520Thumbnail.webp%3Falt%3Dmedia%26token%3Df6c2f1ef-cbe8-49e2-82fb-7b3d8c242e09&w=3840&q=75)
%252FCubePlus%2520Mobile%2520App%2520Just%2520Got%2520a%2520Major%2520Upgrade%2520Blog%2520Thumbnail.webp%3Falt%3Dmedia%26token%3D9ad93fae-ed5a-42b8-9e64-3cd011416a87&w=3840&q=75)