


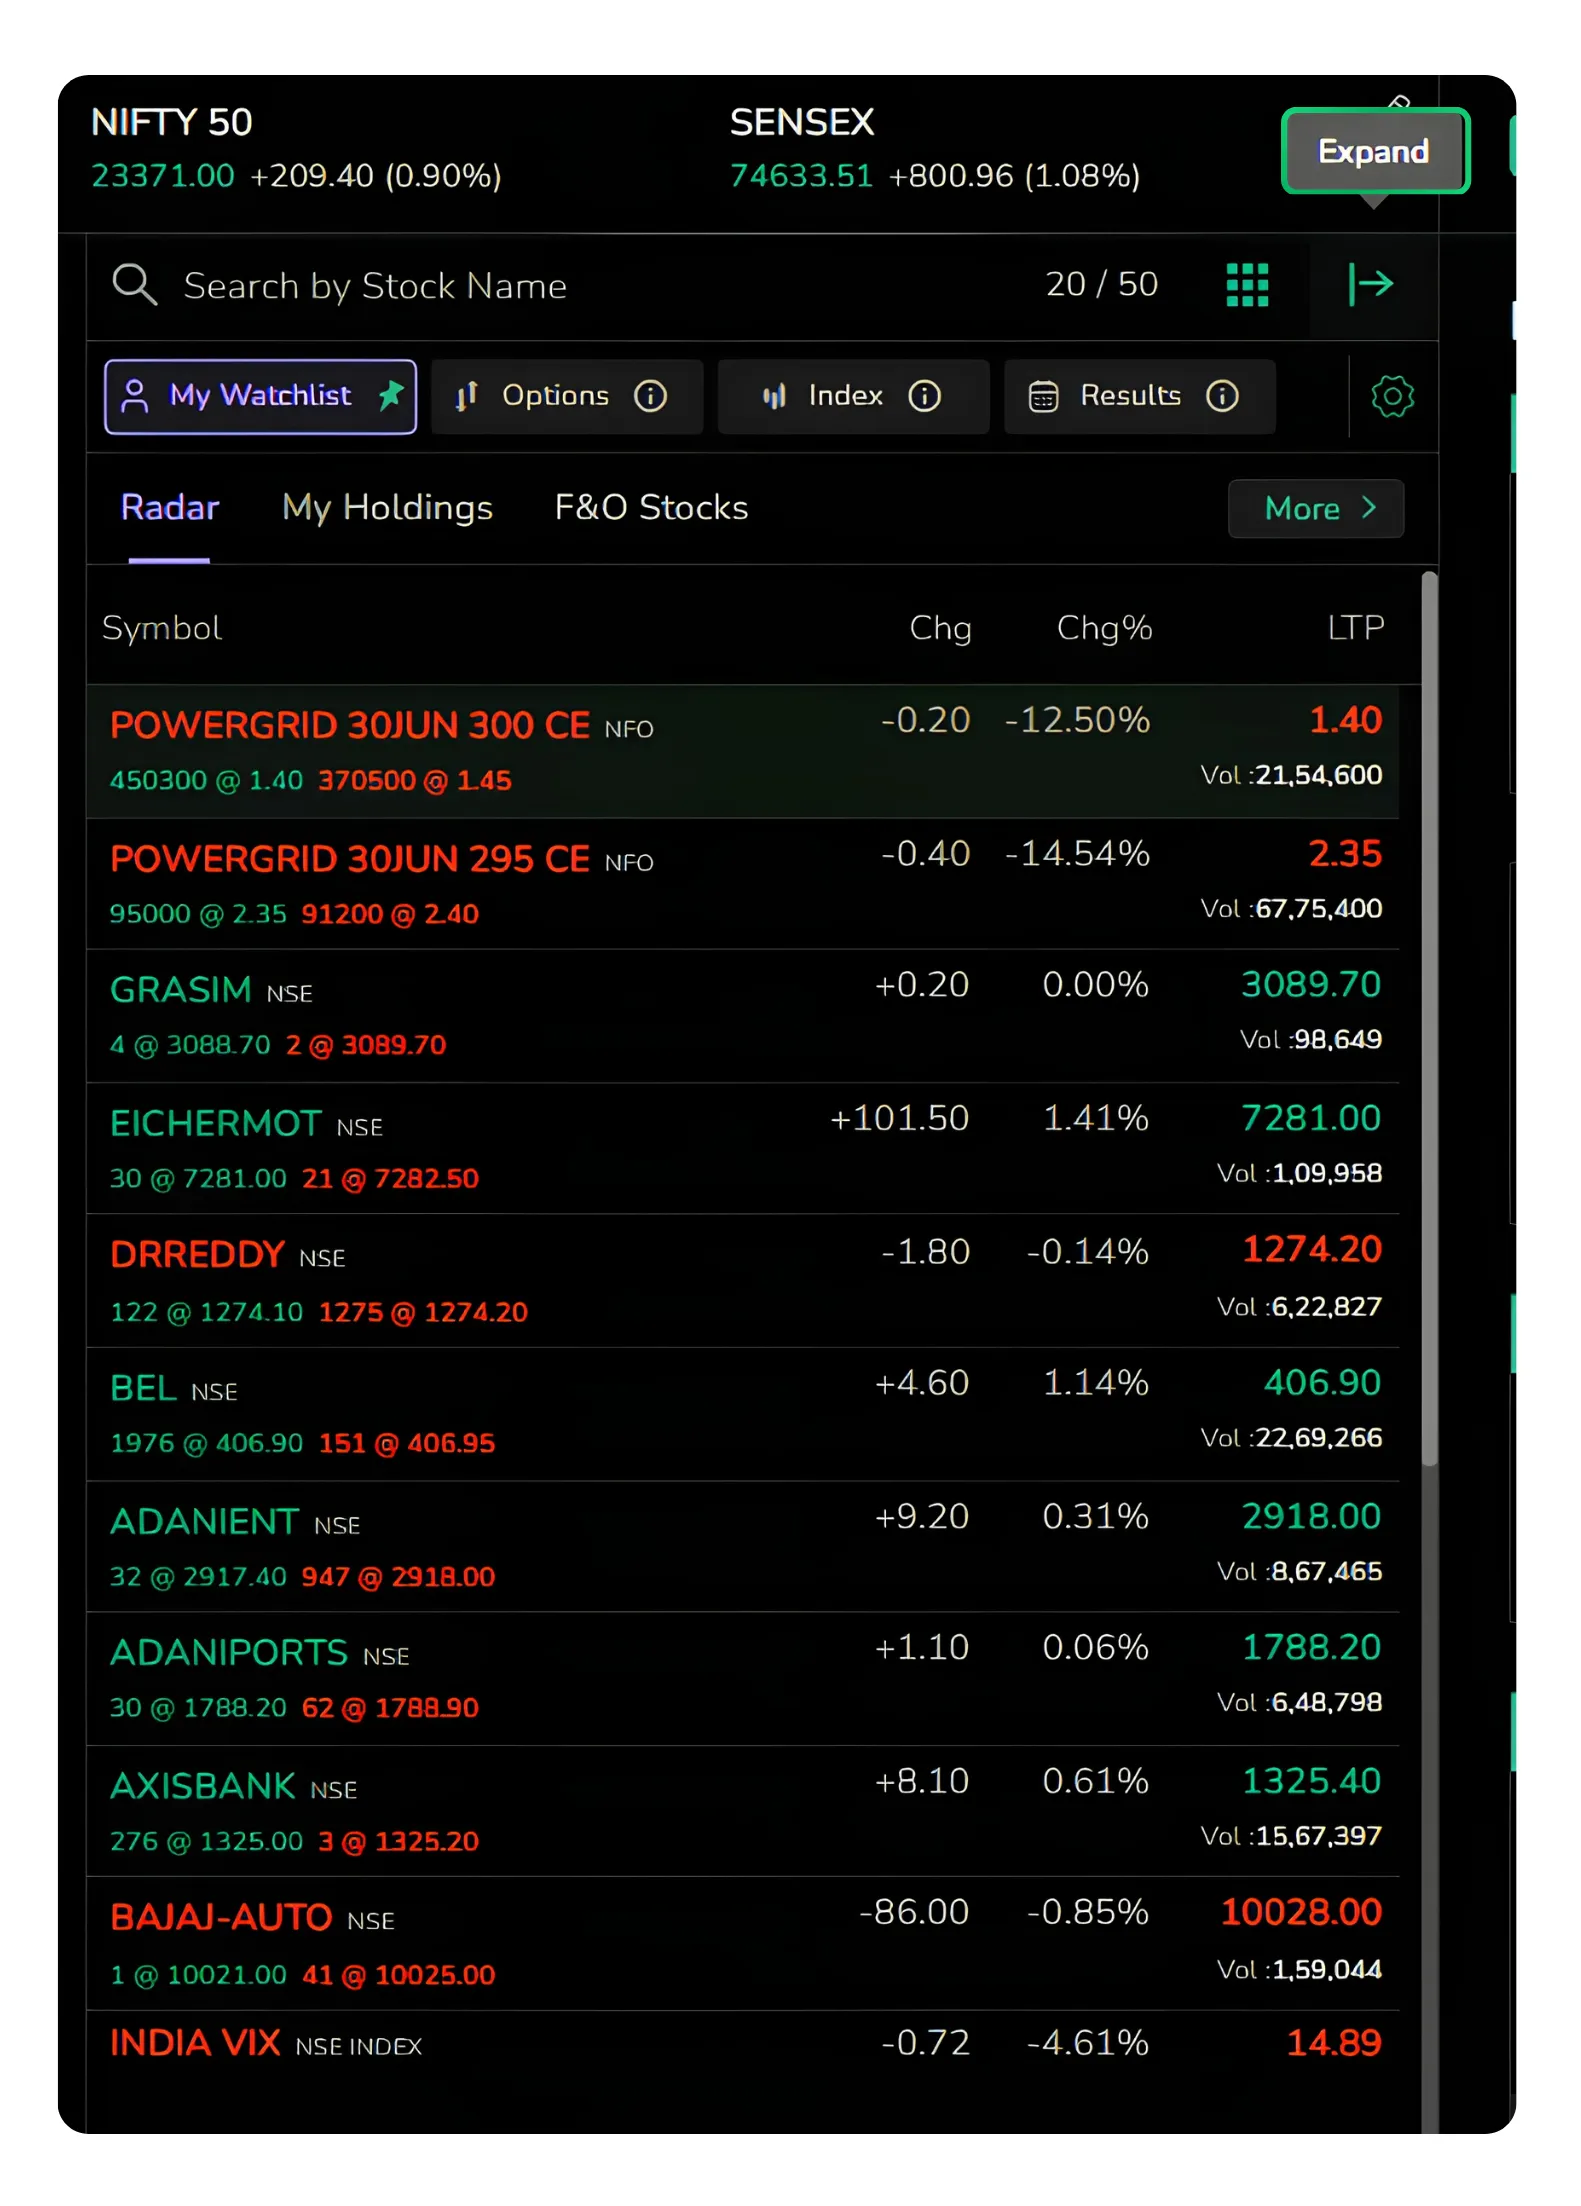
The watchlist on the CubePlus web platform has been reorganised. The menu that earlier sat at the bottom of the screen has moved to the top, and the tools traders reach for through the day now sit together in a single panel. Watchlists, options data, index constituents and the earnings calendar are no longer spread across different corners of the screen. Everything opens from one row of tabs, which means less scrolling and fewer clicks to reach the number you are looking for.
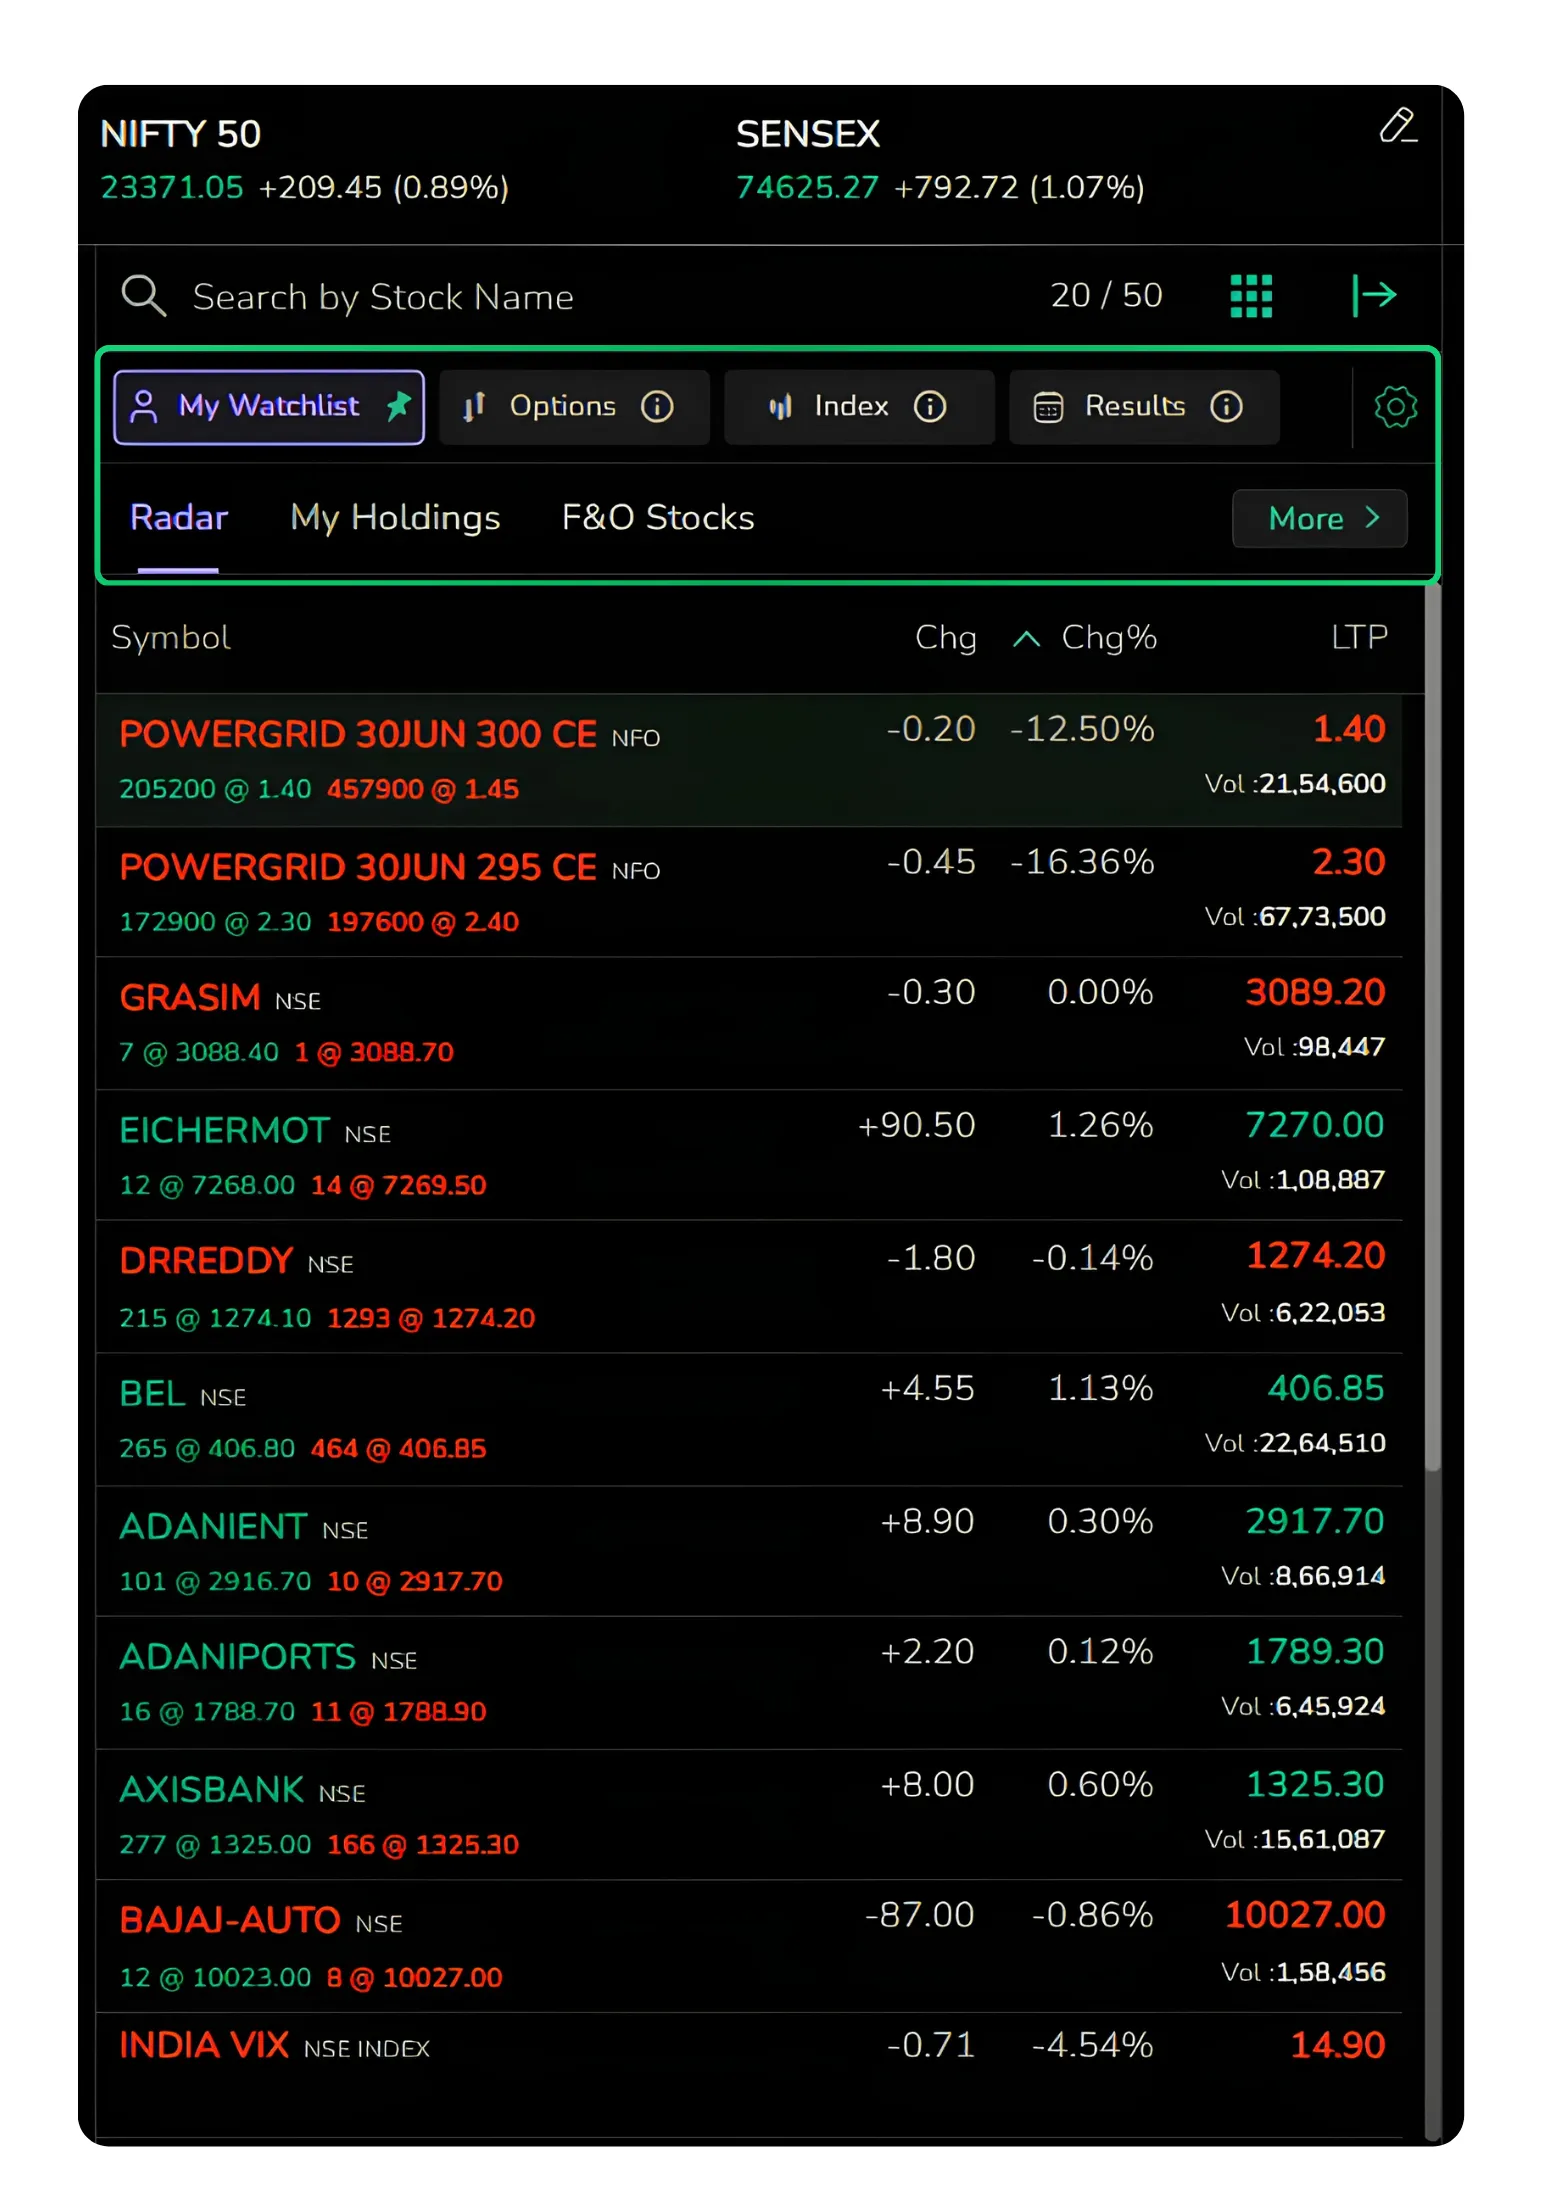
Running across the top of the panel are the live Nifty 50 and Sensex levels, a search bar, and four tabs that organise the entire view: My Watchlist, Options, Index and Results. A settings icon and a heatmap icon sit on the right. What follows is a walk through each part and how it is used.
You can expand the watchlist at any point by clicking the expand icon at the top right corner, which opens a cleaner, fuller view of whatever section you are in.
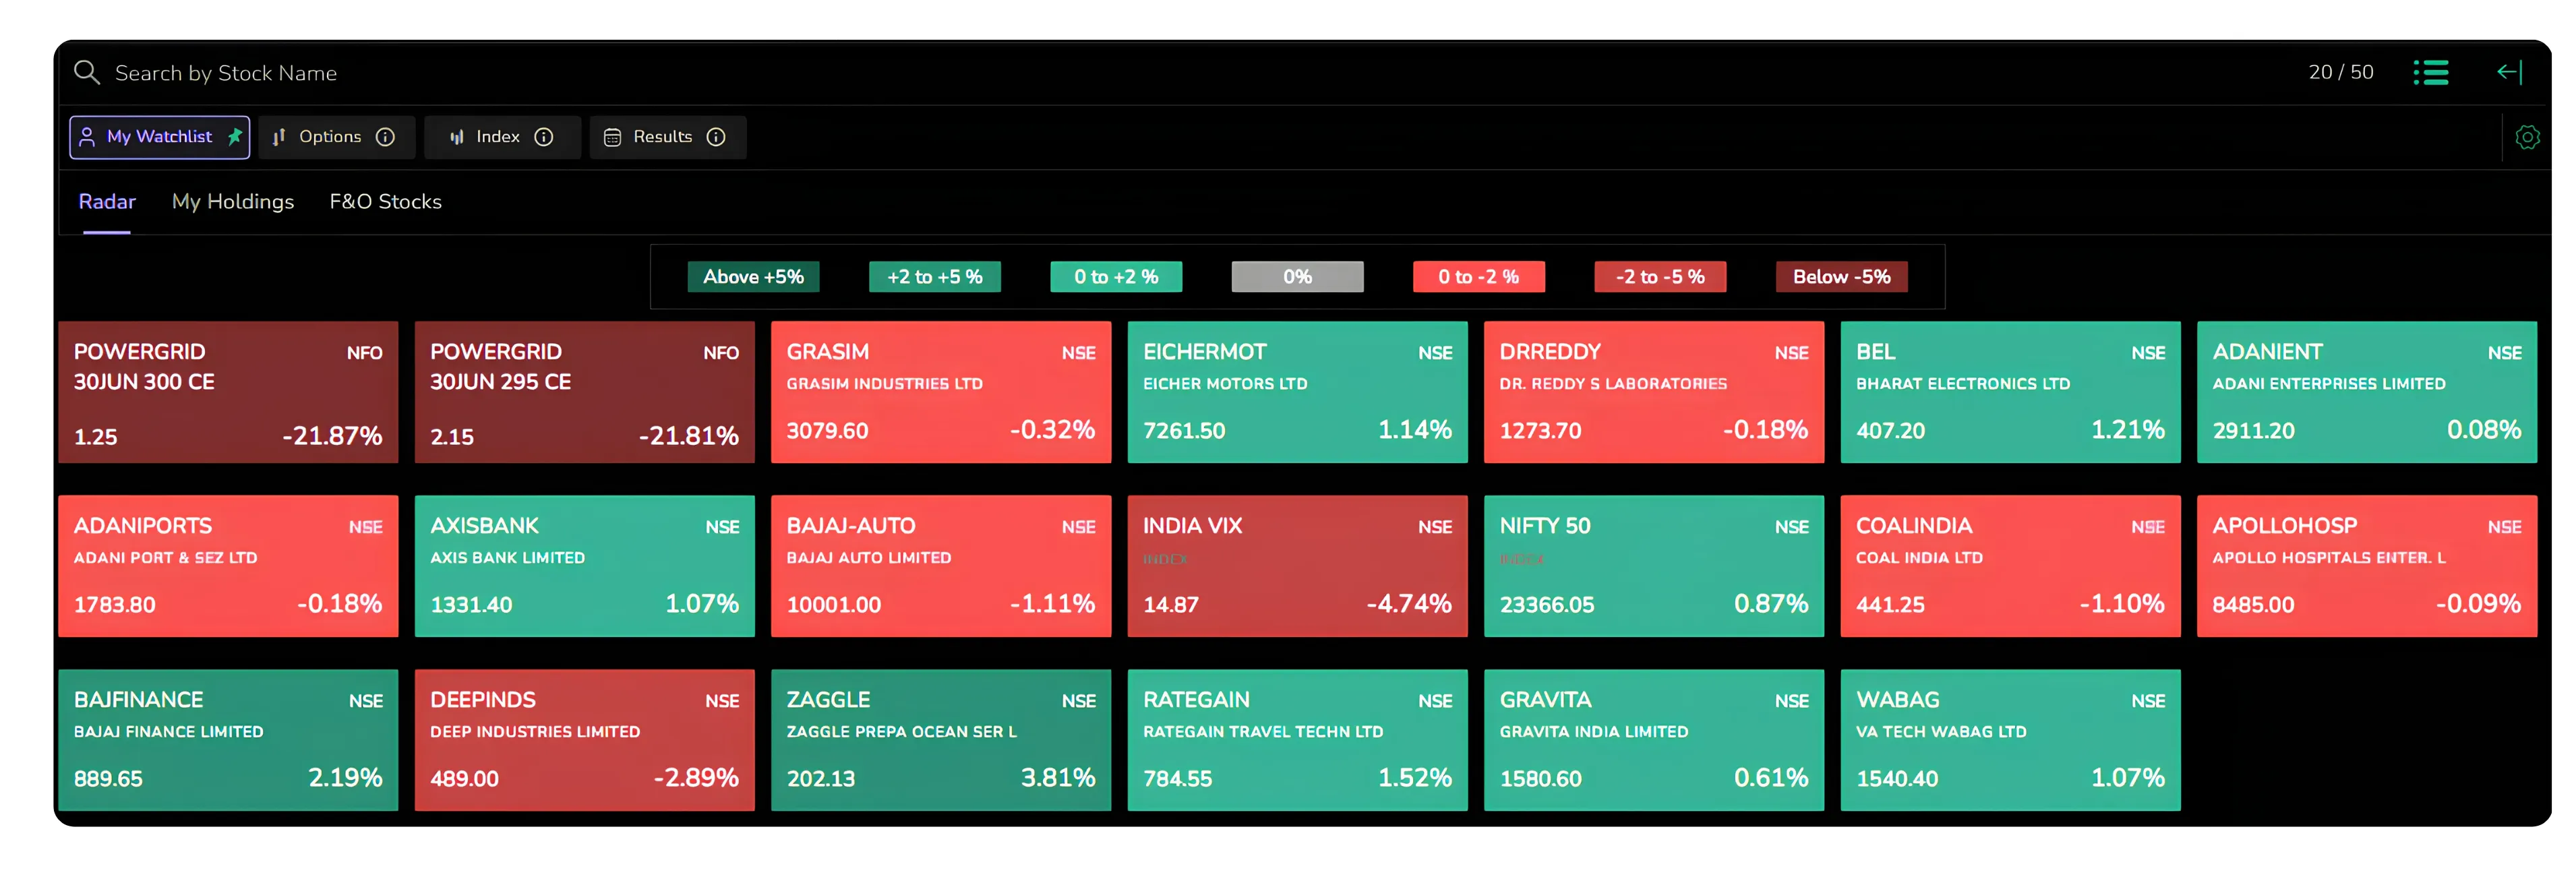
My Watchlist
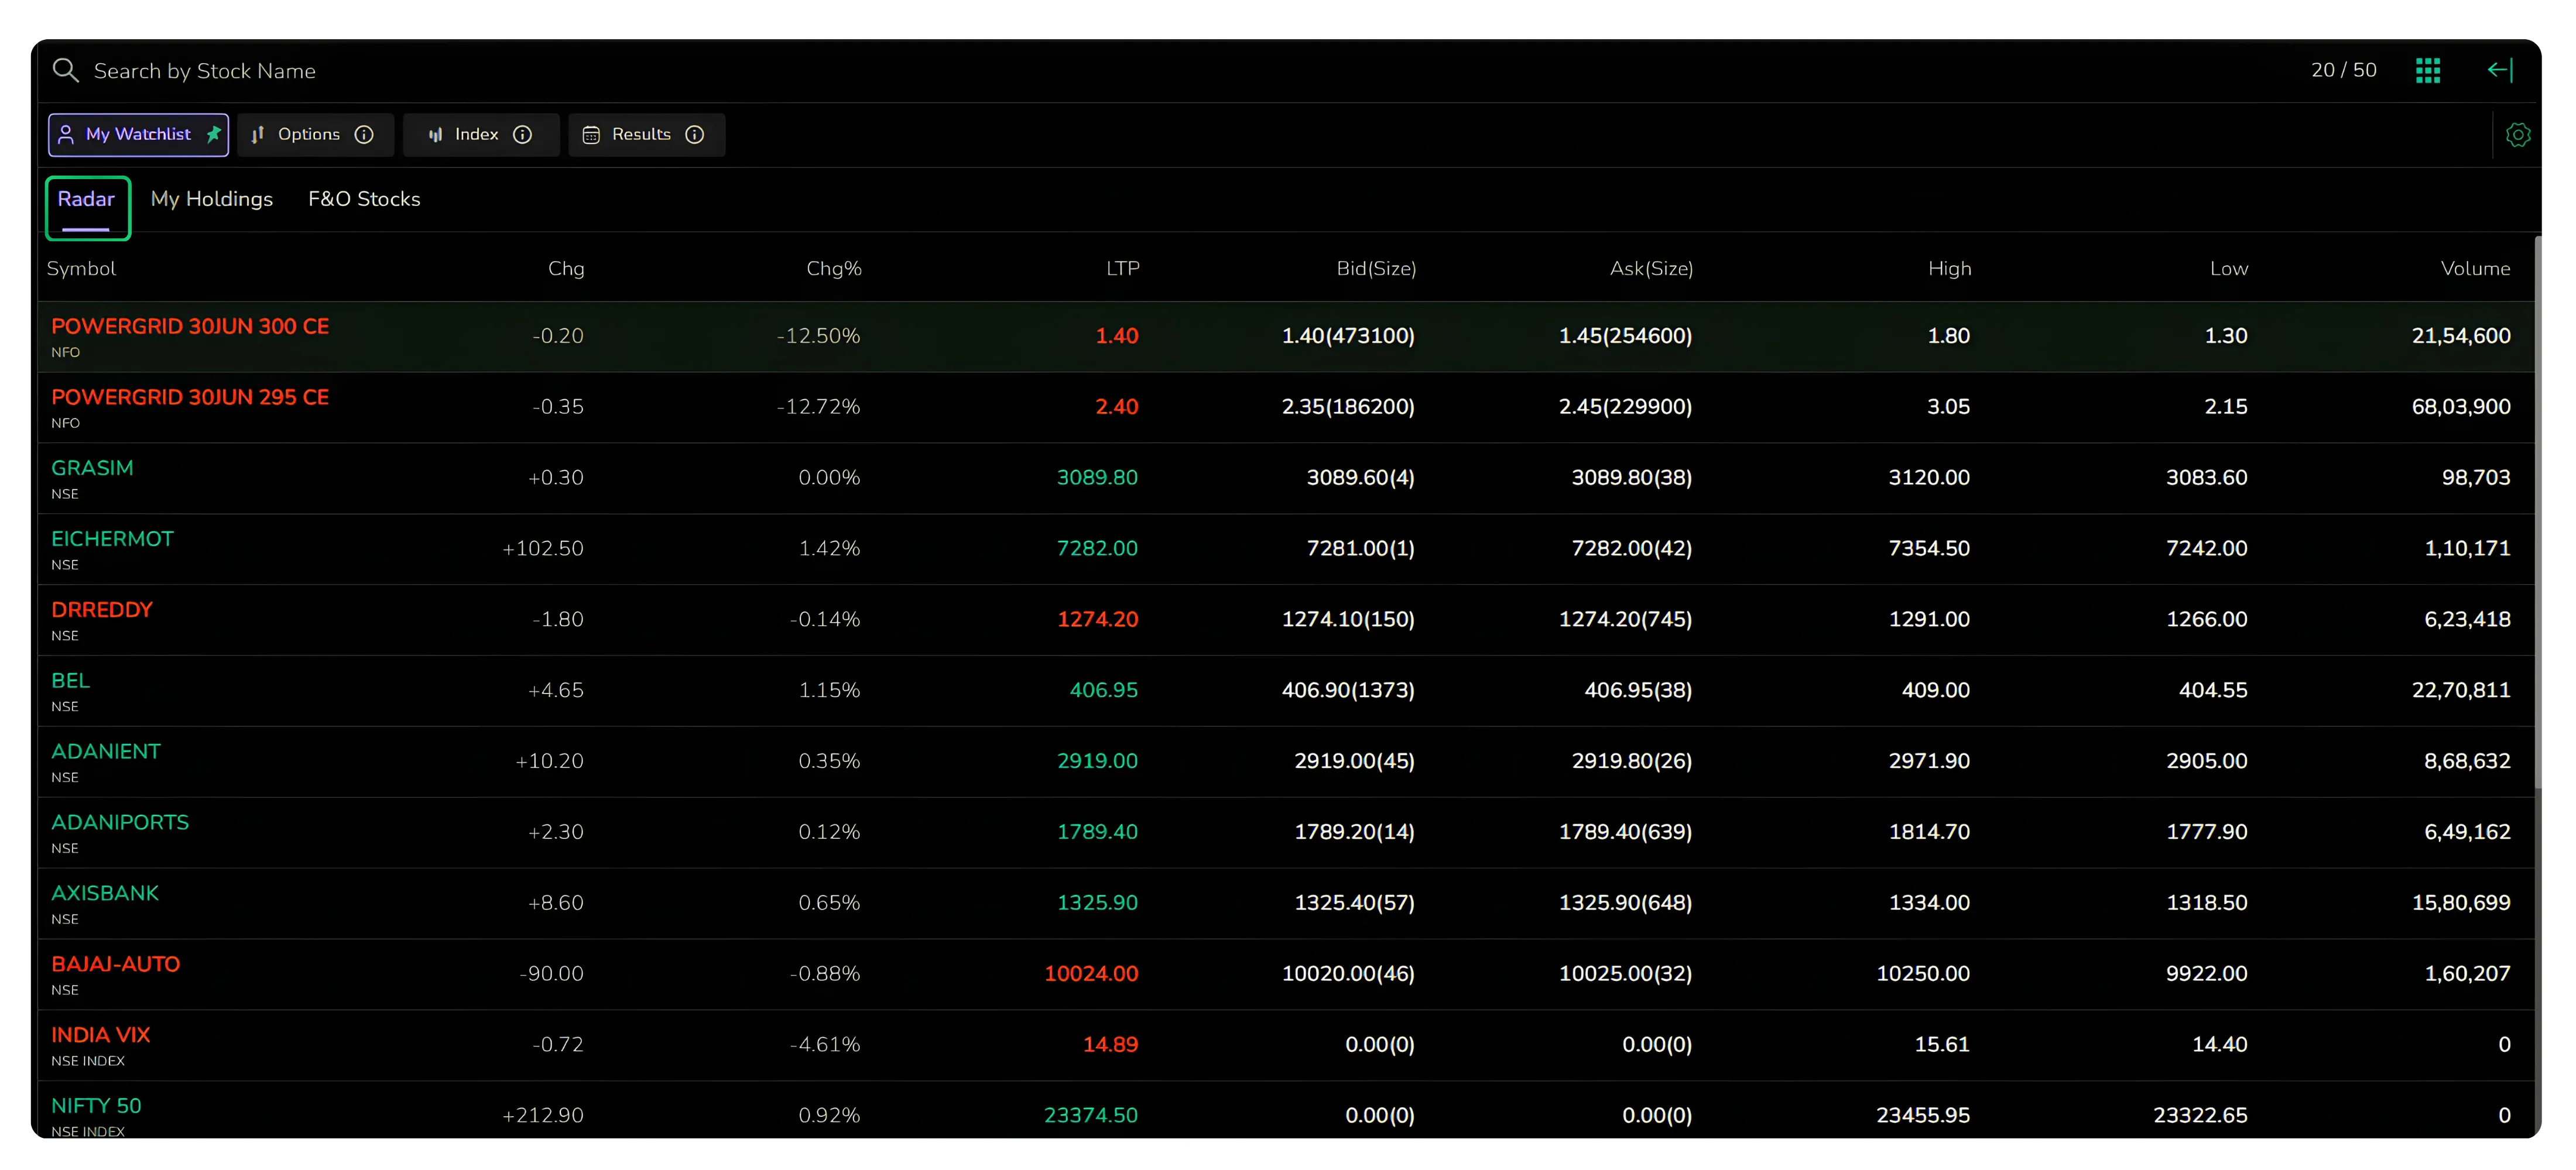
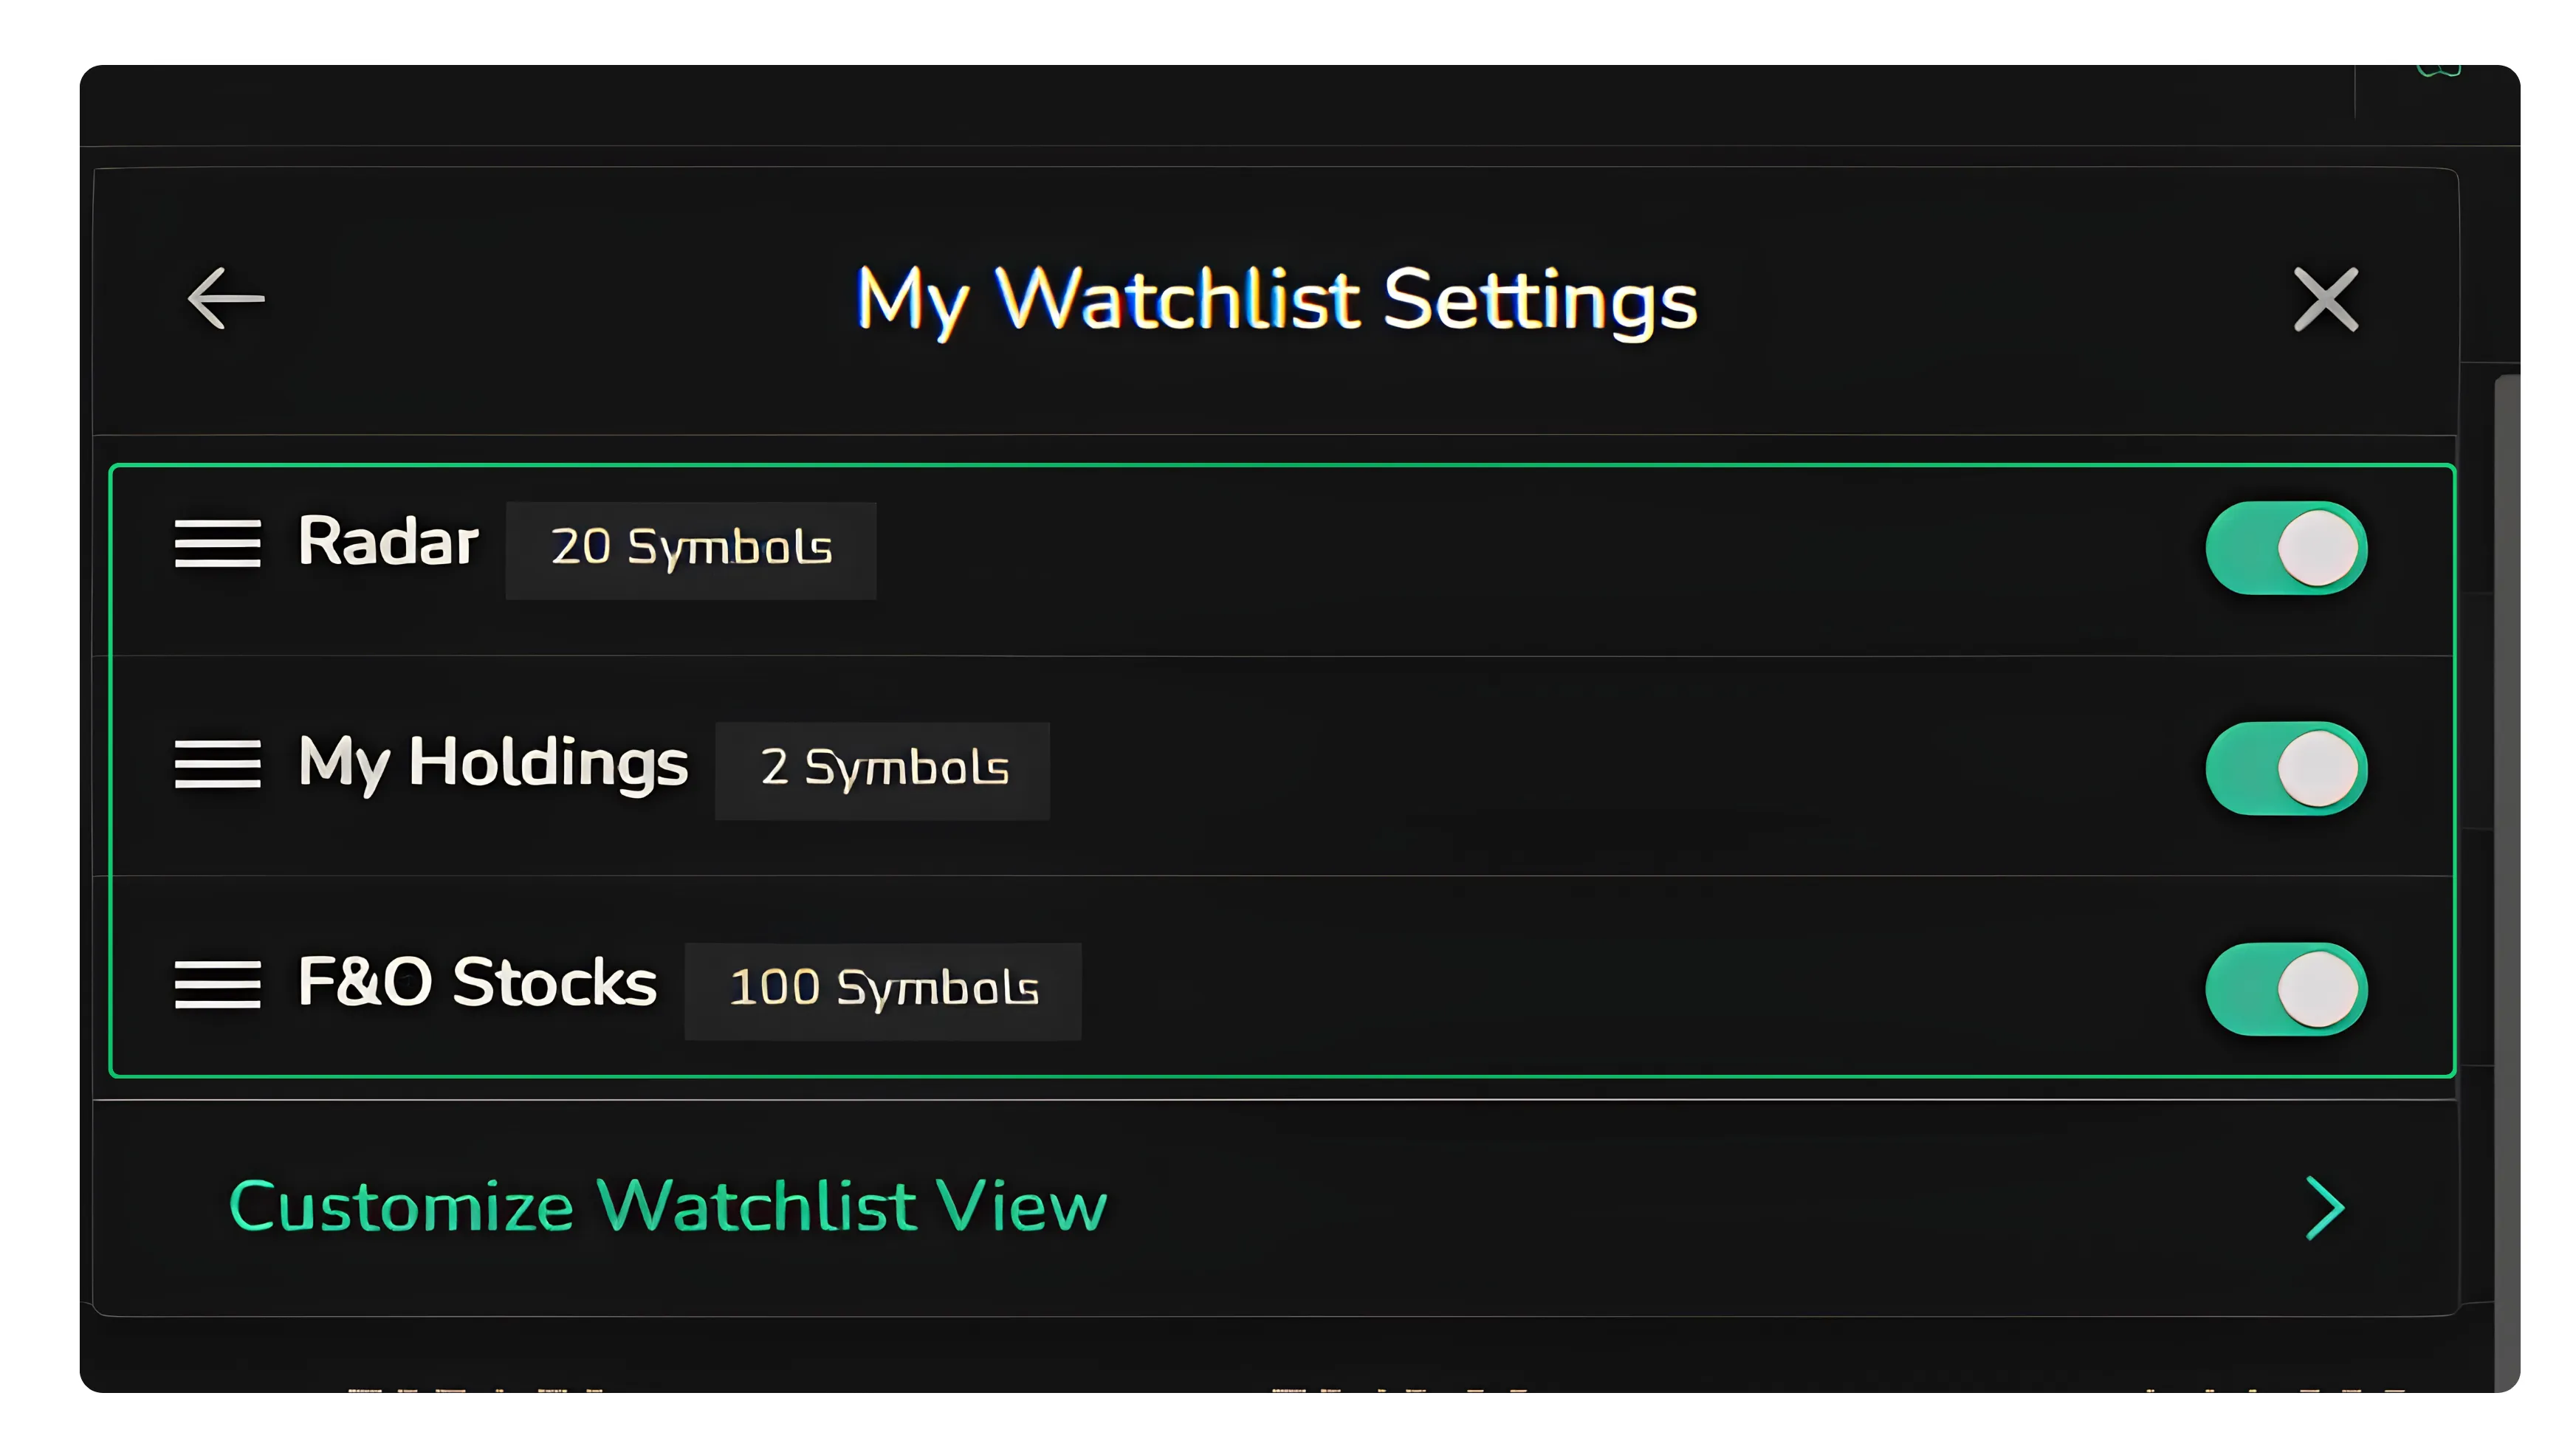
This is the home for the Symbols/Securities you track most closely, and it carries three sub-tabs. Radar (user defined) is your own custom watchlist, the one you build by adding the stocks and contracts you want to follow.
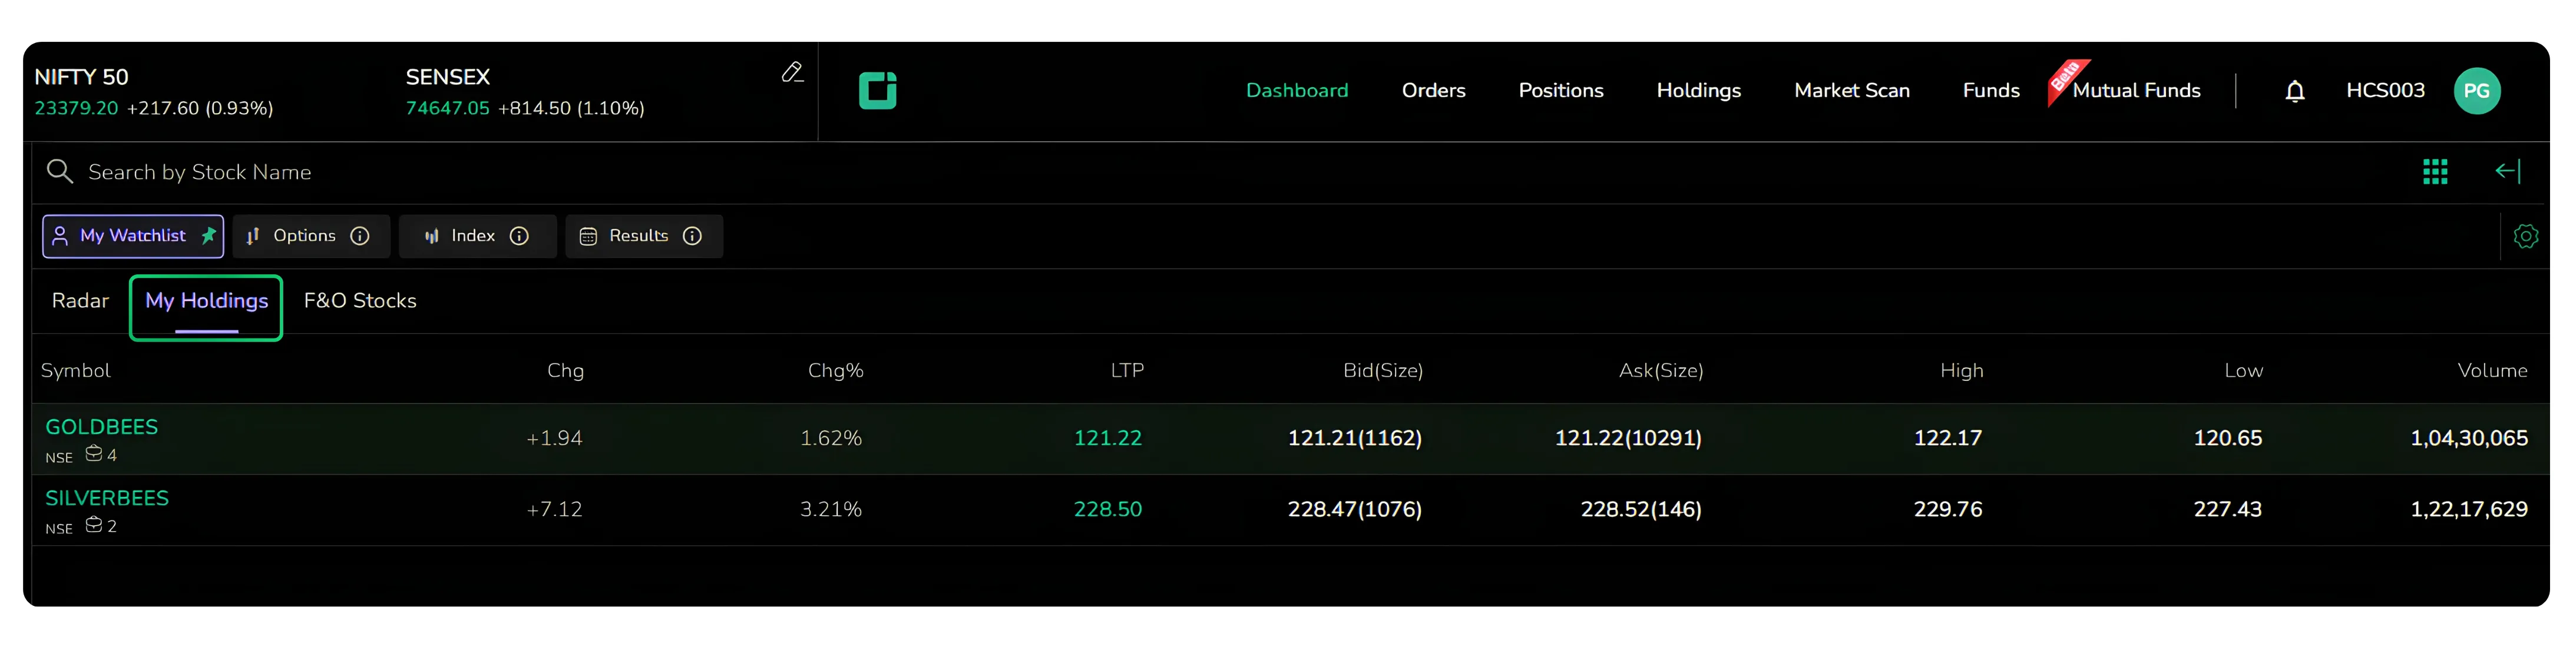
My Holdings
Shows the stocks you currently own.
F&O Stocks
Track and Explore F&O Stocks in One Place.
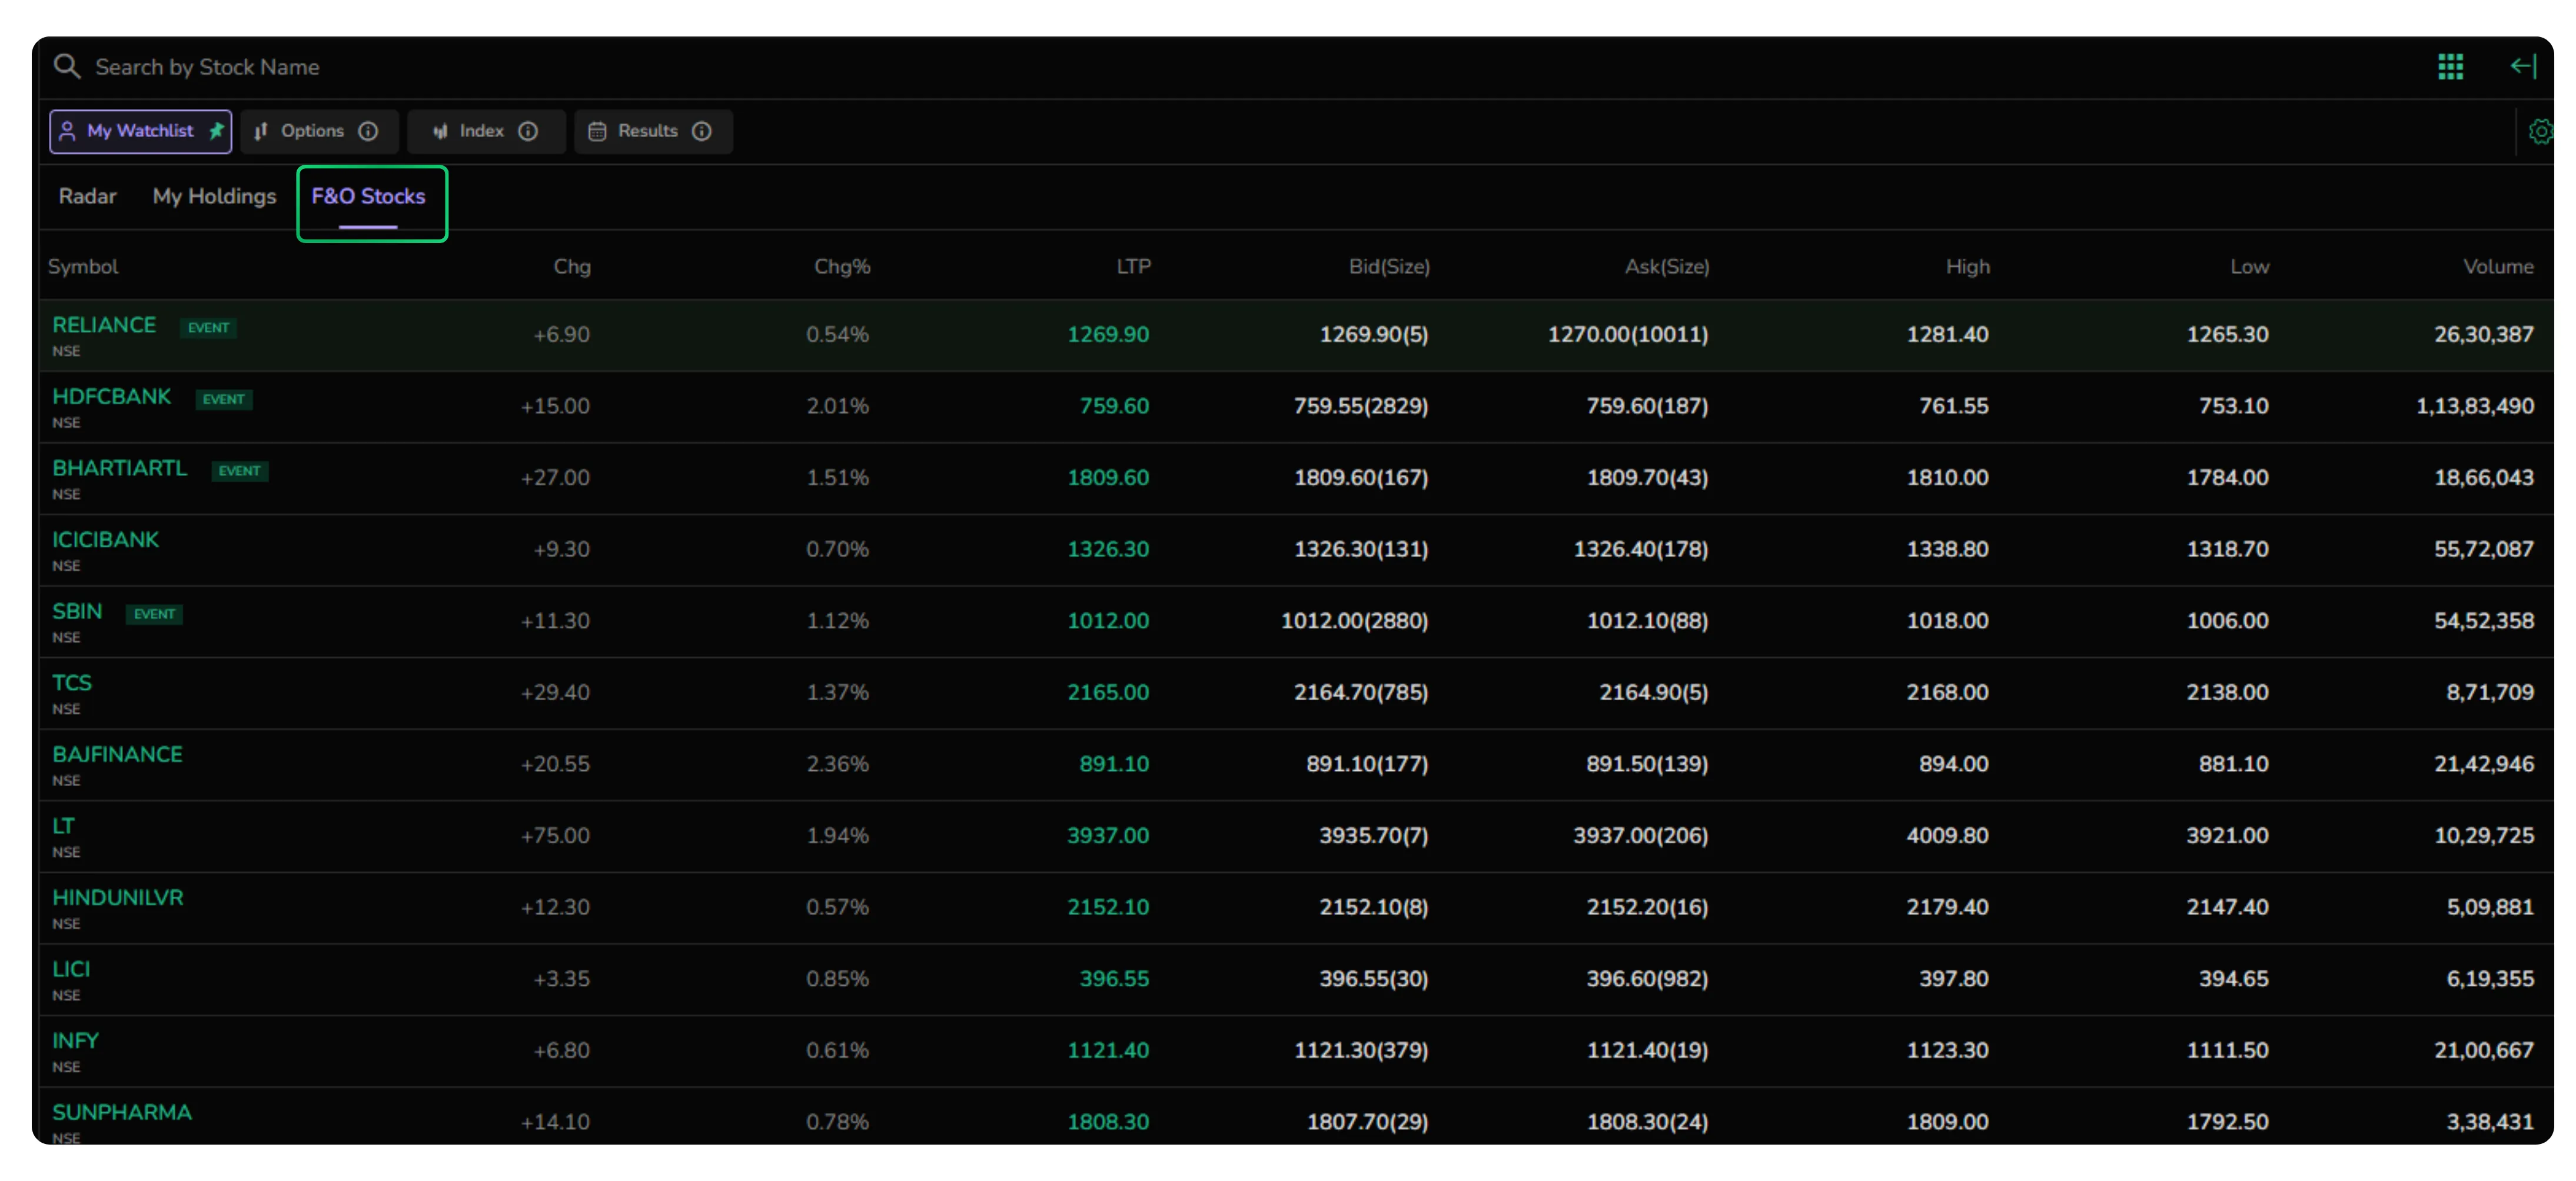
For every Symbol you can read the change, change percentage and last traded price at a glance. The columns extend further than that. Once the view is expanded, bid and ask sizes, the day's high and low, and traded volume all sit alongside the price, which is the layout to keep open when you are watching depth and activity rather than price alone. The column headings double as sort controls. A click on Change, Change percentage or Last traded price arranges the whole list by that column, running from lower to higher, and clicking the same heading again reverses it from higher to lower. It is a quick way to push the day's biggest movers or the most active names to the top without leaving the watchlist.
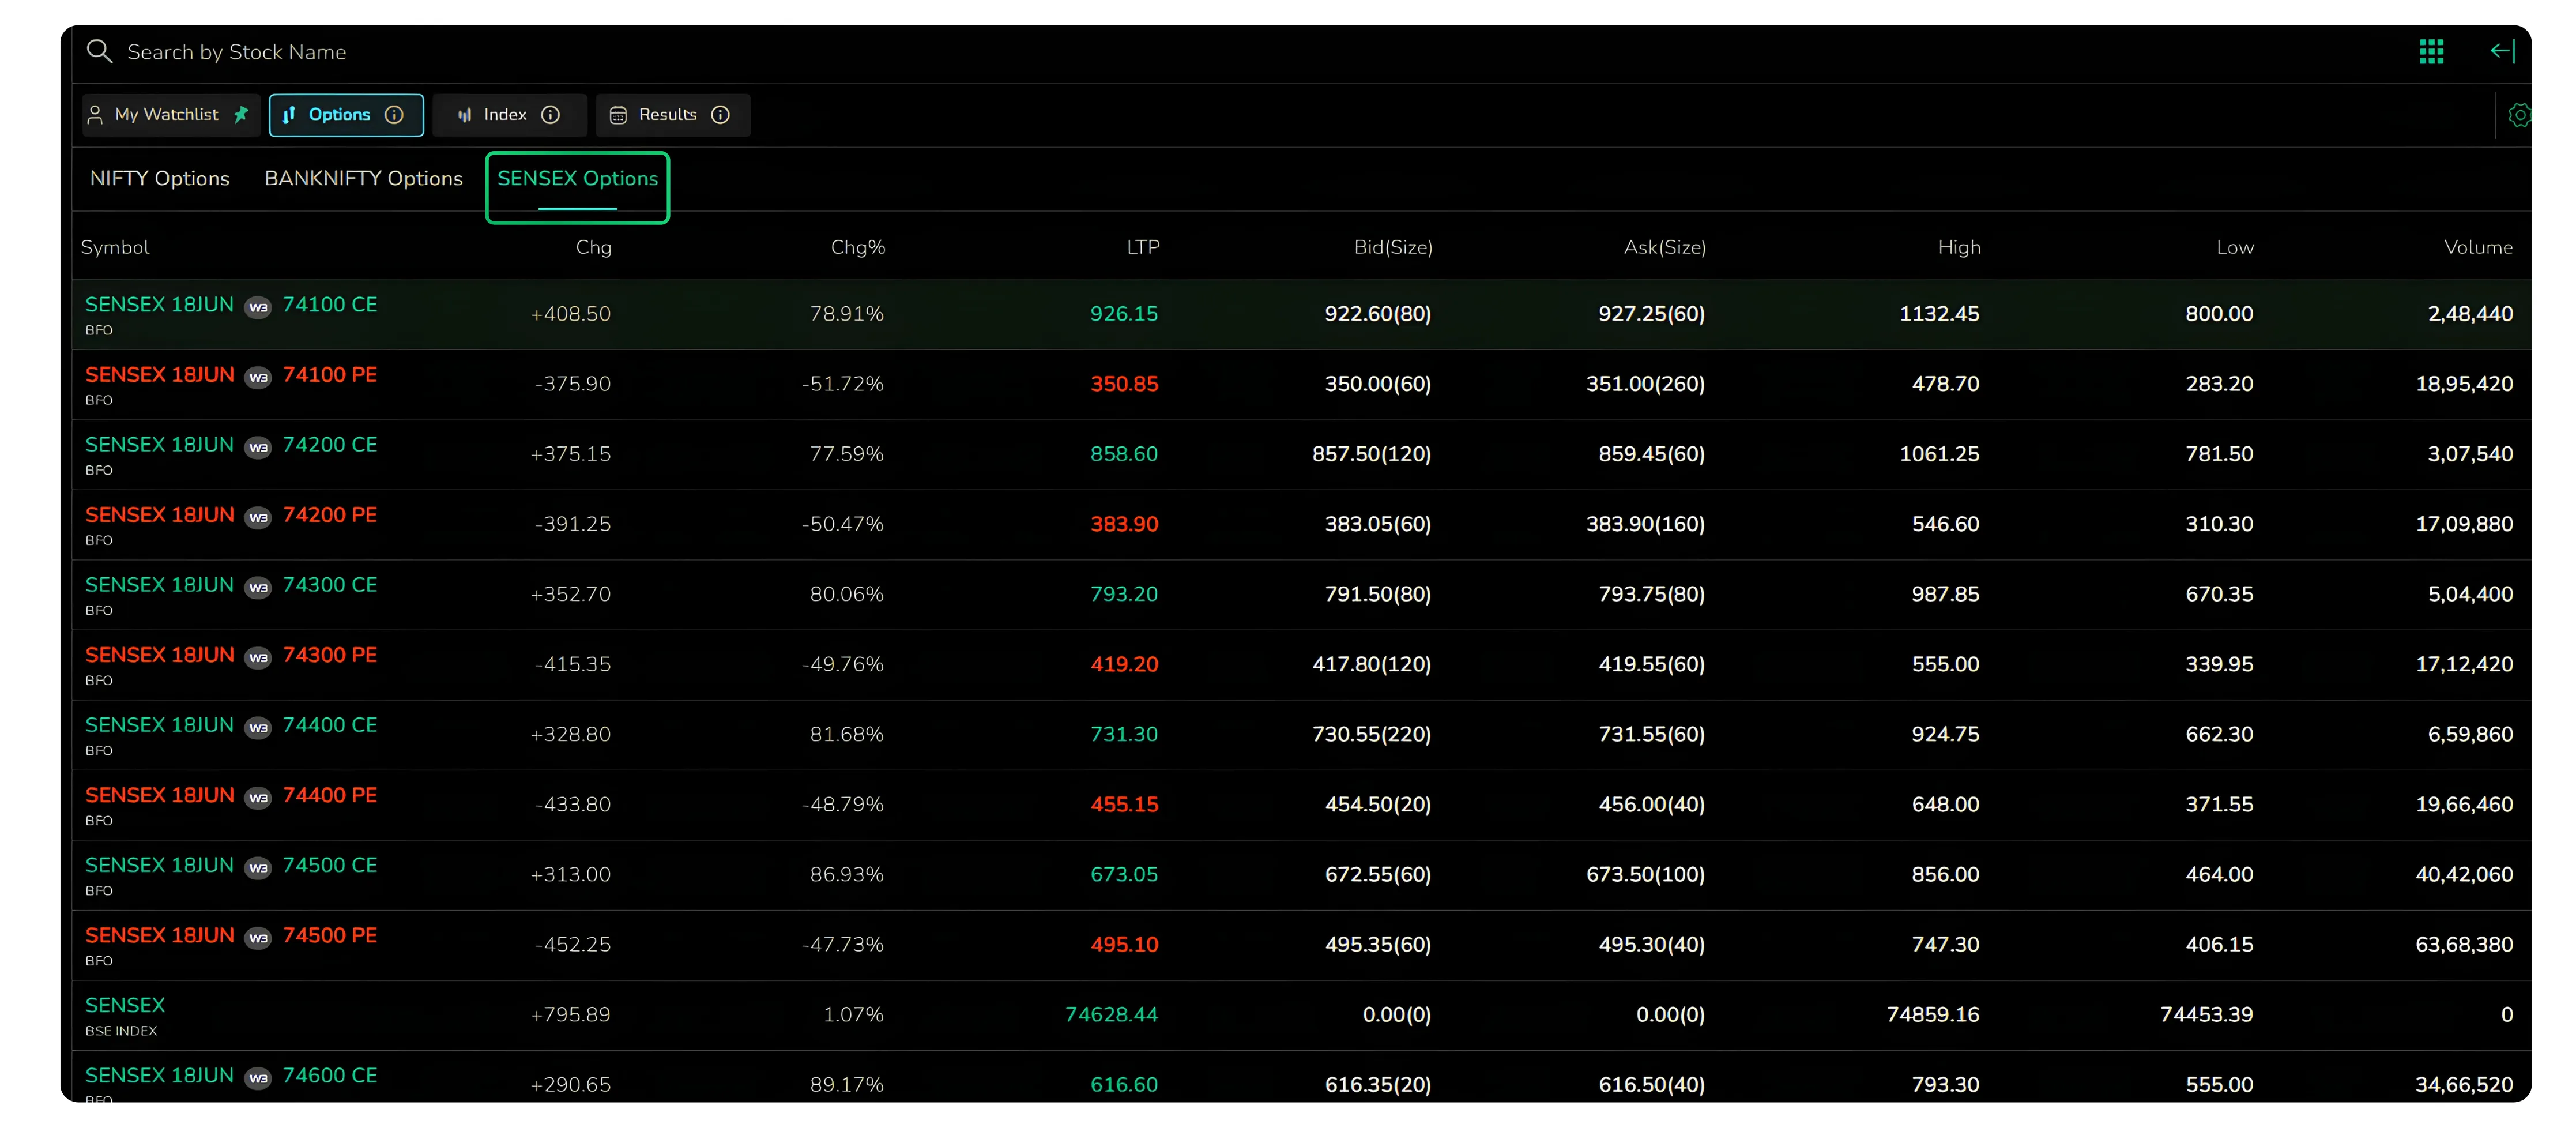
Options
Index derivatives get their own tab, kept separate so they are quick to reach. Three sub-heads divide it by index: Nifty Options, Banknifty Options and Sensex Options.
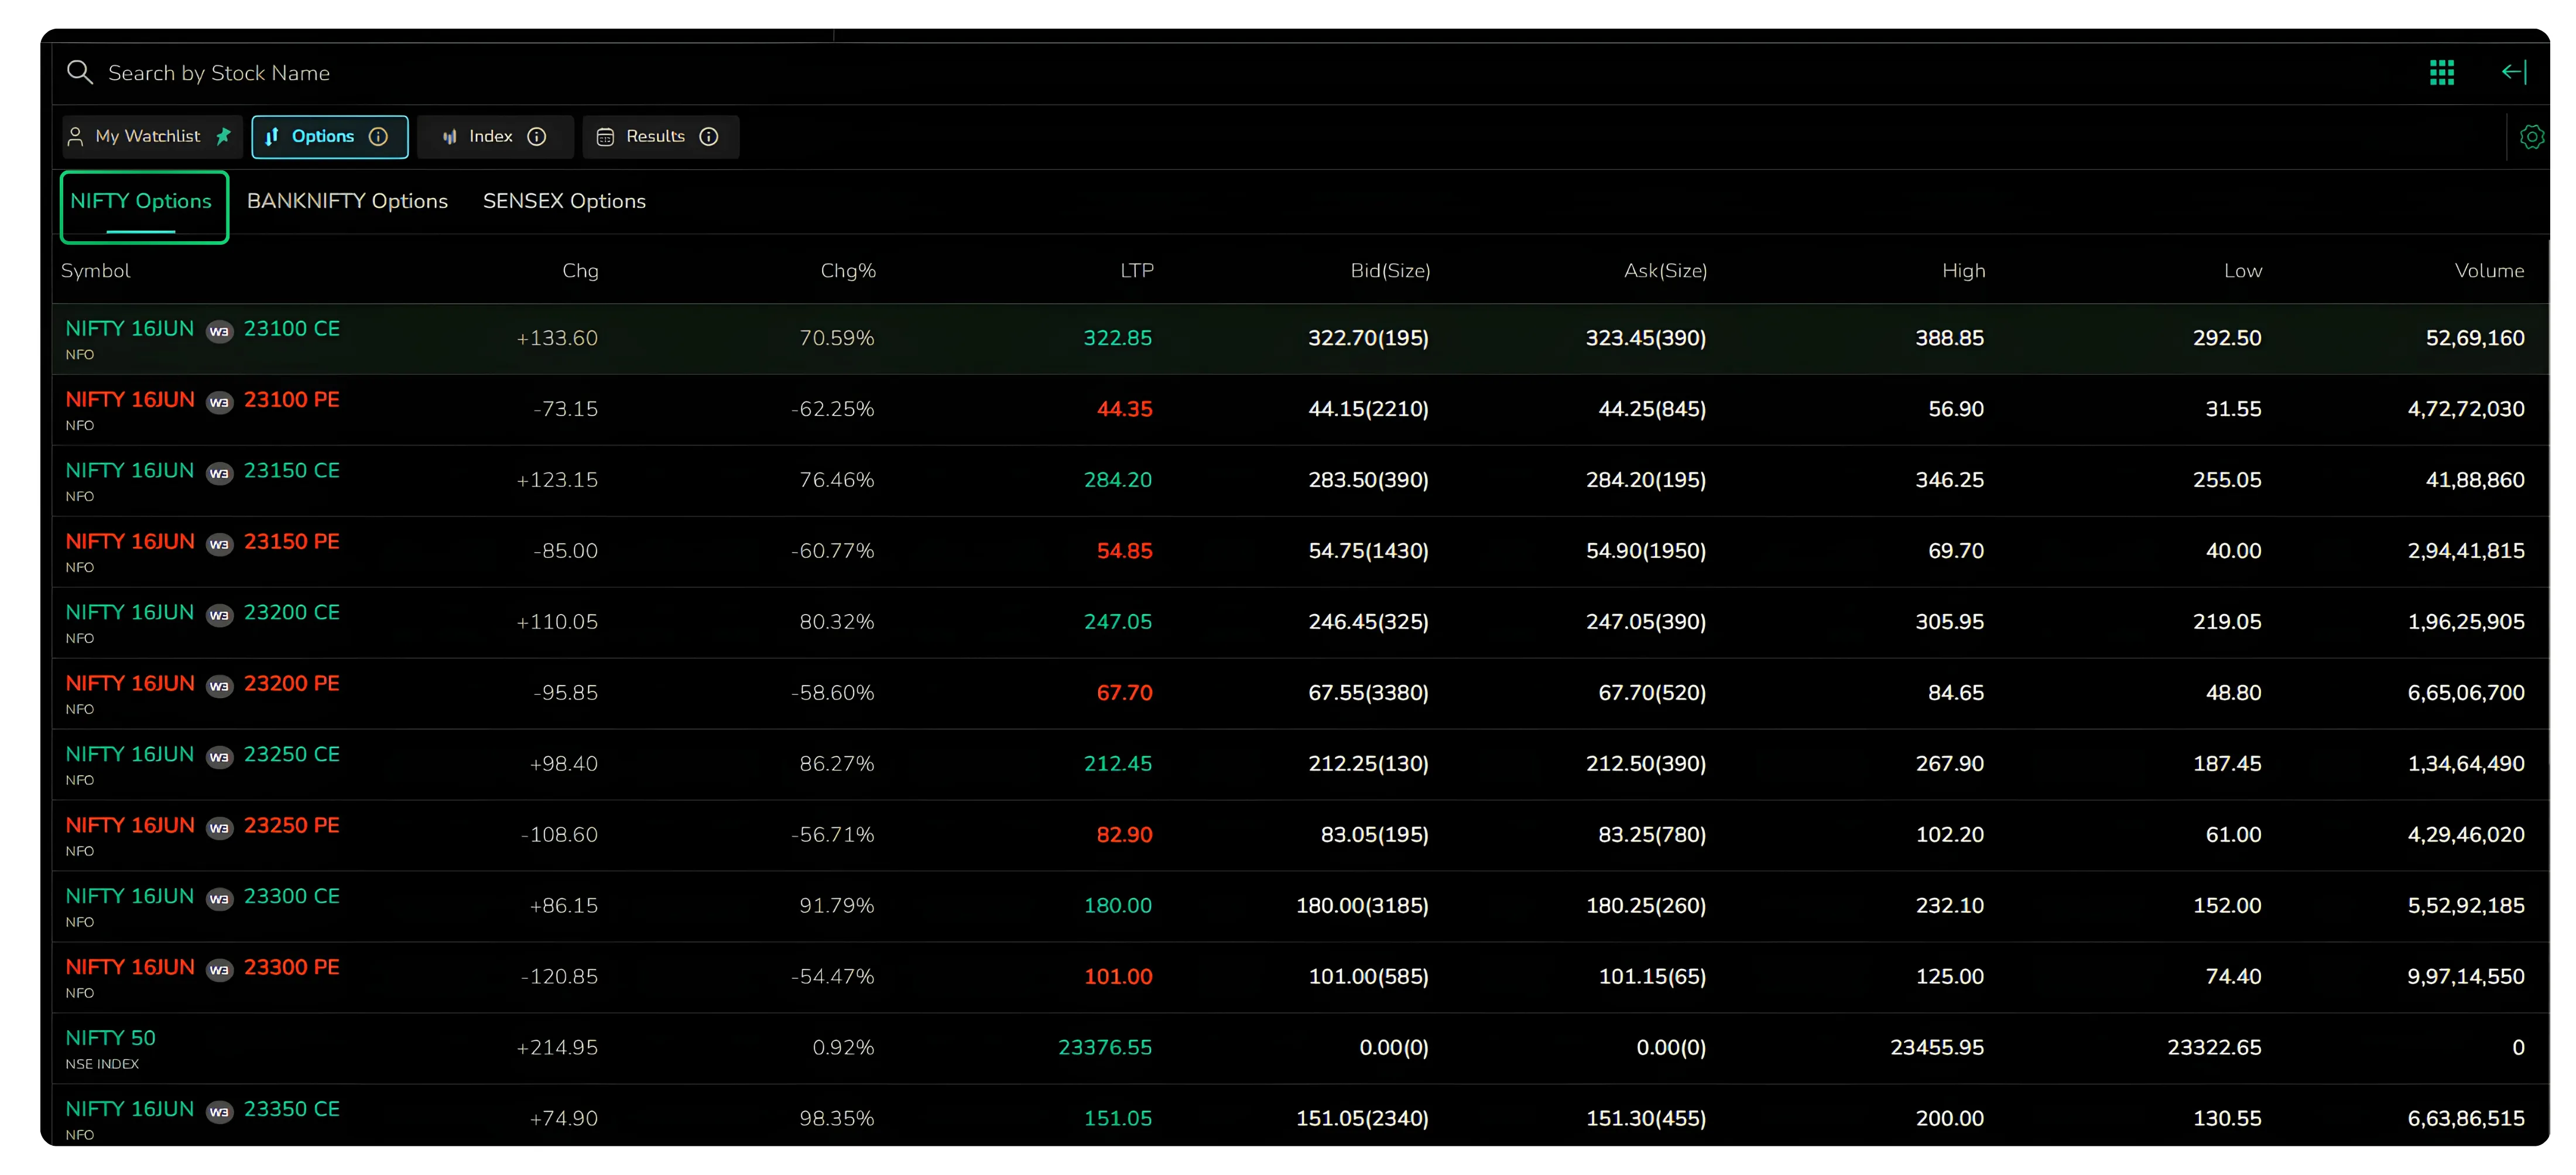
Selecting any one brings up its option contracts with the live last traded price, bid and ask sizes, high, low and volume, so the entire chain for an index can be scanned without leaving the watchlist.
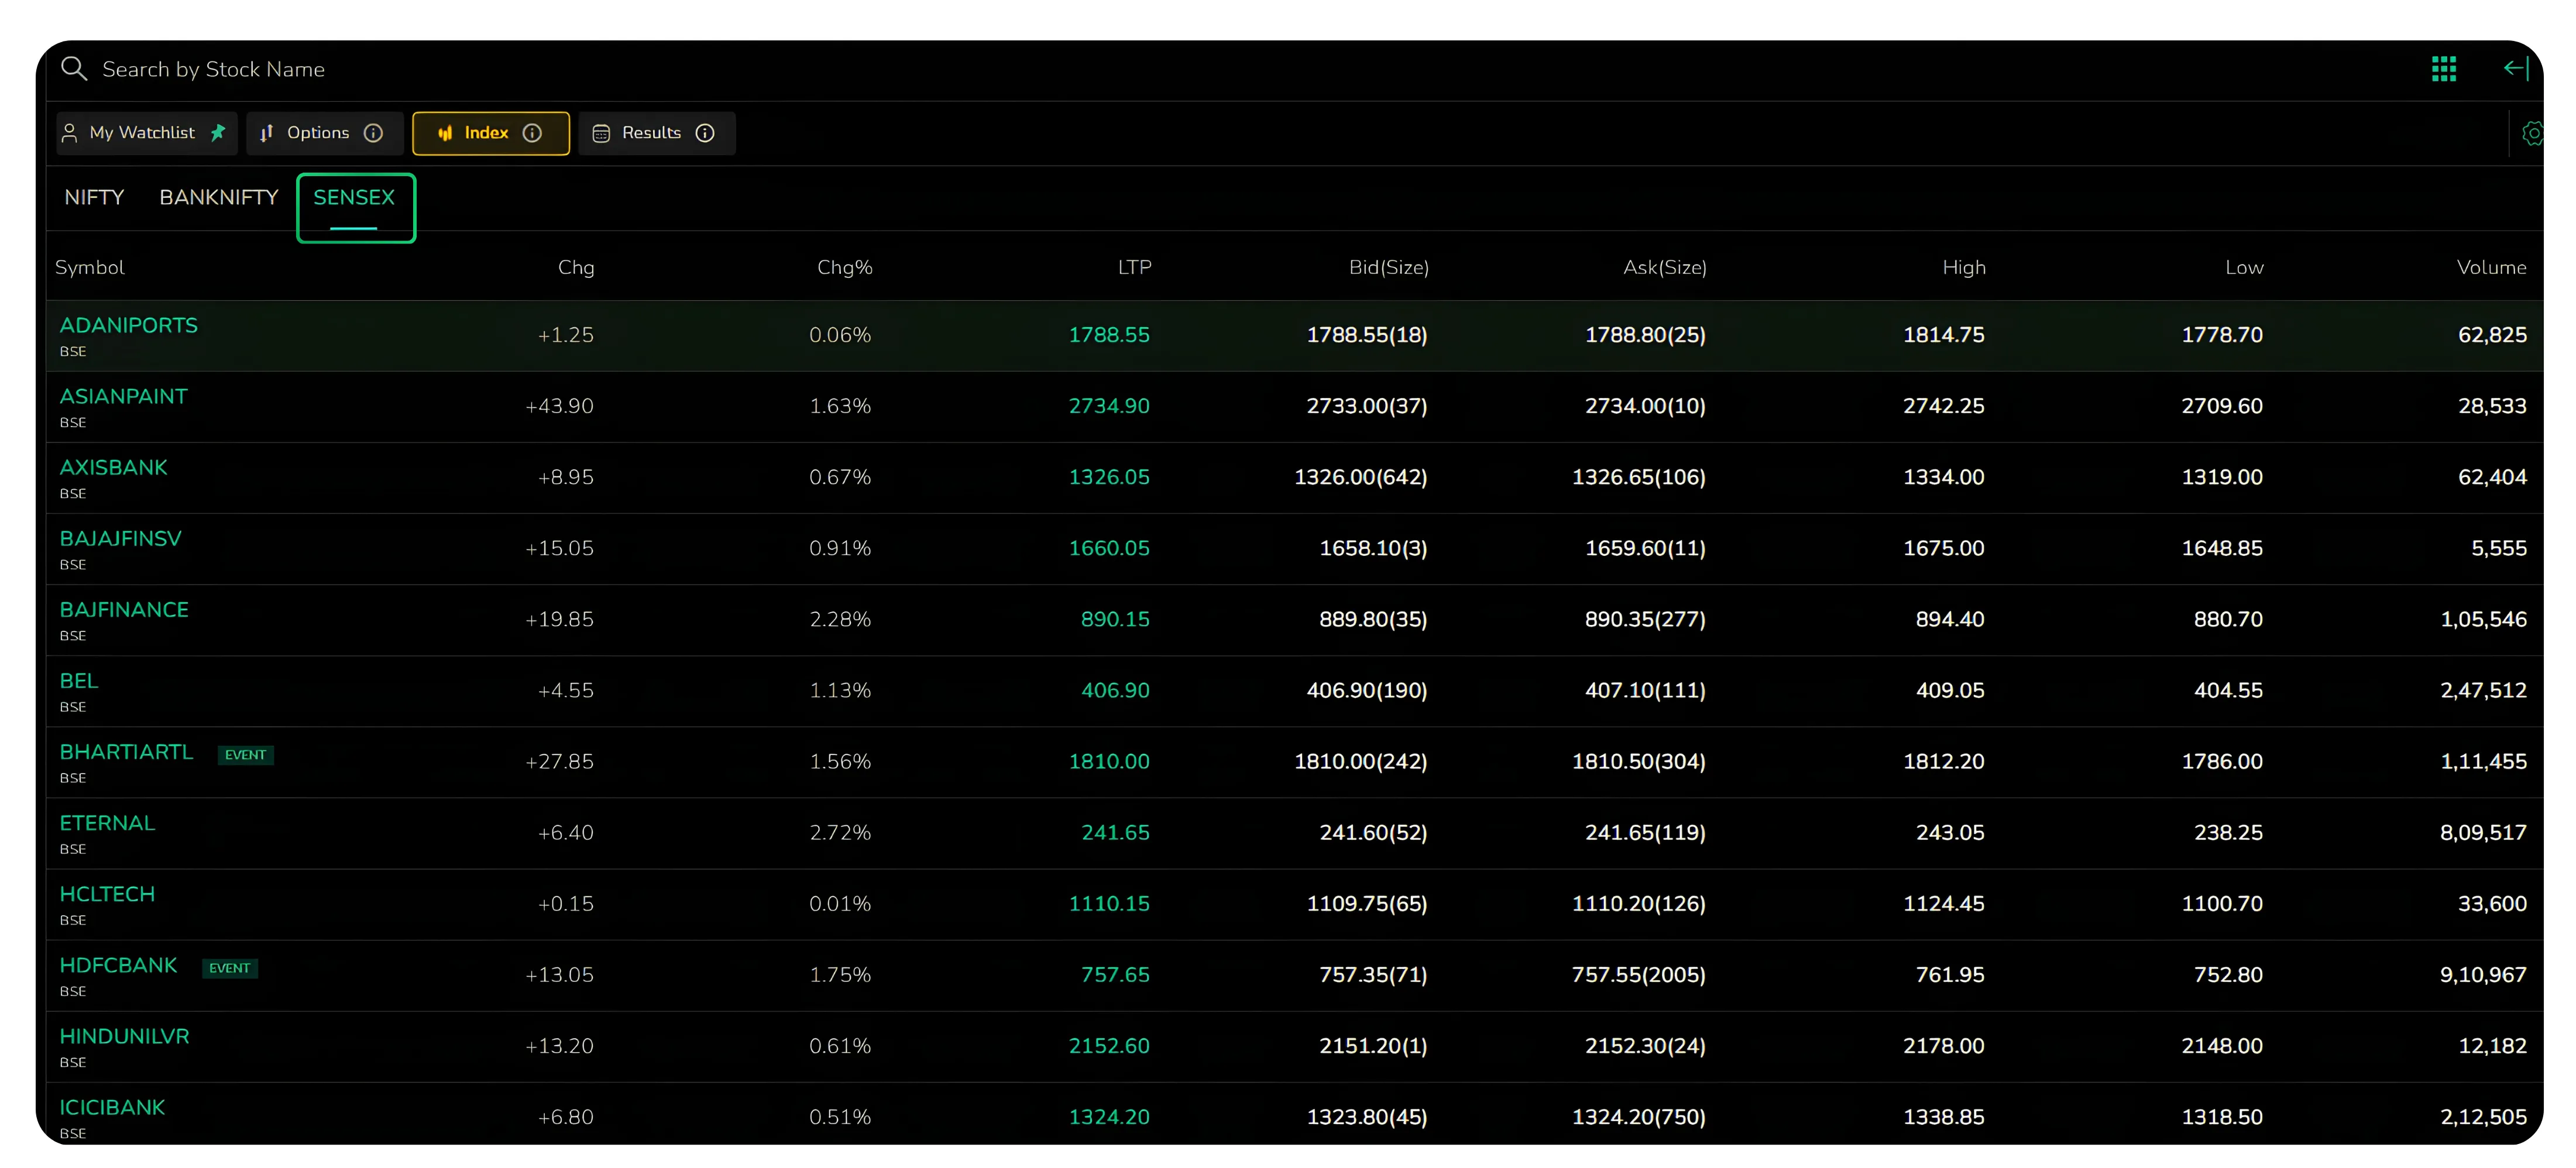
Index
Where the Options tab deals with derivatives, the Index tab lists the underlying stocks.
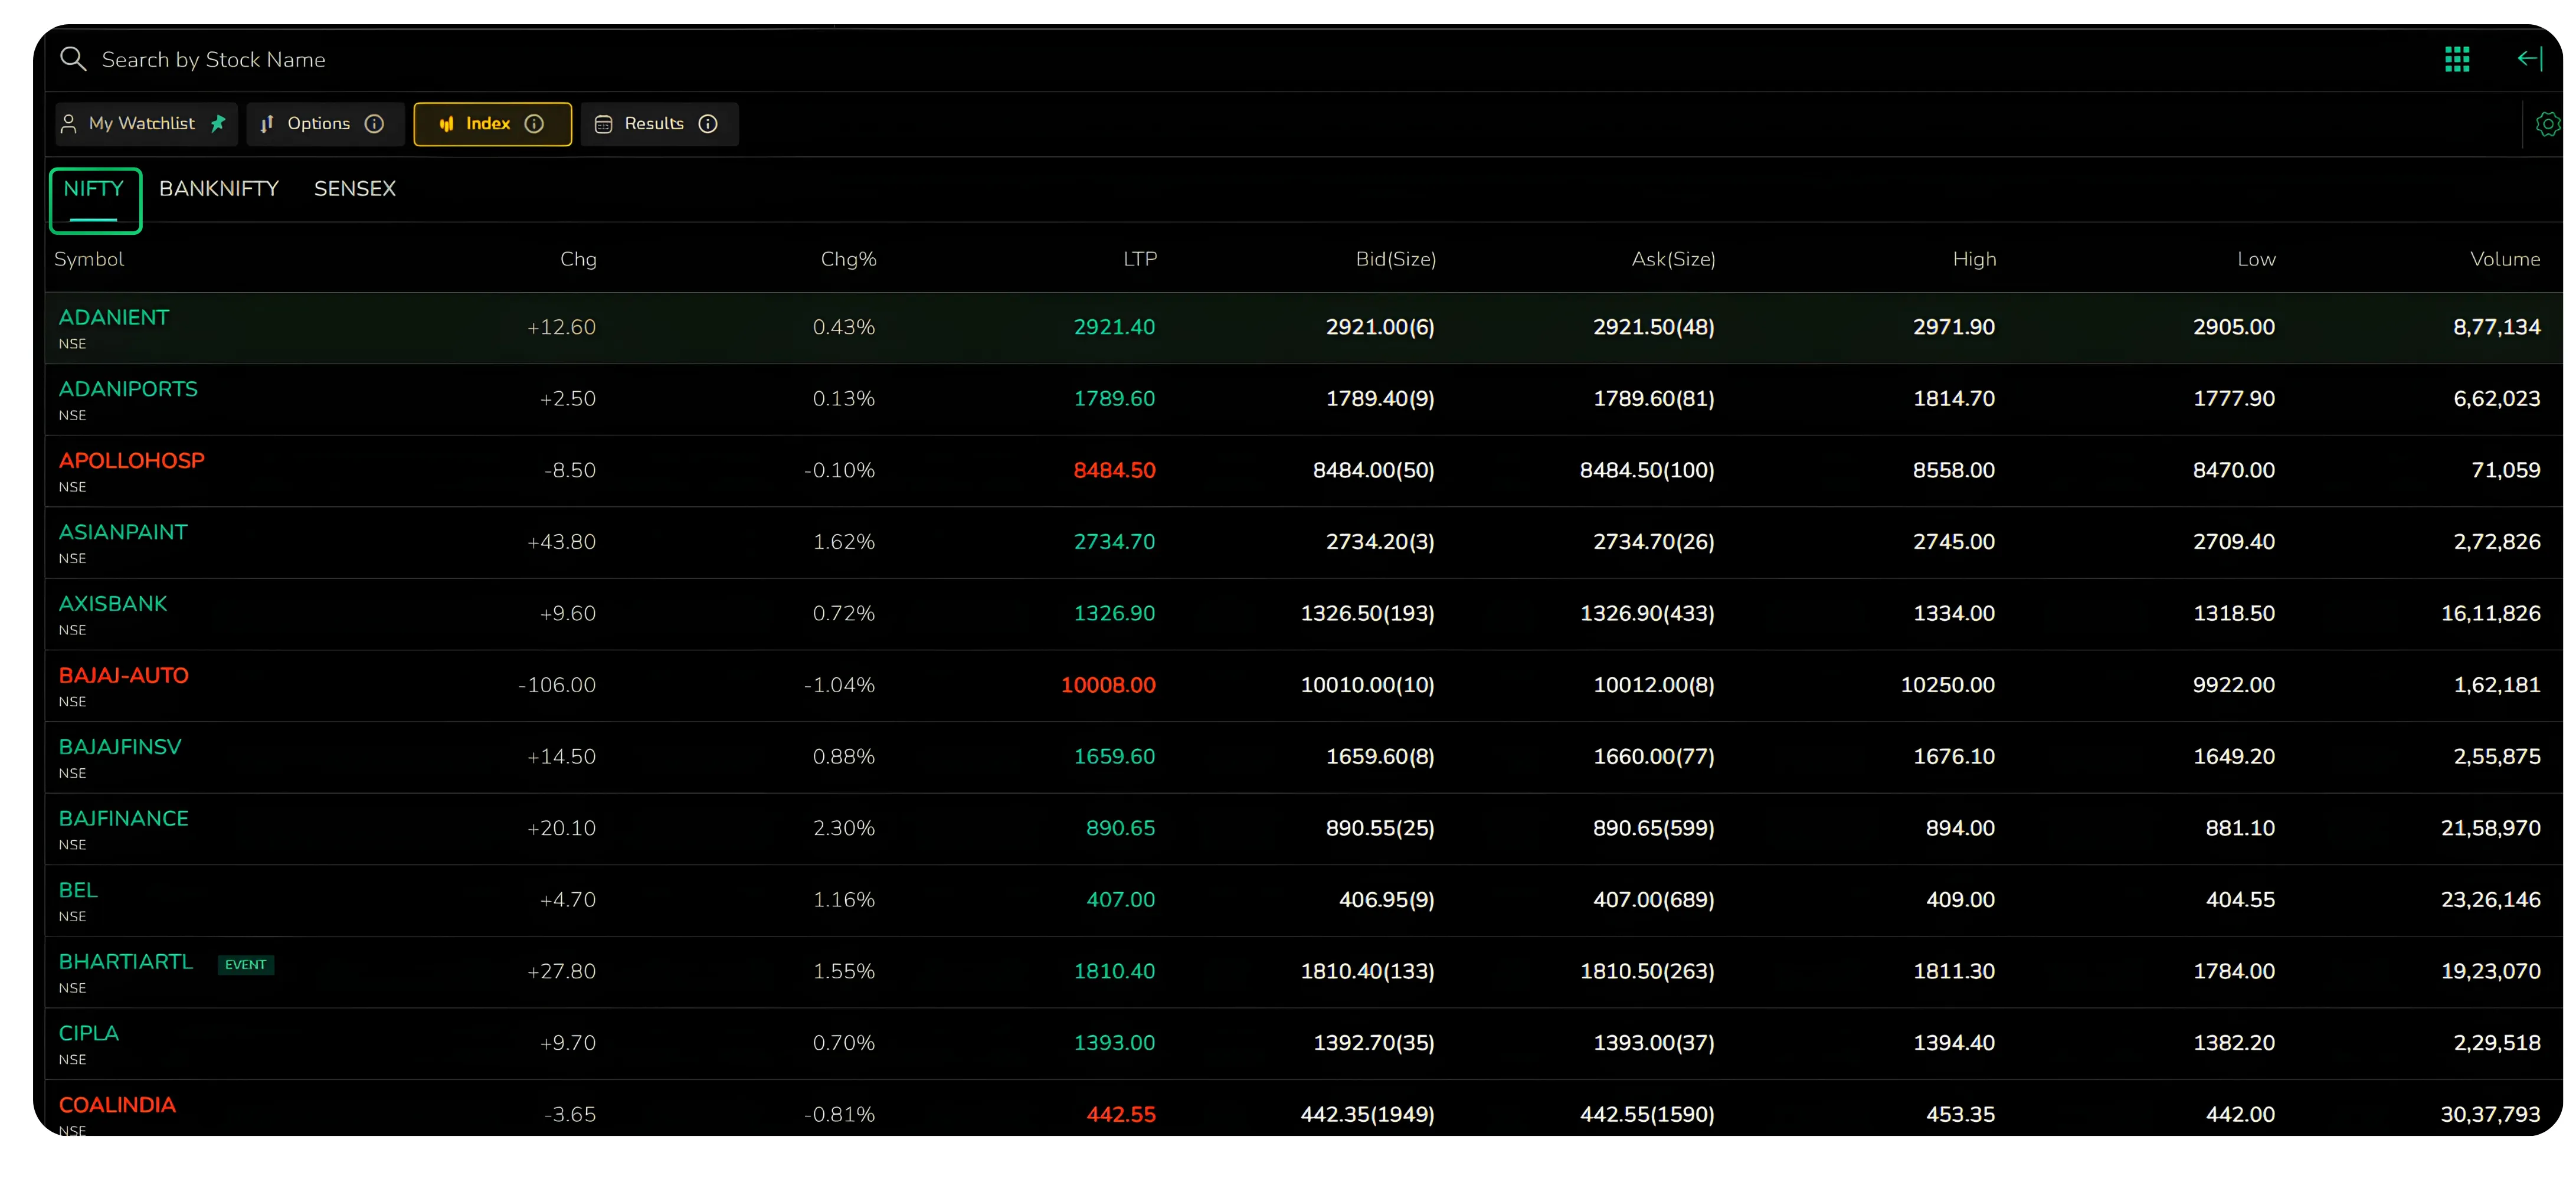
The same three indices appear here, Nifty, Banknifty and Sensex. Choosing any one of them pulls up the full list of its constituent stocks with live prices and the standard set of columns, which is useful when you want to see how an index is moving on the strength of its individual names.
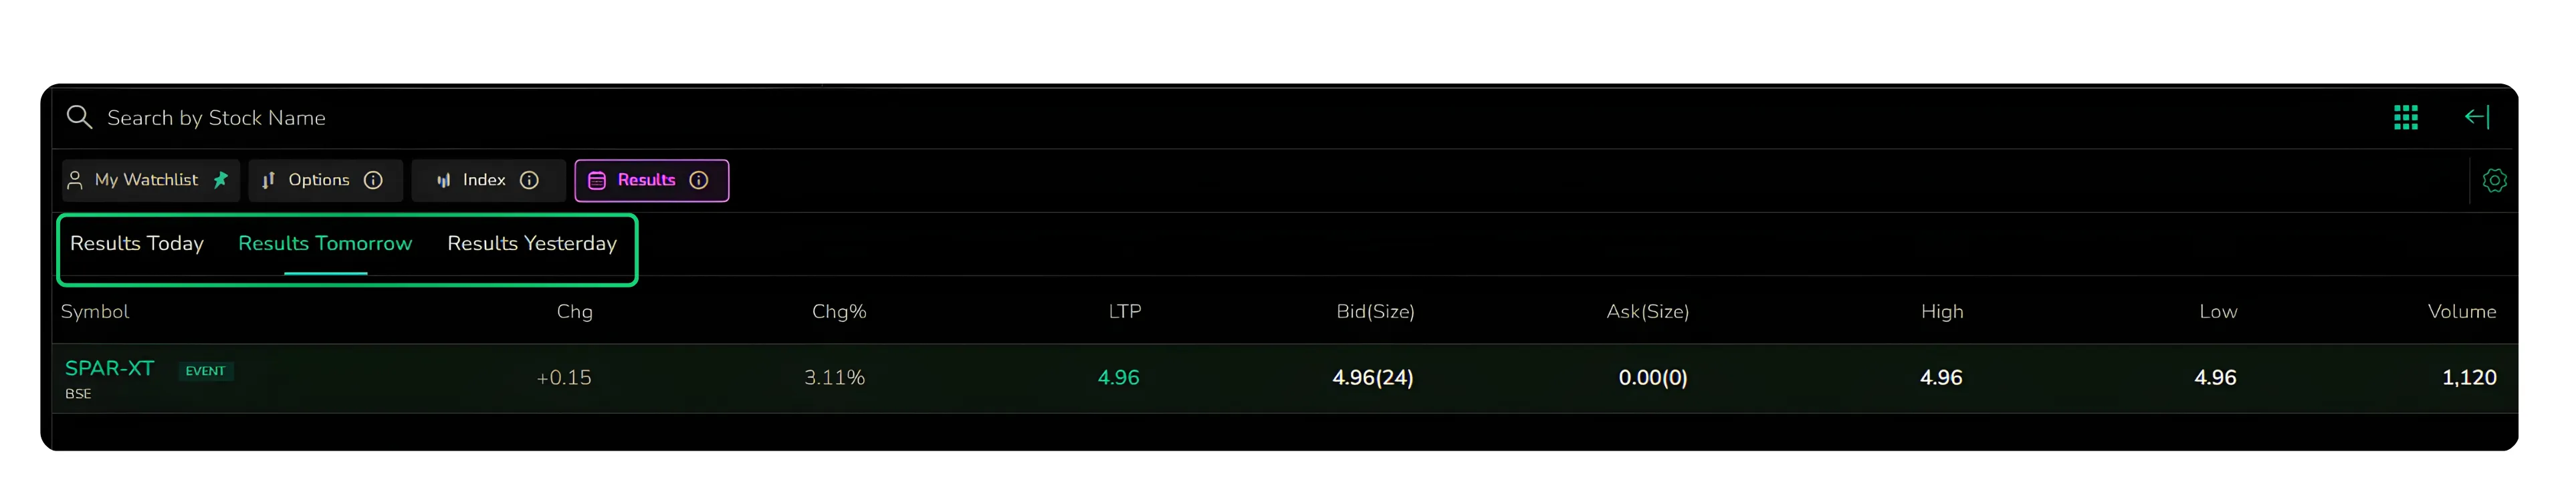
Results
Built around the earnings calendar, the Results tab splits into Results Today, Results Tomorrow and Results Yesterday. Each sub-tab lists the companies reporting in that window along with their price data, so a trader watching for an earnings reaction can keep the relevant set in view without hunting through a separate calendar.
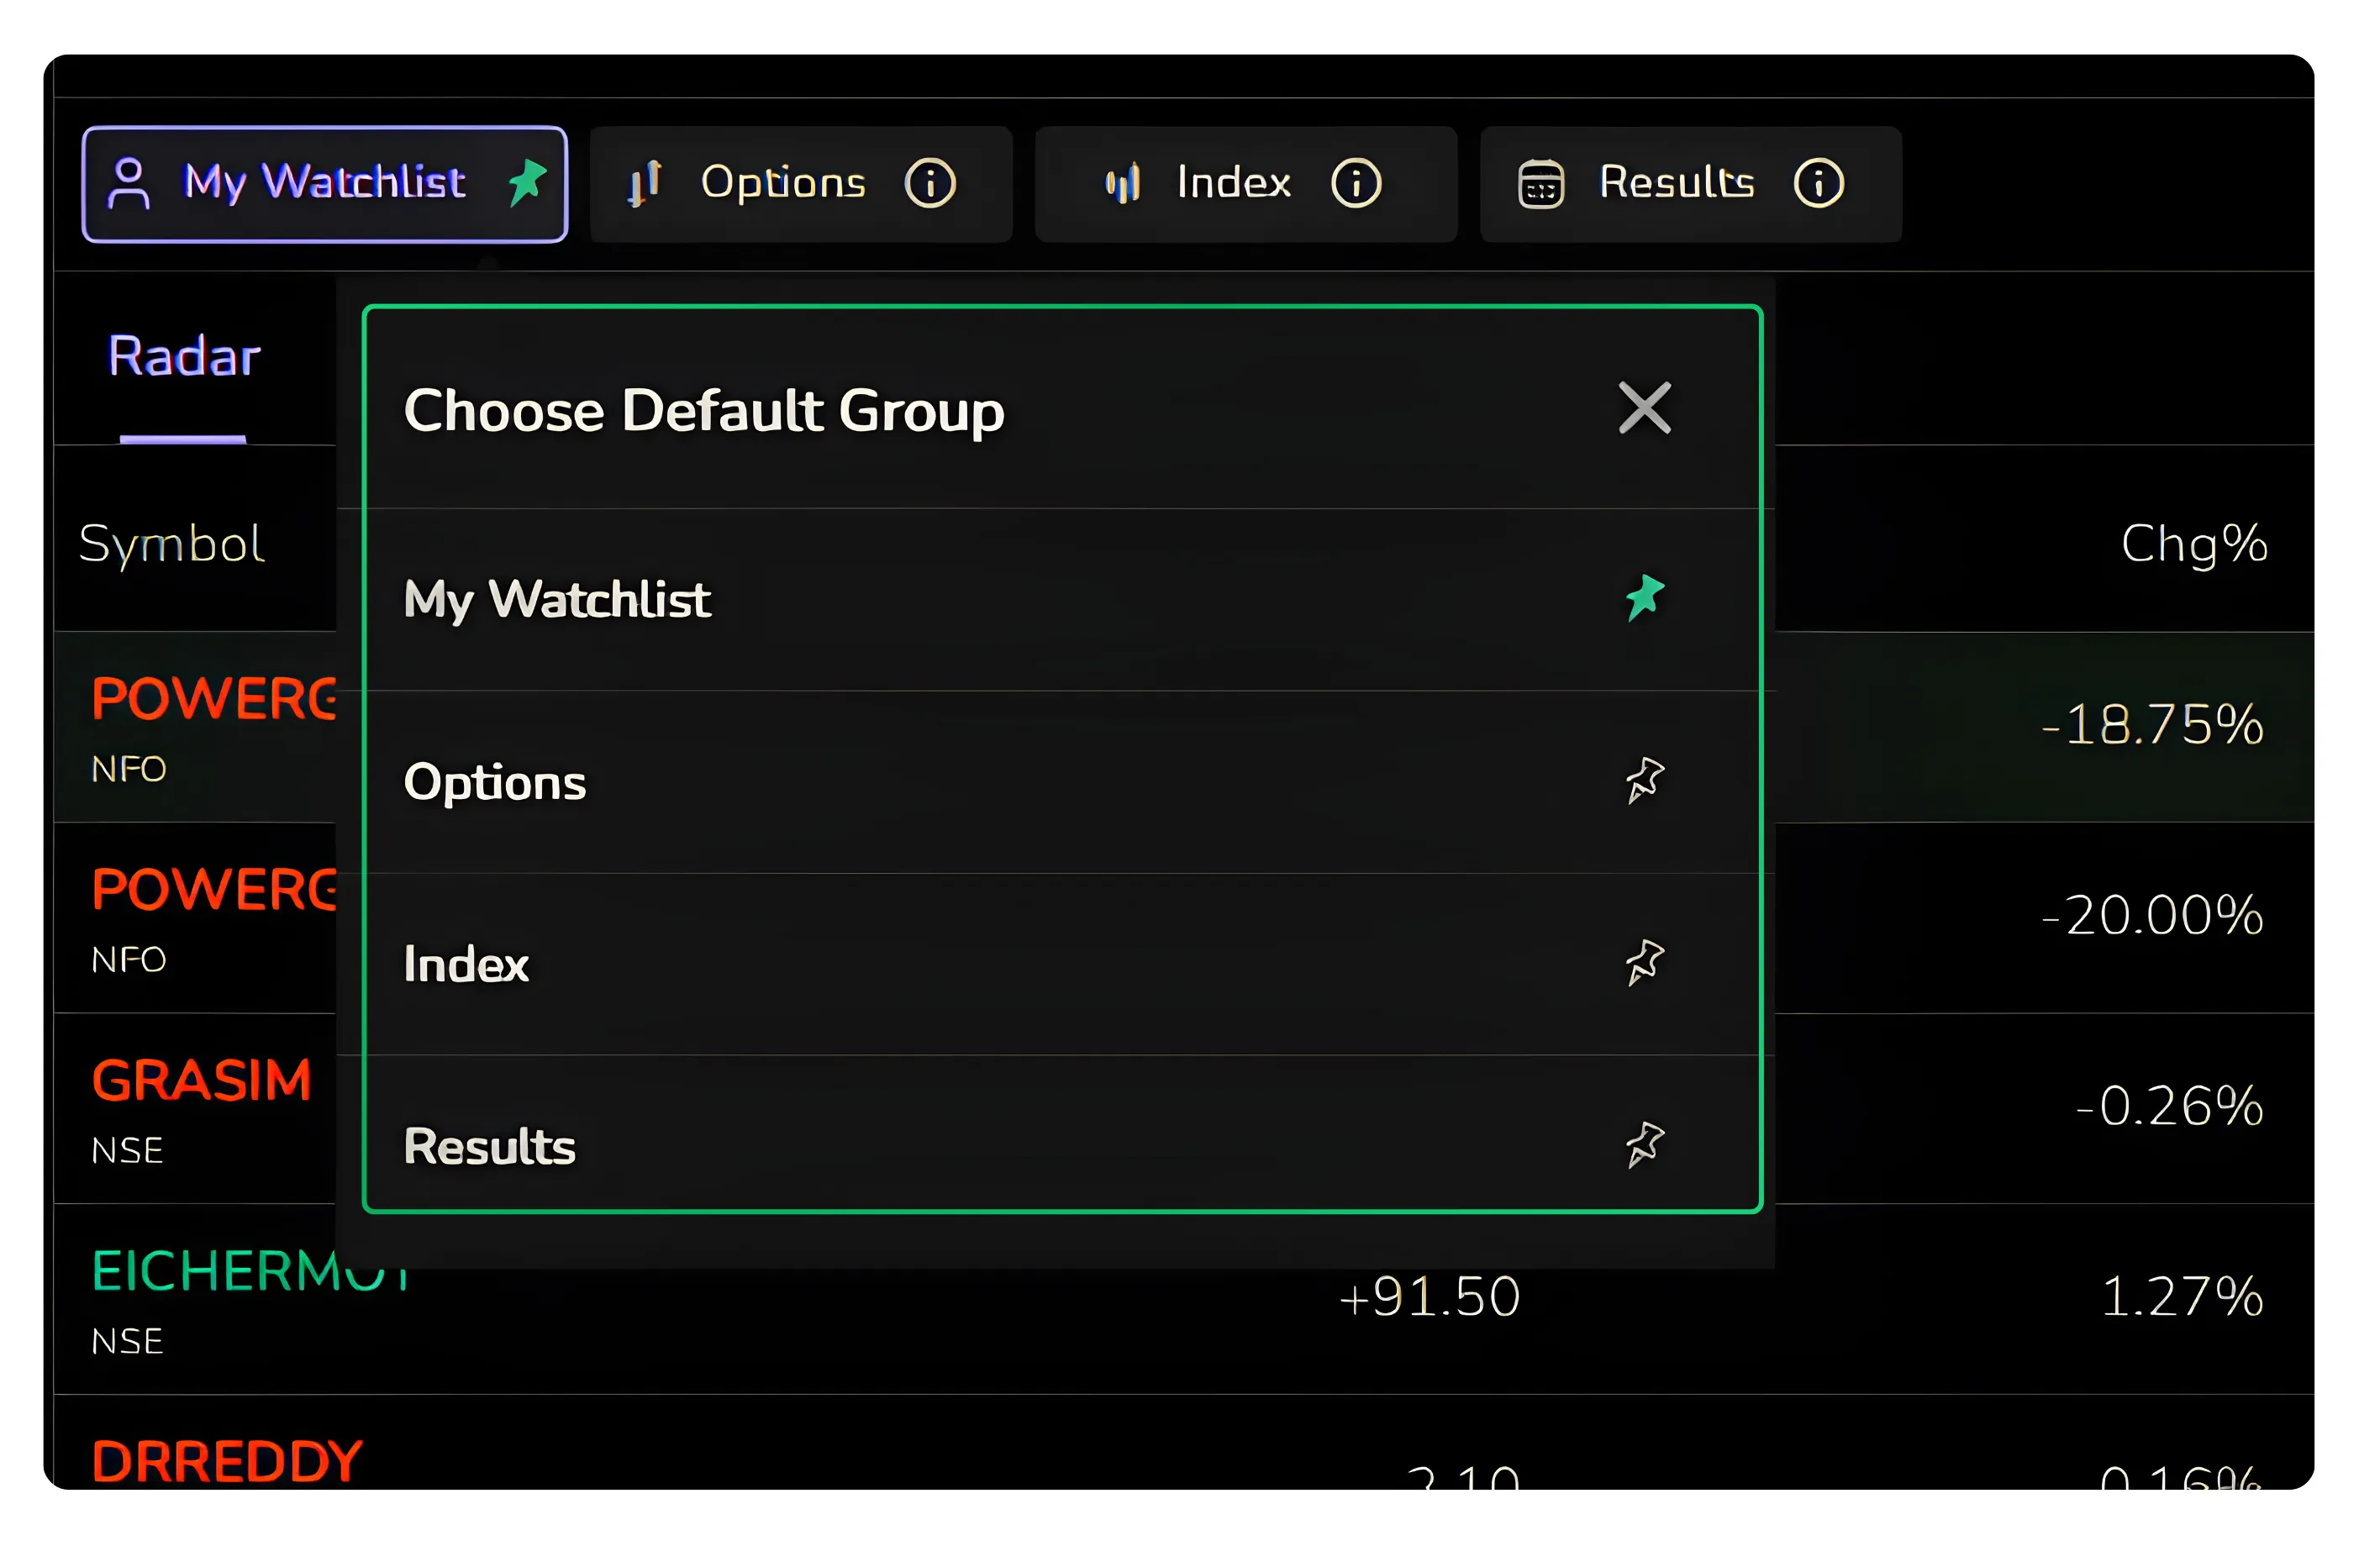
Setting a Default Group
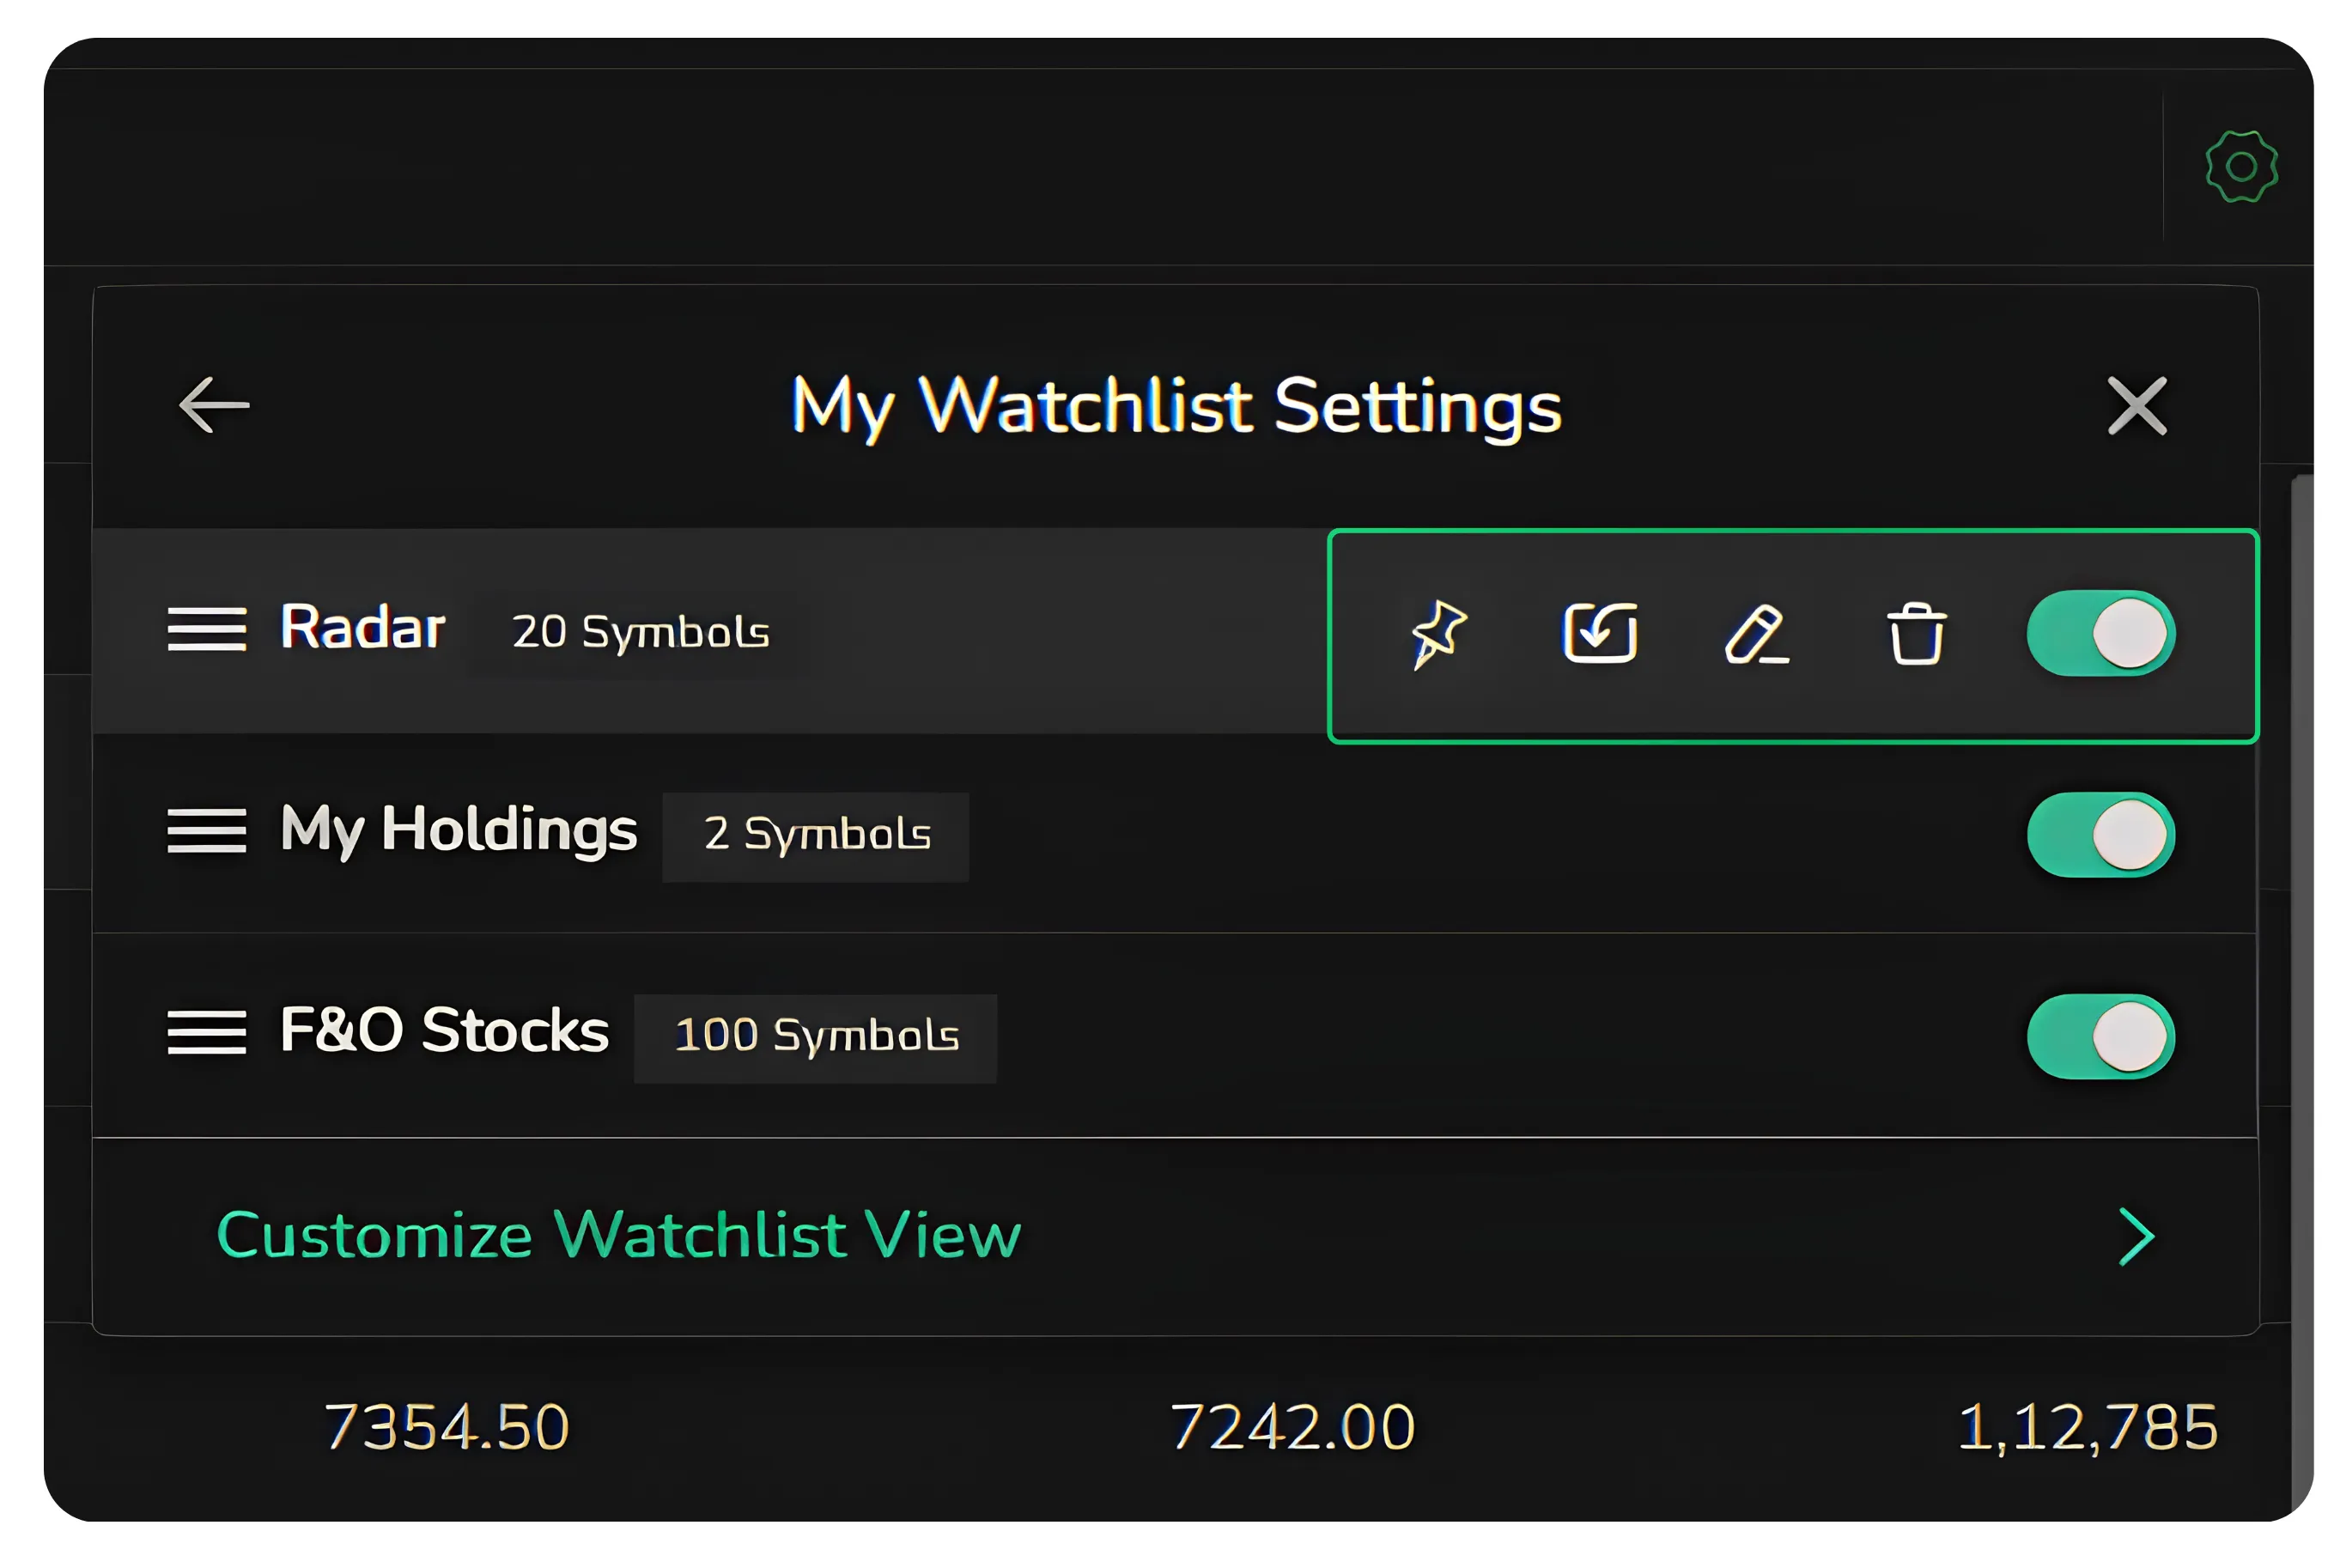
You decide which of the four sections opens first. Each of them, My Watchlist, Options, Index and Results, carries a pin. Clicking the pin on any one marks it as the default group, so the section you use most is what greets you the moment the watchlist loads. The rest remain a single click away.
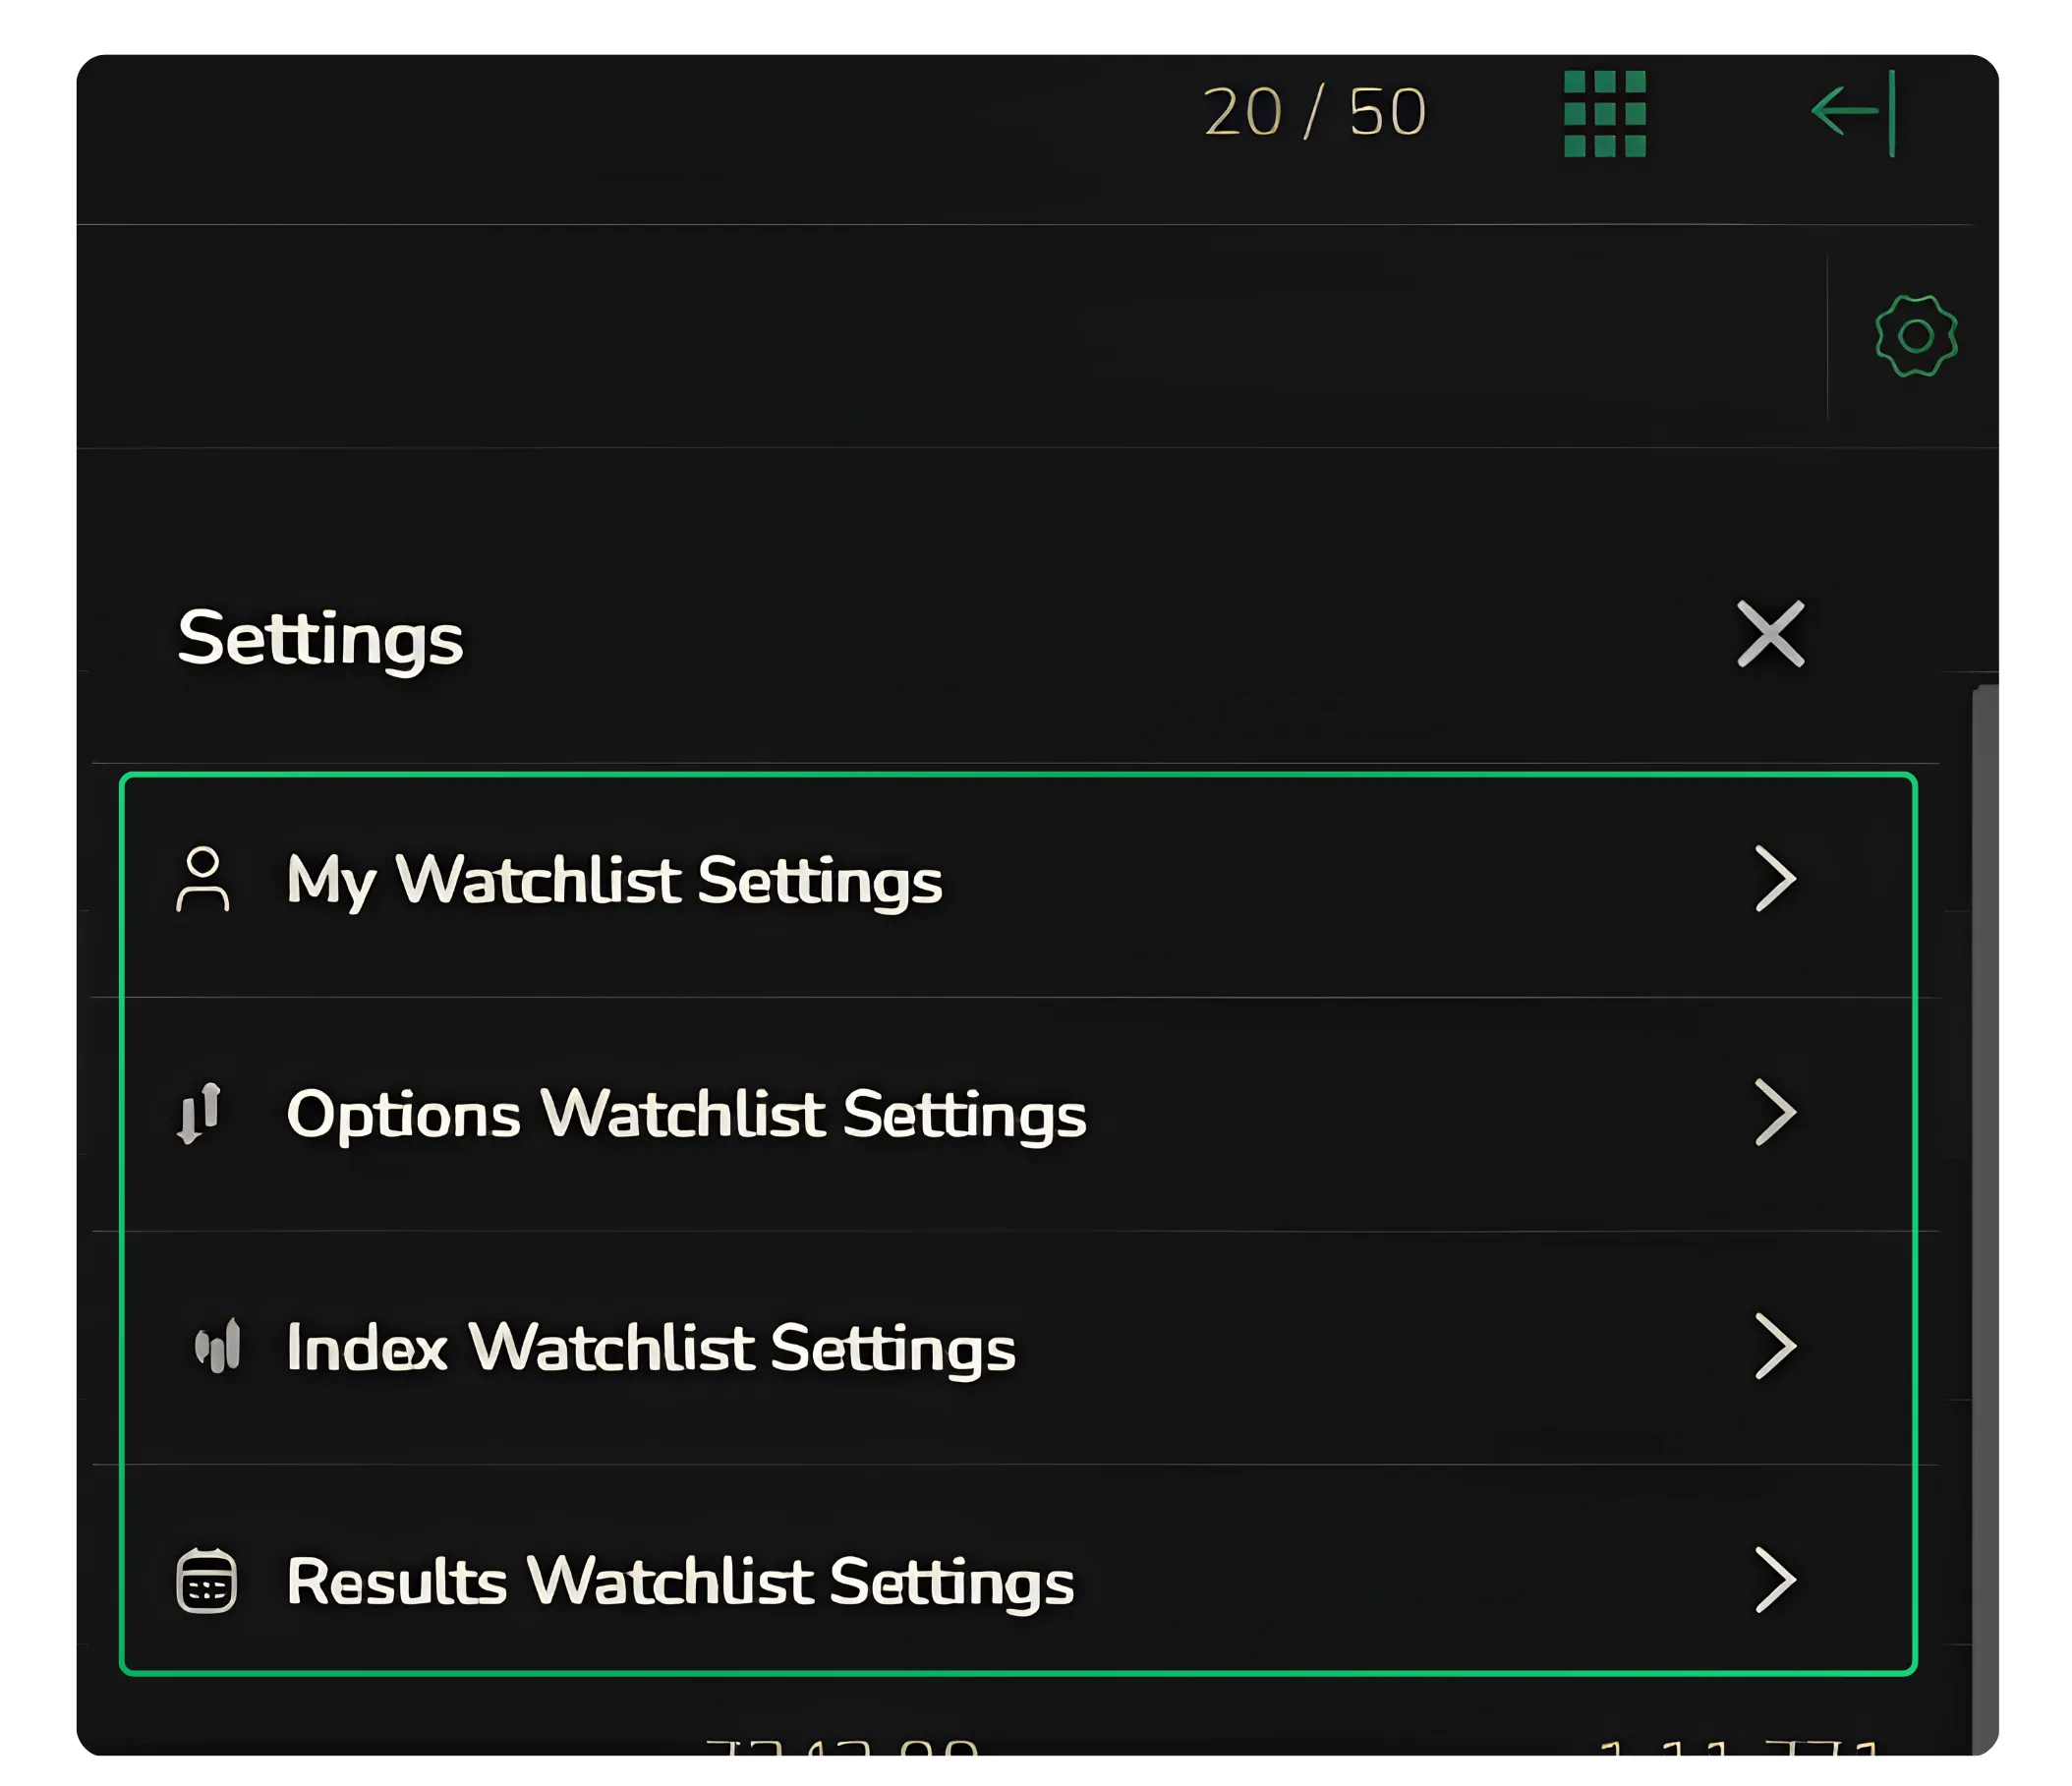
Customisation and Settings
The settings icon at the top right corner opens a panel with separate controls for each of the four sections: My Watchlist Settings, Options Watchlist Settings, Index Watchlist Settings and Results Watchlist Settings.
Inside My Watchlist Settings, each watchlist can be switched on or off with a toggle, so Radar, My Holdings and F&O Stocks appear only if you want them to. Order is in your hands too. Clicking and holding a watchlist lets you drag it up or down, which decides what shows at the top and what sits below.
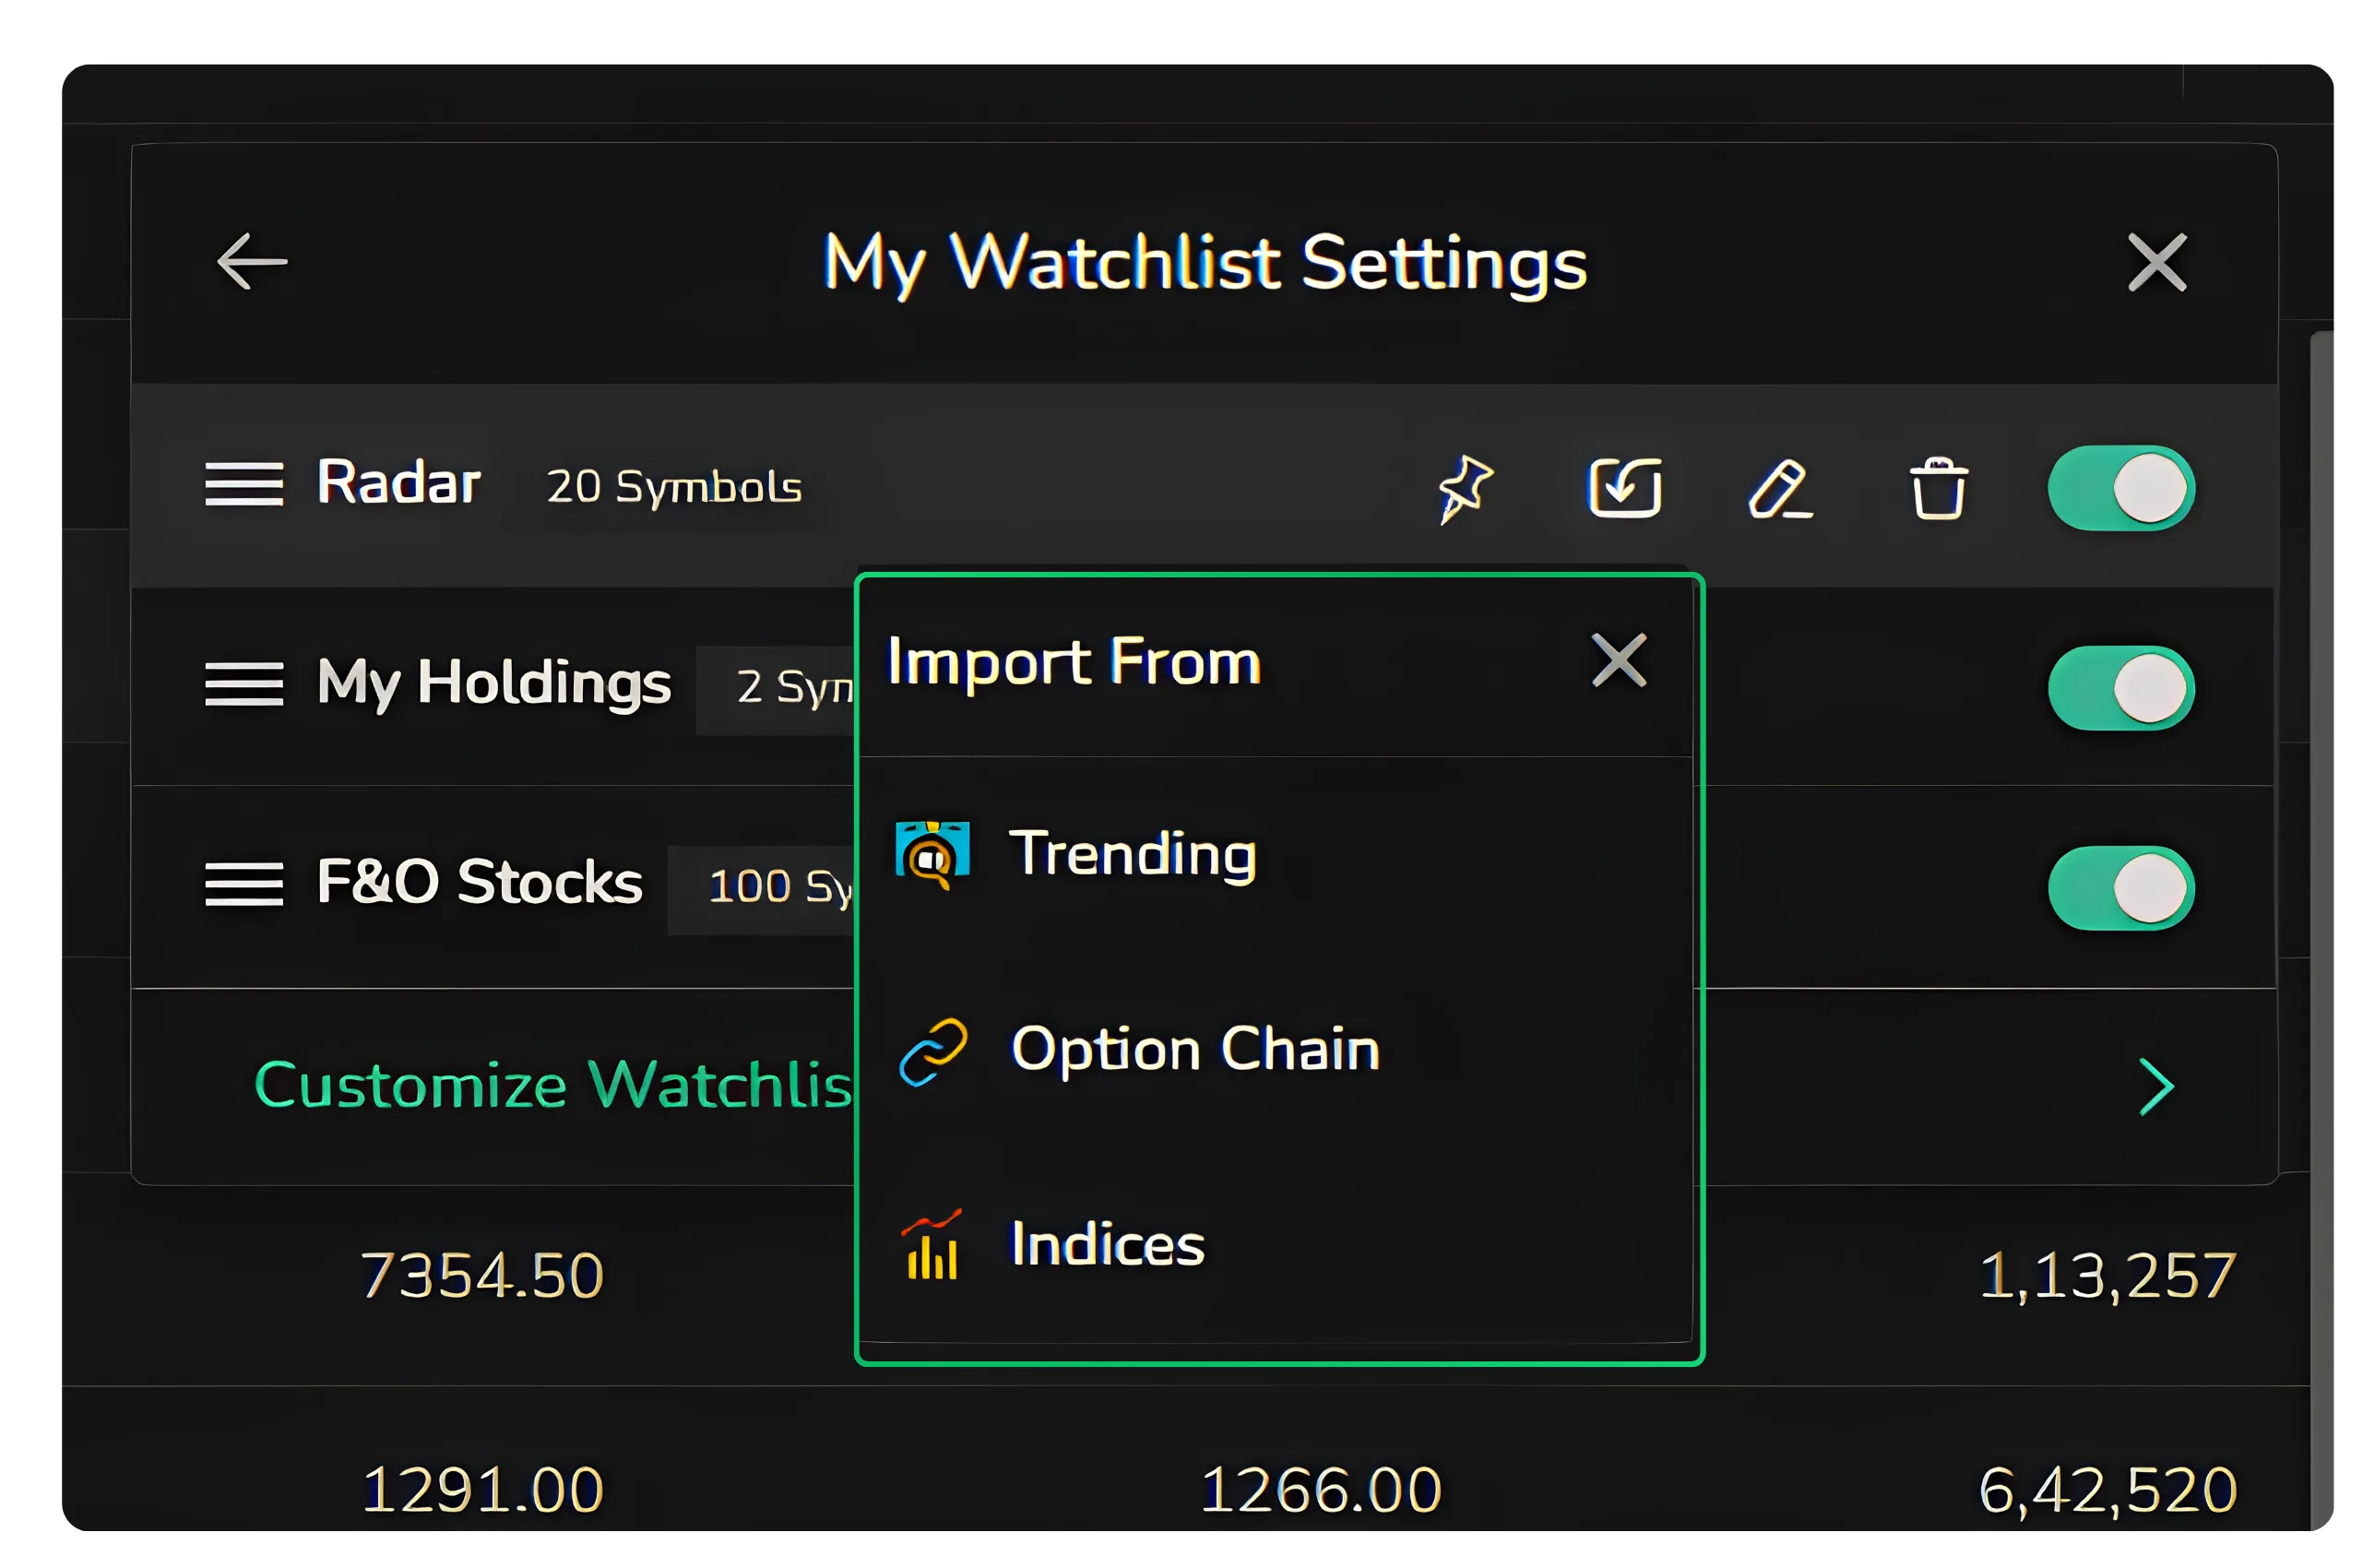
Hovering over any watchlist reveals four more controls: pin, edit, delete and import. The import option is the unique feature here, since it lets you pull symbols straight in from Trending, the Option Chain or the Indices list rather than adding them by hand.
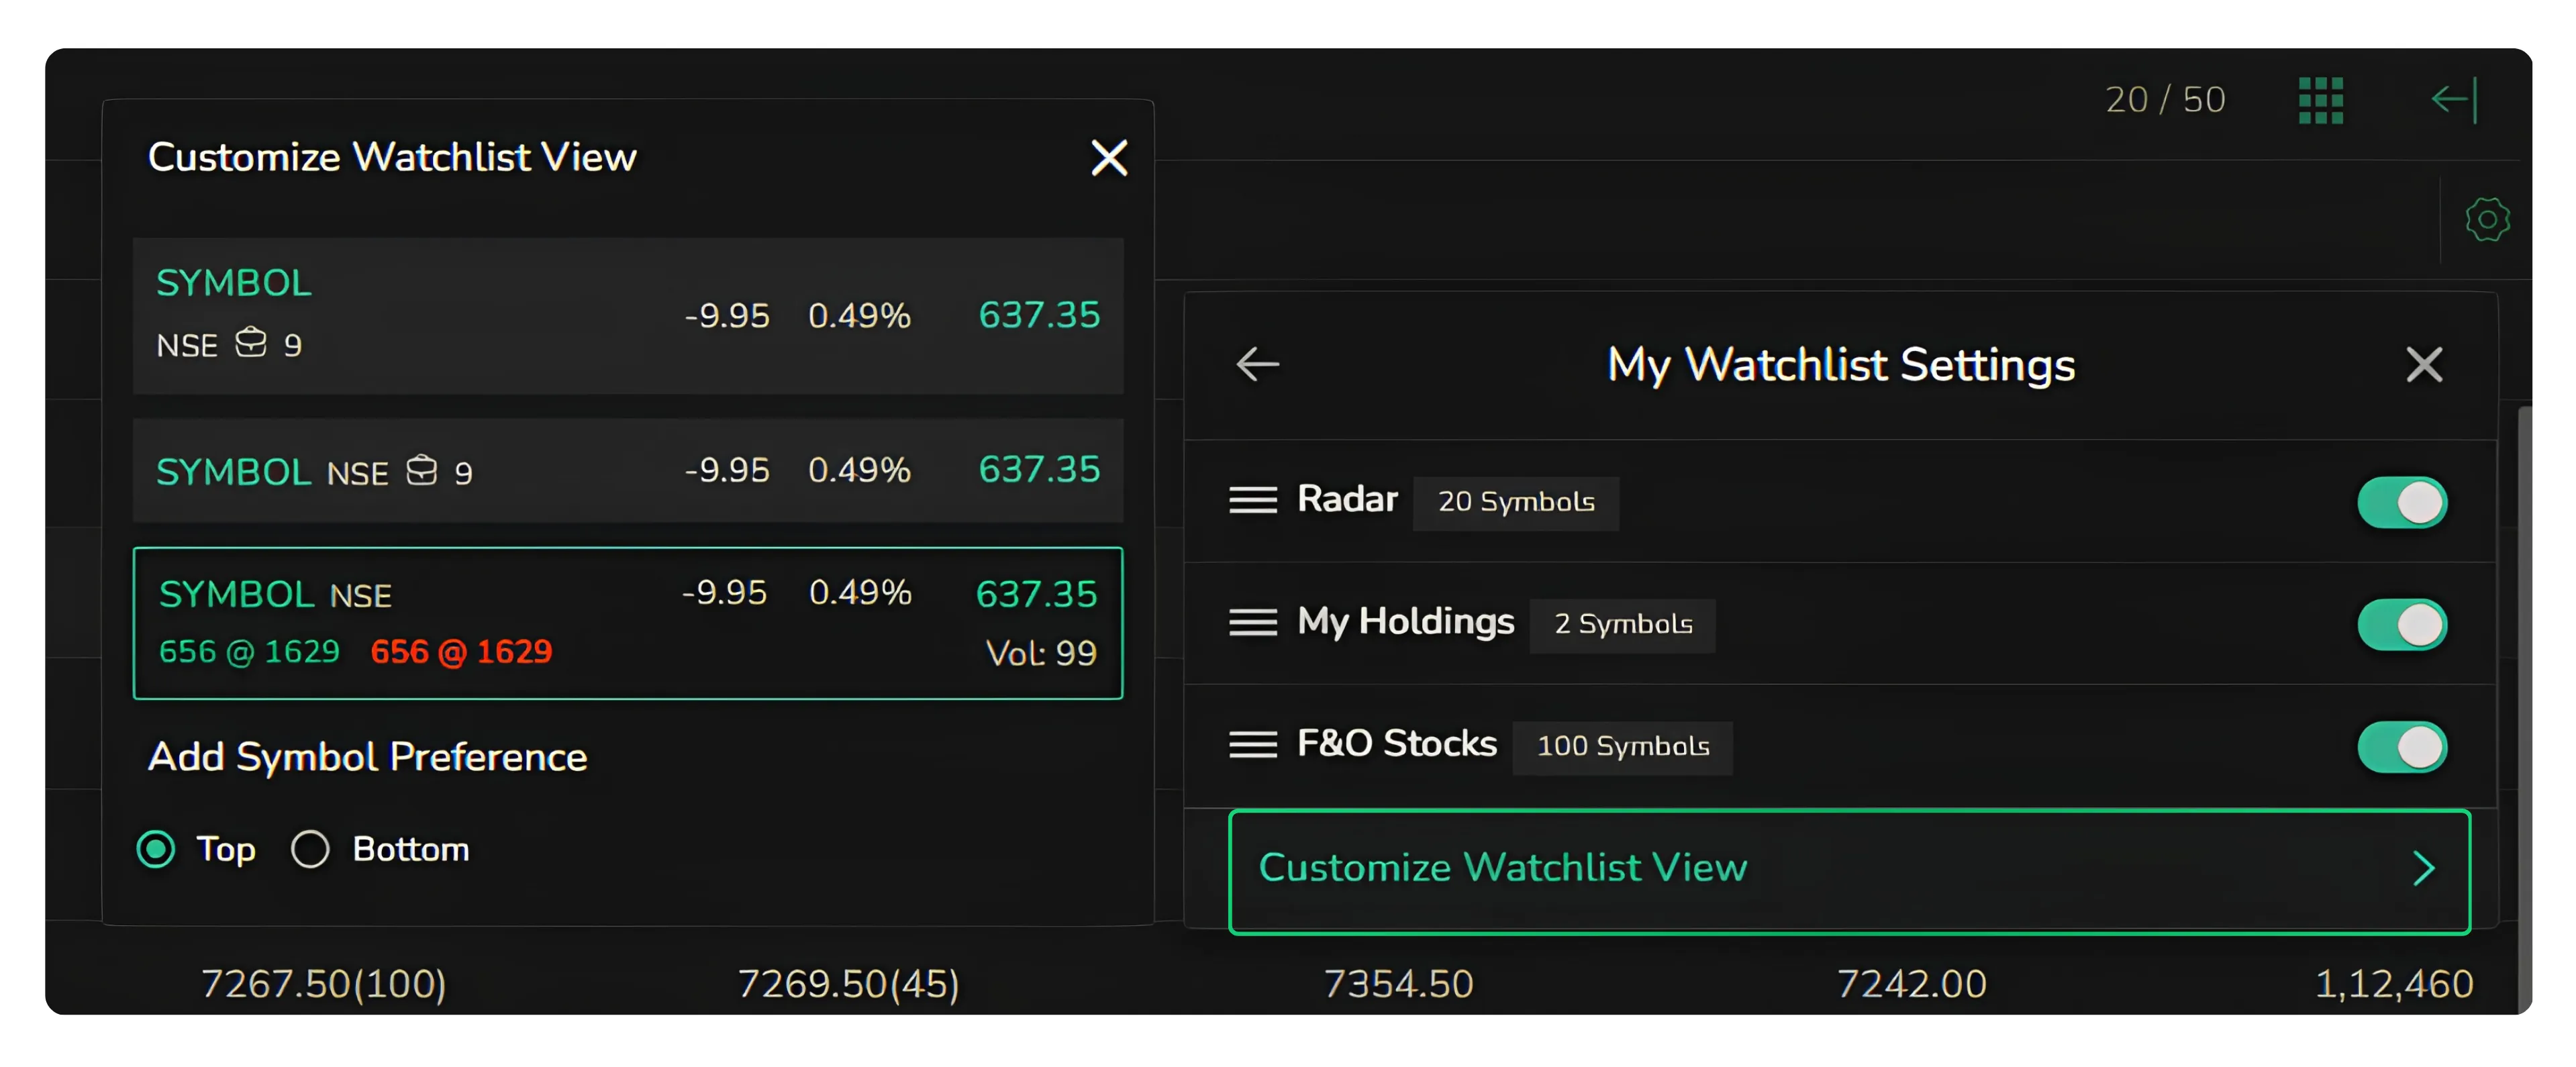
There is also a Customize Watchlist View setting that governs how the list itself looks and behaves, including whether newly added symbols land at the top or the bottom of the watchlist.
Heatmap View
For a quick visual read rather than a column of numbers, the heatmap icon switches the watchlist into a colour-coded grid. Gains and losses are graded by shade, from above five percent down to below five percent, so the overall tone of your list registers in a single glance before you drill into any one name.
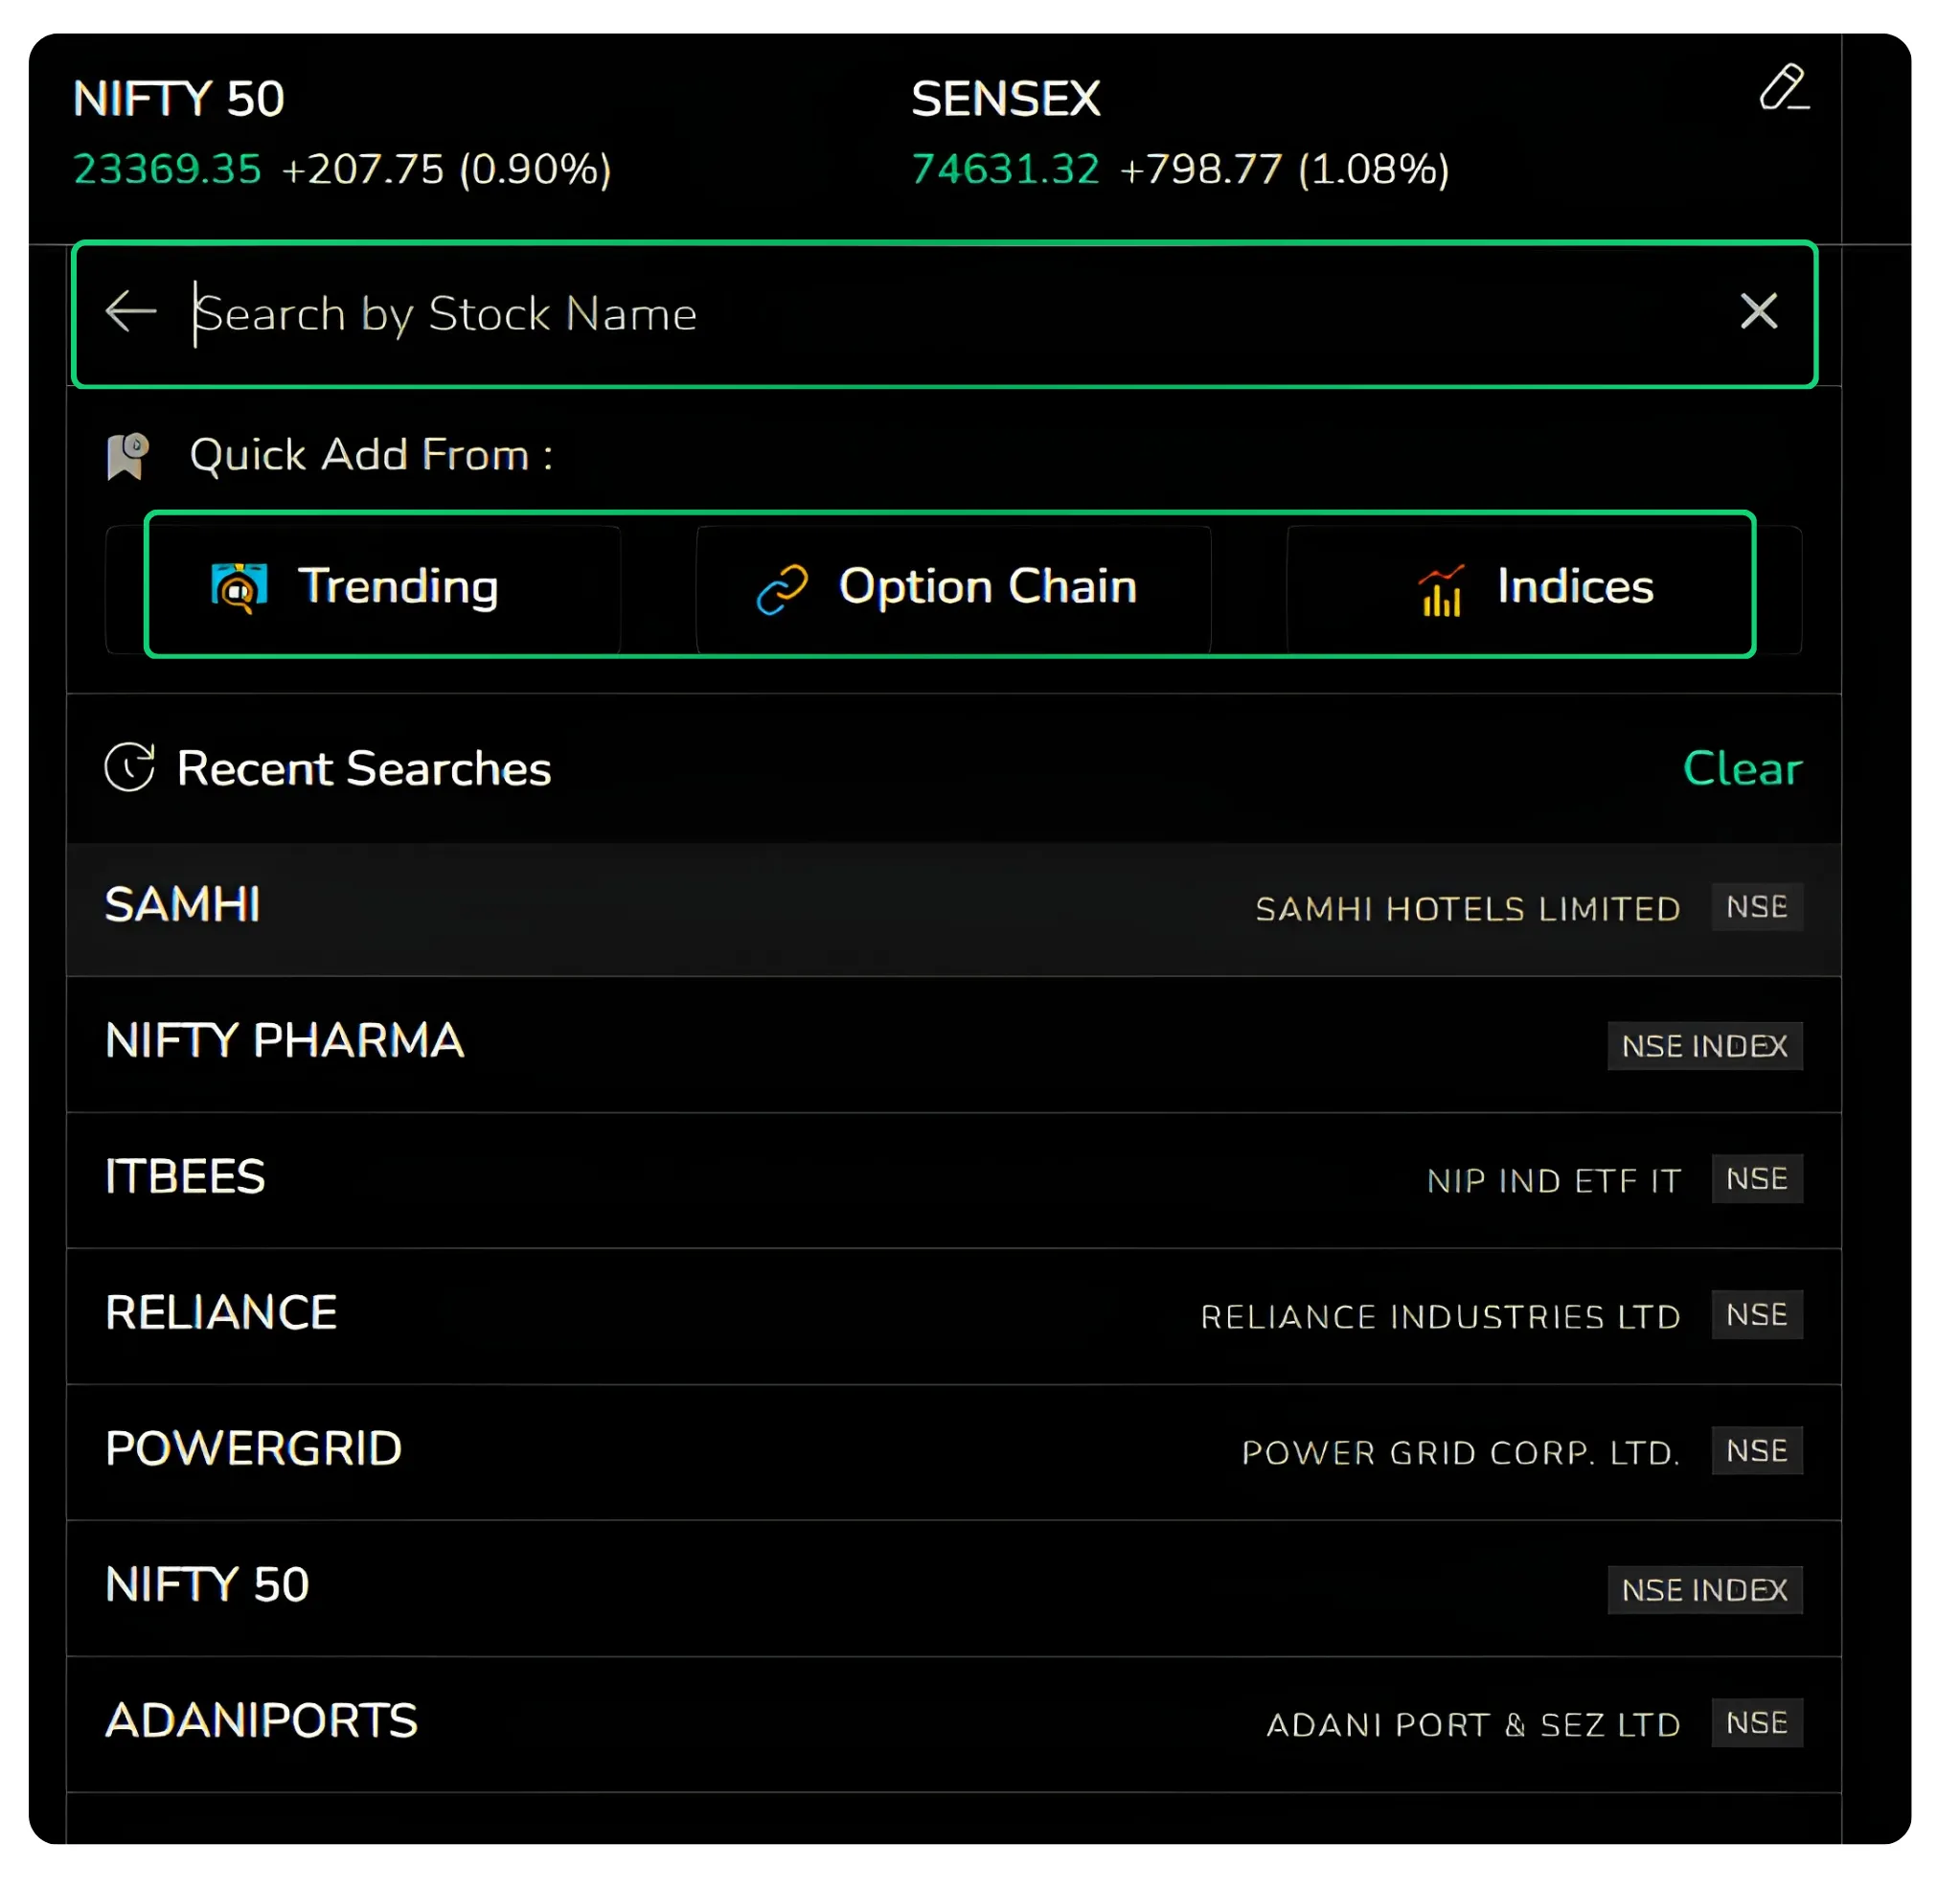
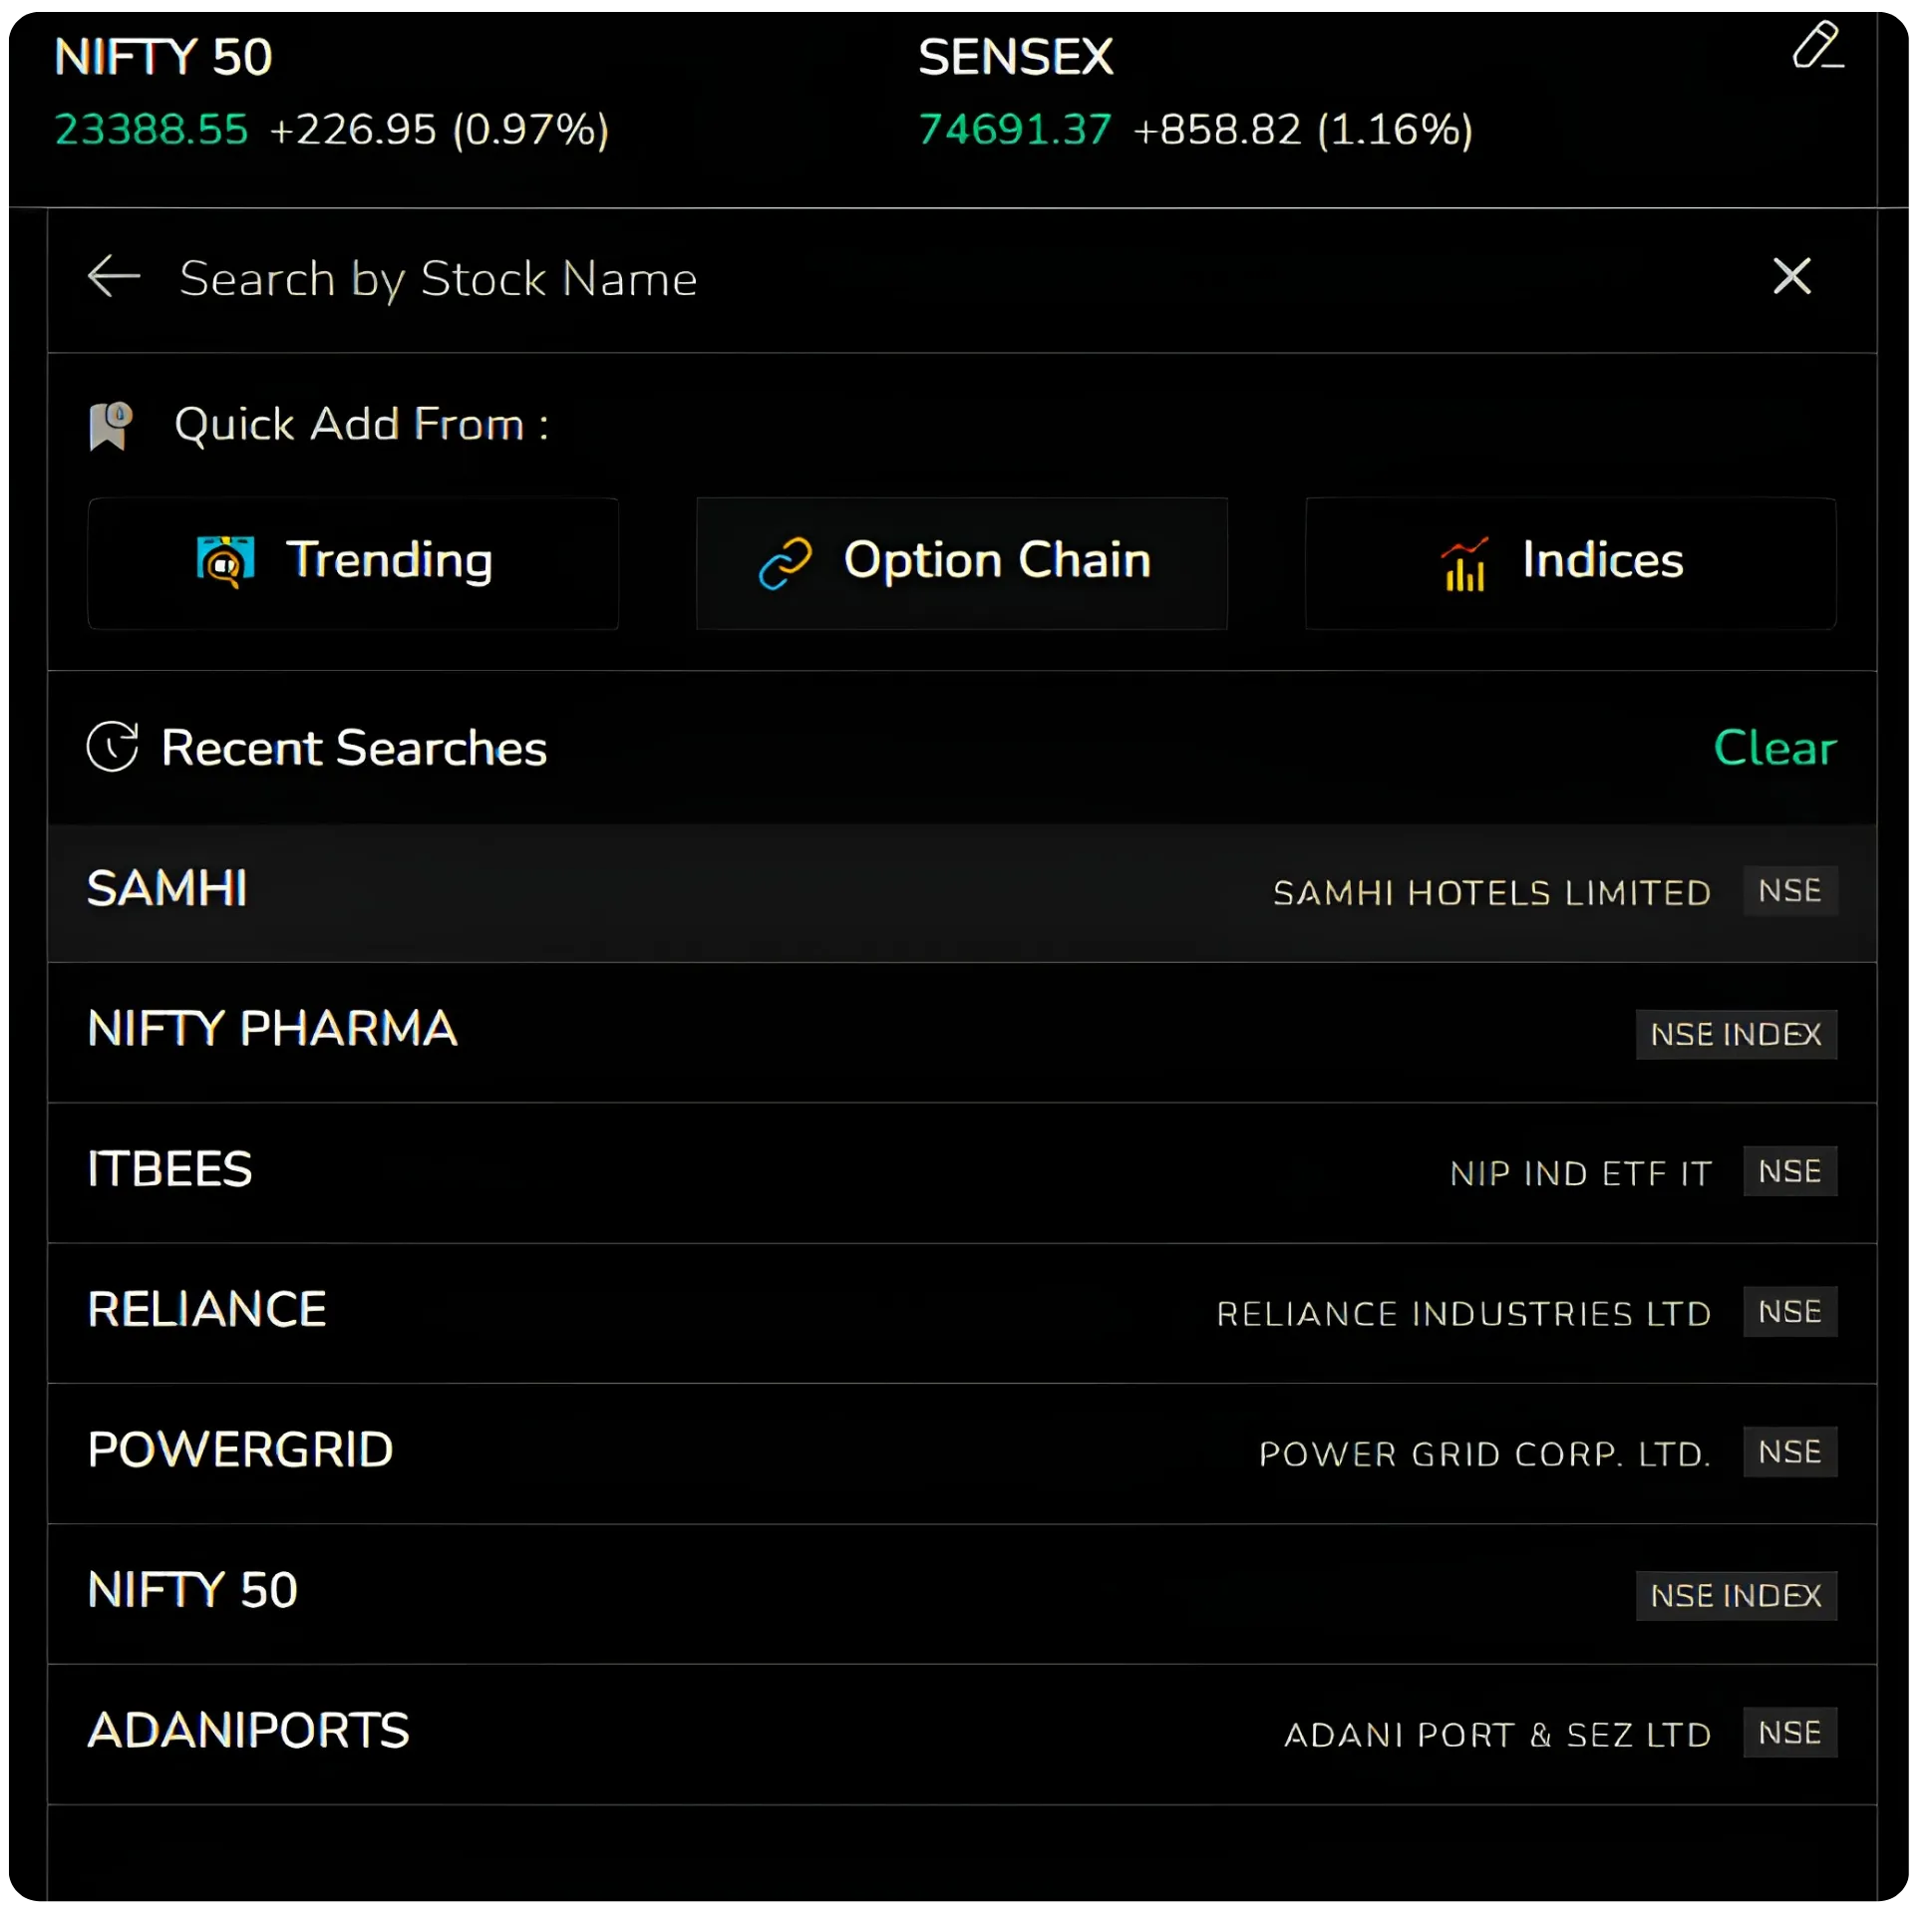
The Search Bar
Clicking the search bar does more than look up a stock by name. It opens three quick-add routes, Trending, Option Chain and Indices, with your recent searches listed below them for fast return visits.
The search also works the moment you start typing. Enter even a few letters, say "nif," and matches appear at once, grouped under three tabs: Stocks, F&O and Index.
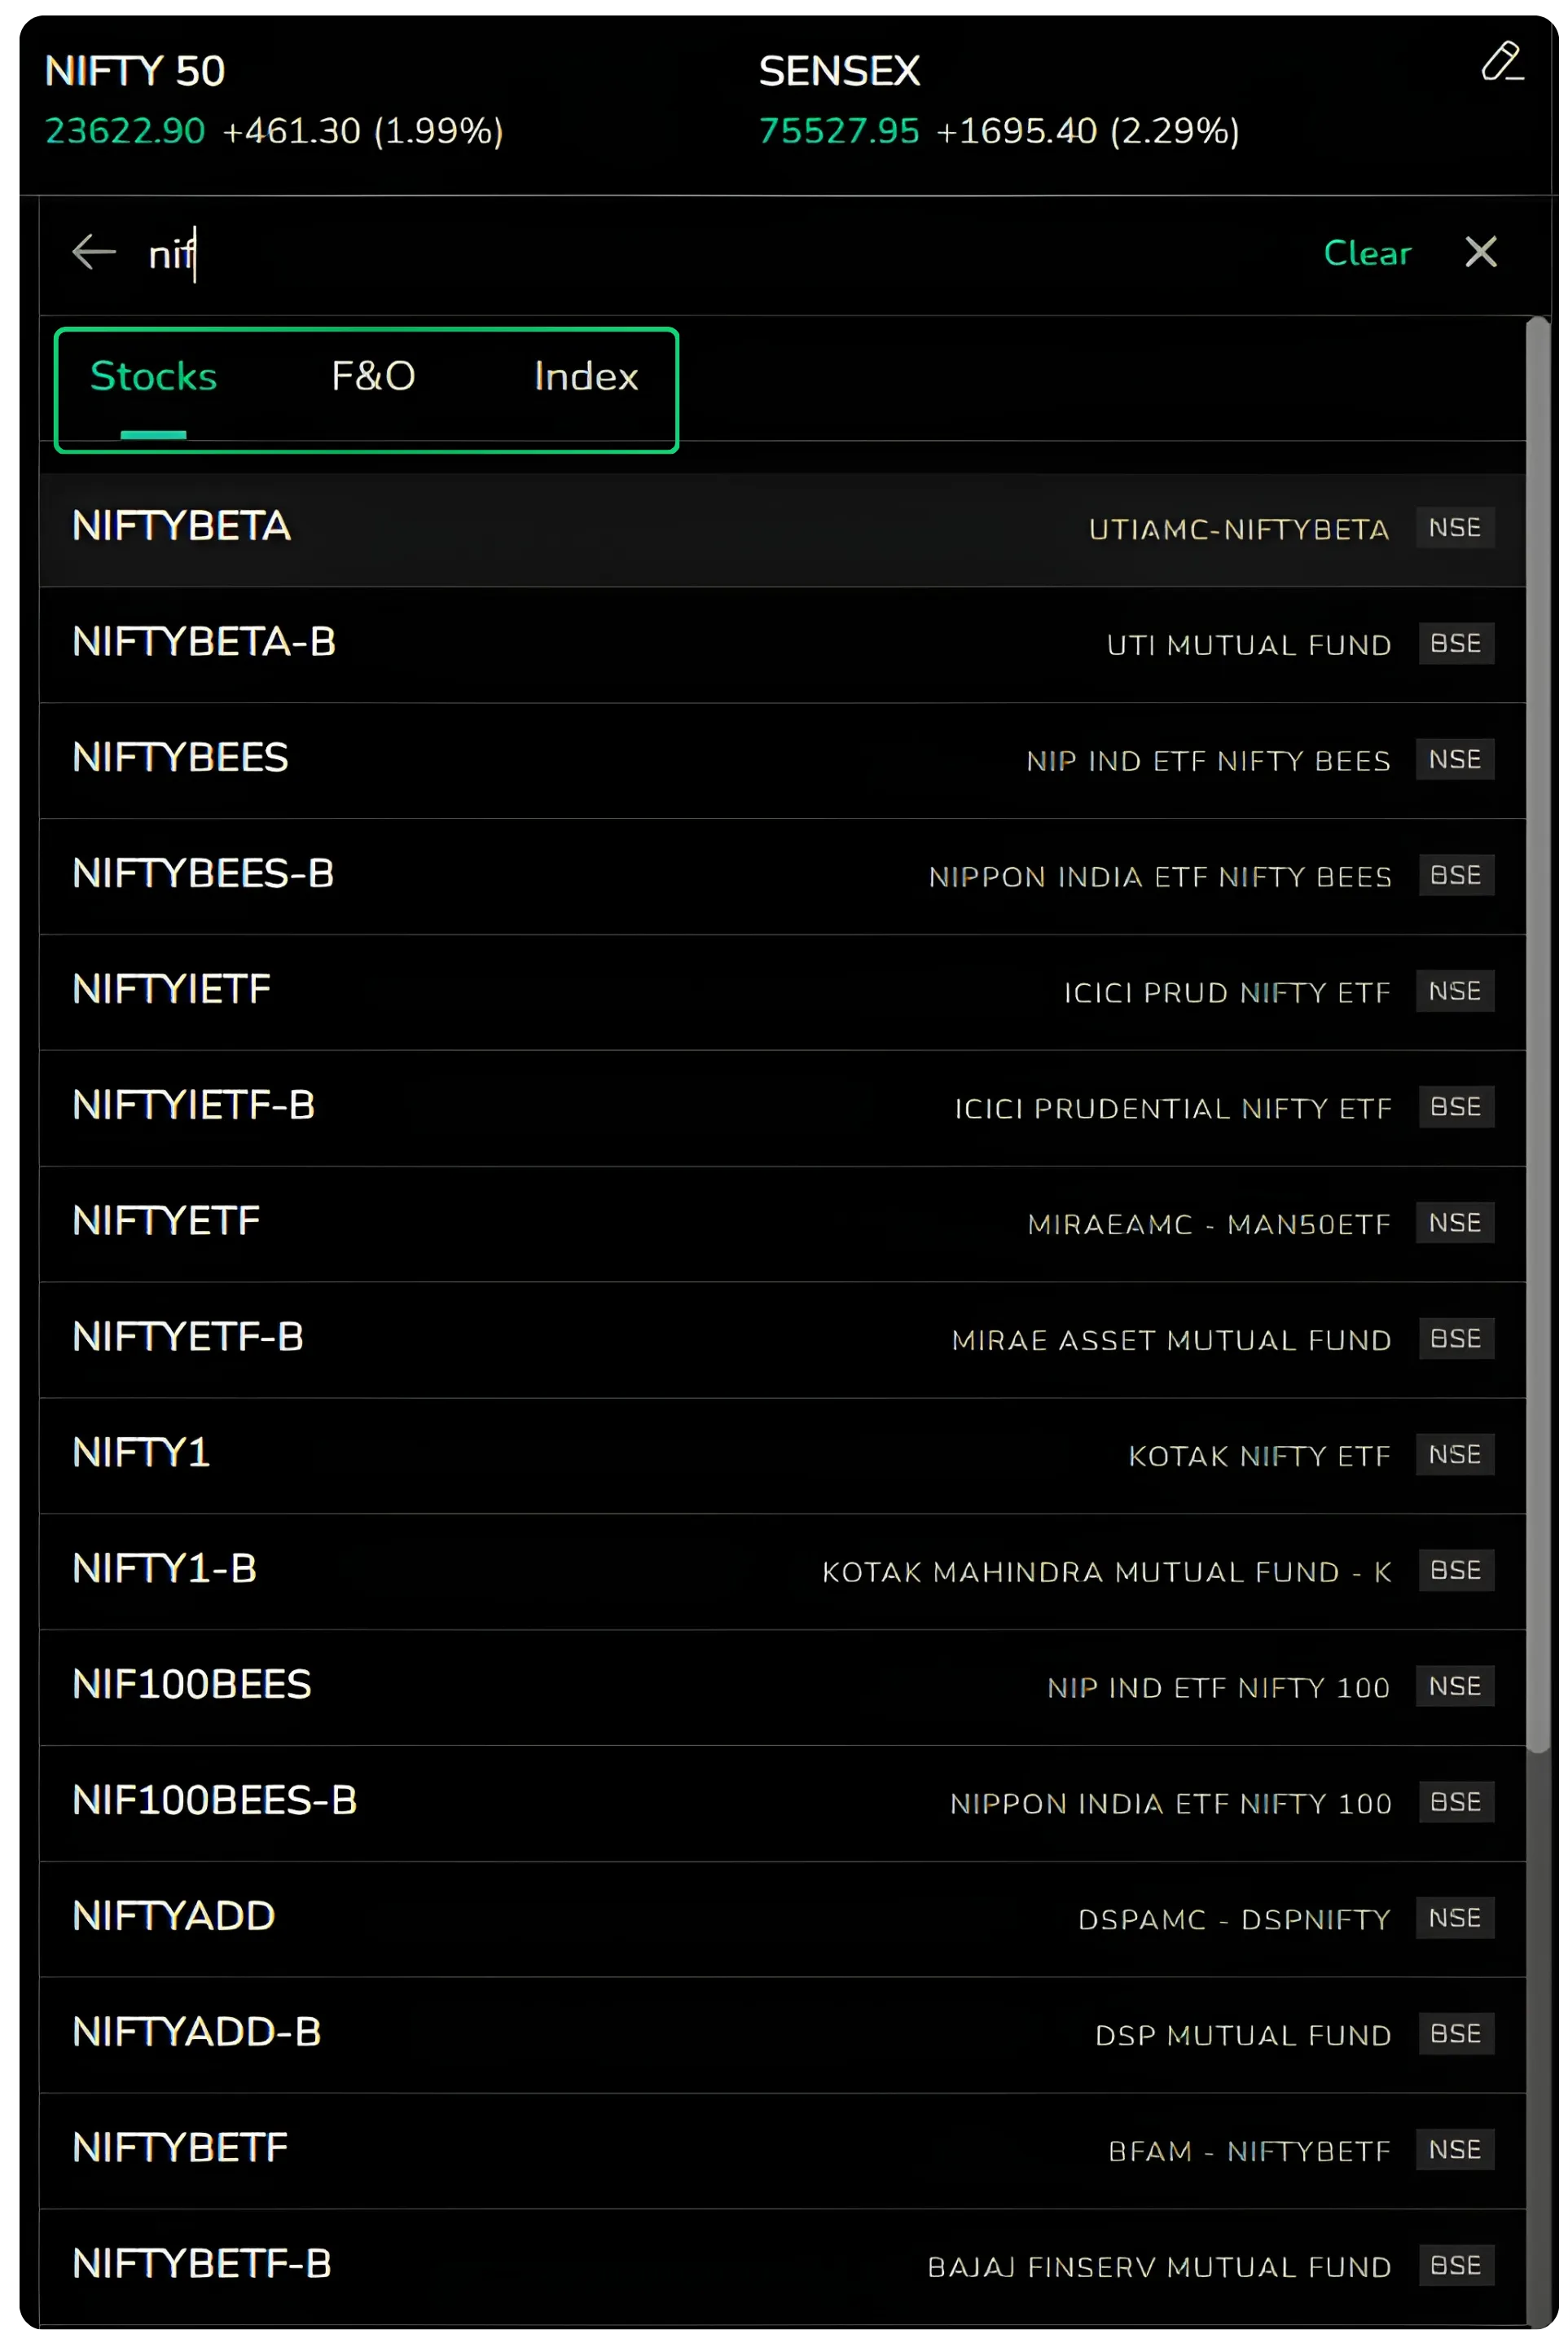
The tabs let you narrow a broad match down to exactly the kind of instrument you are after, so one set of letters can take you to the cash stock, its futures and options contracts, or the index that shares the name, without running a separate search for each.
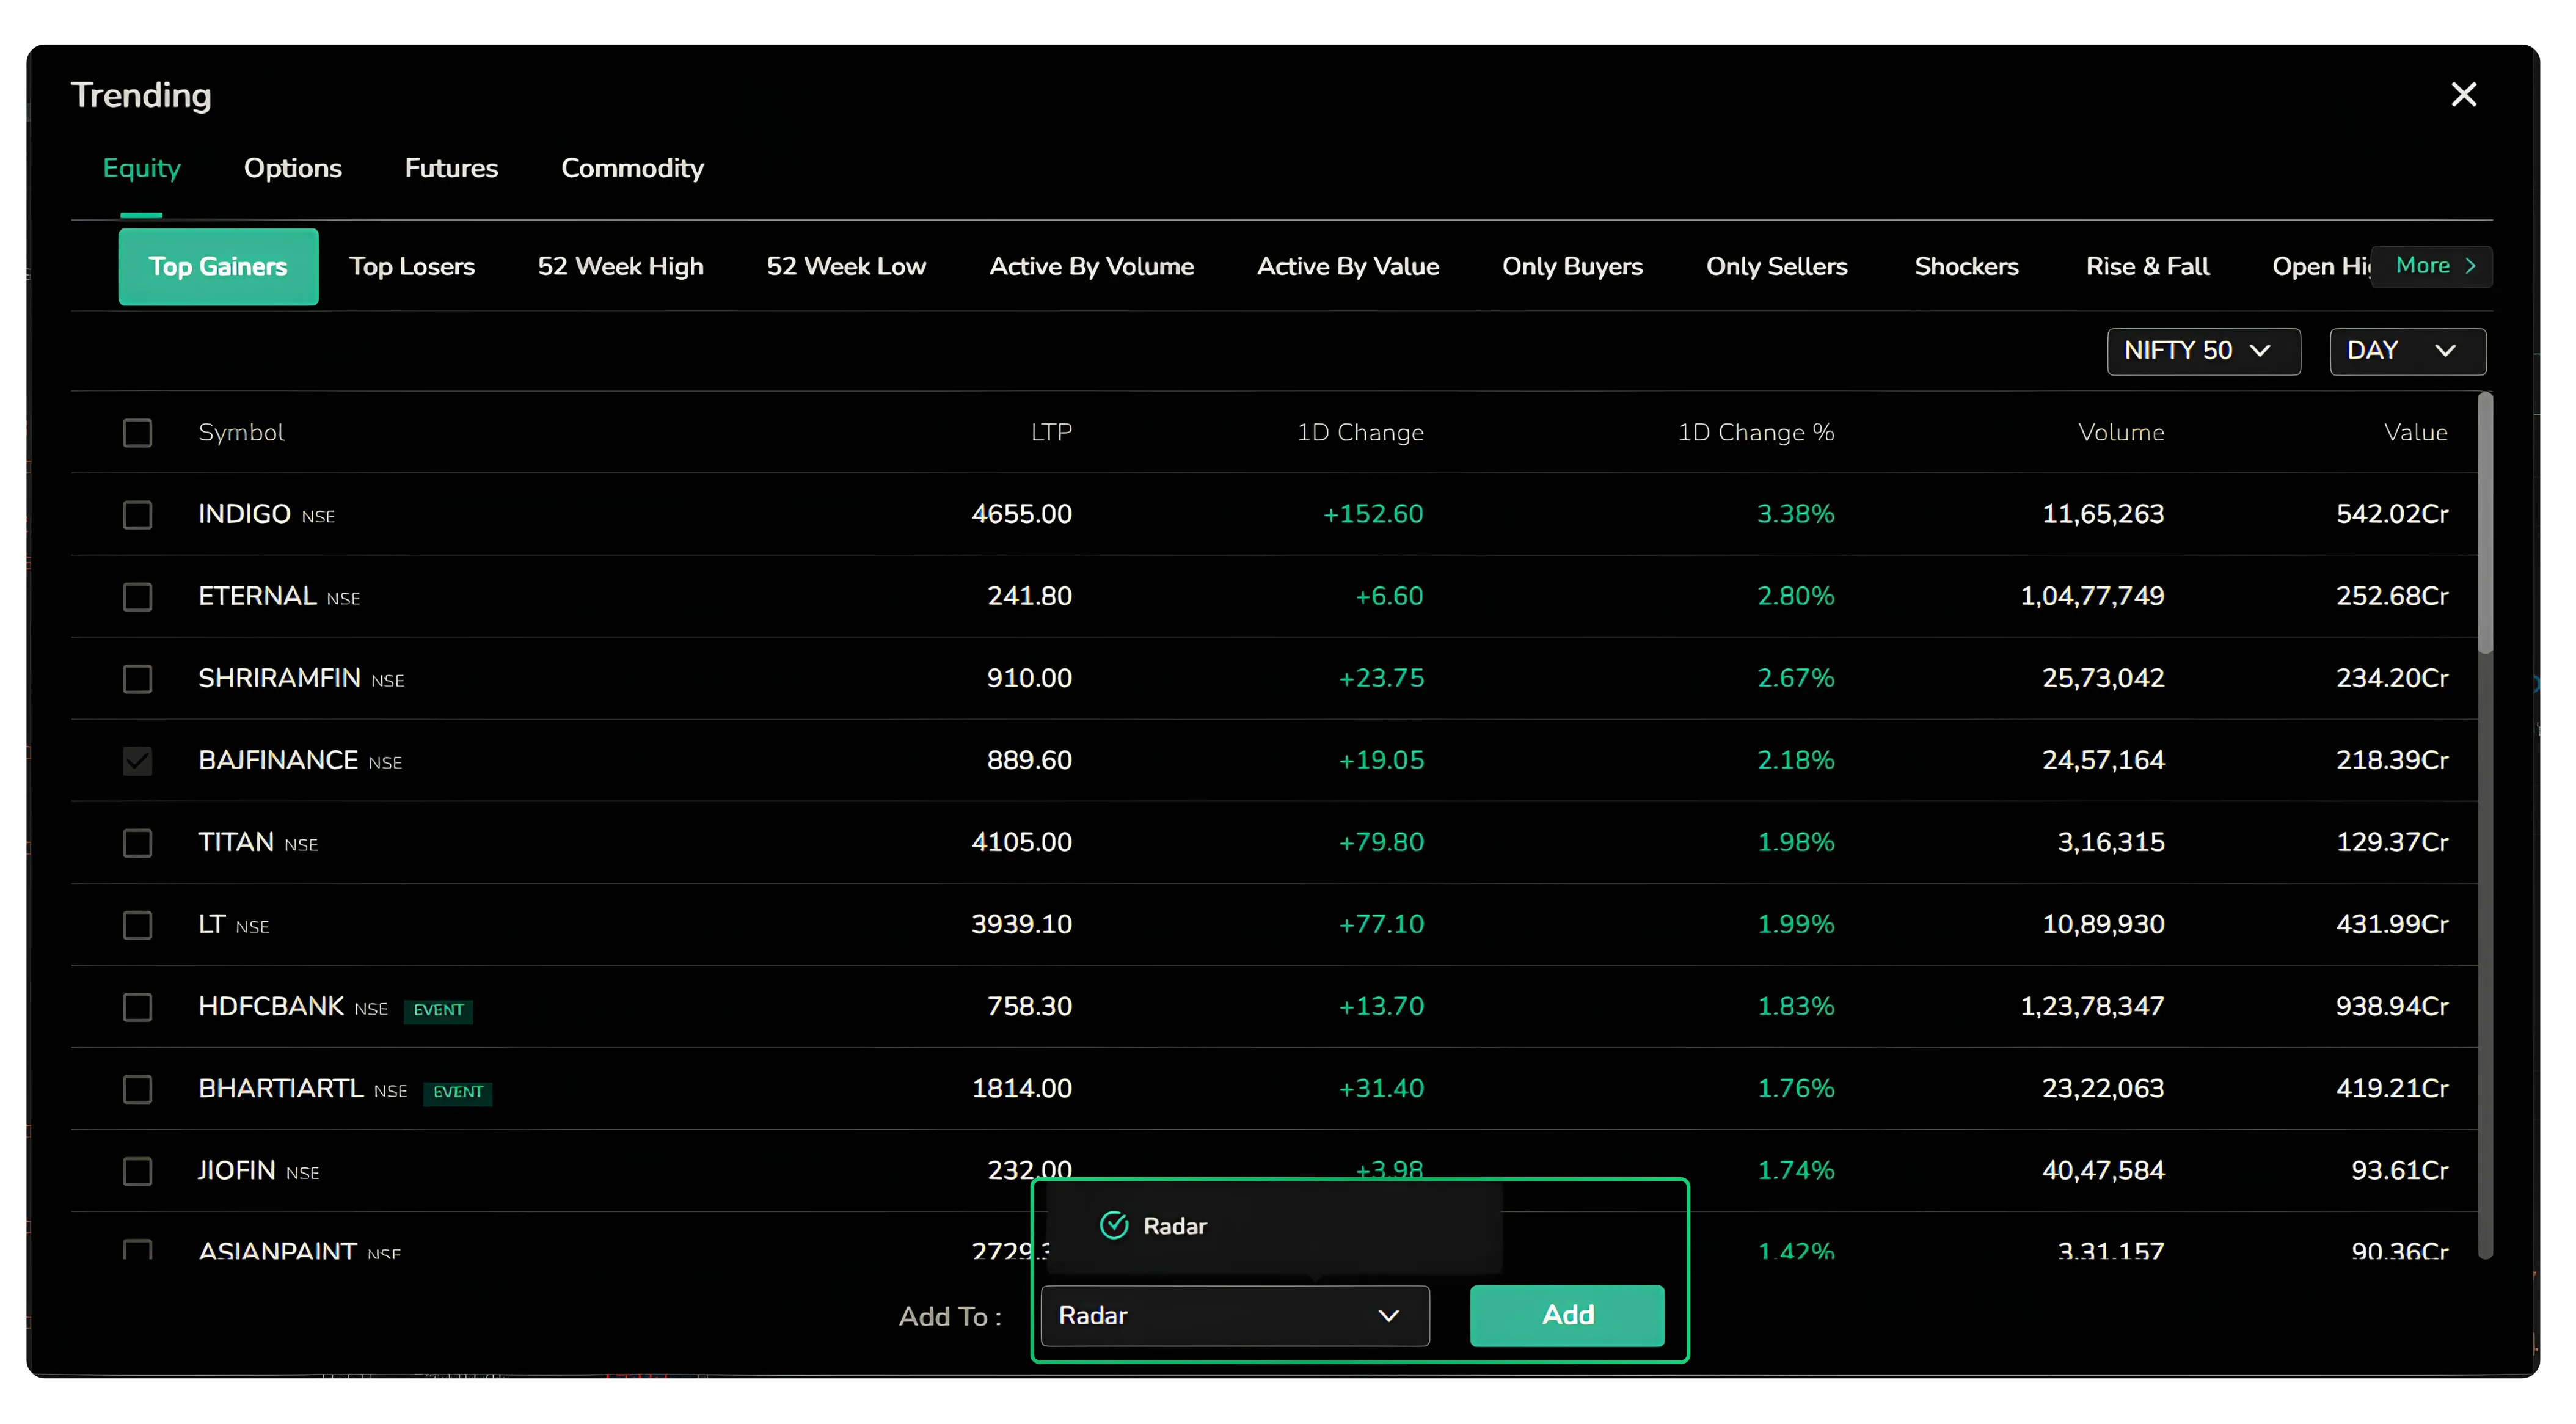
Trending
Trending is organised under four headings: Equity, Options, Futures and Commodity.
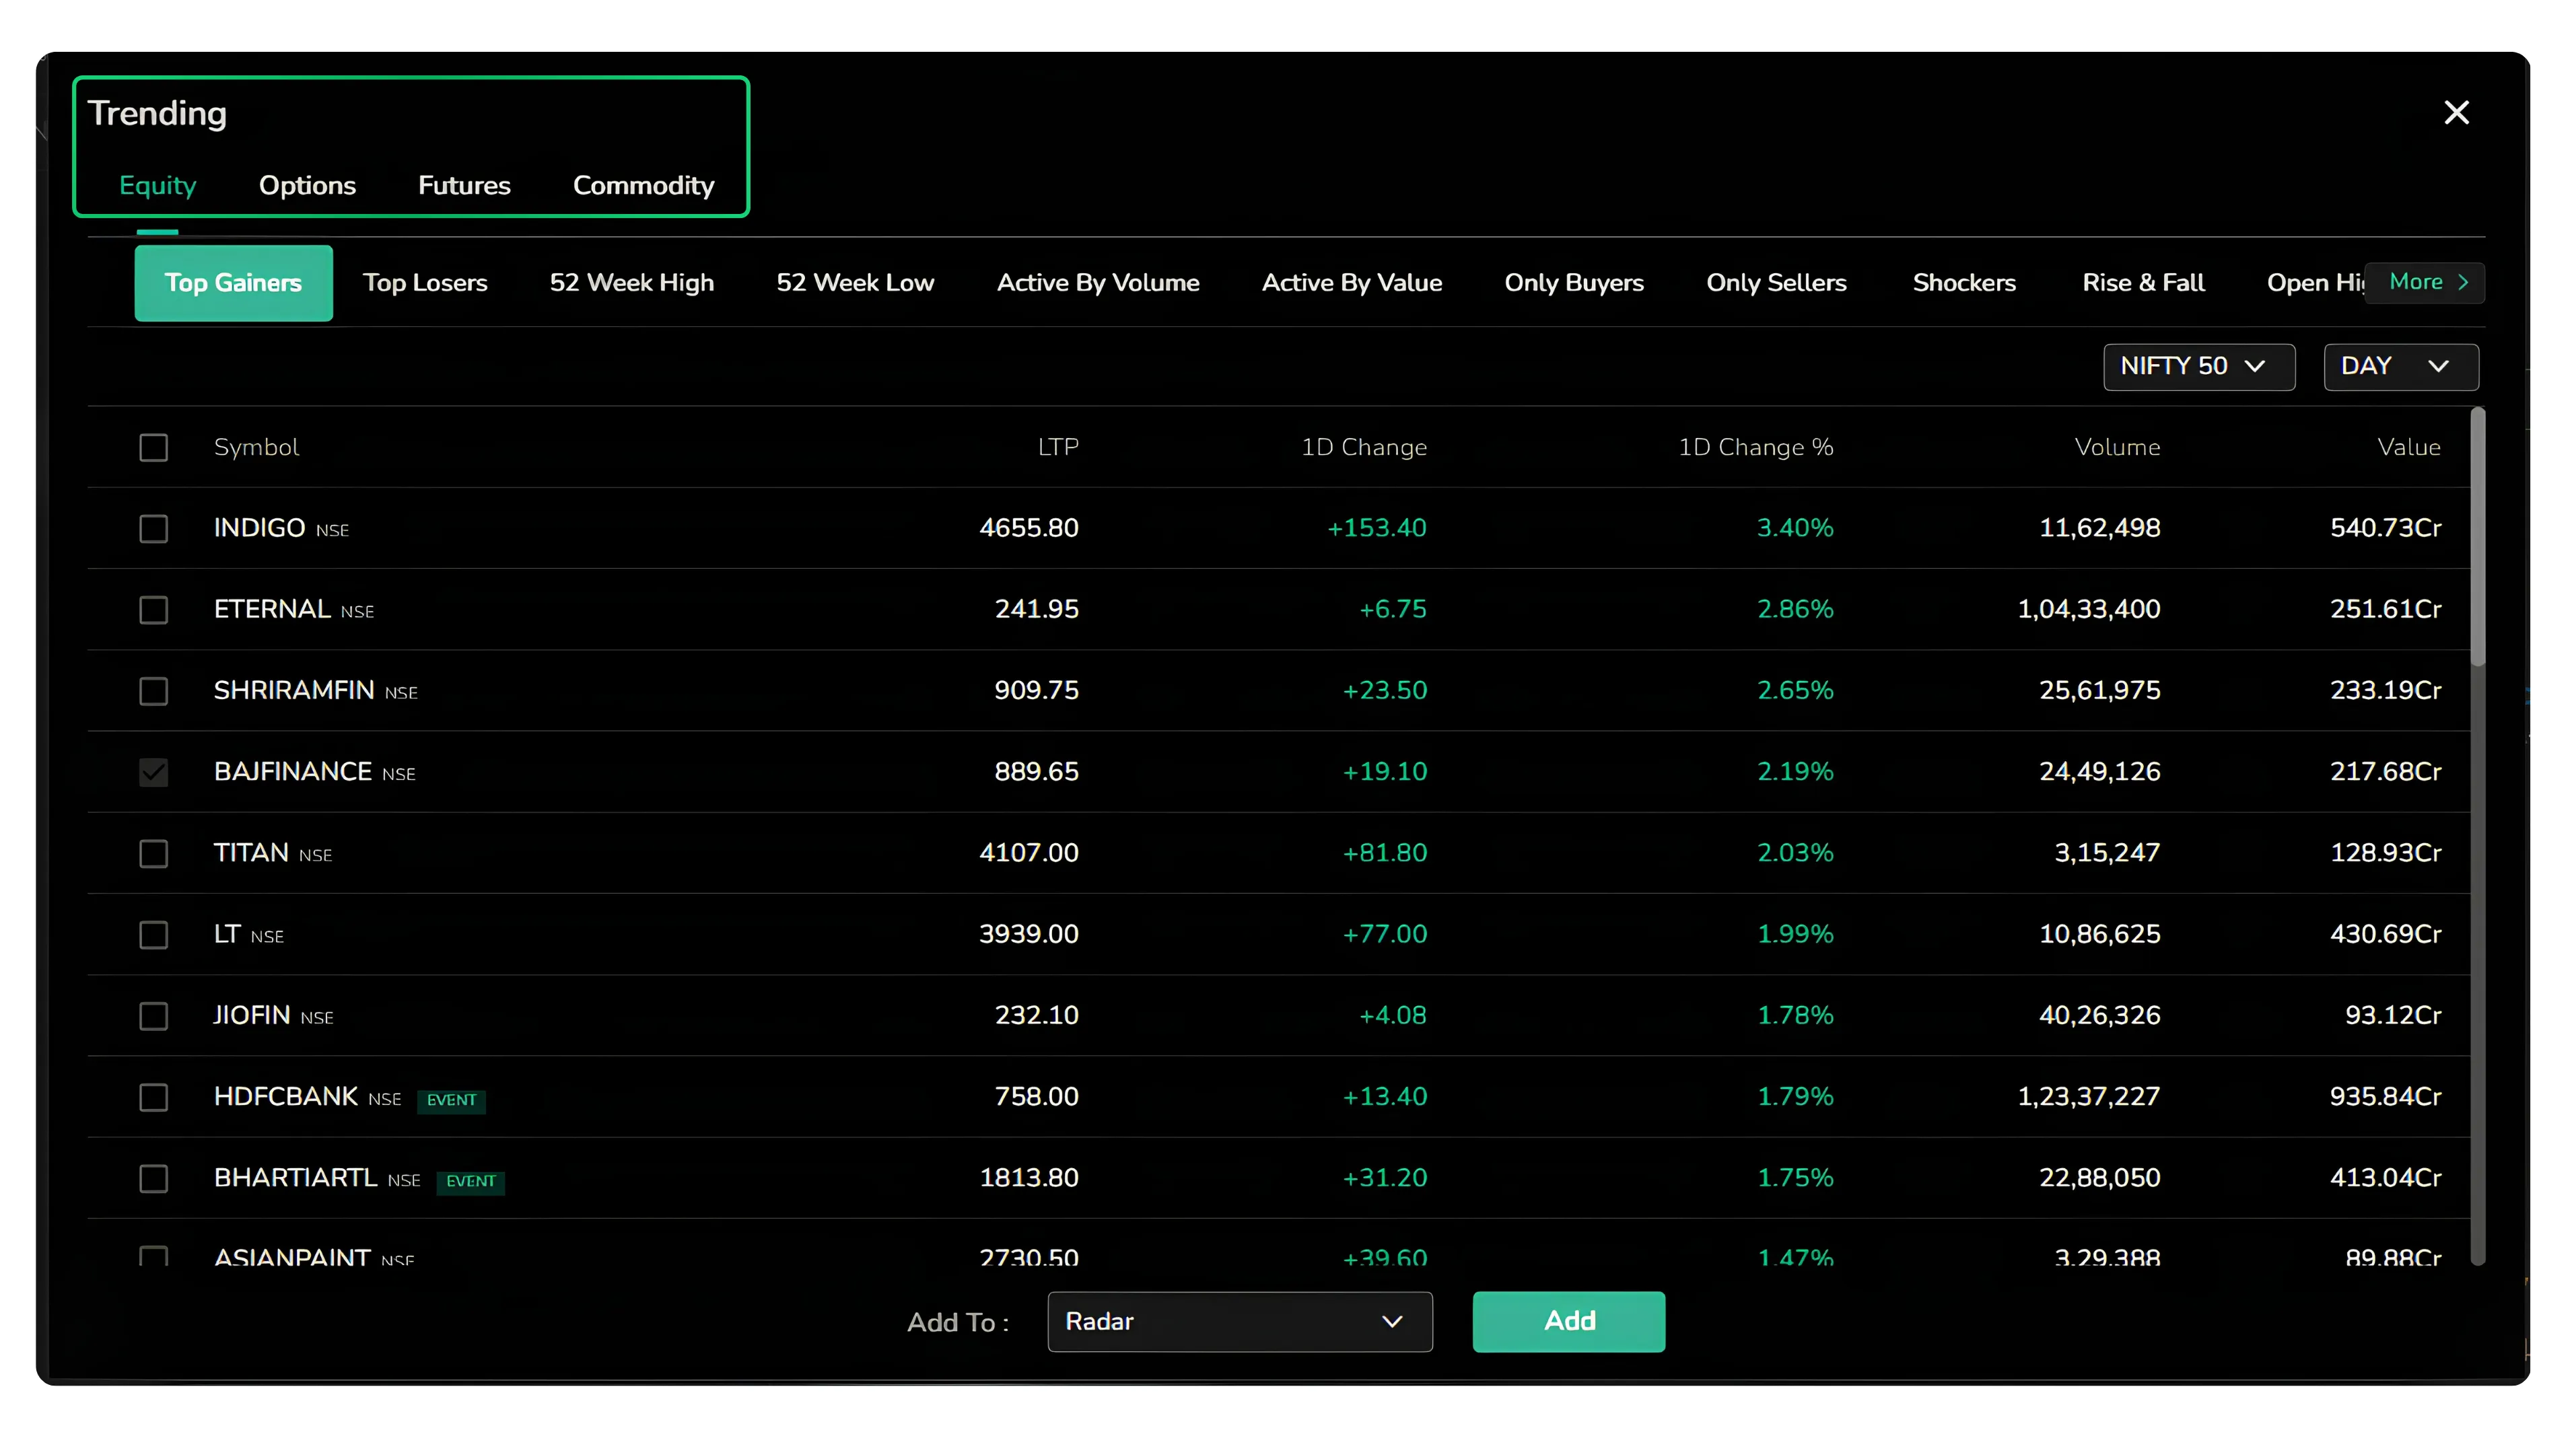
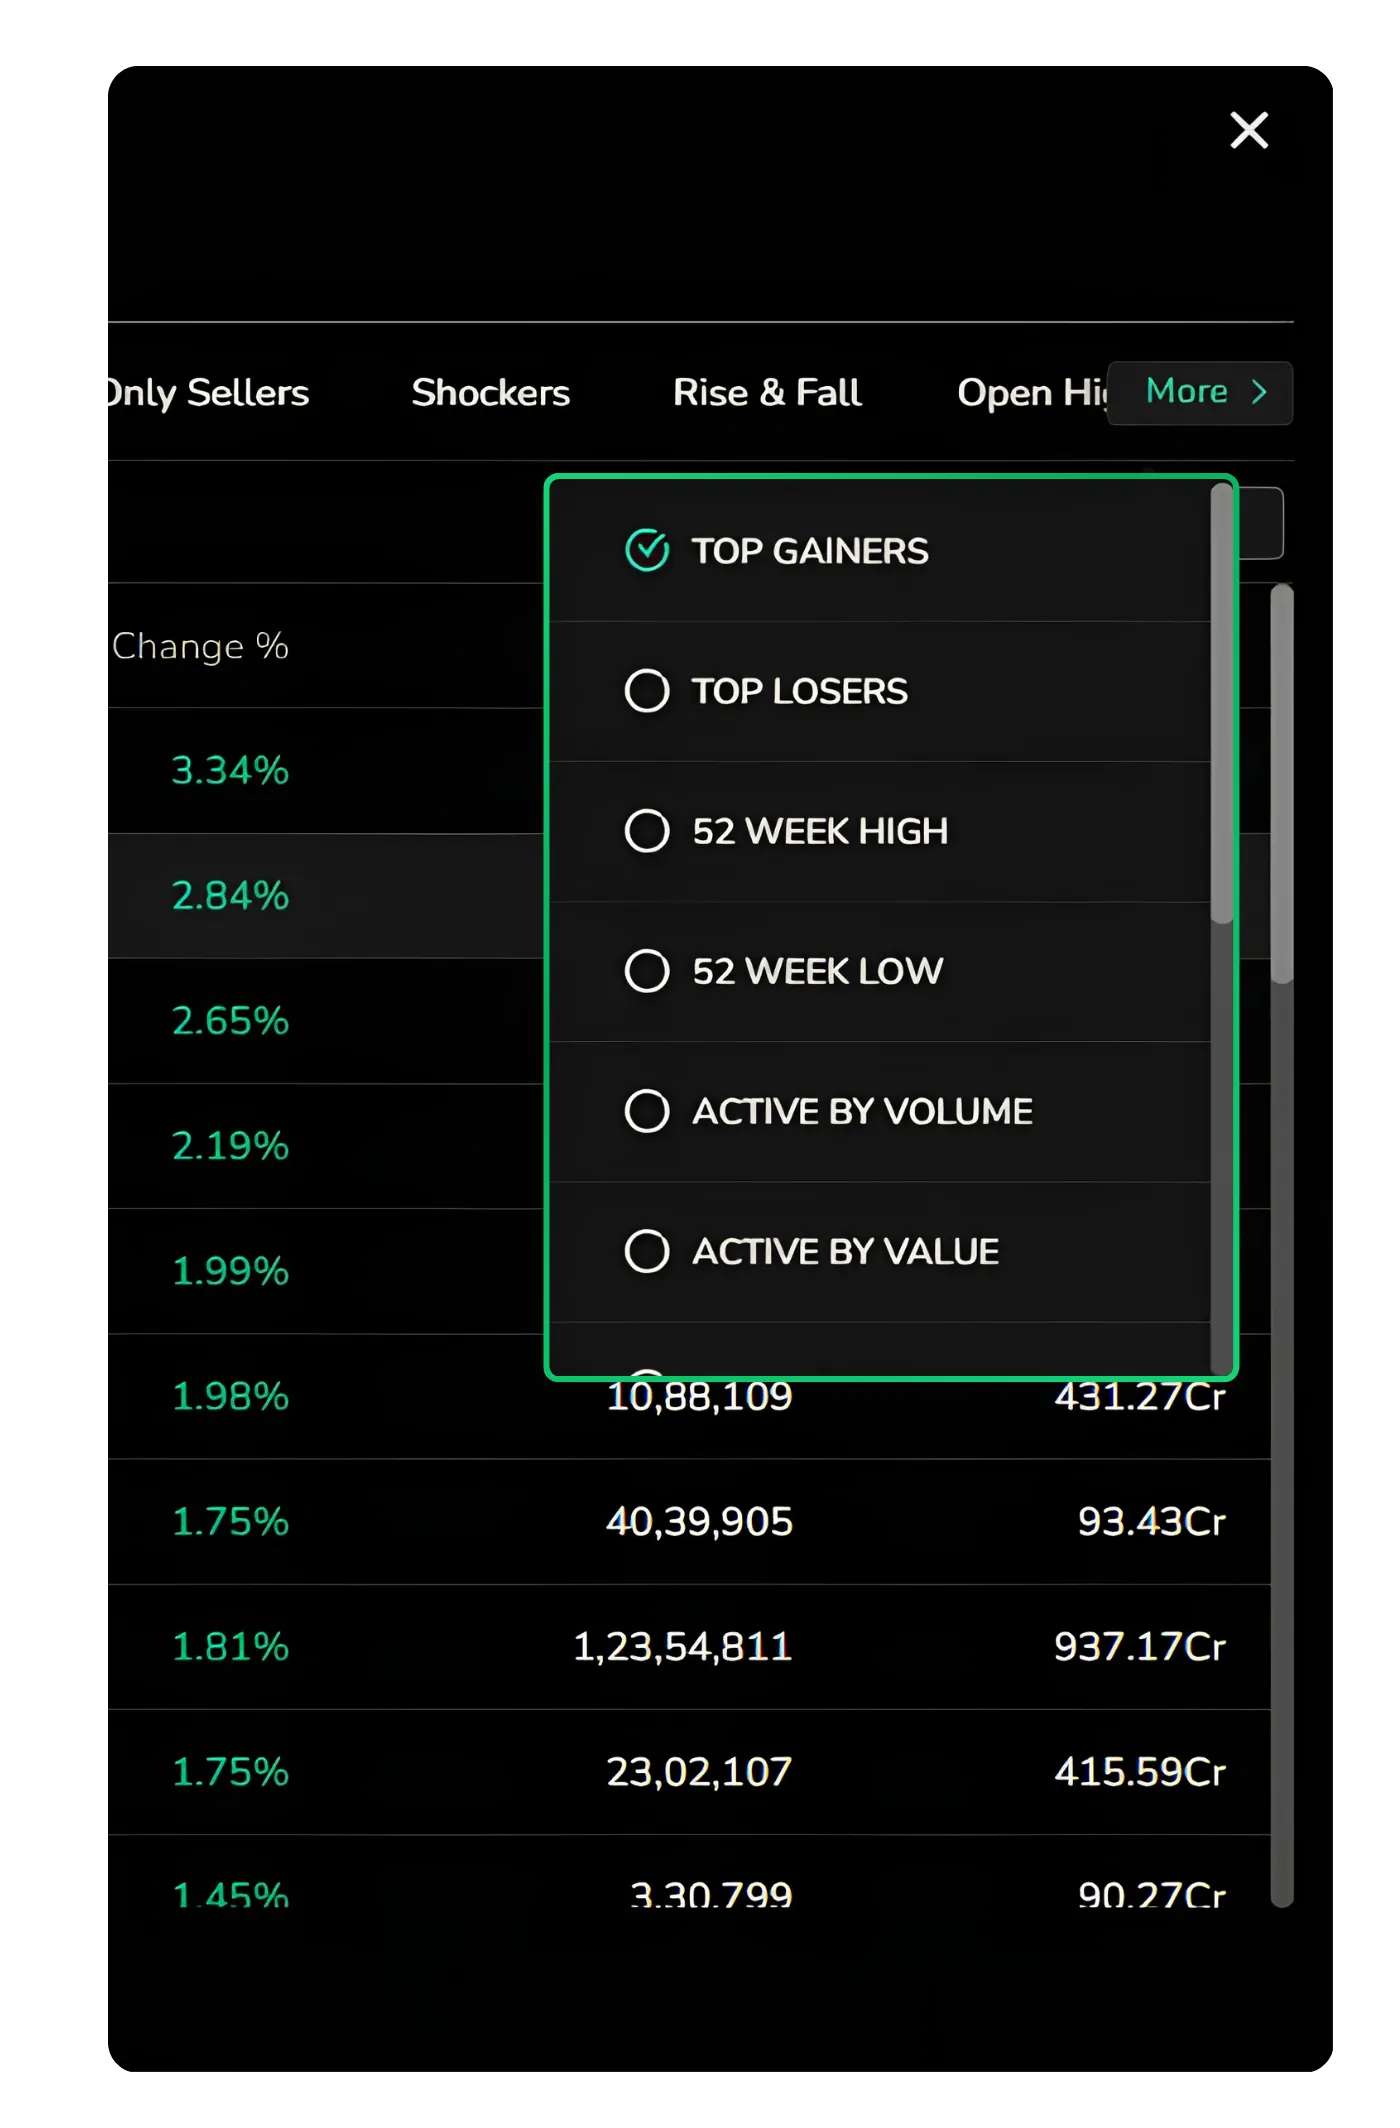
Under Equity you can sort by Top Gainers, Top Losers, 52 Week High, 52 Week Low, Active By Volume, Active By Value, Only Buyers, Only Sellers, Shockers, Rise & Fall and more, with a More dropdown at the right that scrolls through the full set of categories.
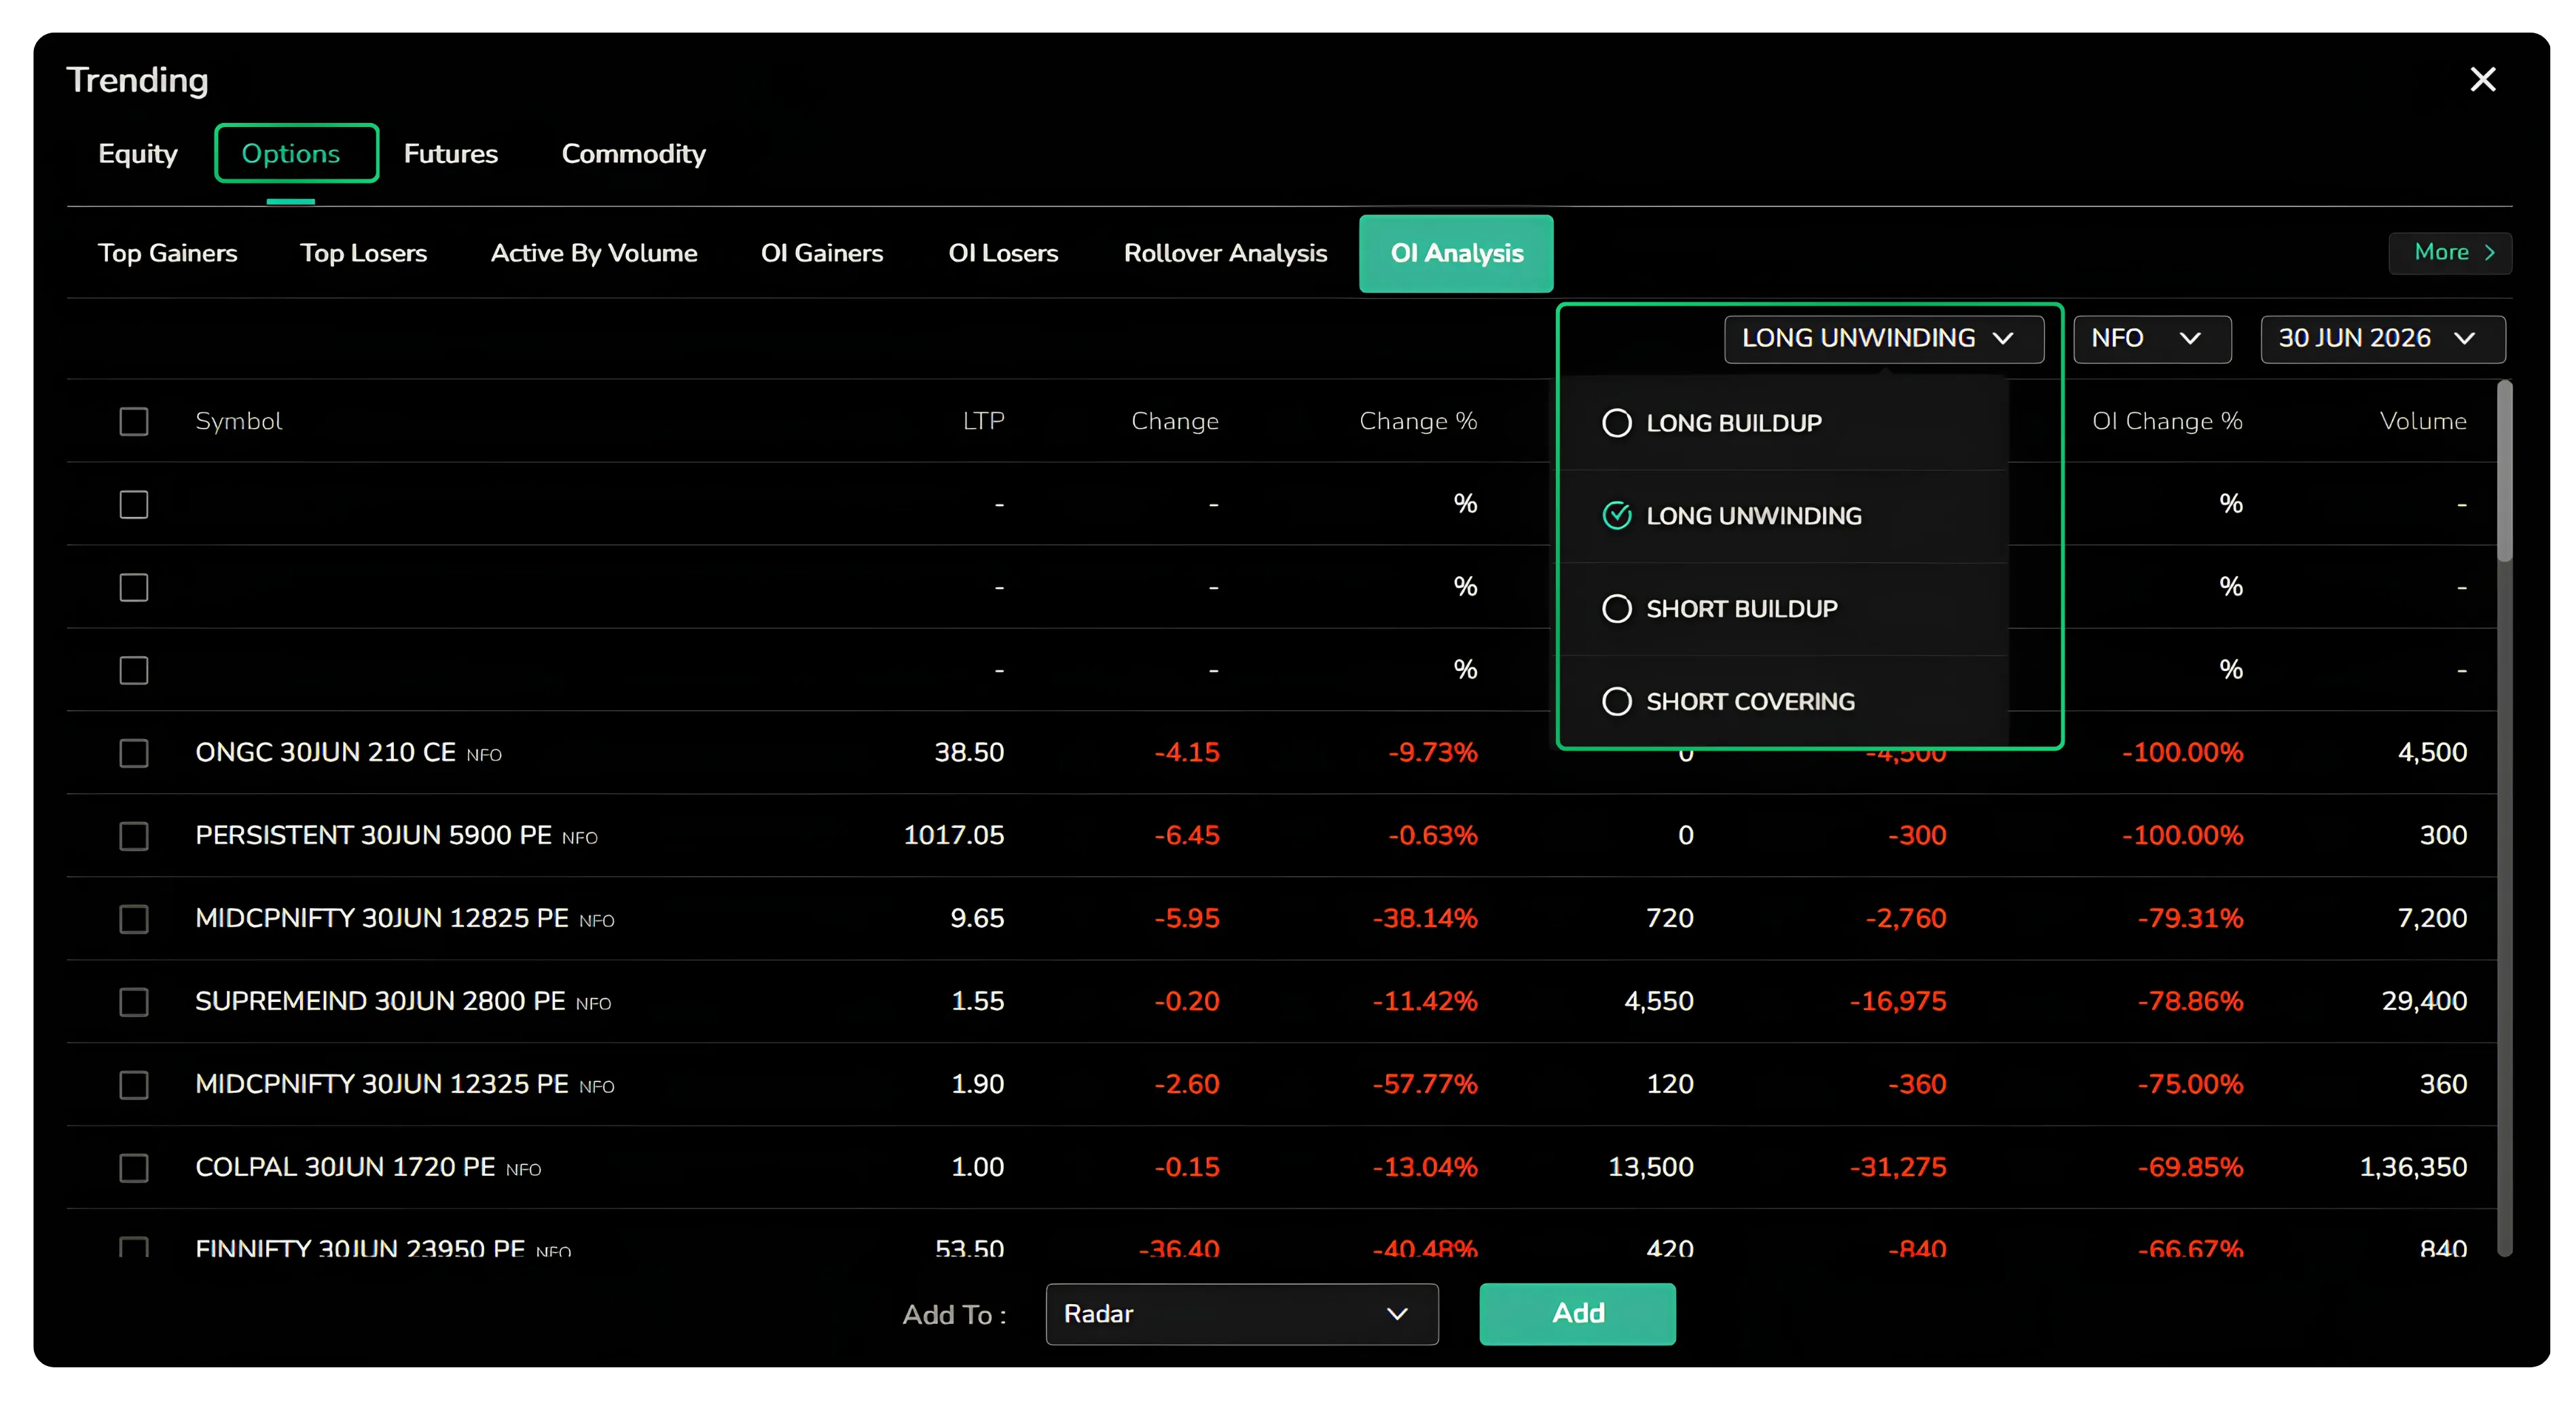
The Options heading carries its own relevant cuts such as OI Gainers, OI Losers, Rollover Analysis and OI Analysis.
While Futures and Commodity offer their equivalents.
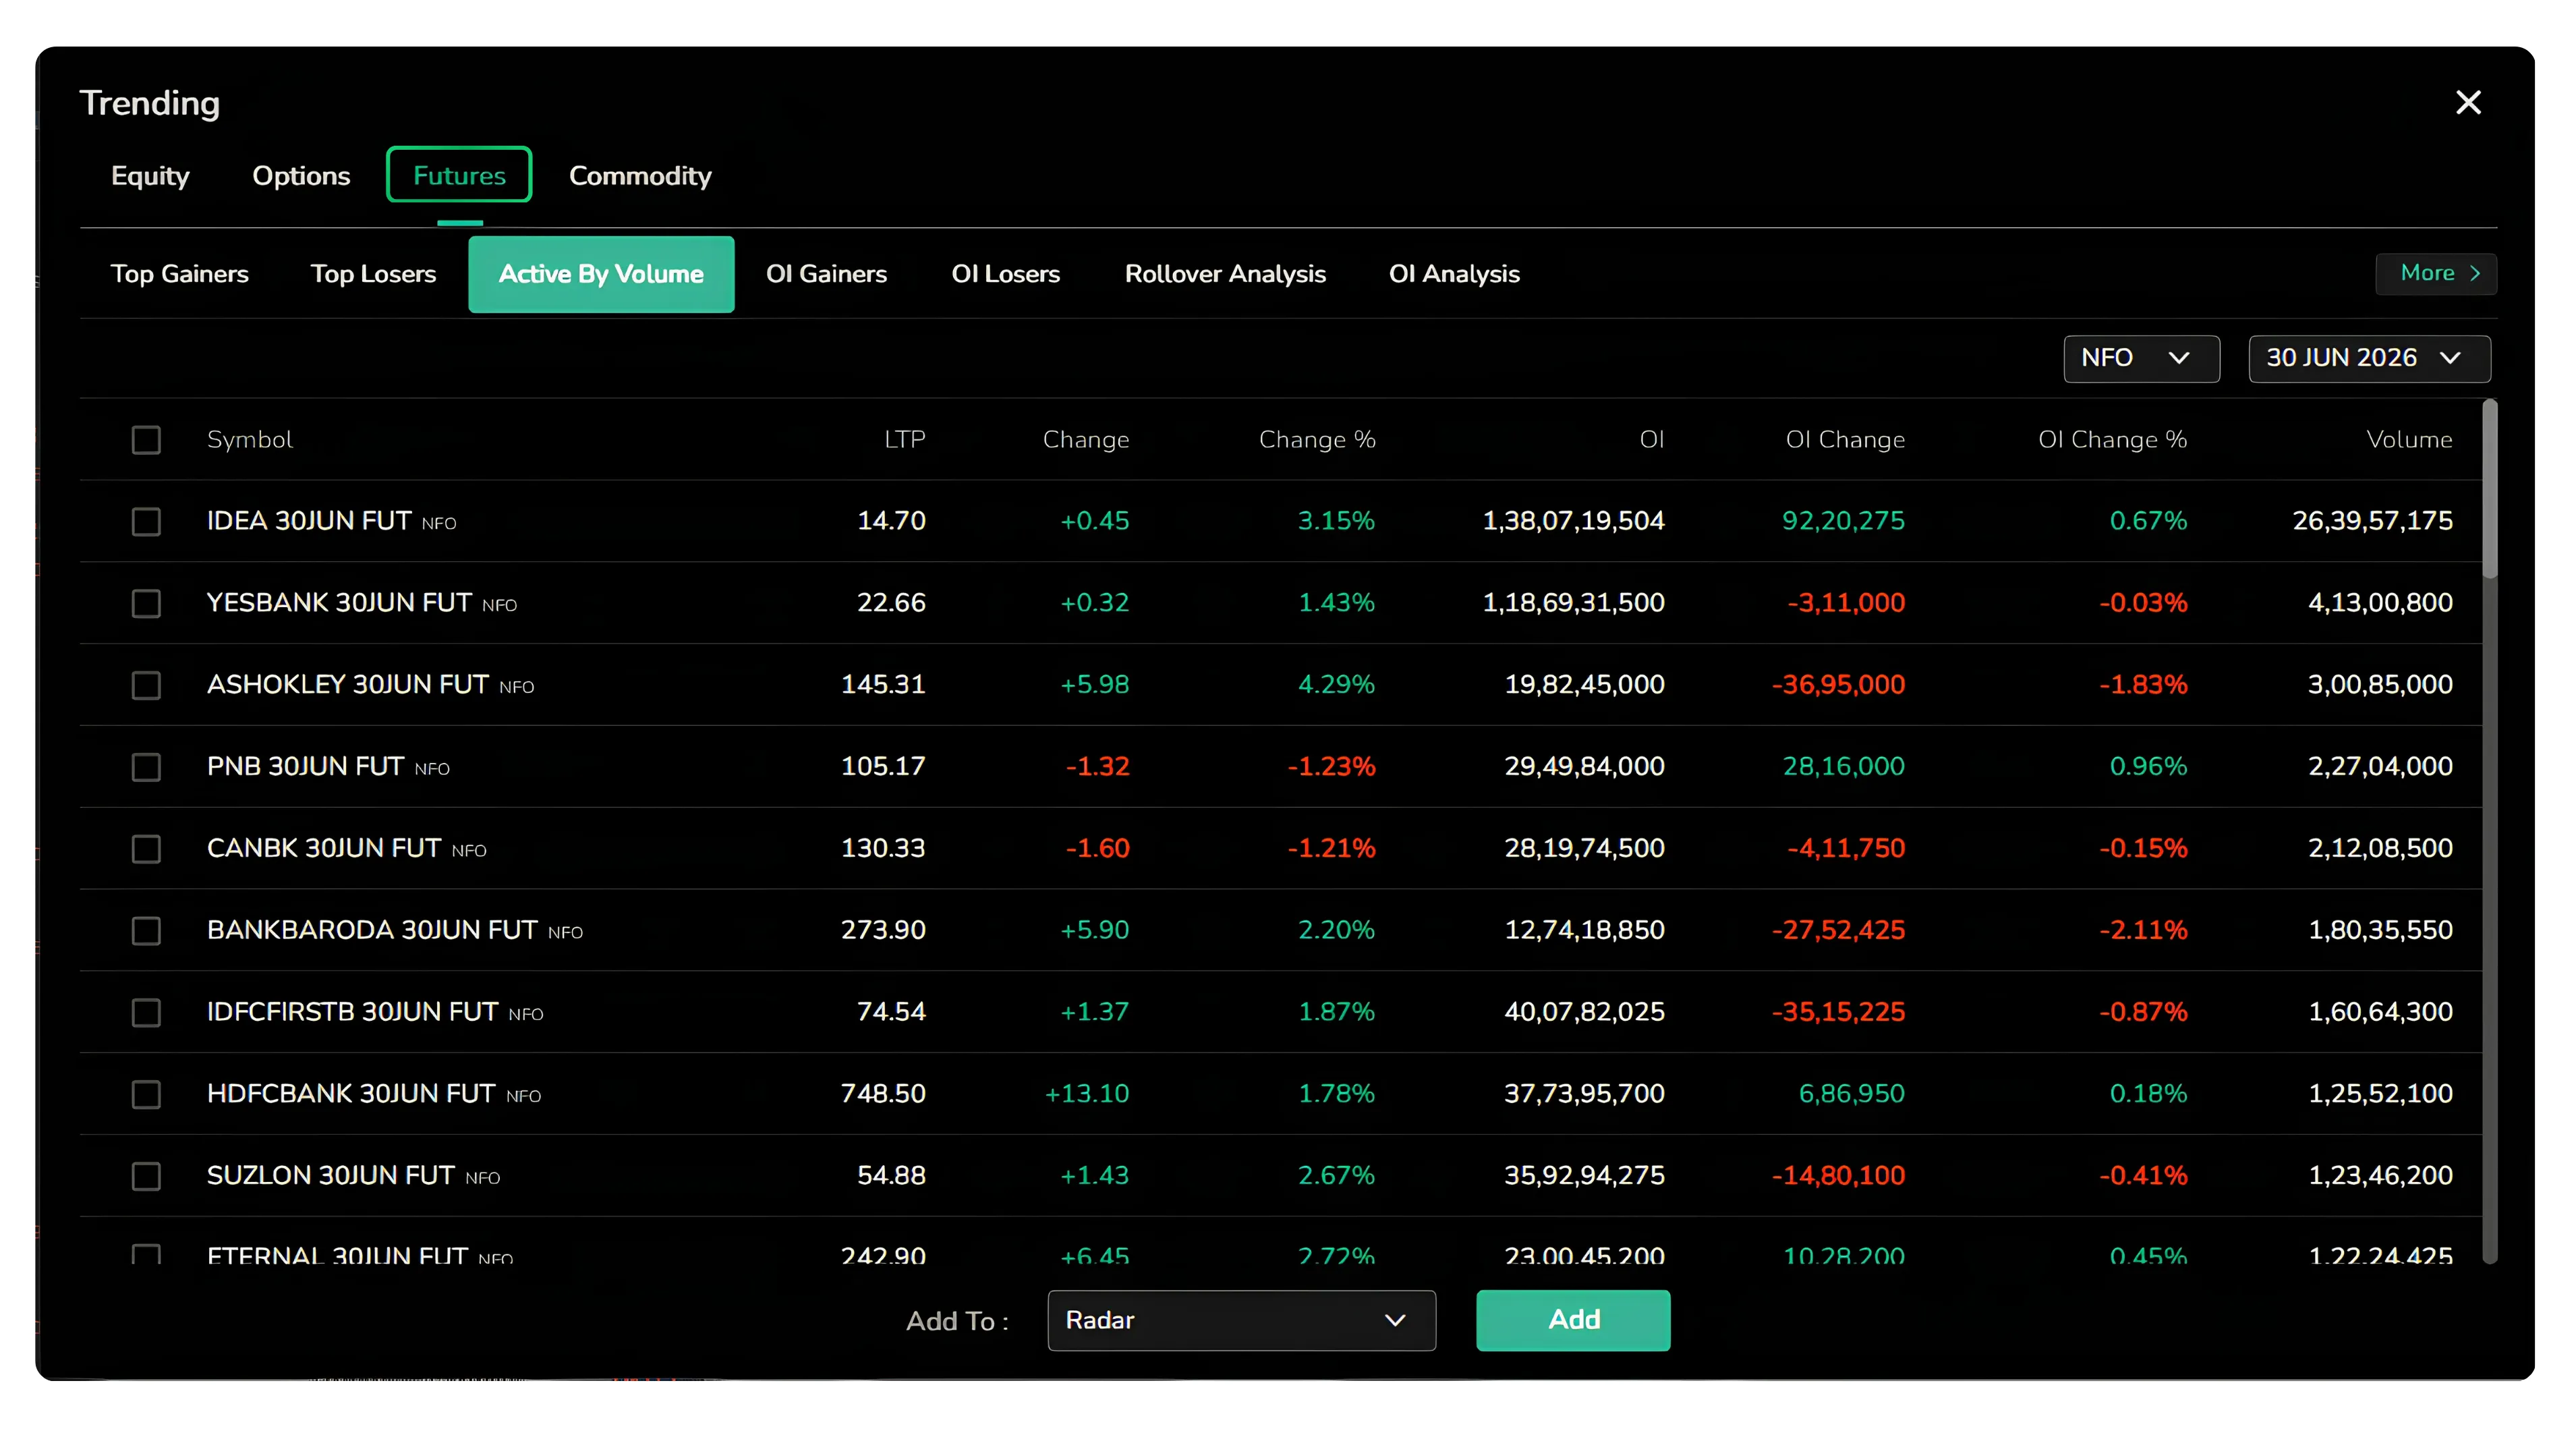
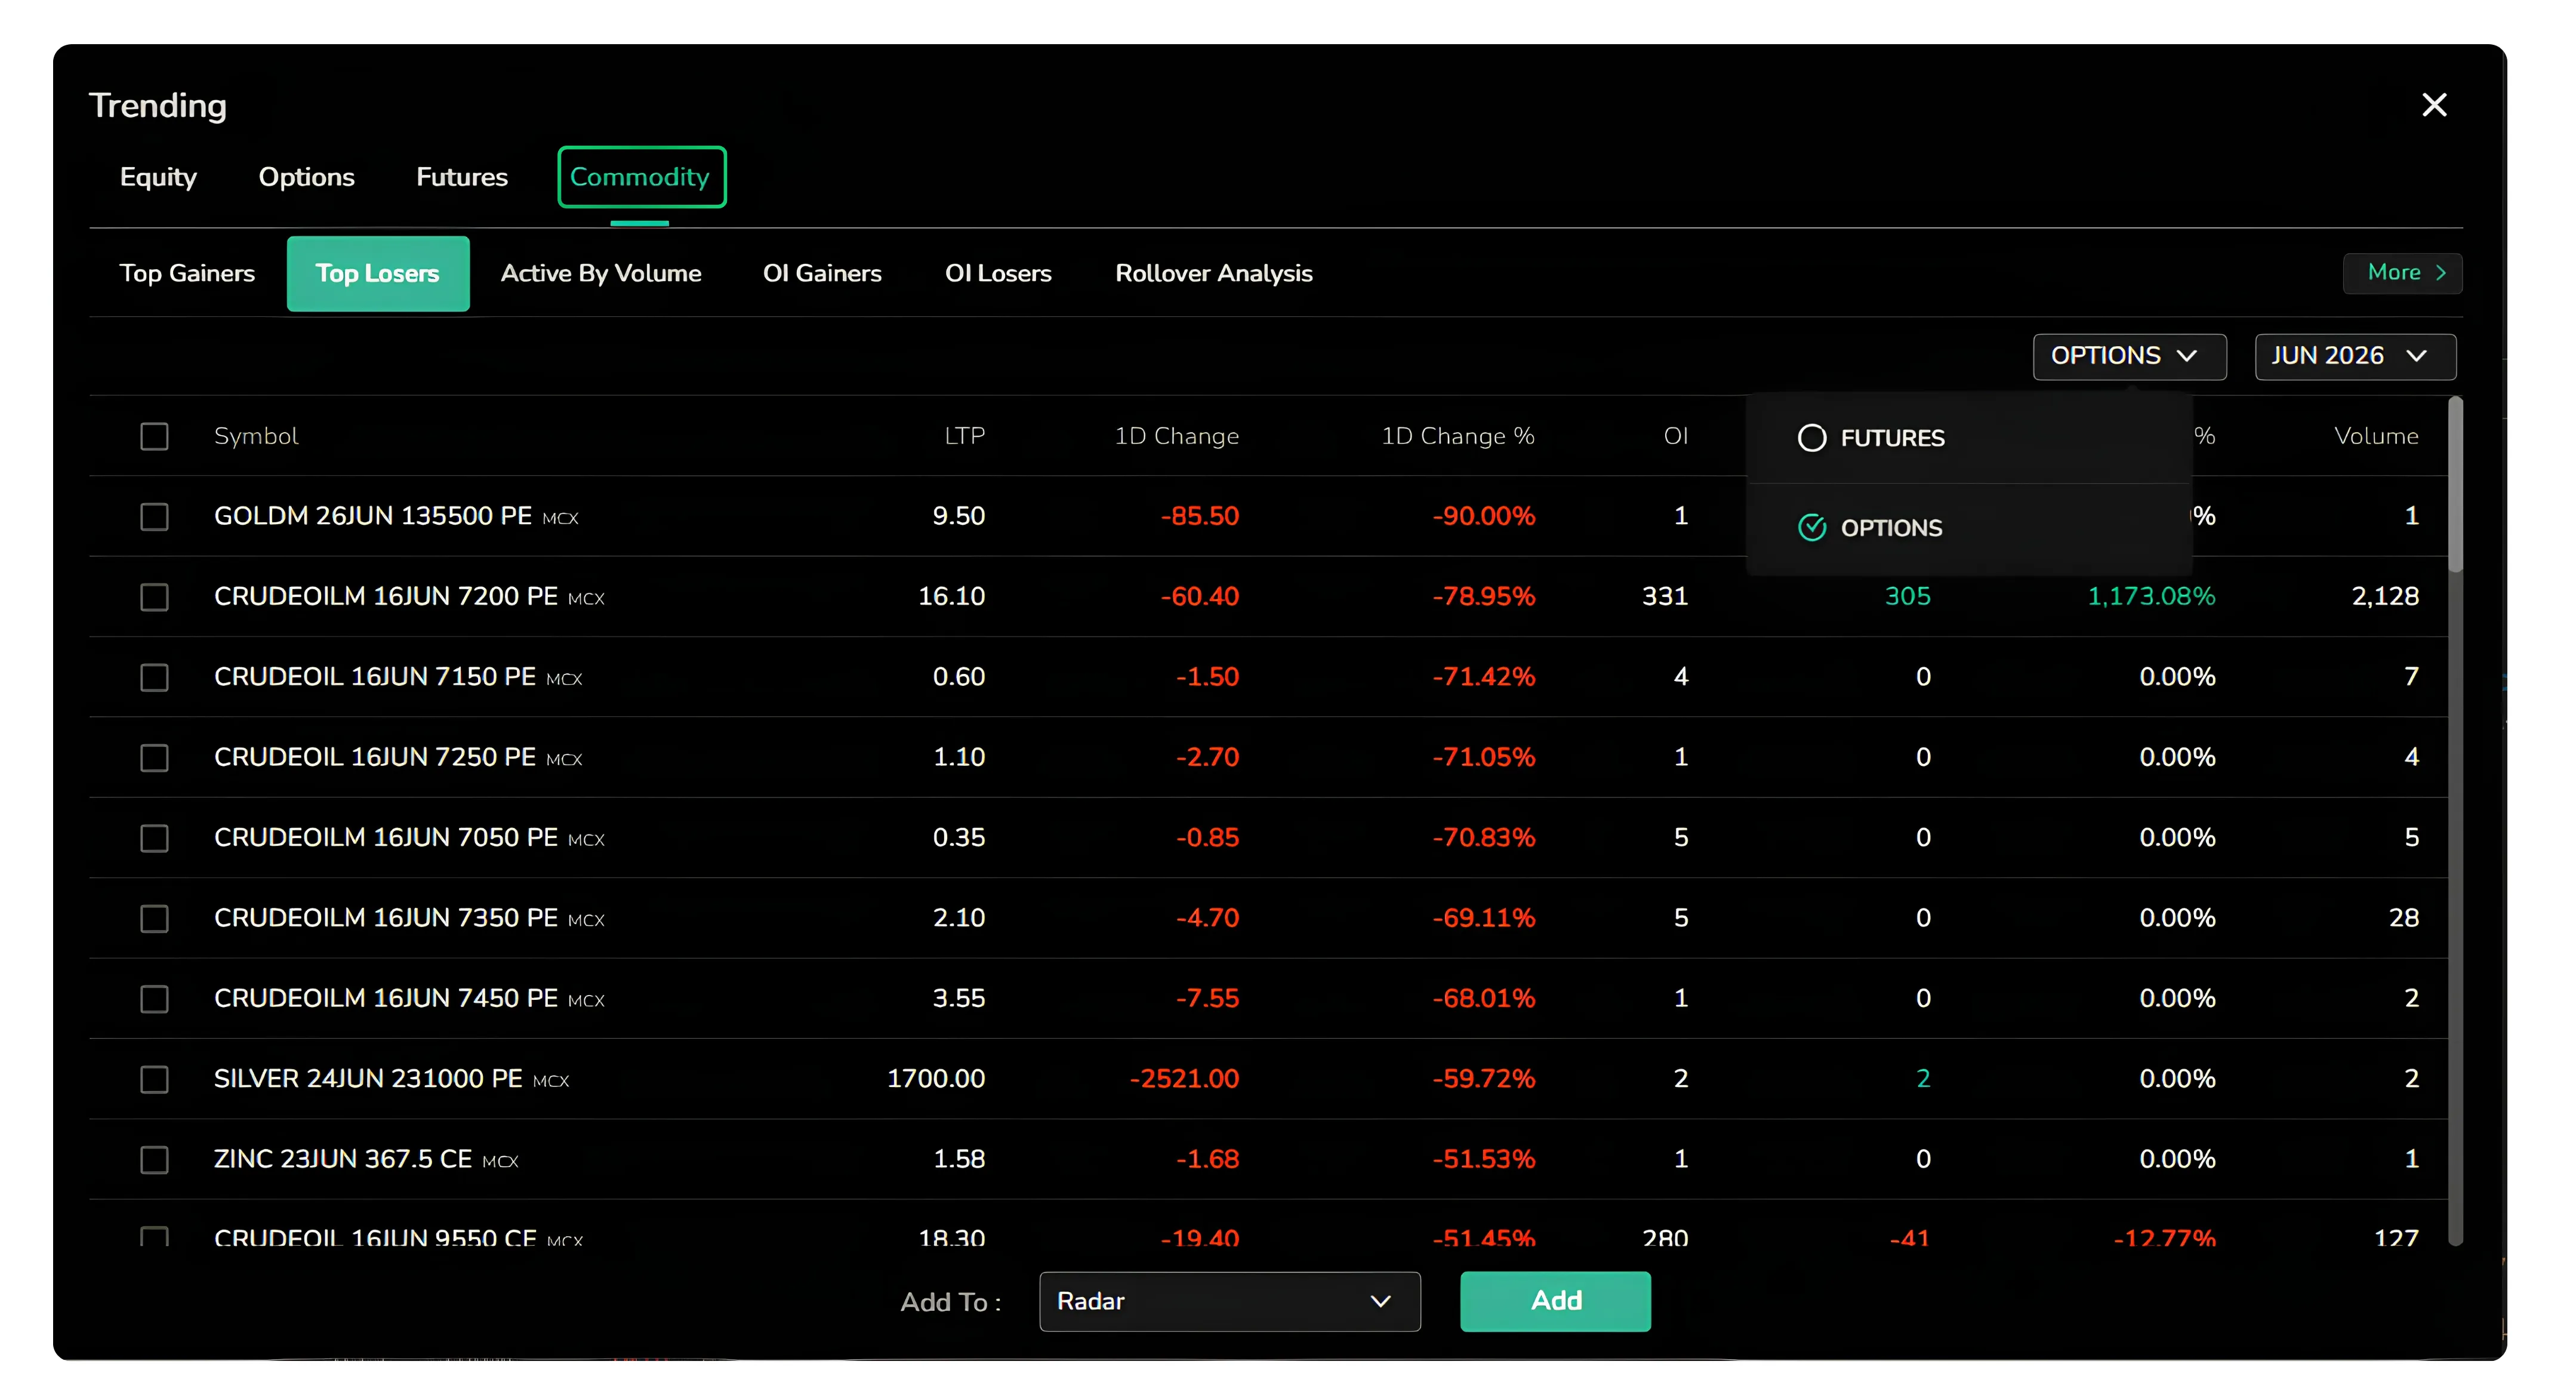
Whatever list you land on, an Add To control at the bottom lets you send any selected symbol straight into a custom watchlist like Radar, so a name you spot in the day's top gainers becomes part of your tracked list in one step.
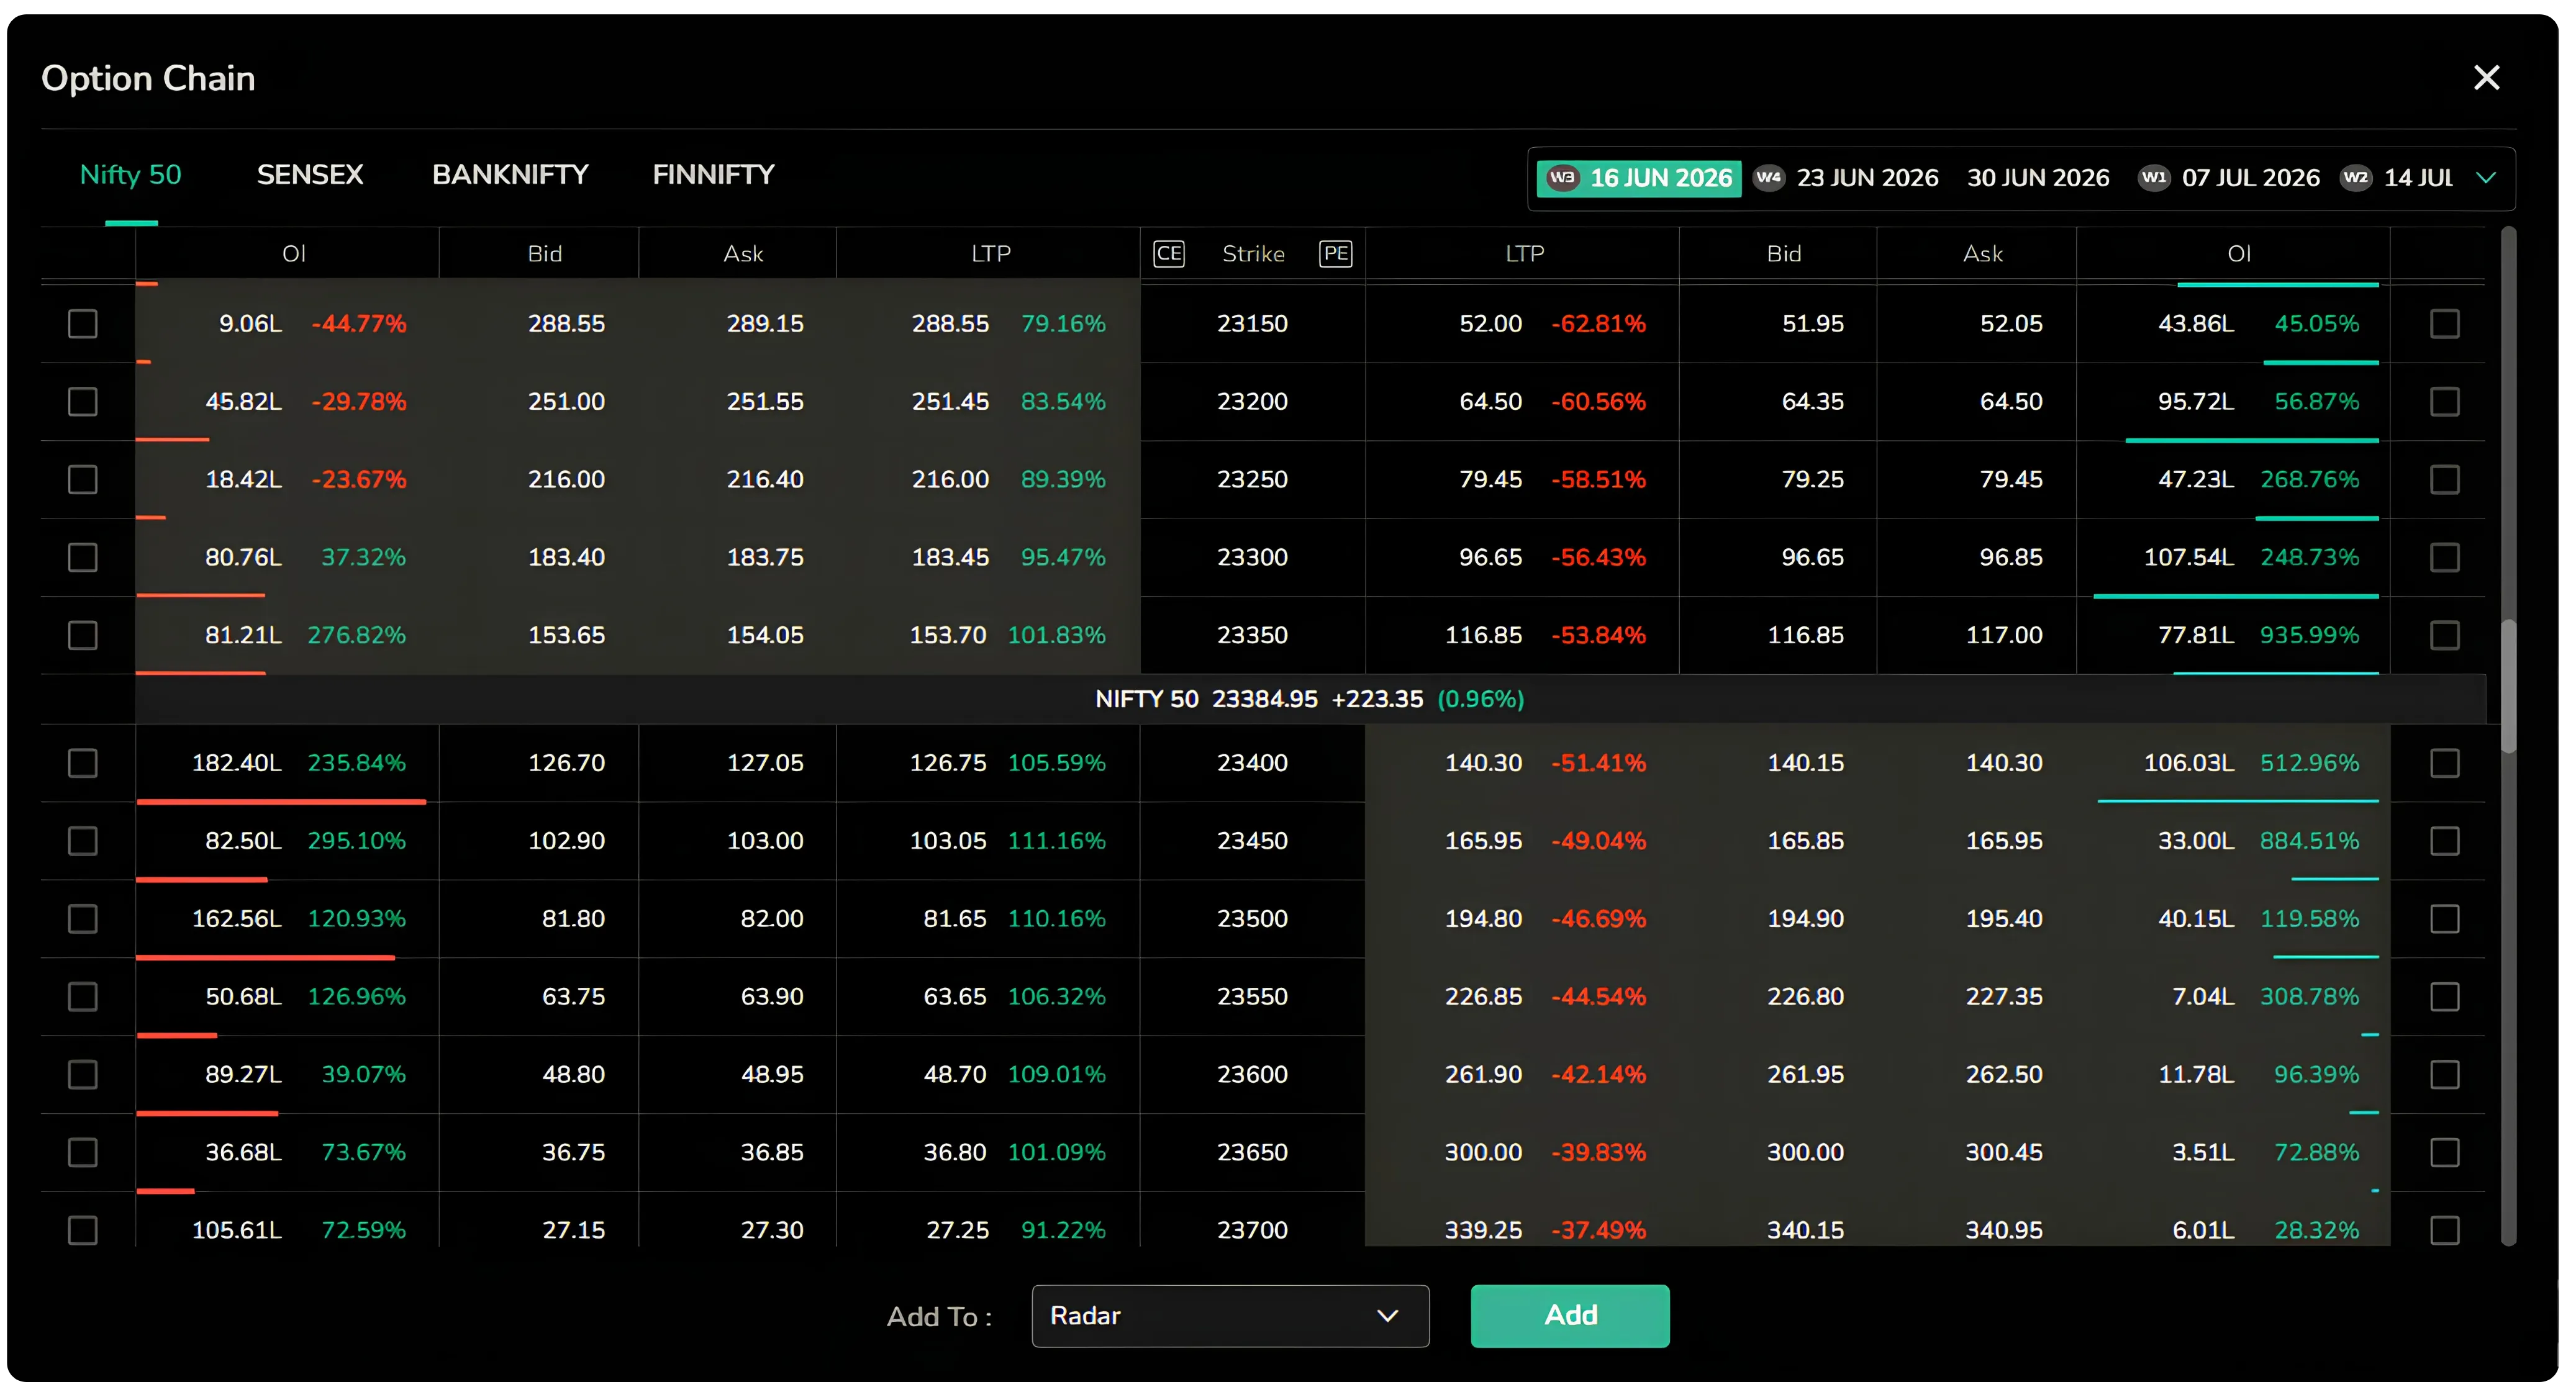
Option Chain
Selecting Option Chain from the search bar opens the chain for four indices, Nifty 50, Sensex, Banknifty and Finnifty, with expiry dates running along the top. Strike by strike, the call and put sides show open interest, bid, ask and last traded price, and here too any strike can be added to a watchlist directly.
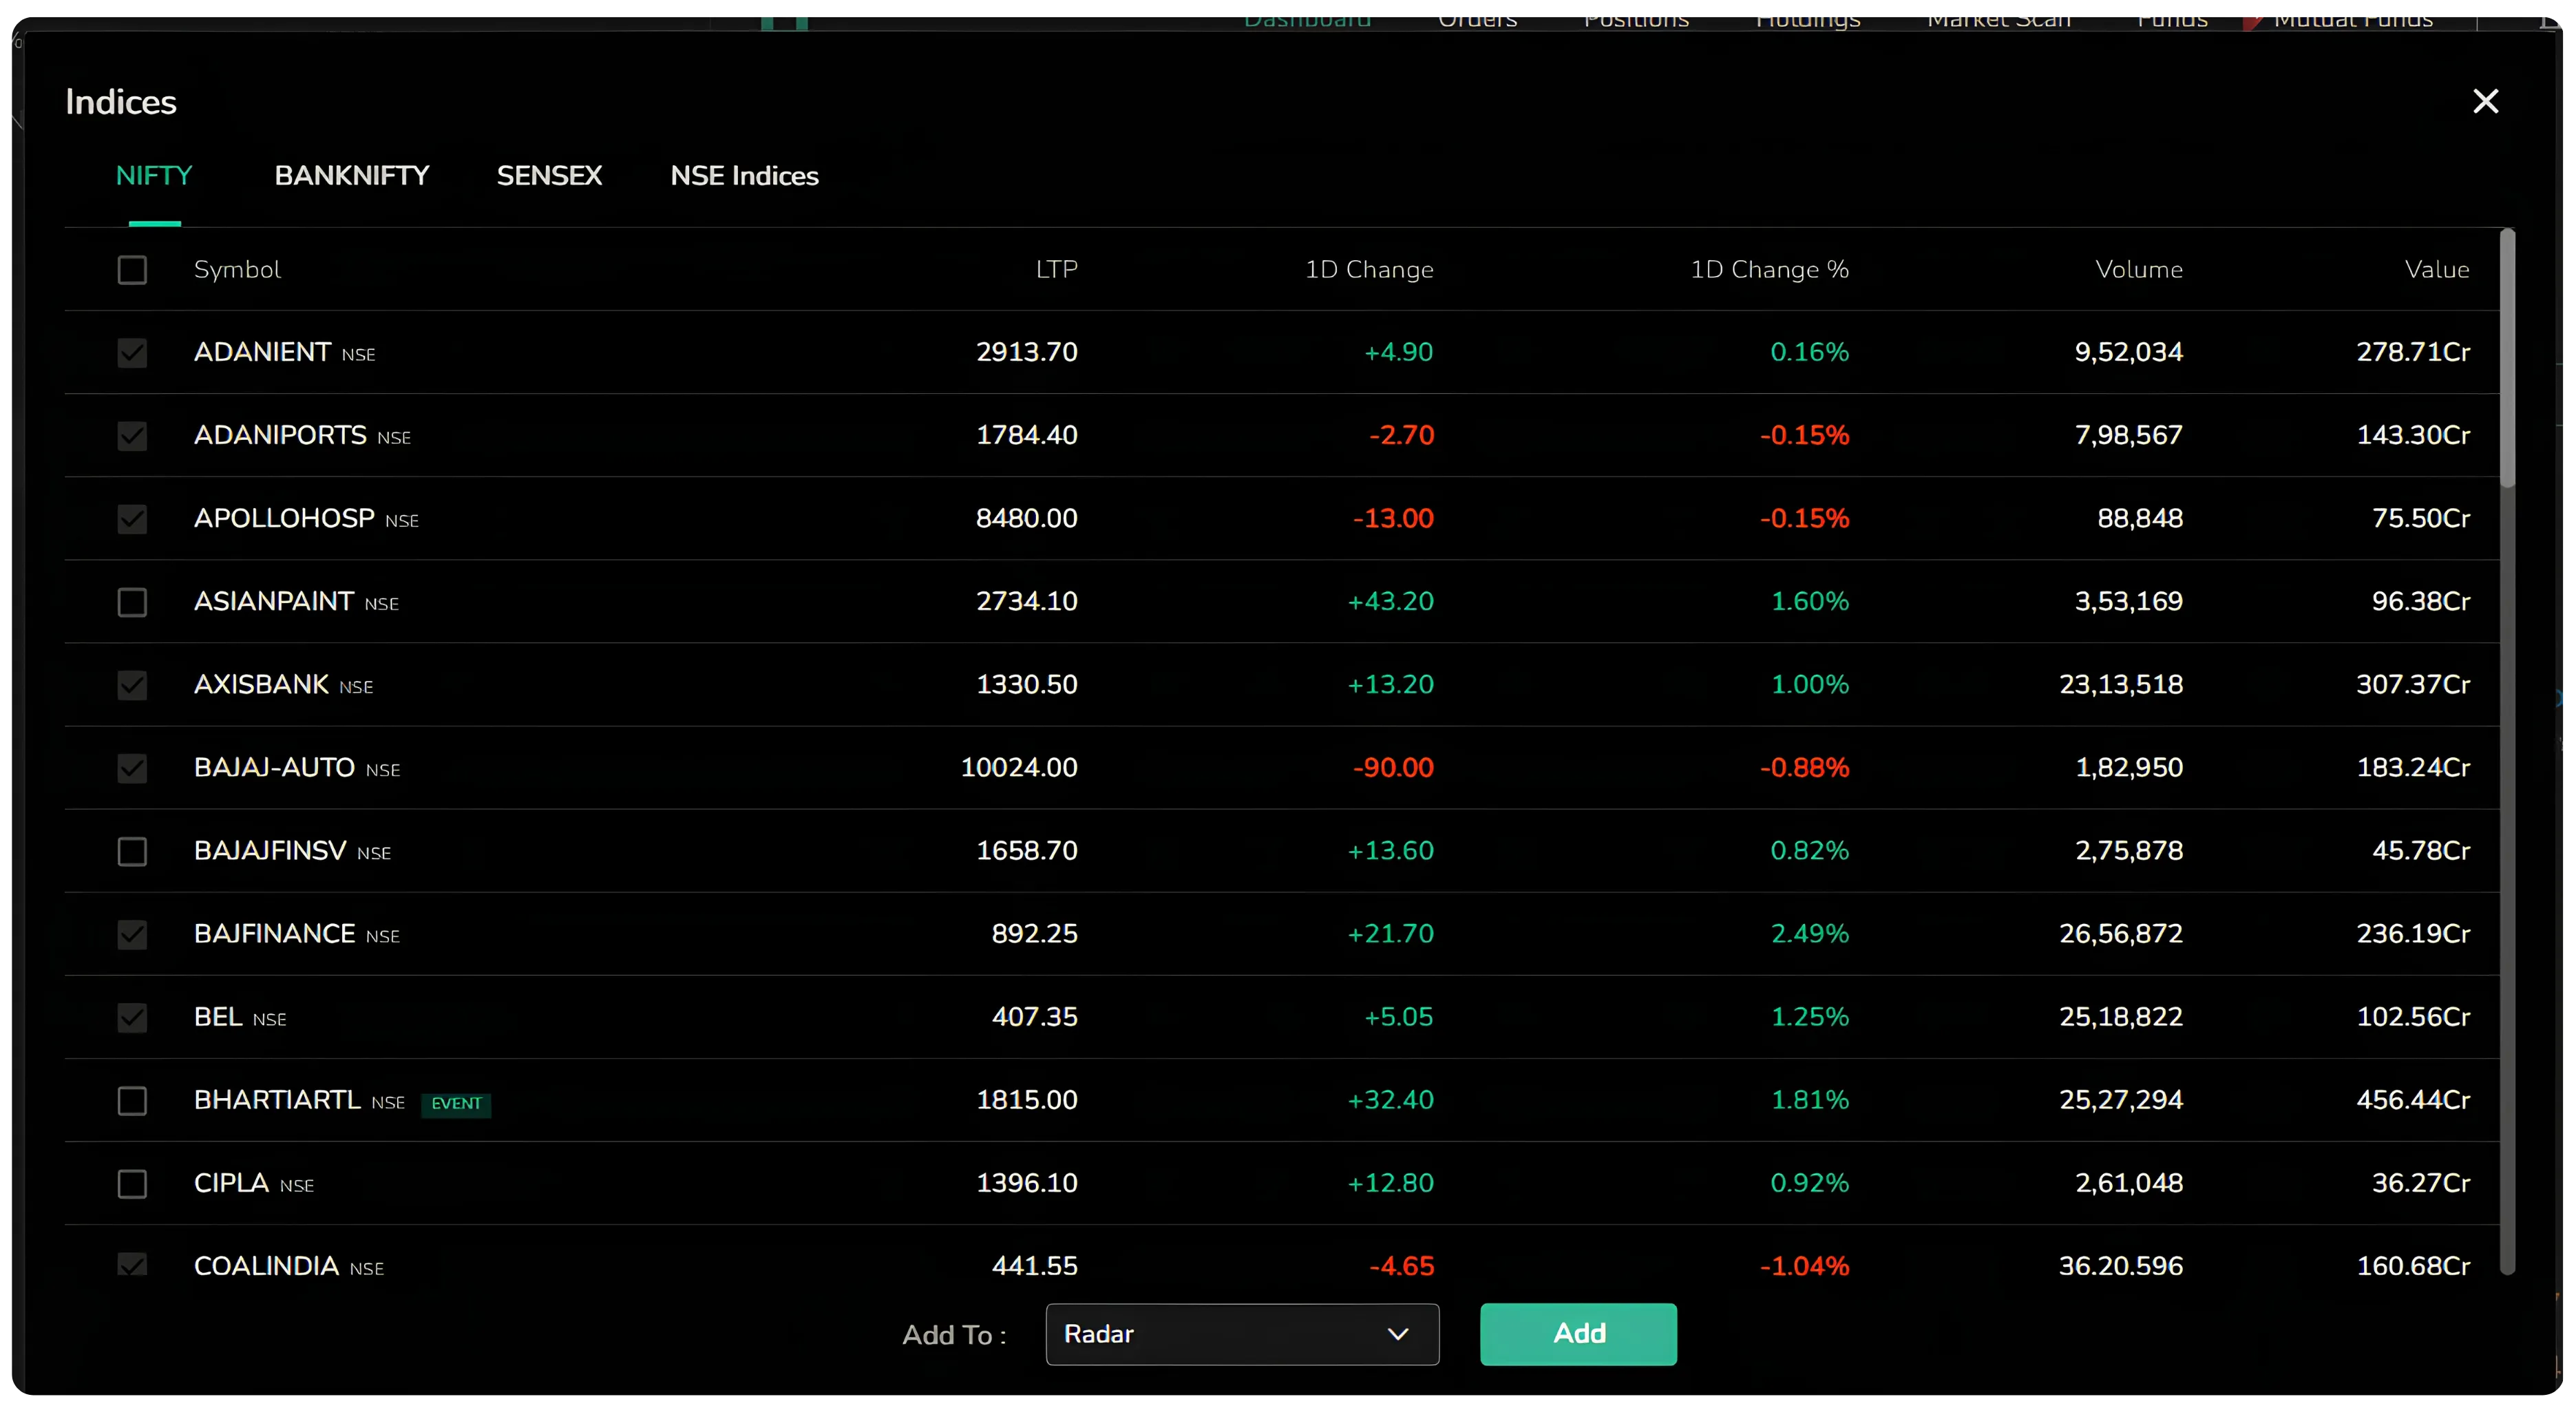
Indices
The Indices route lists the stocks within four index groups, Nifty, Banknifty, Sensex and NSE Indices. It gives you a clean way to browse the constituents of each index, view their live data, and pick out the ones worth adding to your own list.
Coming to Mobile
For now the redesign is live on the web. A similar watchlist update for the mobile version is on its way, which will bring the same consolidated layout to traders who work primarily from their phones.
Start your smart investing on CubePlus and take control of your financial goals. 👉 Click here to sign up
Disclaimer: The information provided in our blogs is for informational purposes only and should not be construed as financial, investment, or trading advice. Trading and investing in the securities market carries risk. Always conduct your own research and consult with a qualified financial advisor before making any investment decisions. Past performance is not indicative of future results. Copyrighted and original content for your trading and investing needs.
© 2026 — Tradejini. All Rights Reserved.

%252FCubePlus%2520Mobile%2520App%2520Just%2520Got%2520a%2520Major%2520Upgrade%2520Thumbnail.webp%3Falt%3Dmedia%26token%3Df6c2f1ef-cbe8-49e2-82fb-7b3d8c242e09&w=3840&q=75)
%252FCubePlus%2520Mobile%2520App%2520Just%2520Got%2520a%2520Major%2520Upgrade%2520Blog%2520Thumbnail.webp%3Falt%3Dmedia%26token%3D9ad93fae-ed5a-42b8-9e64-3cd011416a87&w=3840&q=75)