


The foundation of advanced options trading is a precise understanding of Historical Volatility (HV) and Implied Volatility (IV), and more importantly, their interaction. This relationship goes beyond statistics: it encodes market psychology, collective risk assessments, and forward-looking expectations as tradable price discrepancies.
Historical Volatility functions as a rearview measure, providing an objective, model-based summary of past price dispersion. Calculated as the annualized standard deviation of daily returns over a chosen lookback period, HV converts noisy price moves into a comparable risk metric. The chosen lookback materially alters HV: short windows (5-10 days) reflect recent shocks and regime shifts, while longer windows (30-60 days) filter noise and establish a more stable baseline.
The mathematical foundation of HV rests on standard deviation principles, where approximately 68% of price movements fall within one standard deviation of the mean. For example, a stock at INR100 with 20% HV implies historical annualized dispersion, suggesting a range near INR80-INR120, absent structural change.
Implied Volatility - the market’s forward estimate
Implied volatility reflects the market’s consensus forecast of future dispersion, inferred from option prices via models such as Black-Scholes. Unlike HV’s statistical basis, IV arises from supply-and-demand dynamics for options, hedging flows, speculative positioning, and liquidity conditions.
IV serves as a barometer of market uncertainty and greed. When uncertainty rises, earnings, regulatory rulings, and macro shocks, option demand typically increases and IV expands. Conversely, in complacent markets, demand for protection declines, and IV tends to compress. This demonstrates how volatility affects options premiums by driving them higher. These supply-demand dynamics generate relative mispricings that systematic traders exploit.
The theoretical construction of IV assumes that option prices incorporate aggregated market expectations, though this assumption is imperfect in practice. Behavioral finance research reveals systematic biases in market psychology that affect how traders perceive and price risk. Overreactions, anchoring, and herding can drive IV away from subsequent realized volatility, generating exploitable opportunities for volatility strategies.
Also Read: Understanding Theta and the High Cost of Time
The HV-IV relationship
Under efficient-market assumptions, IV should approximate future realized volatility (with HV as a baseline), but in practice, persistent HV-IV divergences create systematic trading opportunities.
When IV materially exceeds HV, options are relatively expensive compared to historical dispersion benchmarks. Such elevation commonly occurs ahead of known events or during heightened uncertainty. The market may price in elevated future variance that does not realize, offering premium-selling opportunities where decay outpaces subsequent realized volatility.
Conversely, when IV trades below HV, options may be underpriced relative to the stock's historical movement patterns. For beginners in volatility trading, these scenarios represent clear entry signals. This typically appears in complacent markets or after events that passed without substantial price action. Volatility buyers profit if subsequent realized dispersion exceeds the market’s subdued pricing.
Practical implementation using Nxtoption’s analytics framework
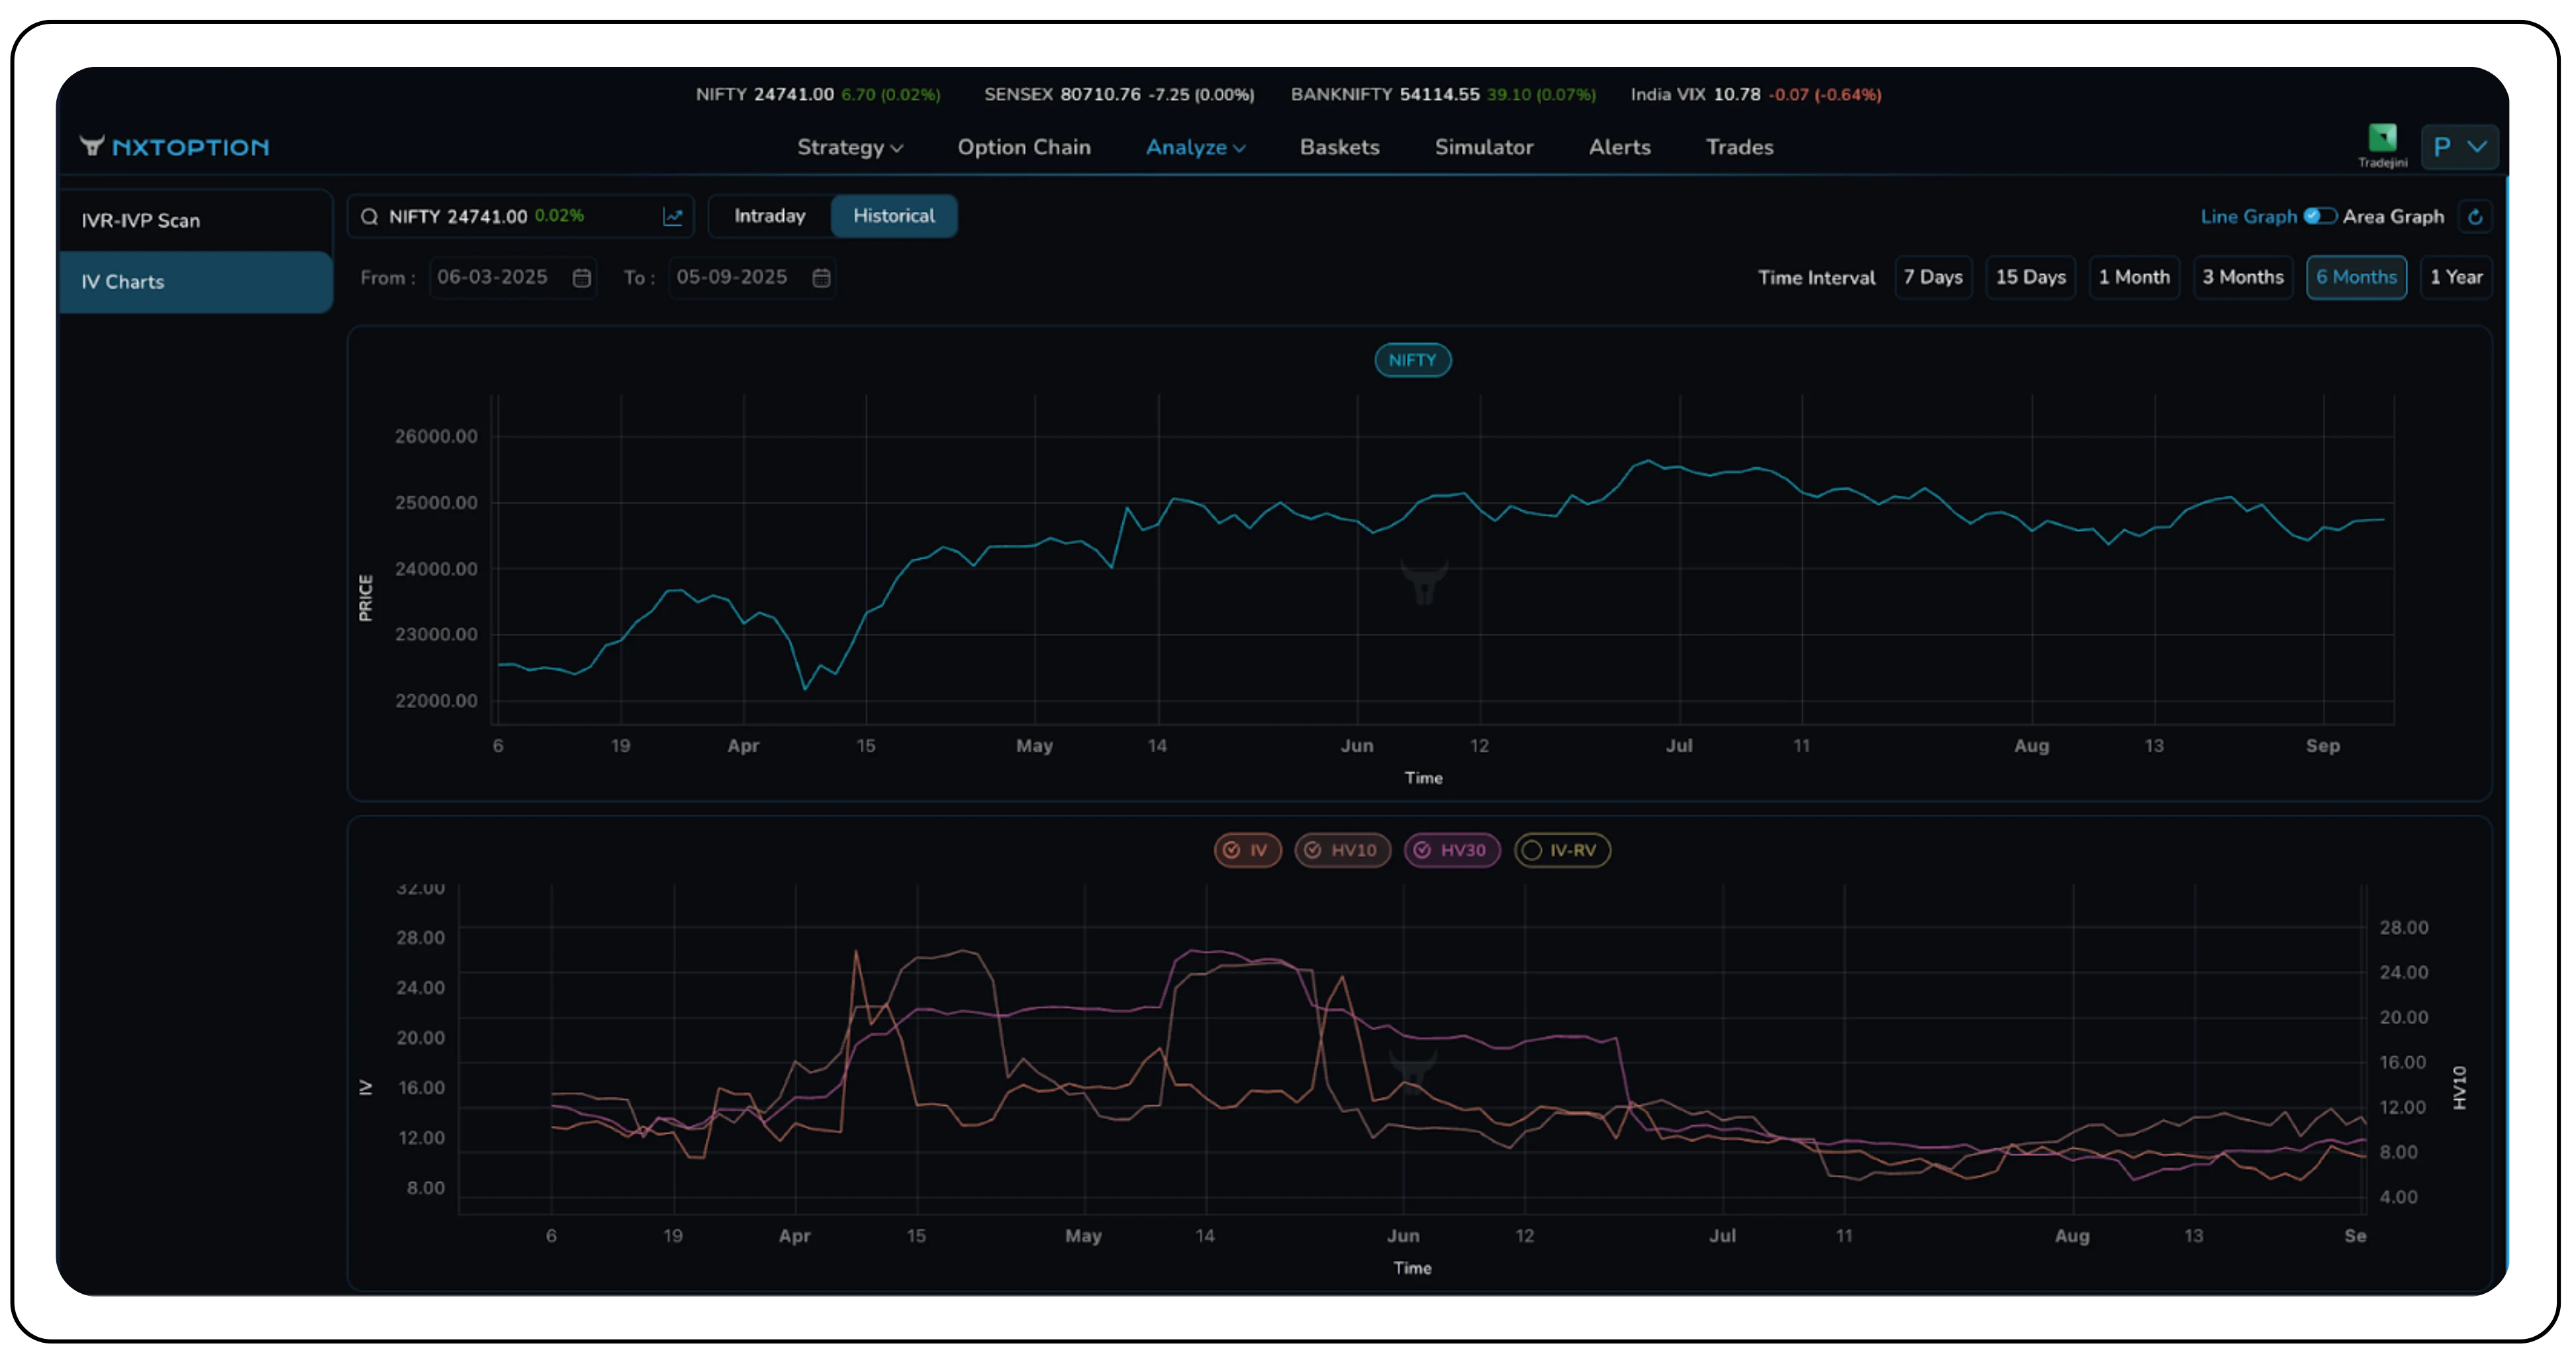
Nxtoption’s volatility-analysis tools provide a practical infrastructure to operationalize HV-IV concepts in live markets. The HV overlay displays multiple horizons (HV10, HV30, HV60) concurrently, enabling identification of regime shifts and short-term versus medium-term dispersion trends.
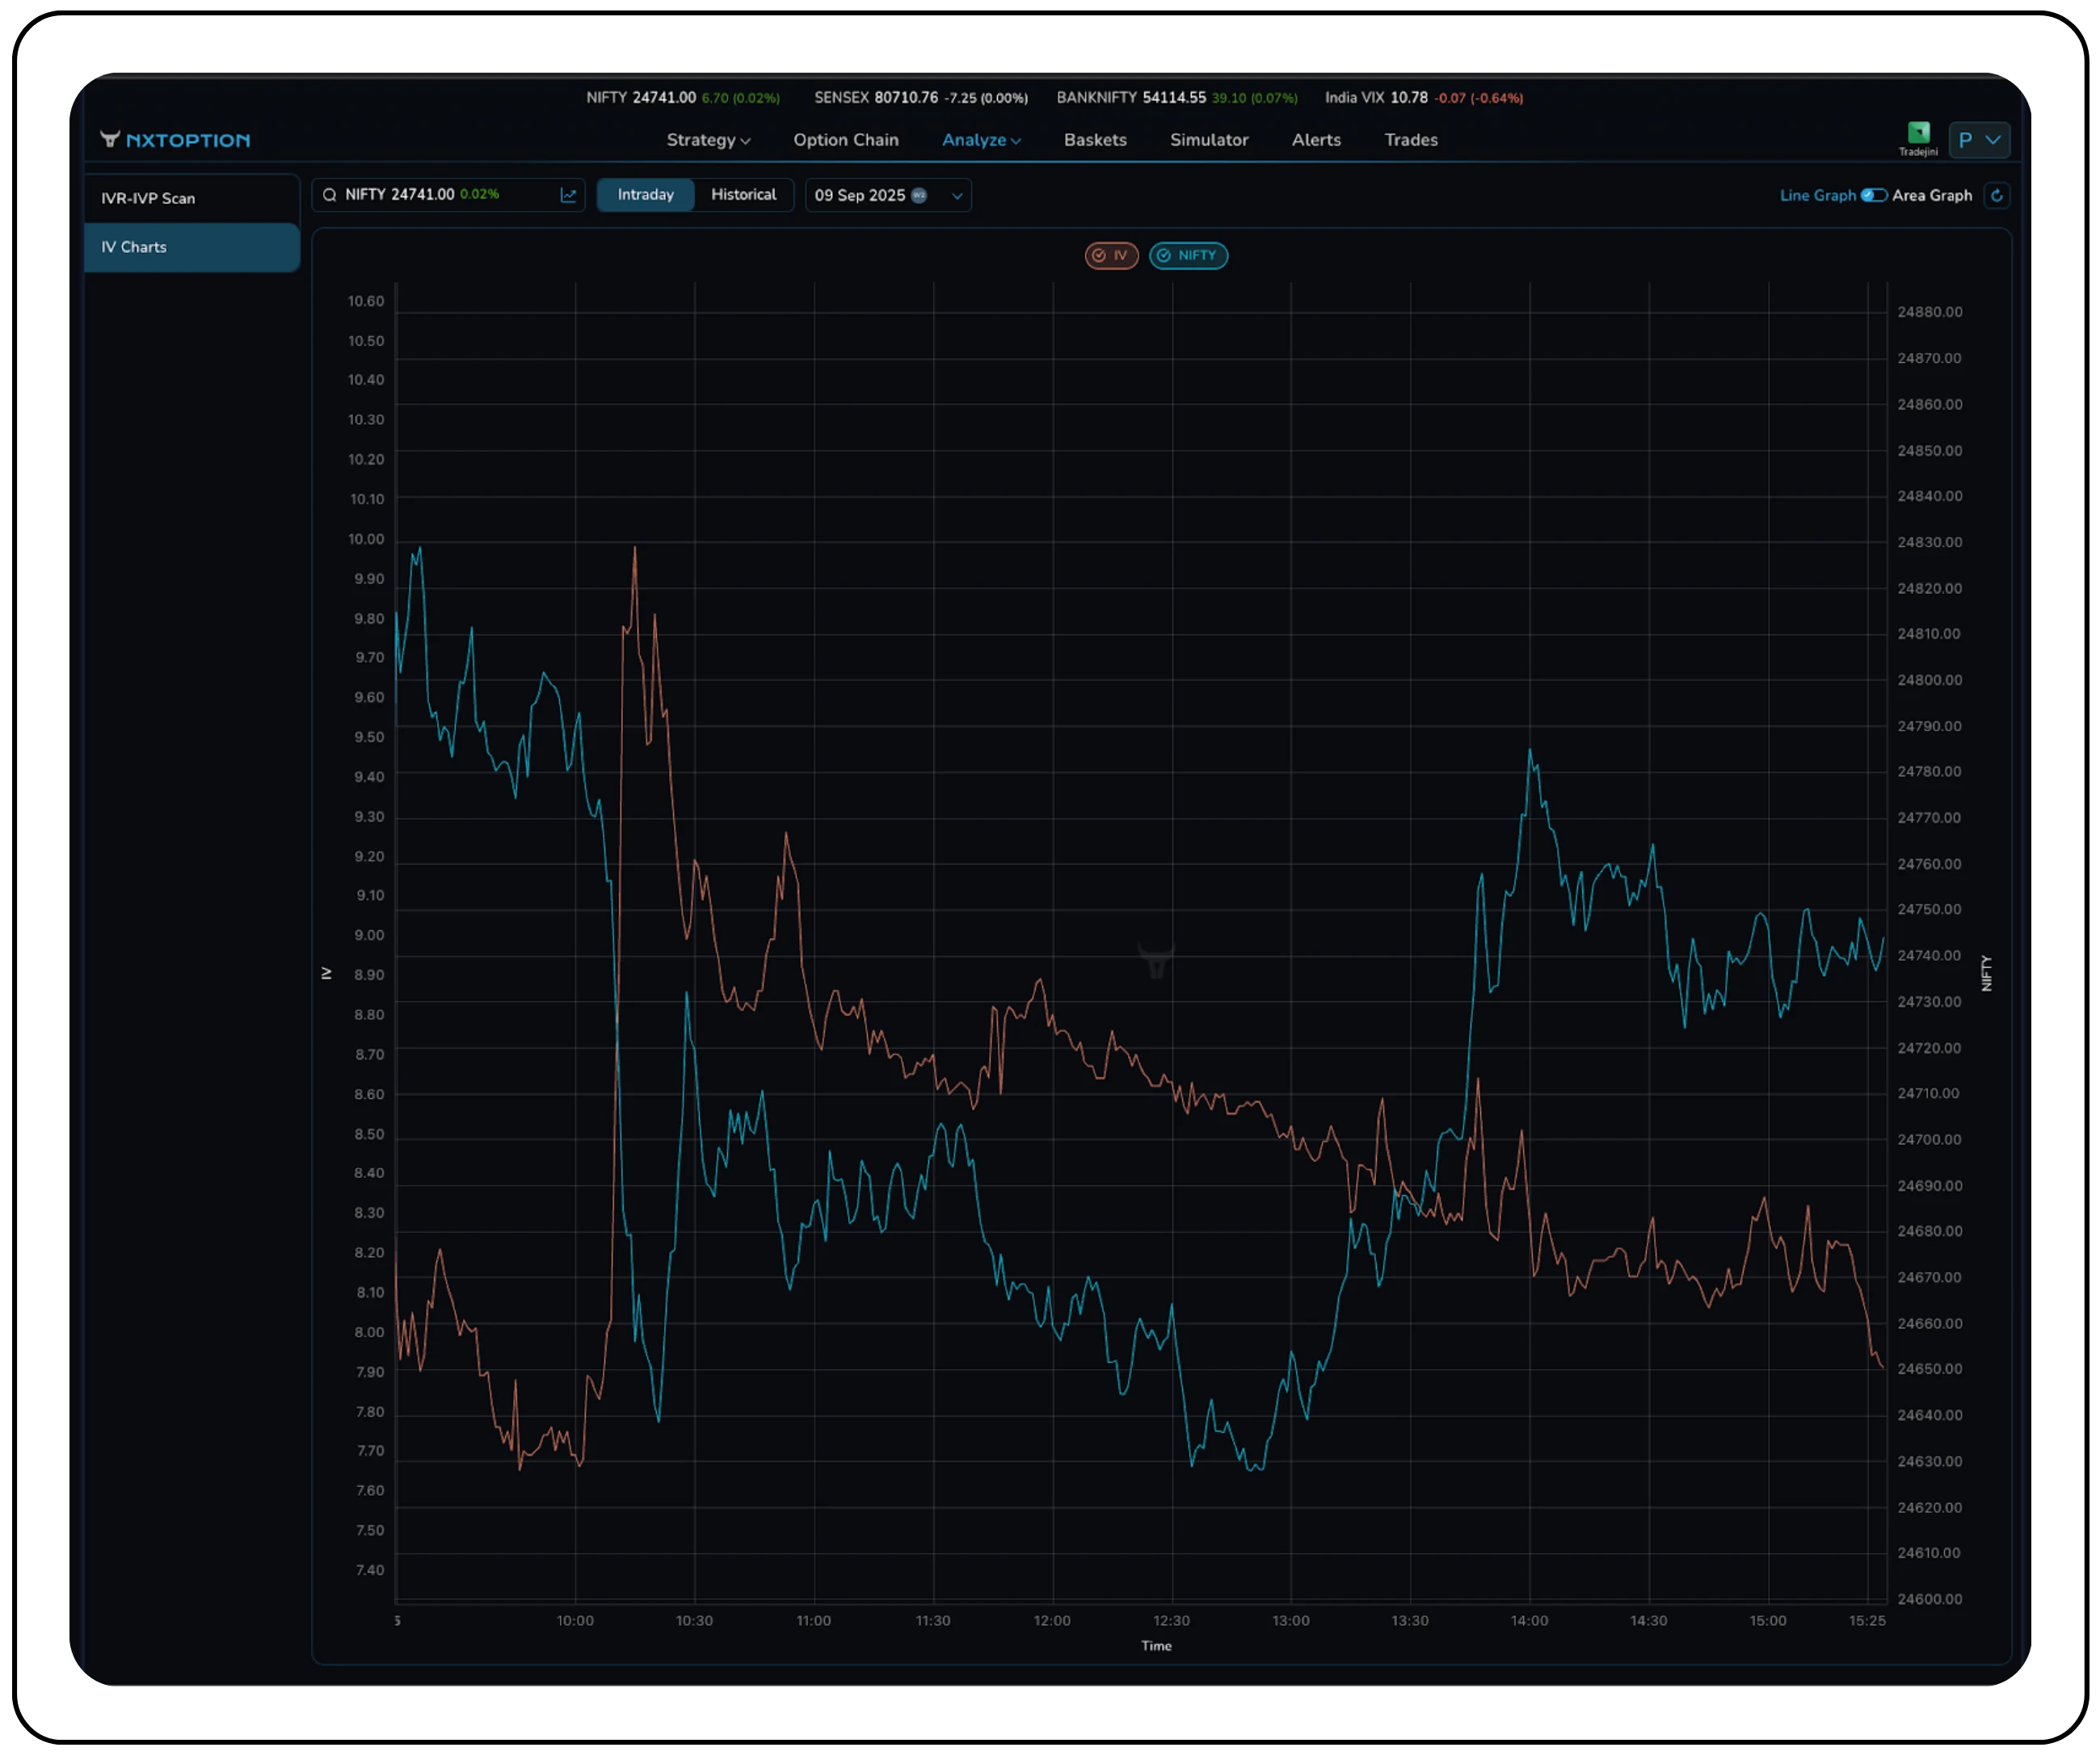
Here, Nxtoption’s Intraday IV chart makes complex relationships straightforward. This feature allows traders to quickly grasp the interplay between implied volatility and the underlying asset’s price movements. This visual overlay is crucial for identifying real-time shifts in market sentiment and confirming the trends suggested by volatility metrics.
IV Percentile (IVP) and IV Range (IVR) contextualize the current IV relative to its historical distribution. An IVP of 85 indicates the current IV exceeds 85% of historical observations within the chosen lookback. This percentile framework reduces subjectivity and supplies objective thresholds for volatility strategy entries and exits.
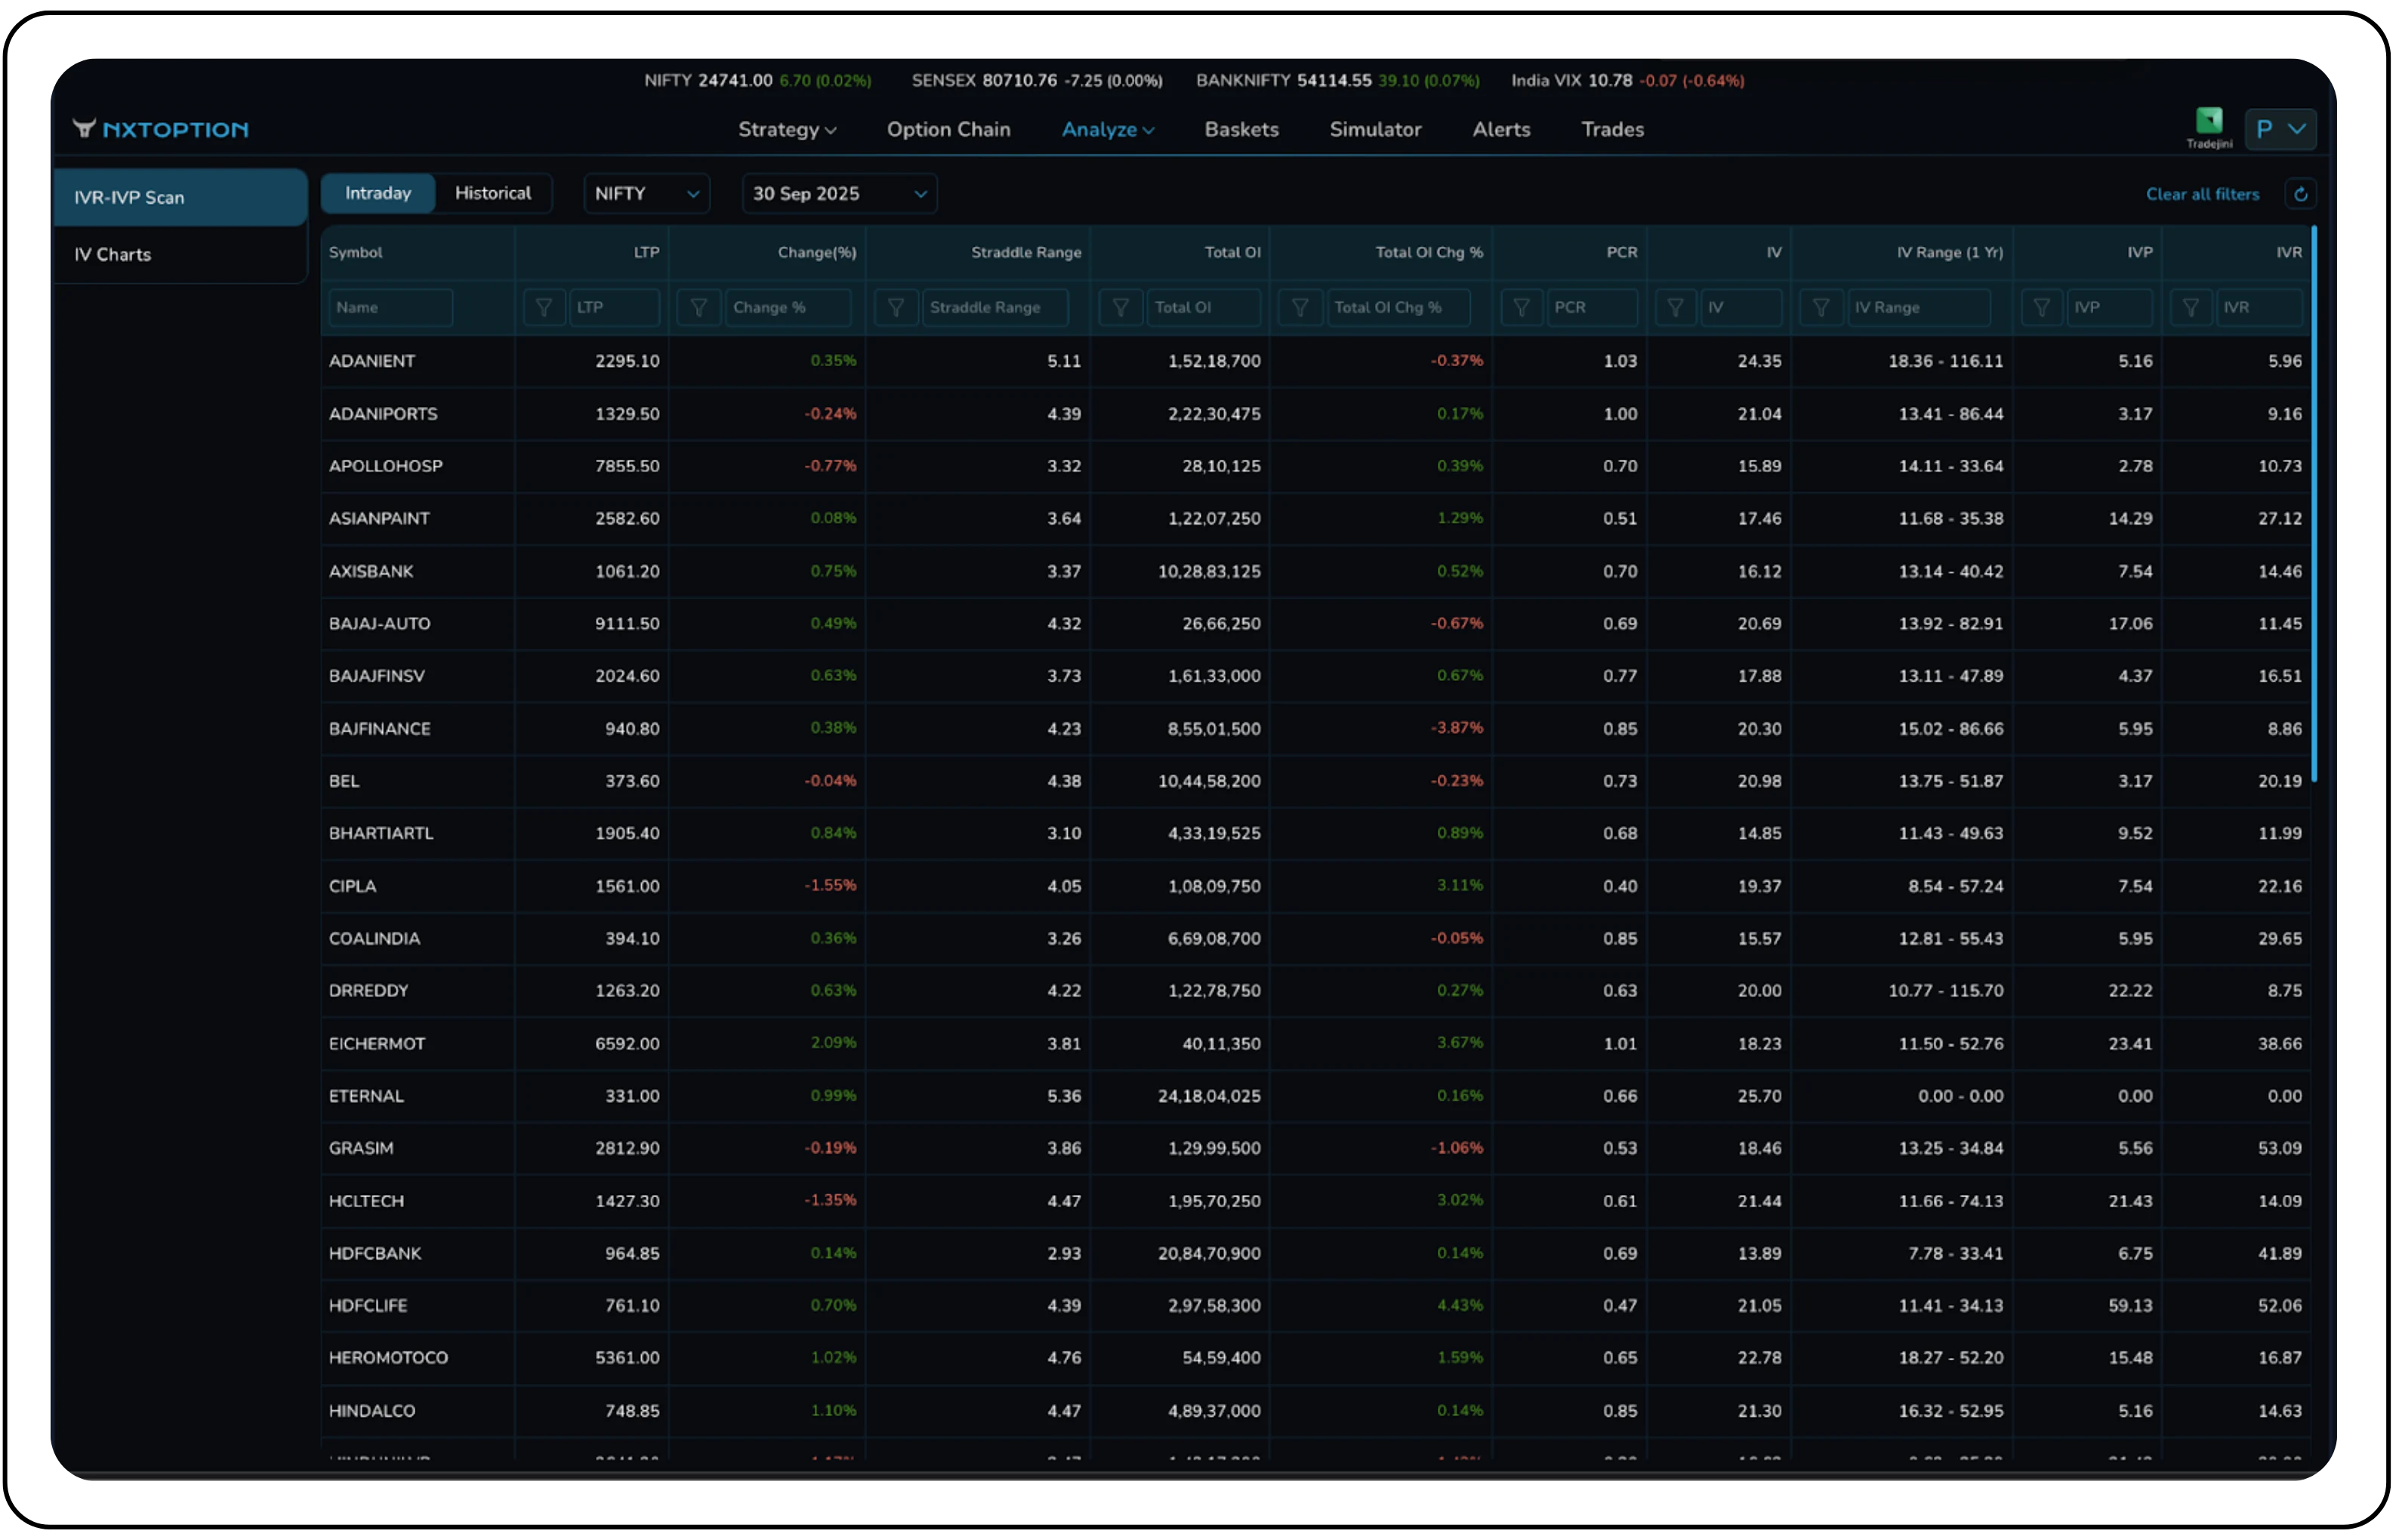
Practically, traders must scan markets efficiently to convert these metrics into tradable ideas. Nxtoption’s IVP-IVR scan provides a comprehensive dashboard, as seen below, allowing traders to view and sort stocks by their current IV, IV Percentile, and IV Range. This tool helps to instantly identify securities where volatility is historically high (potential premium selling opportunities) or unusually low (potential buying opportunities), saving valuable time and focusing analysis on the most promising candidates.
Term-structure analysis maps market expectations across expirations and informs horizon-specific strategy selection. A normal (back-month > front-month) term structure signals anticipated higher future volatility; inversion often signals near-term event risk relative to longer horizons. These patterns guide selection: inversions can favor short-dated hedges or front-month trades, while normal structures support longer-dated volatility exposure.
Practical trading examples and Live Market applications
Consider the above scenario where NIFTY is trading at 24741 and the IV is 9.93, HV10 9.38%, HV30 9.85%. Here IV sits just above very-short-term realized vol (HV10) and almost equal to the 30-day realized (HV30). That tells us the market is pricing only a small premium for future uncertainty, not an extreme fear spike, but not complacent either. In plain terms: volatility is mildly rich versus the last week, and basically fair versus the last month.
Practical takeaways:
- This is not an extreme sell-everything signal. Given IV is only marginally above HV, favour defined-risk premium collection (iron condors, credit spreads) rather than naked short positions.
- Size positions conservatively and set wings wide enough to tolerate normal HV churn; these are modest premium collections, not speculative bets.
- Monitor IVP and event calendars: modest IV gaps can widen rapidly near headlines, use alerts, and consider targeted protective hedges (OTM long option or delta hedge).
Skew, Mean Reversion, and Regime Changes
Volatility skew introduces additional complexity to the HV-IV relationship and represents a crucial concept for understanding how volatility affects options premiums across different strikes. The typical pattern of higher IV on downside strikes reflects asymmetric downside risk aversion and demand for protective puts. This skew creates opportunities for relative value trades, where traders can exploit discrepancies between puts and calls with equivalent distance from at-the-money strikes.
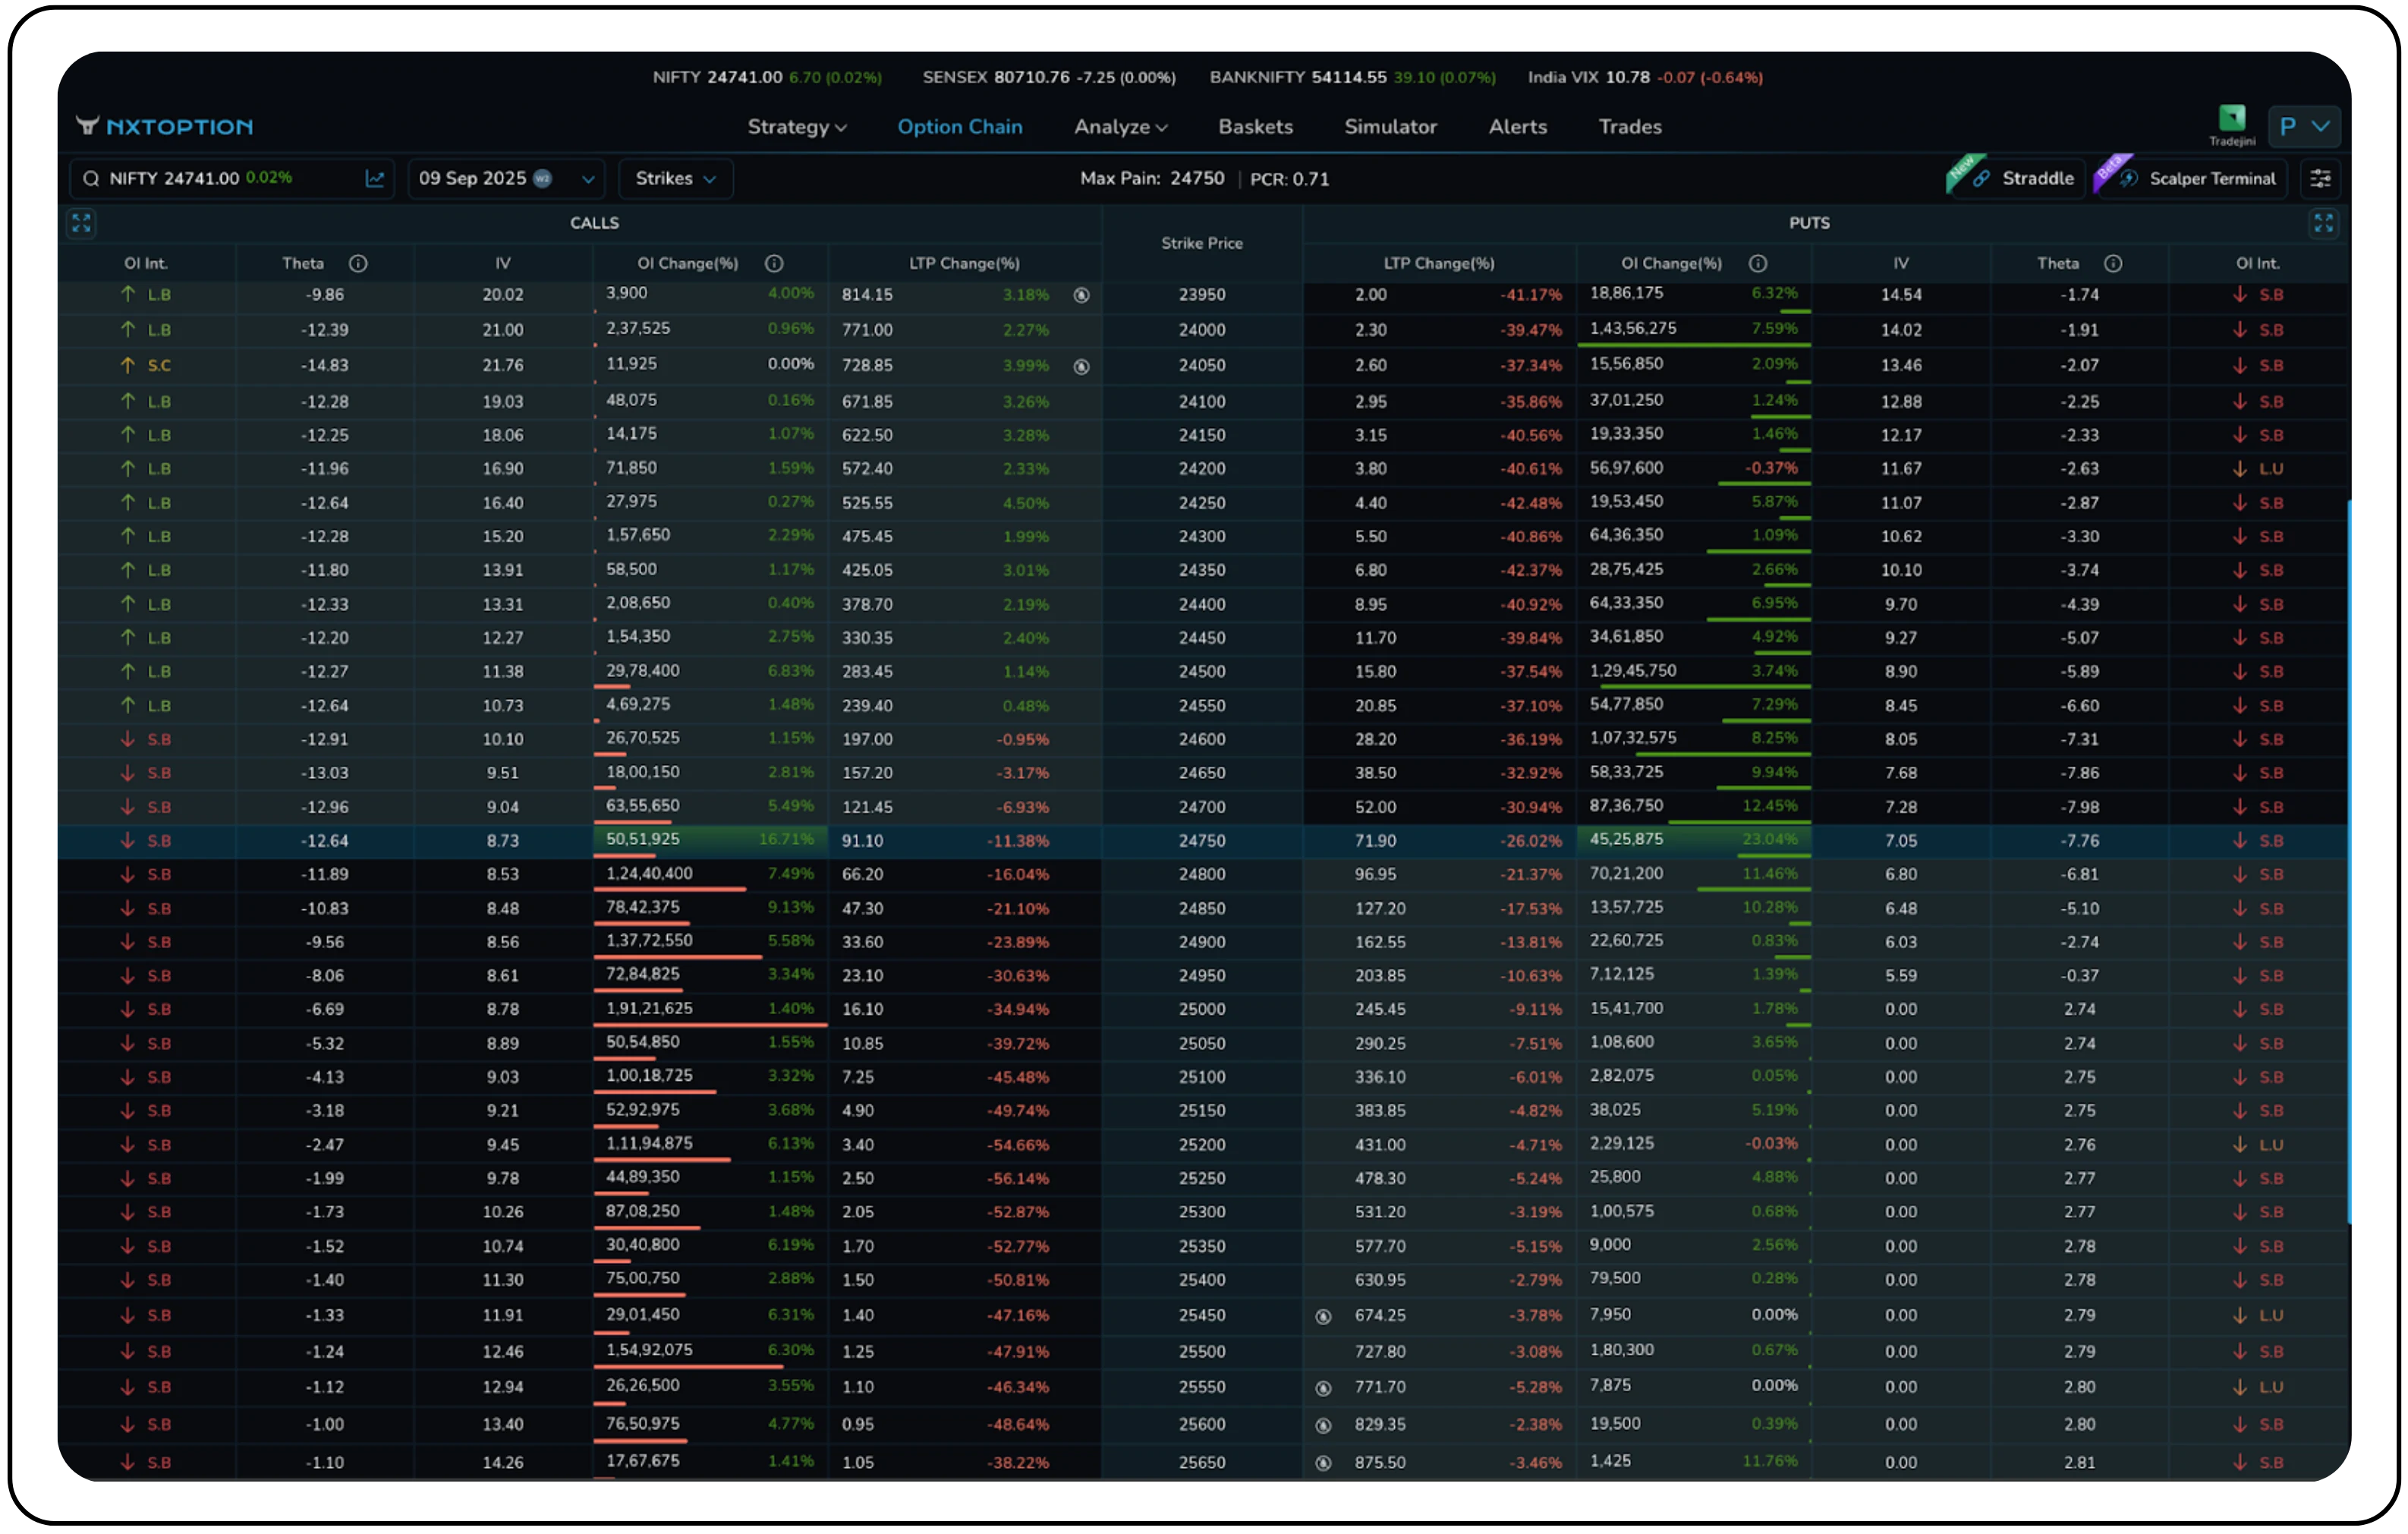
The option chain provides the raw data for this analysis. In the image above, you can observe the Implied Volatility (IV) column for both calls and puts. Notice how the IV for the at-the-money 24750 Call is 9.73%, while the equidistant 25000 Call has an IV of 8.78%. This variation across strikes is the visual representation of volatility skew, allowing traders to identify potential relative value opportunities directly from the chain.
Mean reversion is a central concept in volatility trading and is fundamental to understanding how to trade volatility successfully. Empirically, volatility often reverts toward long-term averages, although the timing and magnitude of reversion depend on asset class and regime. High volatility spreads often resolve with declining volatility, while prolonged low-volatility environments eventually give way to increased market activity.
However, mean reversion assumptions can fail during structural market changes. The 2008 financial crisis, the COVID-19 pandemic, and other regime-changing events demonstrate that historical volatility patterns may not persist indefinitely. Successful volatility traders must balance mean reversion expectations with recognition that market structures evolve, potentially establishing new volatility norms.
Risk management and Position sizing considerations
Any HV-IV framework must be accompanied by rigorous risk management. Volatility trading entails gamma risk: large price moves can overwhelm time-decay income in short-volatility positions. Even when IV appears overpriced relative to HV, tail events can generate losses that exceed weeks or months of premium collection.
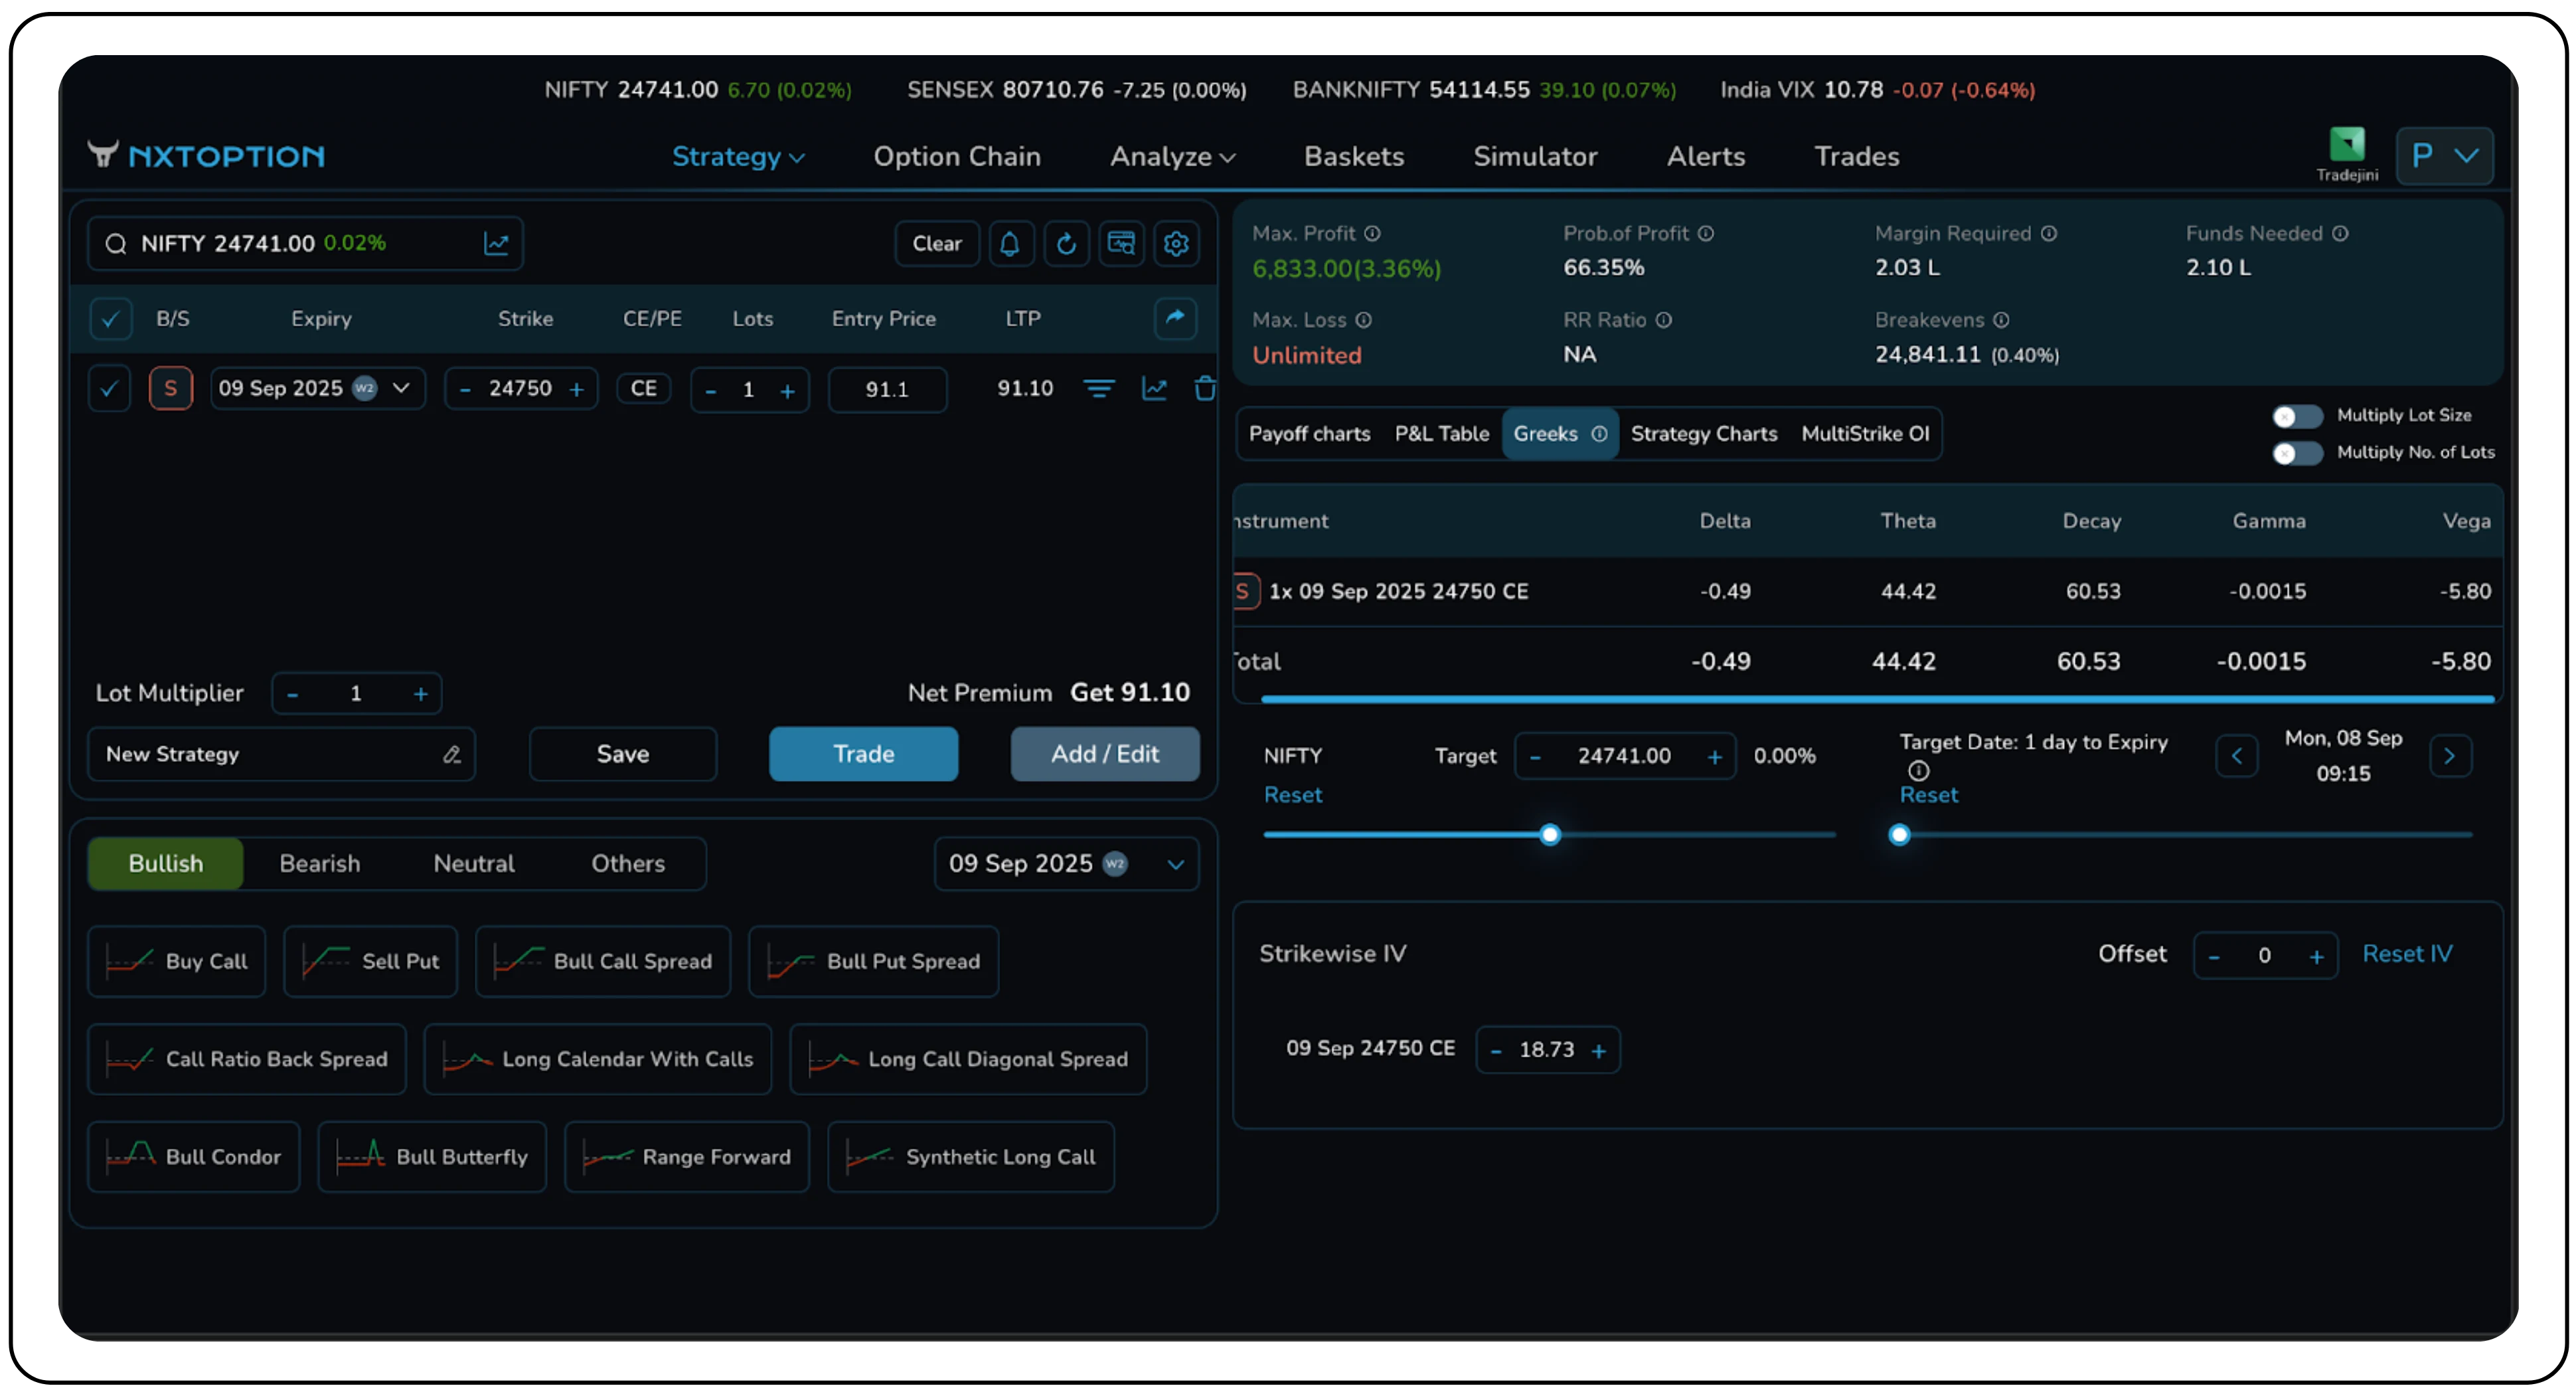
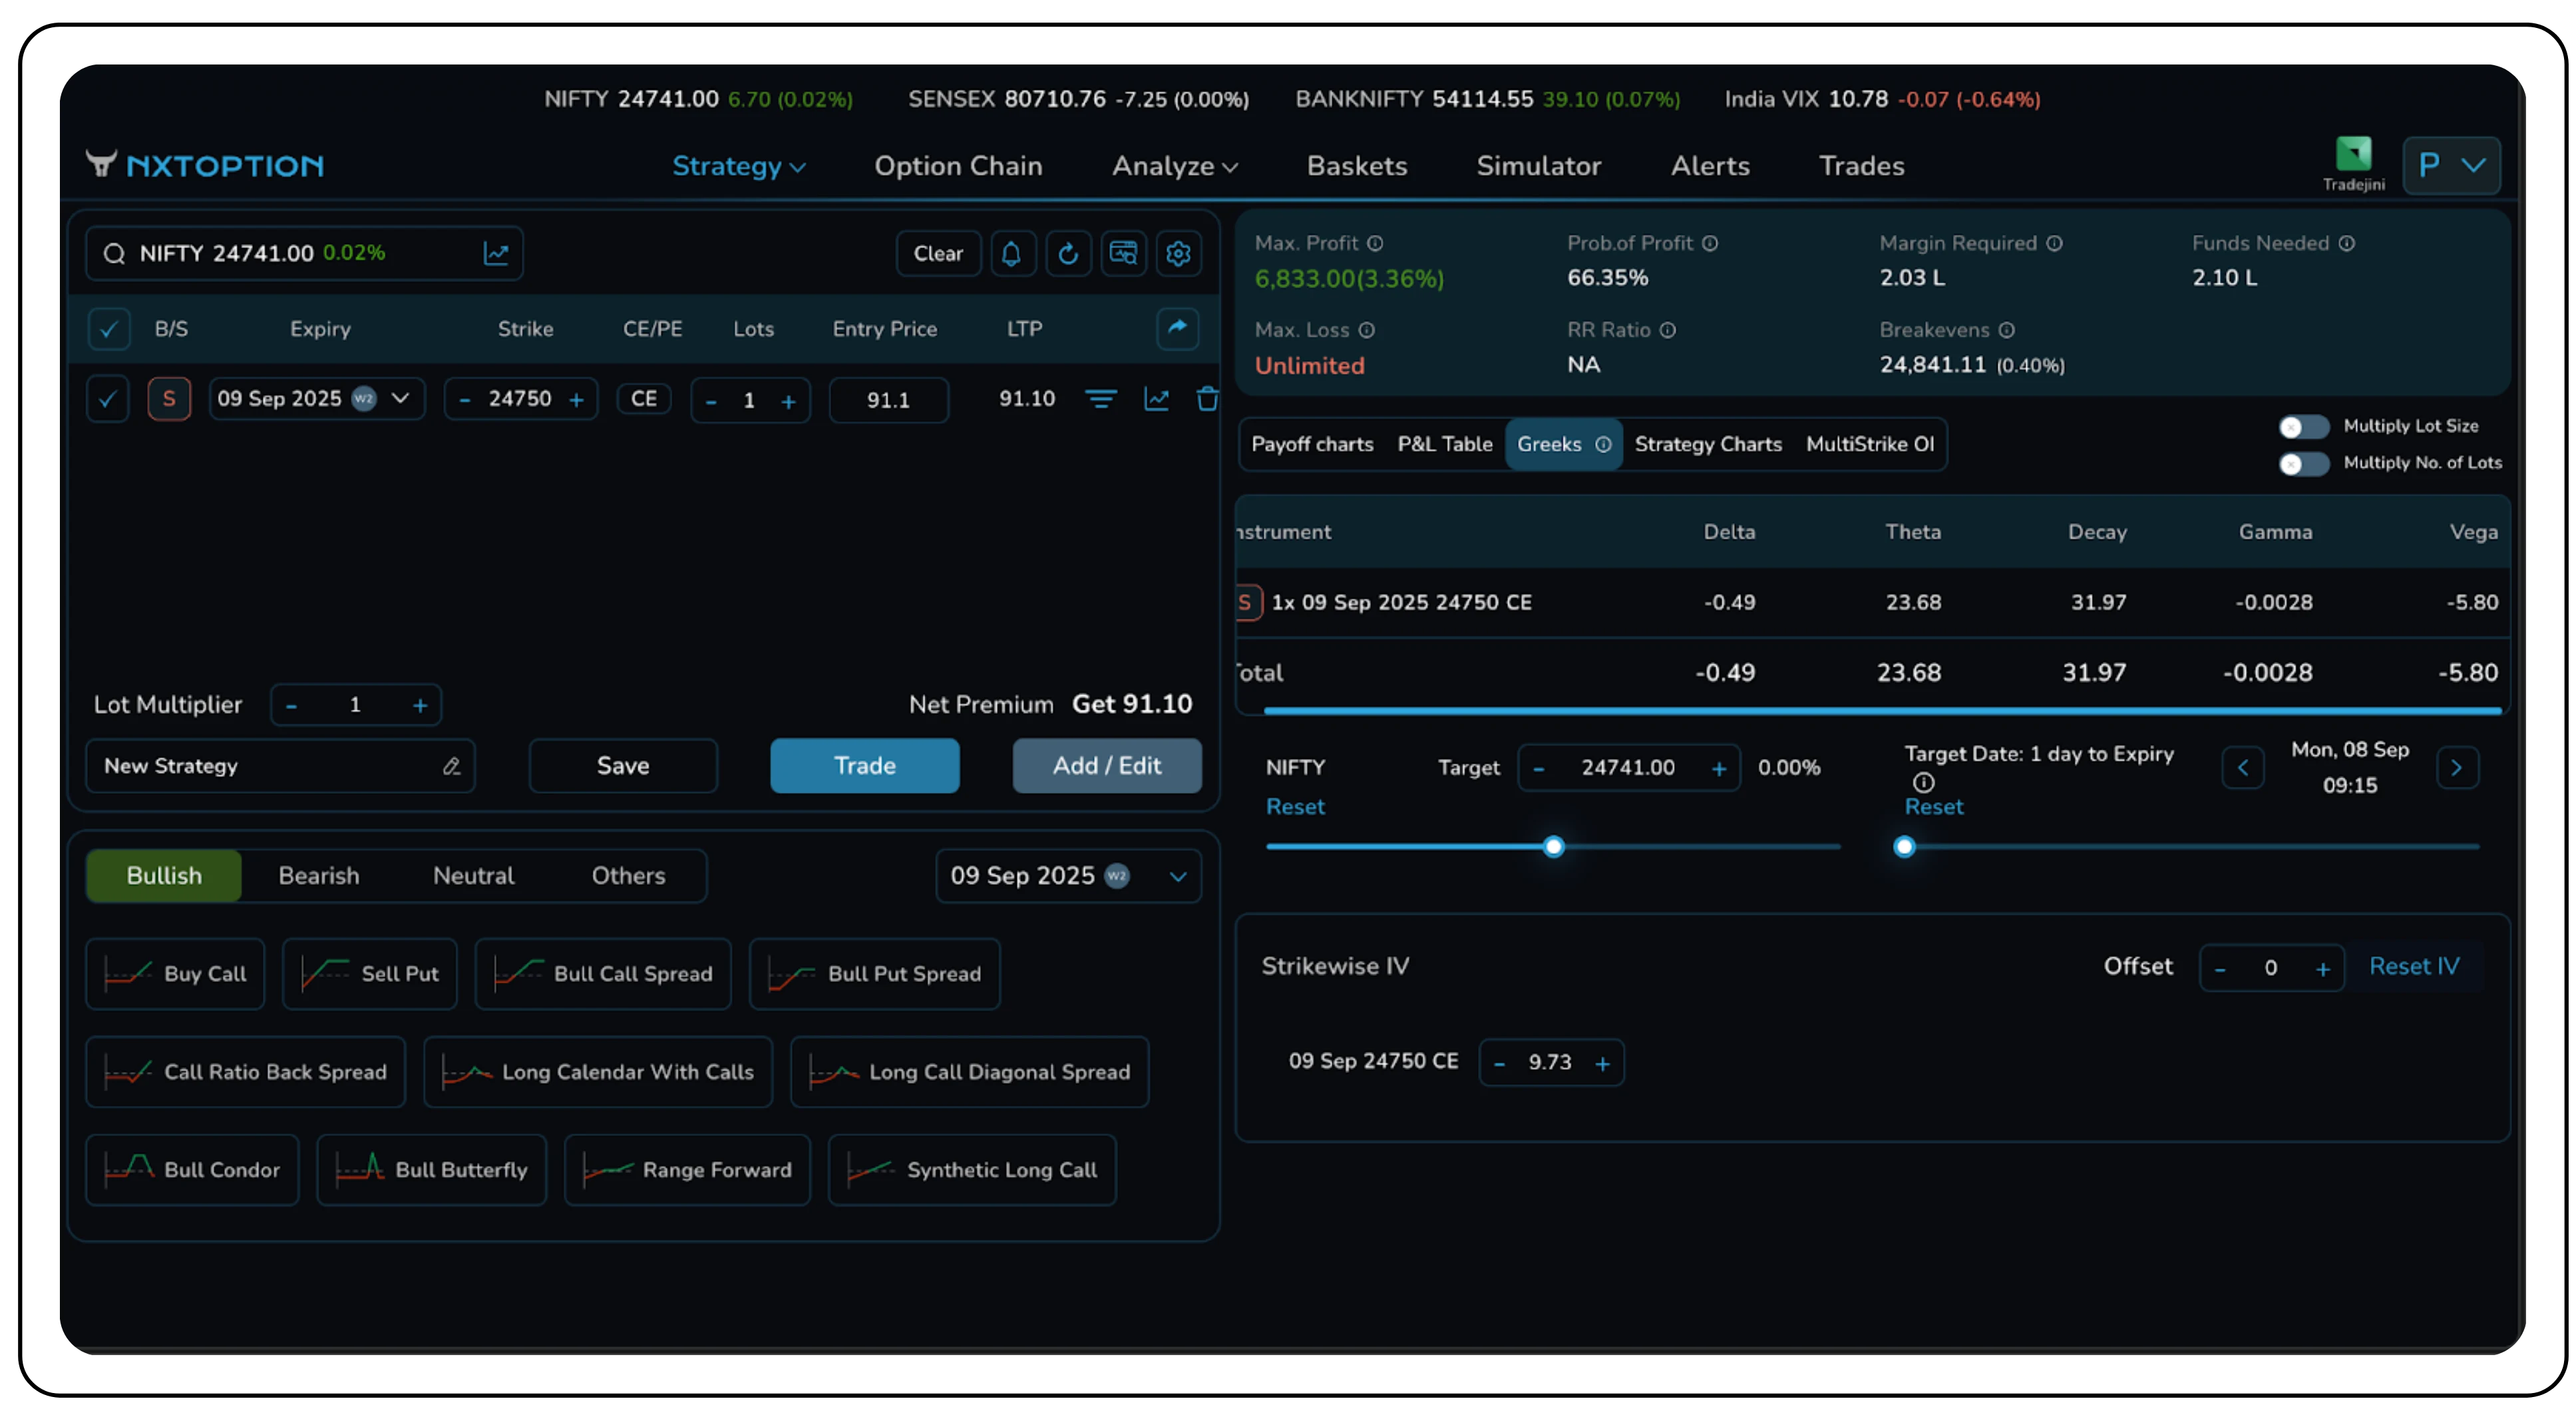
In the first image, a short call position is analyzed with the current Strikewise IV at 18.73%, generating a daily Theta of 44.2. To simulate a post-event volatility crush, a trader can manually adjust the IV down to 9.73%. As the second image shows, this single change causes the position’s Theta to drop to 23.68. This feature quantifies the direct impact of IV changes on P&L drivers, moving risk assessment from guesswork to a data-driven exercise.
Position sizing is critical in volatility strategies. The Kelly Criterion offers a theoretical sizing framework, but it must be applied conservatively given model and regime uncertainty. Hedging costs and slippage can erode returns, especially in low-liquidity or compressed-margin volatility environments.
Dynamic hedging strategies can help manage the risks inherent in volatility trading. Delta hedging neutralizes directional exposure, allowing traders to isolate volatility risk. However, hedging costs and slippage can erode profitability, particularly in high volatility environments when margins are compressed.
Market Psychology and Behavioral Considerations
Understanding the psychological drivers behind HV-IV relationships enhances trading effectiveness. Research in behavioral finance reveals systematic biases that create persistent volatility mispricings. The availability of heuristics leads traders to overweight recent dramatic events when assessing future risk, often producing elevated IV after shocks.
Anchoring bias affects how traders interpret current IV relative to recent reference points. A stock exhibiting 15% IV might seem cheap following a period of 25% readings, even if the long-term average suggests 12% as a more appropriate baseline. Nxtoption’s percentile rankings supply objective historical context that mitigates common cognitive biases.
The HV-IV relationship is the practical core of volatility trading. Historical Volatility provides a multi-horizon baseline, Implied volatility encodes the market’s forward pricing, and their systematic divergence supplies tradable edges when combined with skew, term structure, and disciplined risk rules. Implementing these ideas requires timely market scans, objective context (IVP/IVR), conservative position and sizing, and explicit tail protections. For traders who want to turn insight into execution, try Nxtoption now to access HV overlays, IVP-IVR scans, intraday and historical IV charts, and term-structure tools that translate theory into actionable trade lists. Sign up now and move from analysis to disciplined implementation.
Disclaimer: The information provided in our blogs is for informational purposes only and should not be construed as financial, investment, or trading advice. Trading and investing in the securities market carries risk. Always conduct your own research and consult with a qualified financial advisor before making any investment decisions. Past performance is not indicative of future results. Copyrighted and original content for your trading and investing needs.
© 2025 — Tradejini. All Rights Reserved.